BCA Indicators/Model
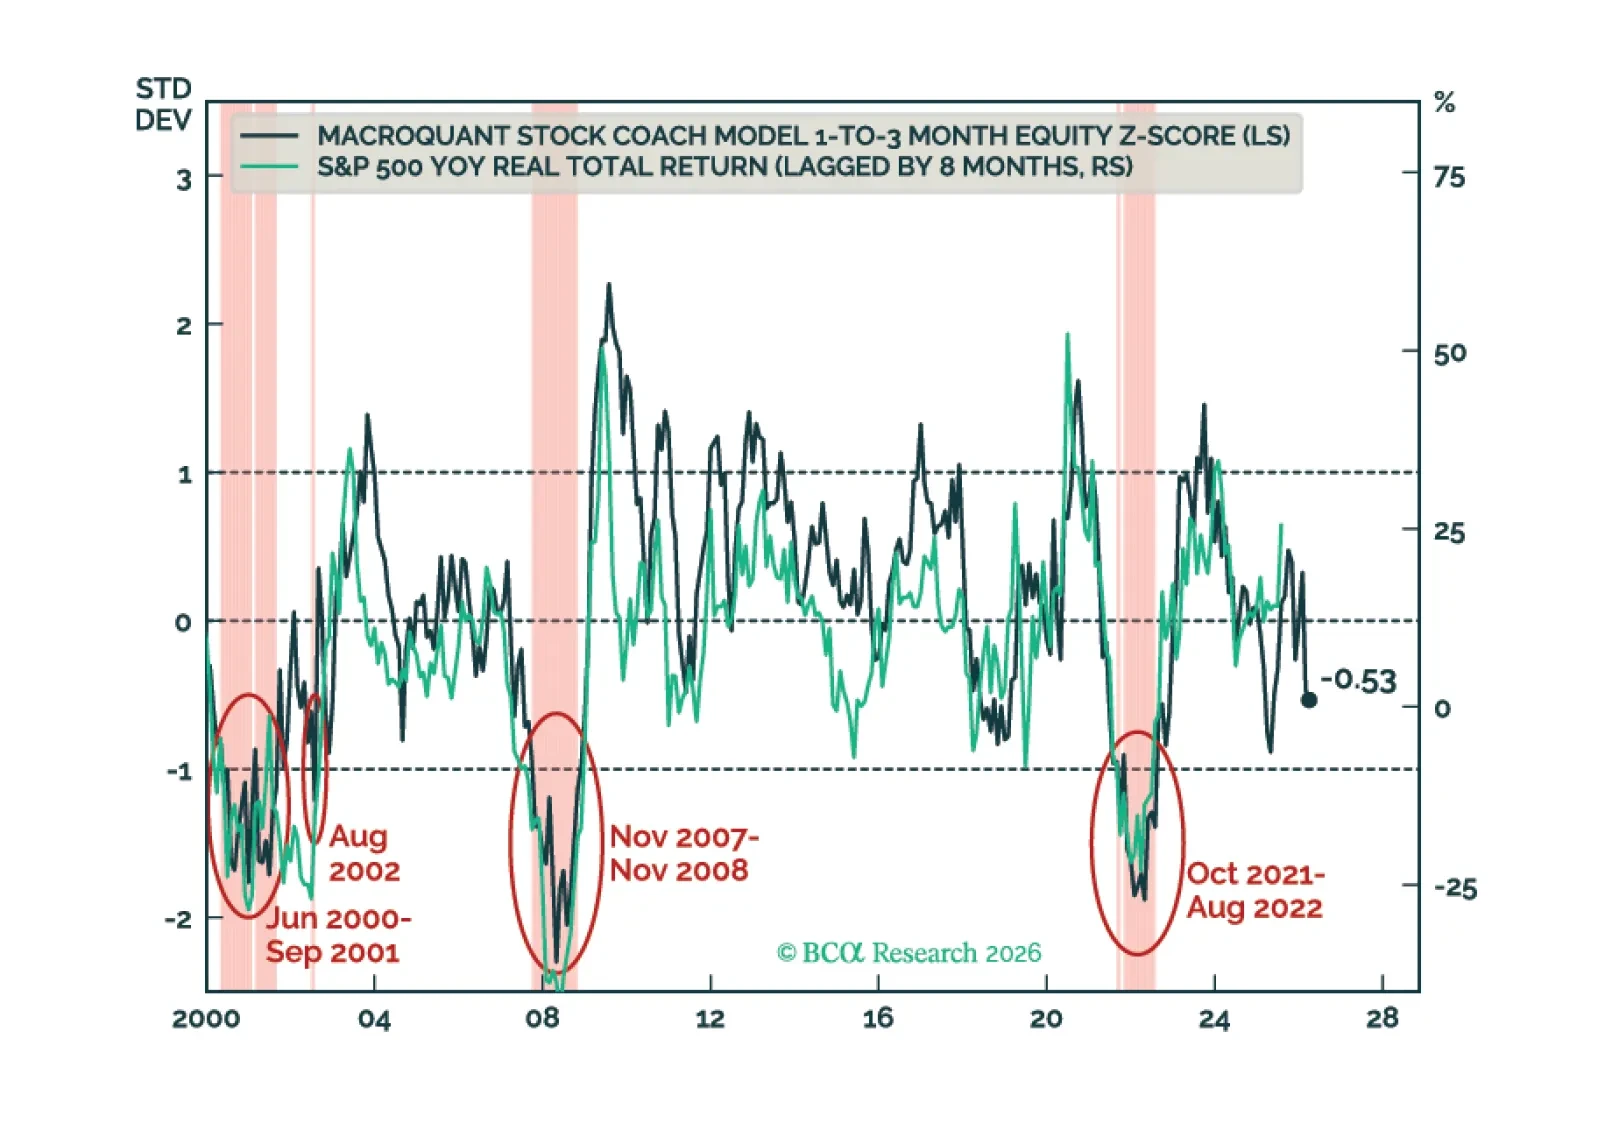
MacroQuant recommends an underweight position in equities, favors a below-benchmark duration stance in fixed-income portfolios, is neutral-to-slightly positive on the US dollar, remains neutral on gold, upgrades copper to neutral, and is very bullish on oil.
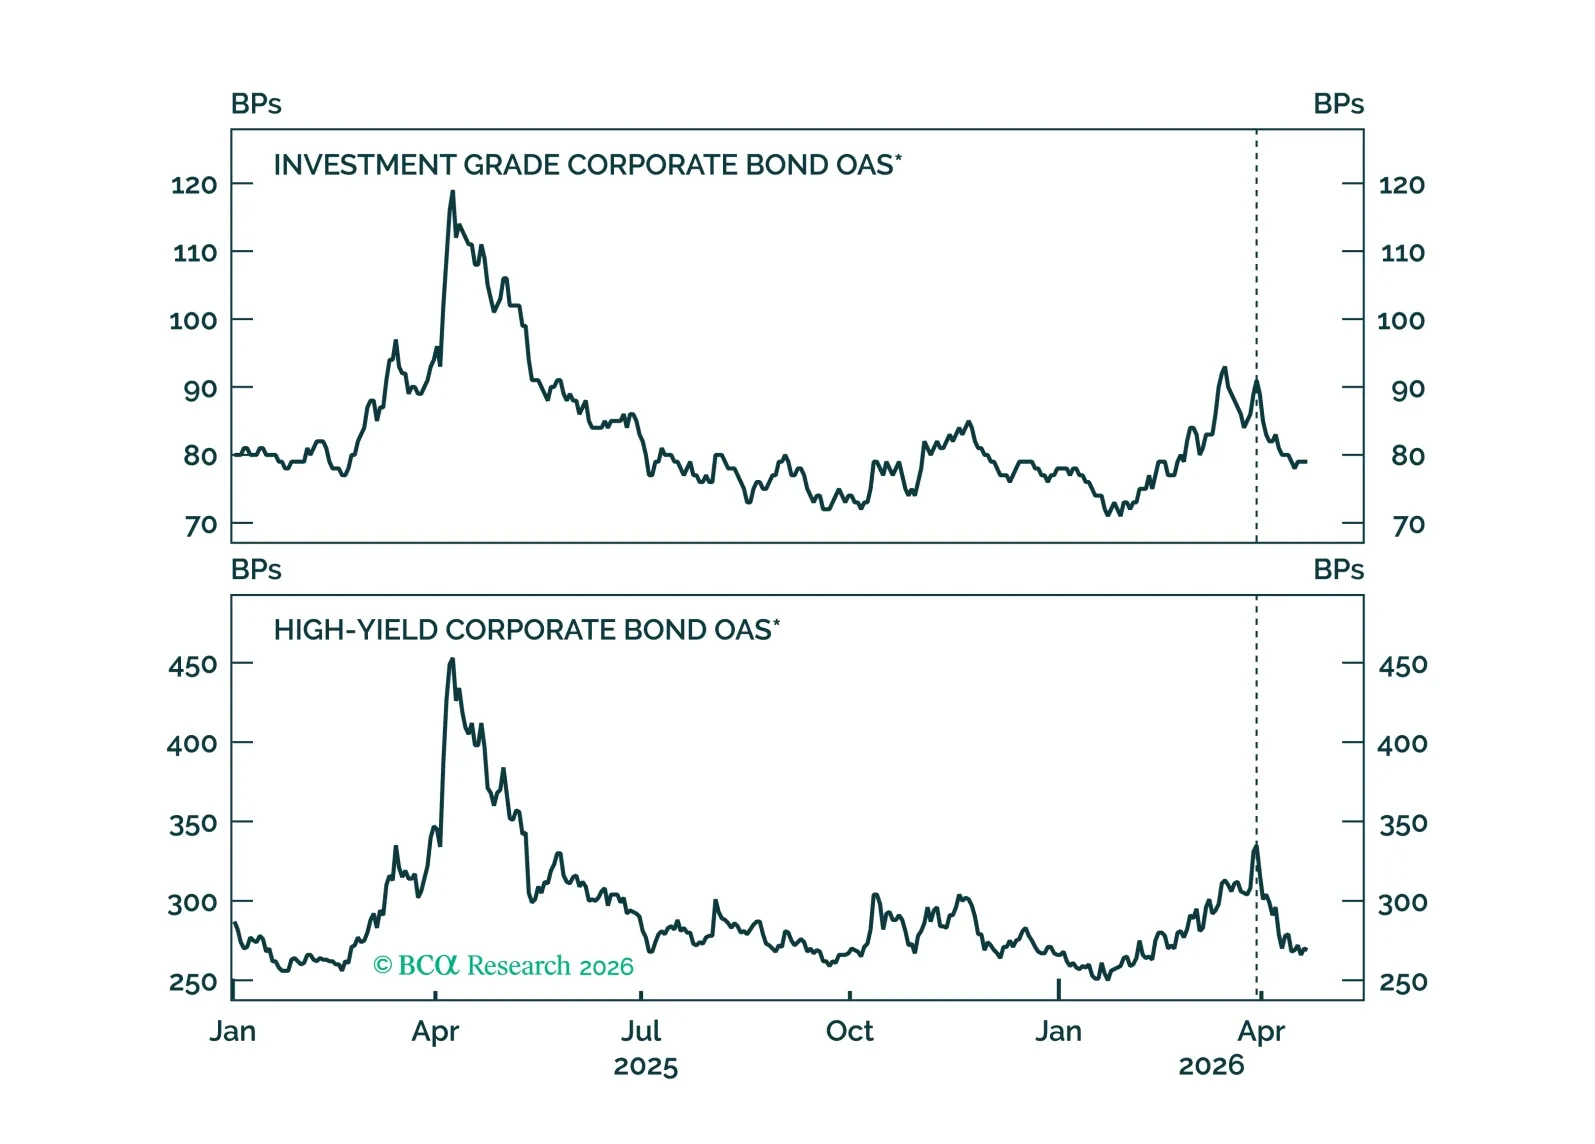
We recommend increasing exposure to spread product as the US economy transitions back into a low rate vol regime.
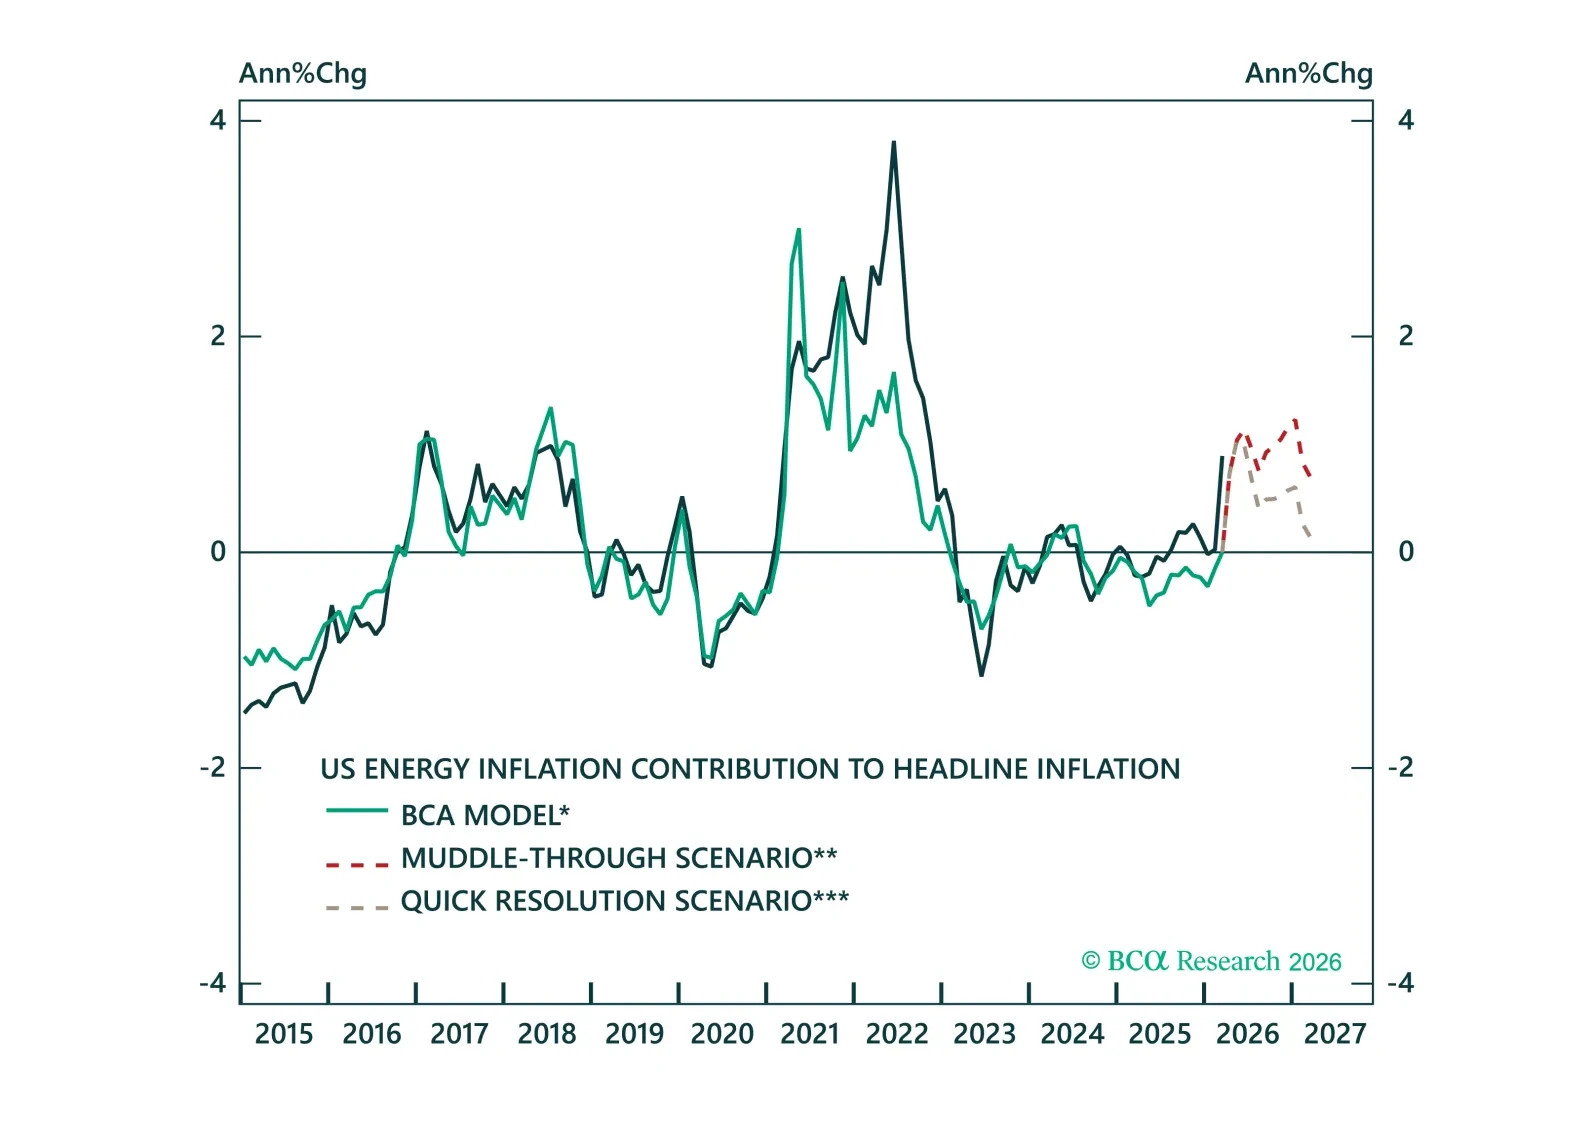
Volatility is high, but the path for yields is clearer than it looks. Across three oil scenarios, we show how policy responses shape fixed income markets and why the balance of risks still points to lower yields.
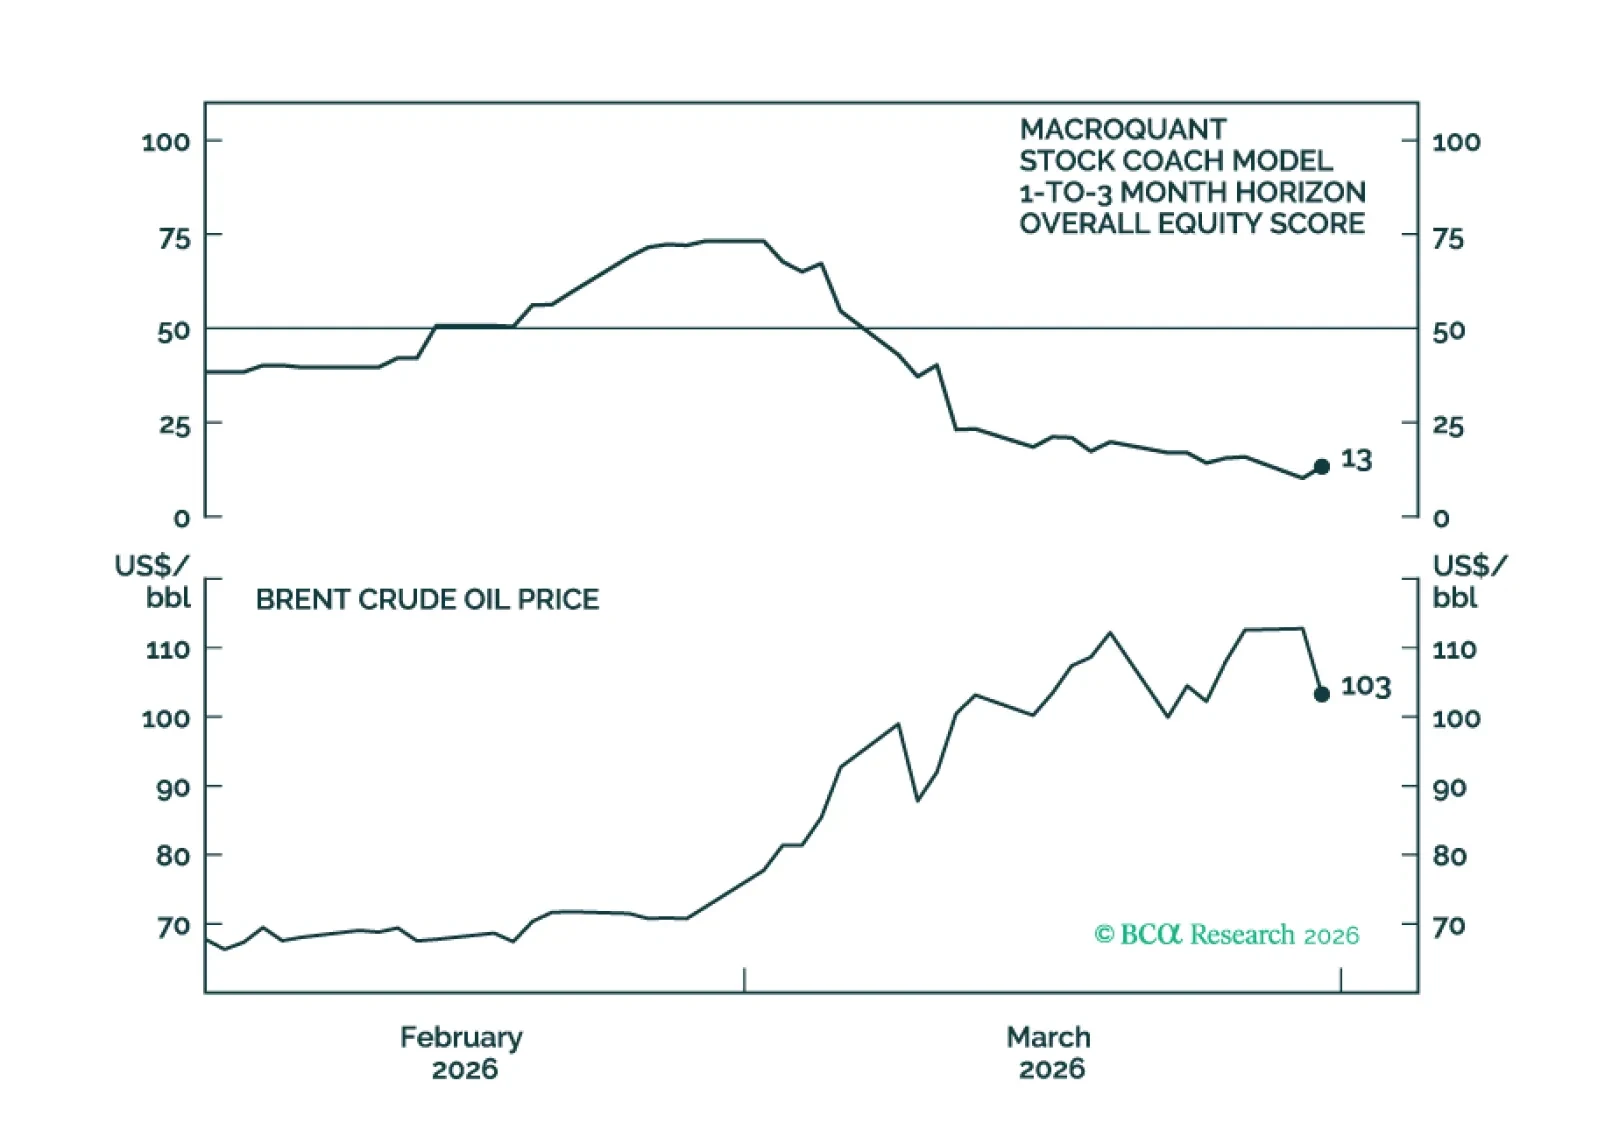
MacroQuant recommends a strong underweight position in equities, favors a below-benchmark duration stance in fixed-income portfolios, has become neutral-to-slightly positive on the US dollar, has downgraded gold to neutral and copper to a strong underweight, and is bullish on oil.
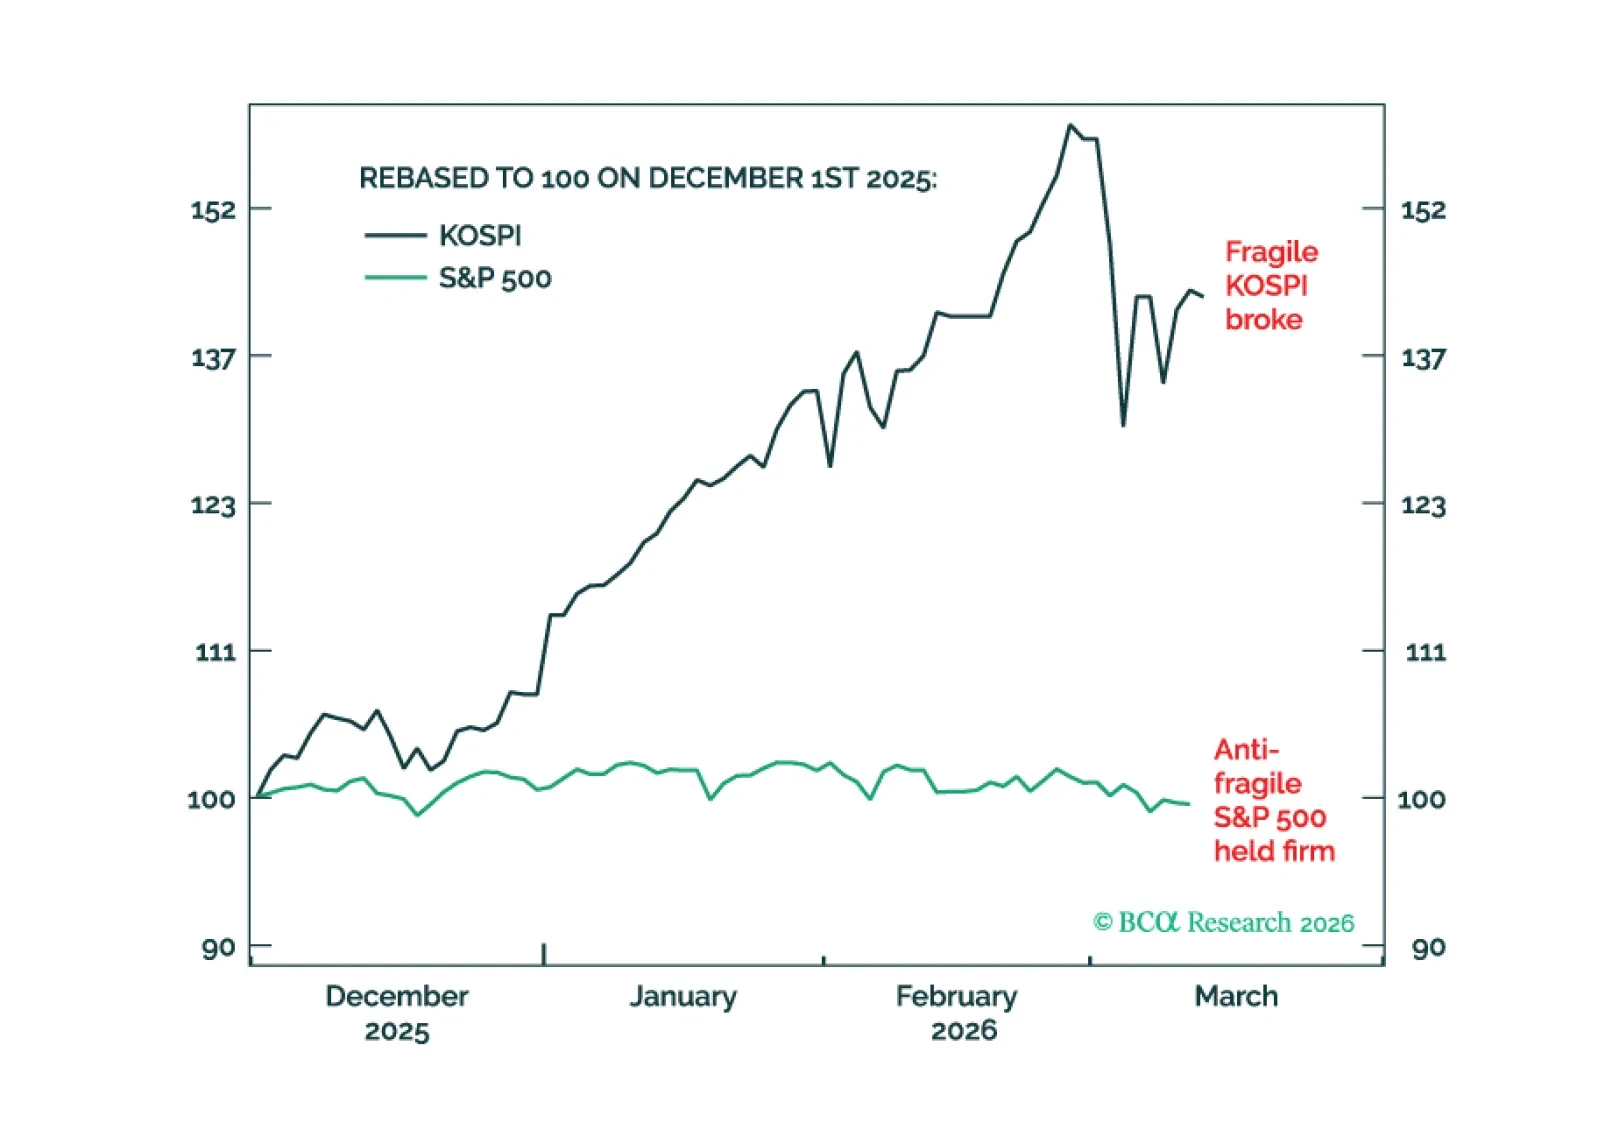
In the ongoing Middle East crisis, anti-fragile markets will remain relatively resilient while fragile markets will break. We describe how to draw the distinction. Plus, a new trade is a 50:50 combination of long USD/MXN and overweight Consumer Discretionary.
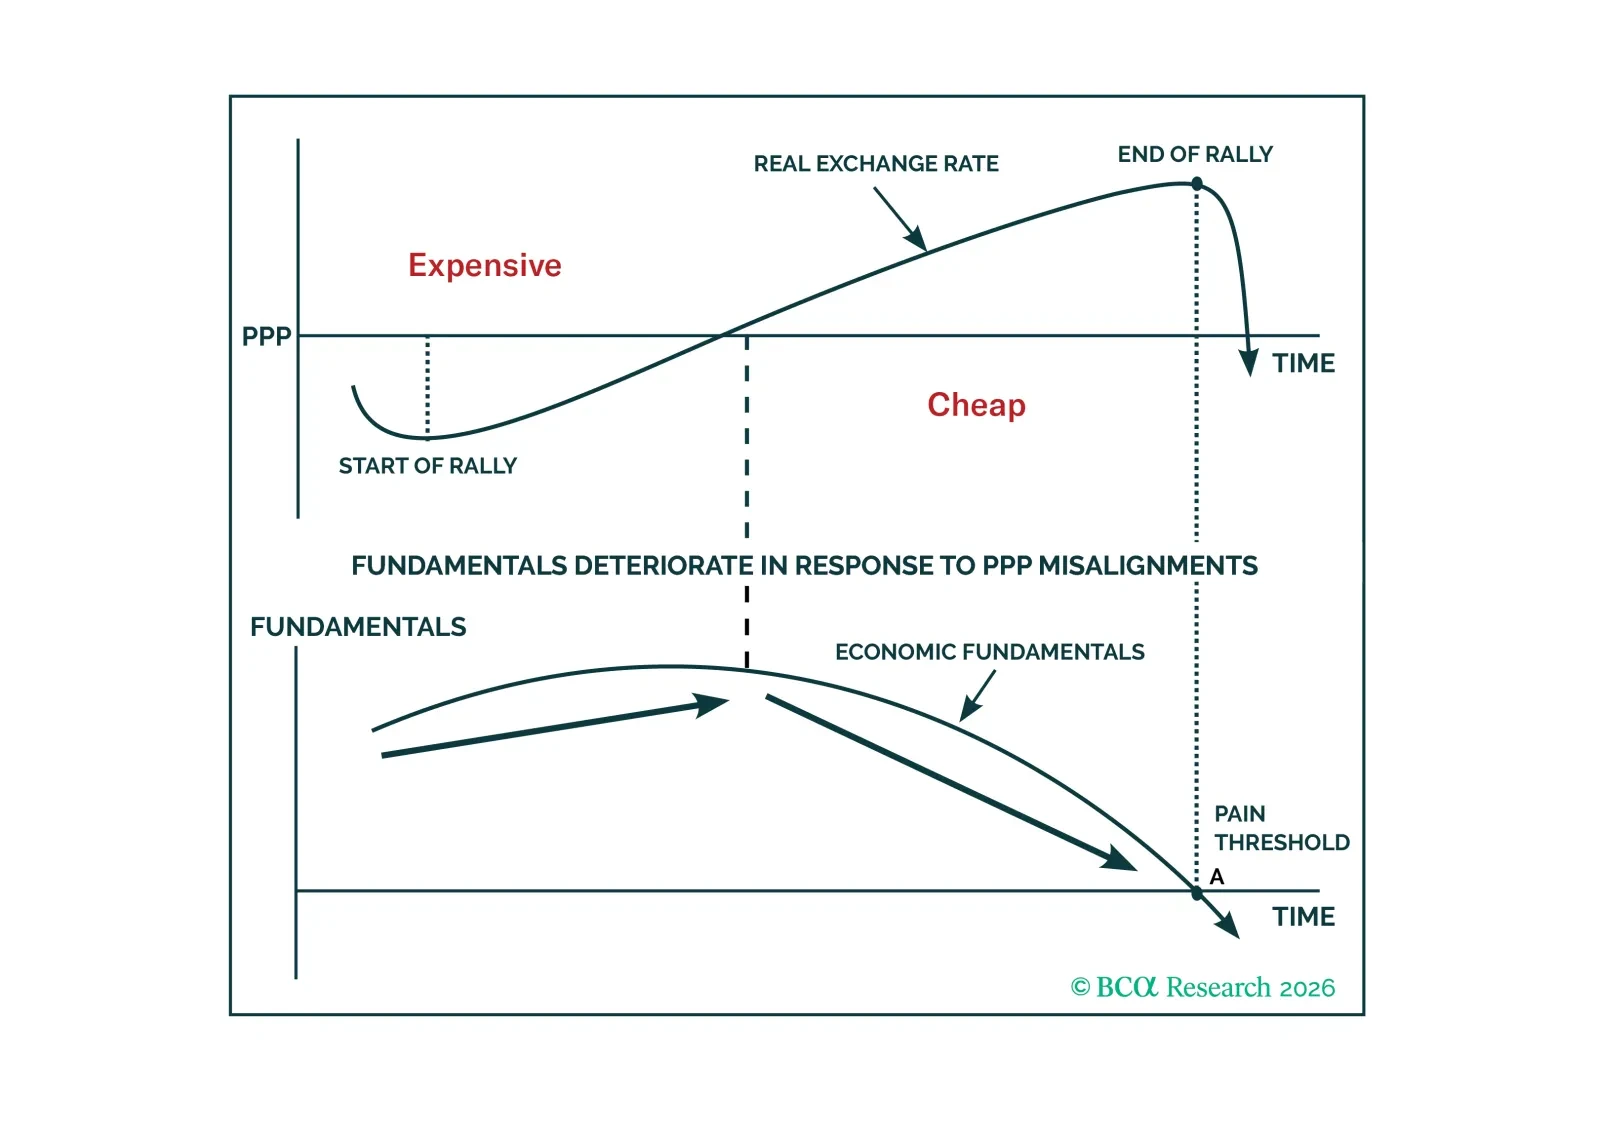
FX often looks random because no single model dominates across regimes. We lay out our long-term framework anchored in valuation, productivity, external balances, and the fiscal-monetary mix to identify when currencies are likely to mean-revert and where the long-run risk-reward is asymmetric.
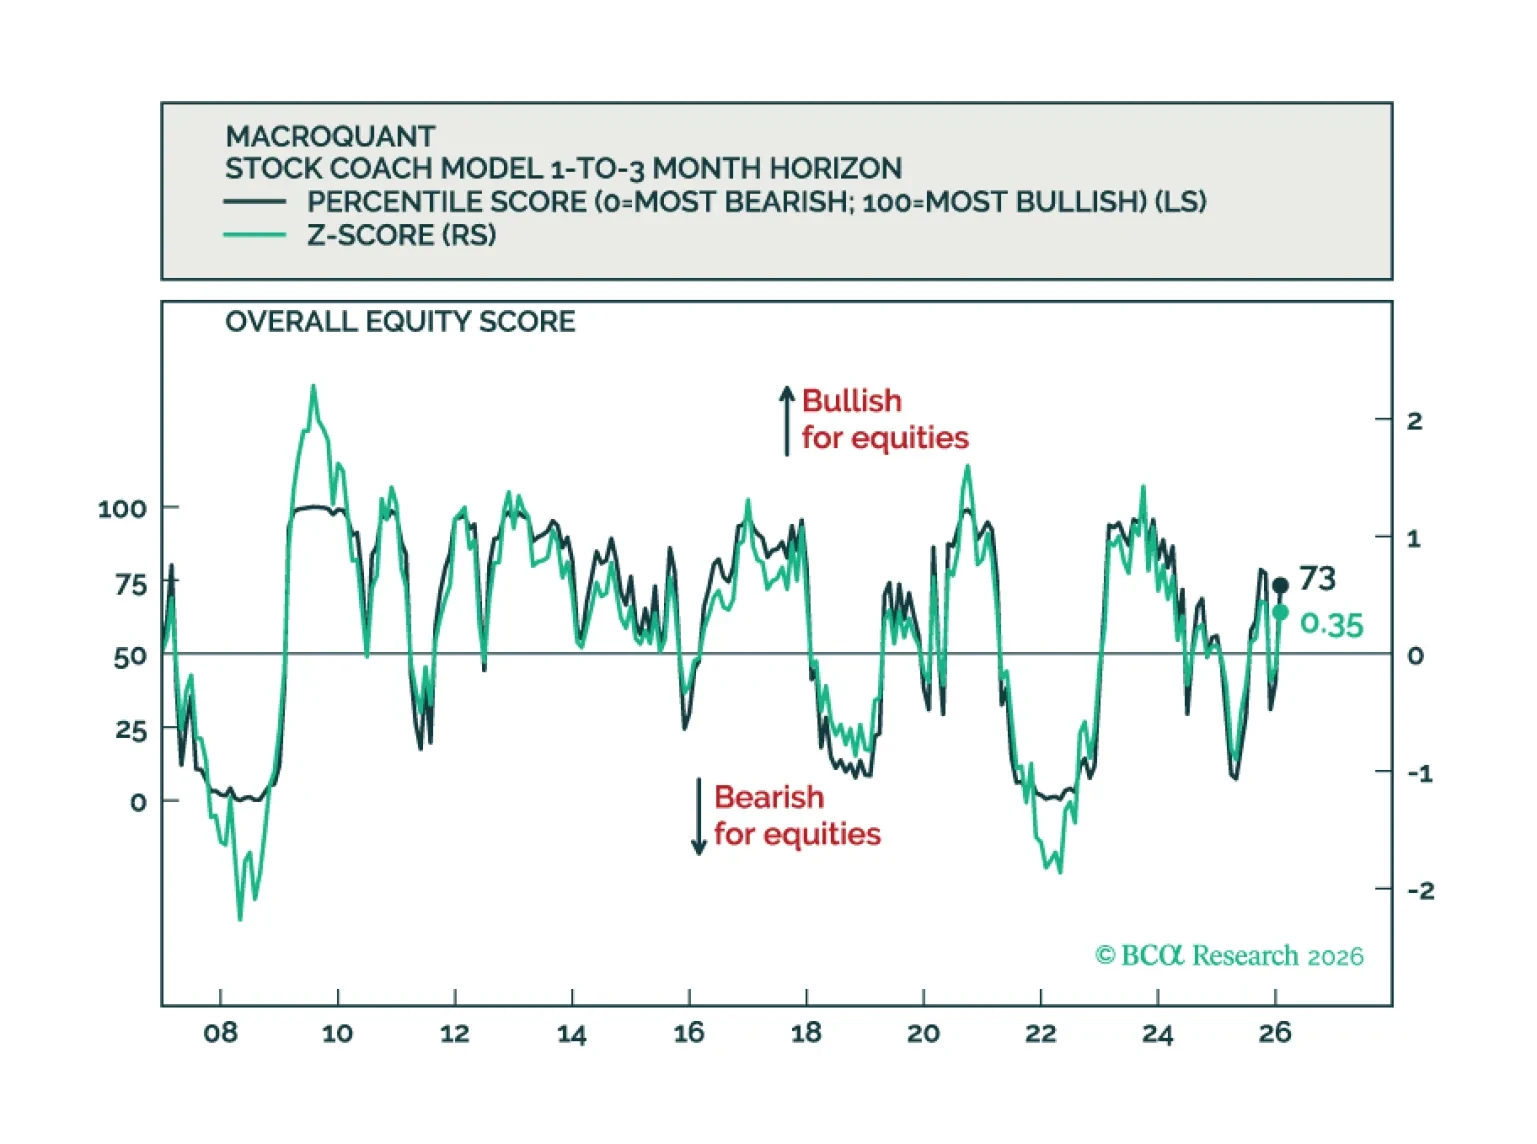
MacroQuant recommends a modest overweight position in equities, favors an above-benchmark duration stance in fixed-income portfolios, remains bearish on the US dollar, has downgraded oil to neutral, and is bullish on copper and gold.
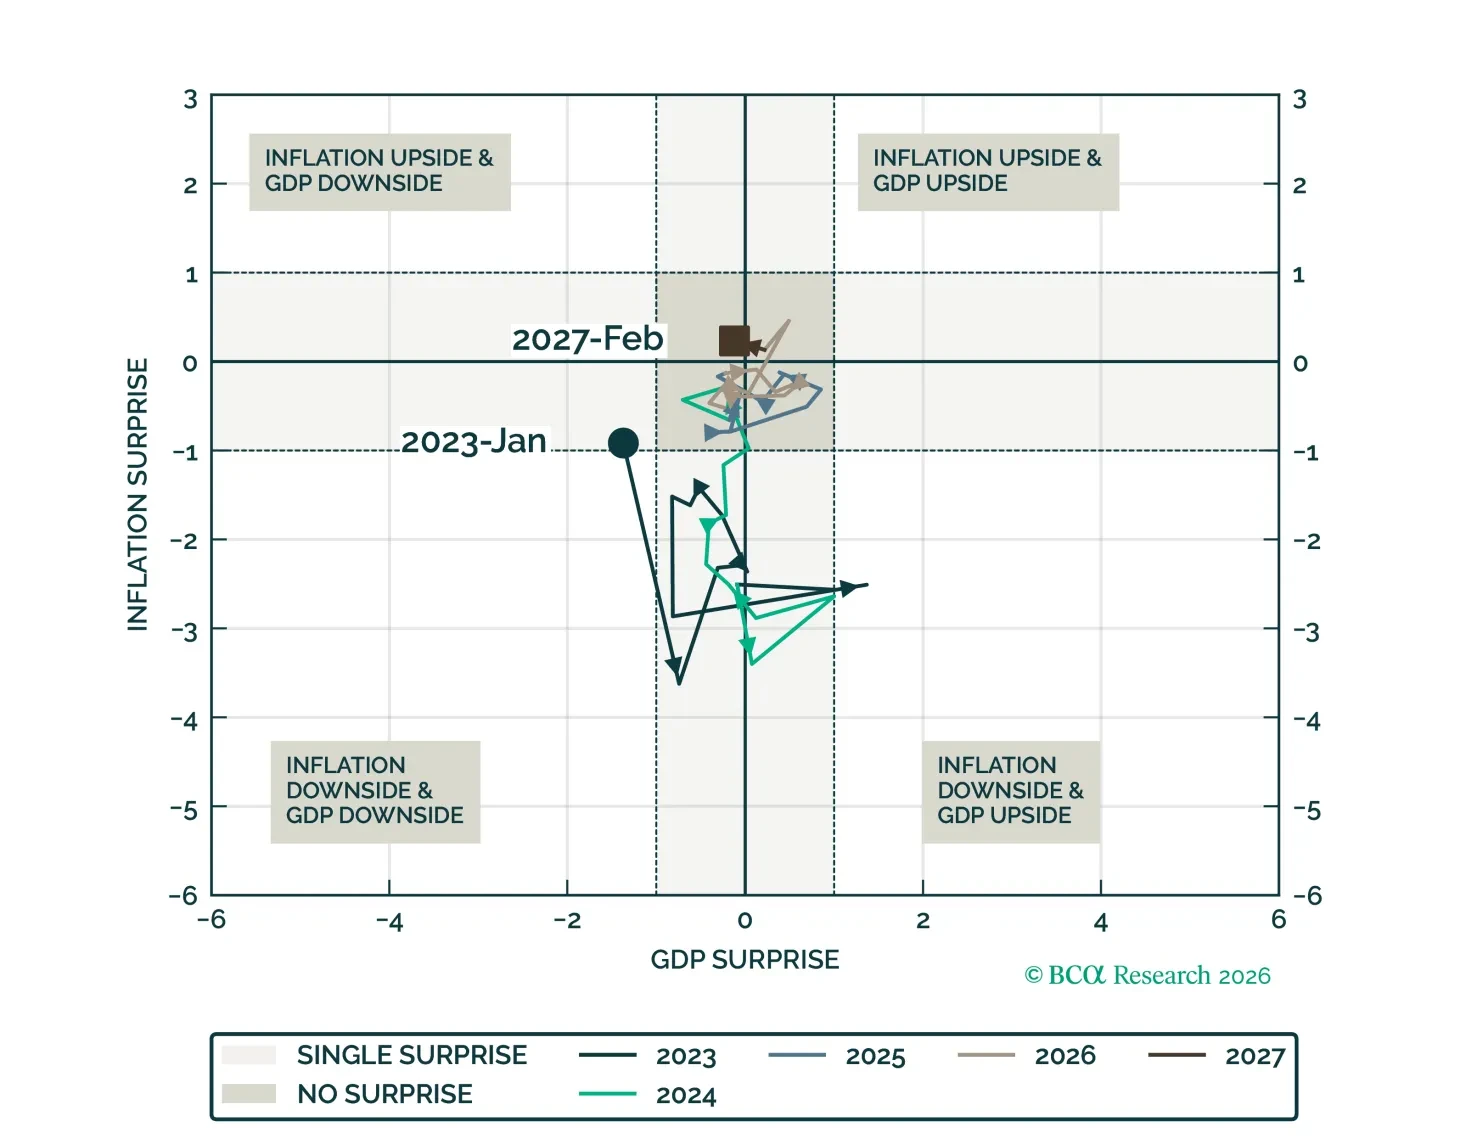
We introduce our Macro Regime Indicators (MRI), a framework for forecasting growth and inflation surprises in the US. The MRI on the economy shows no substantial mispricing in either growth or inflation over the next 12 months.
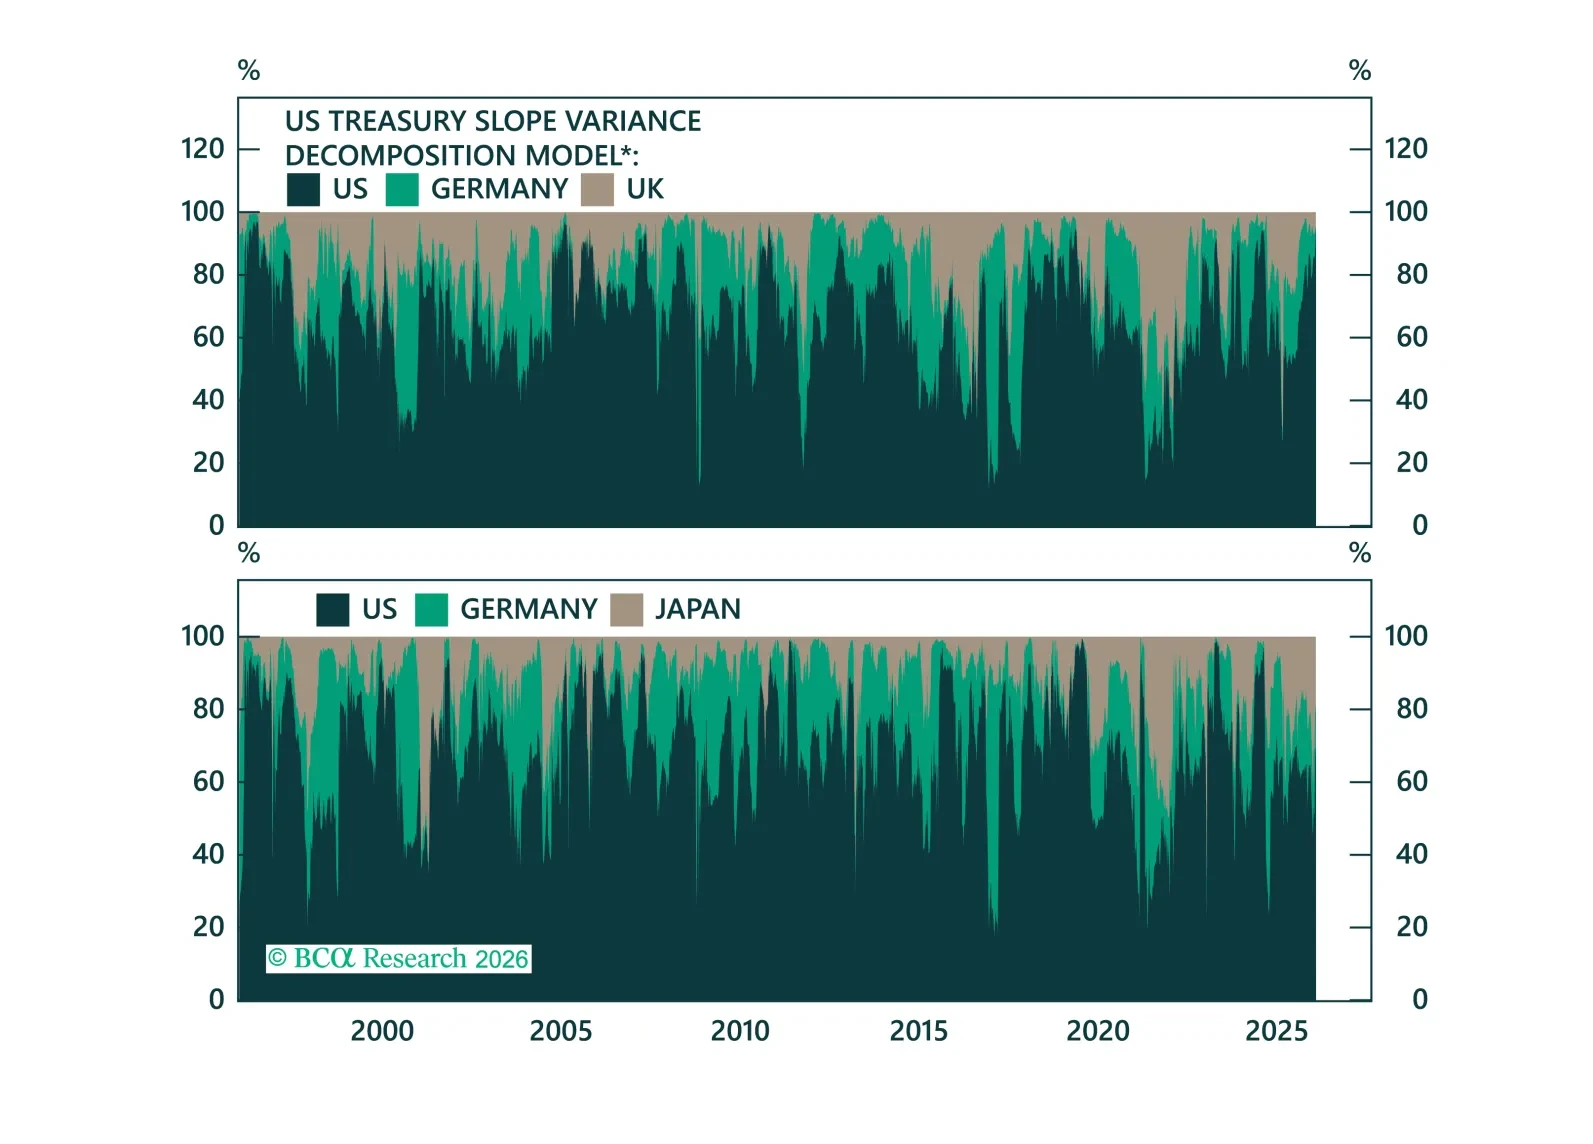
What’s driving government bond yields, and how do different bond markets impact each other? In today's Strategy Insight, we decompose yield moves into global drivers and idiosyncratic local drivers.