Equities
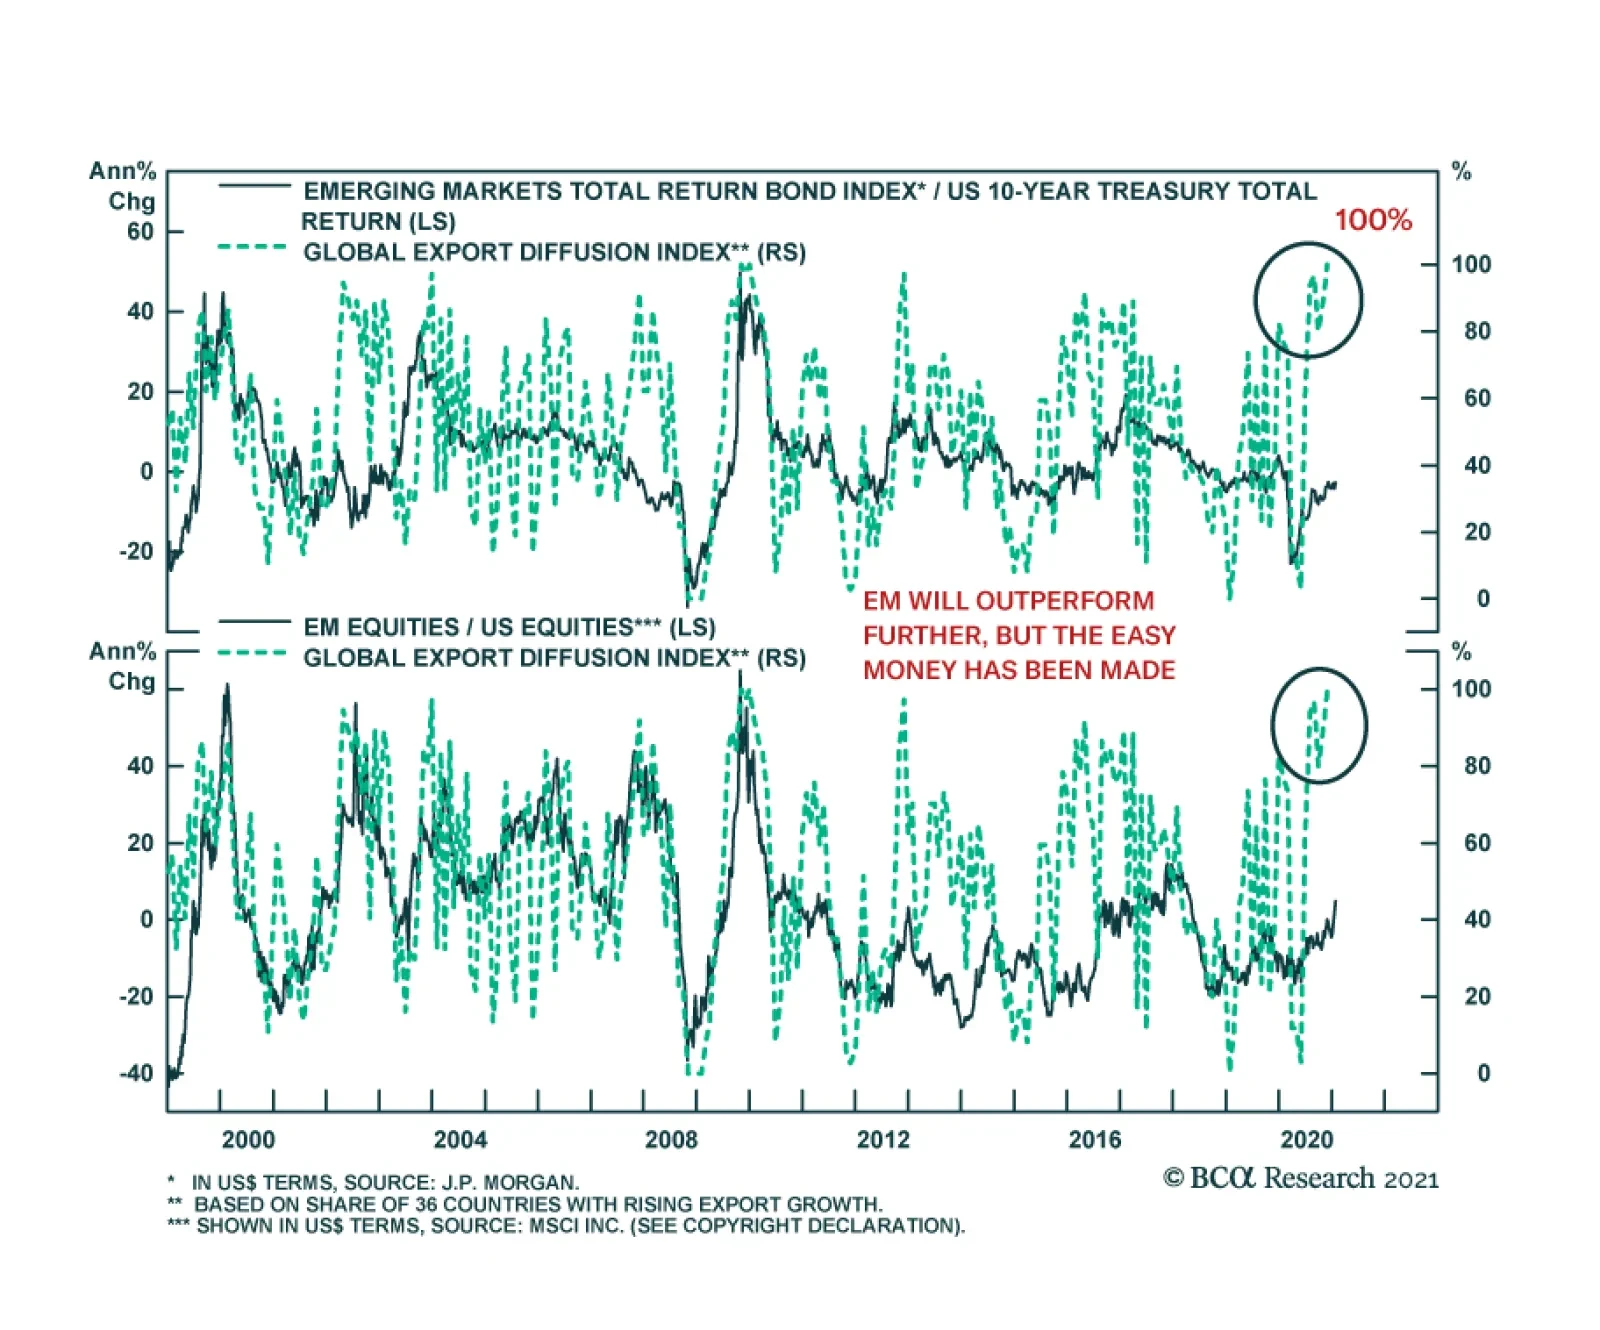
The main characteristic of EM assets remains their elevated sensitivity to global growth. The near-continuous underperformance of EM equities from late 2010 to early 2020 mostly reflected the poor performance of global economic activity over this time frame,…
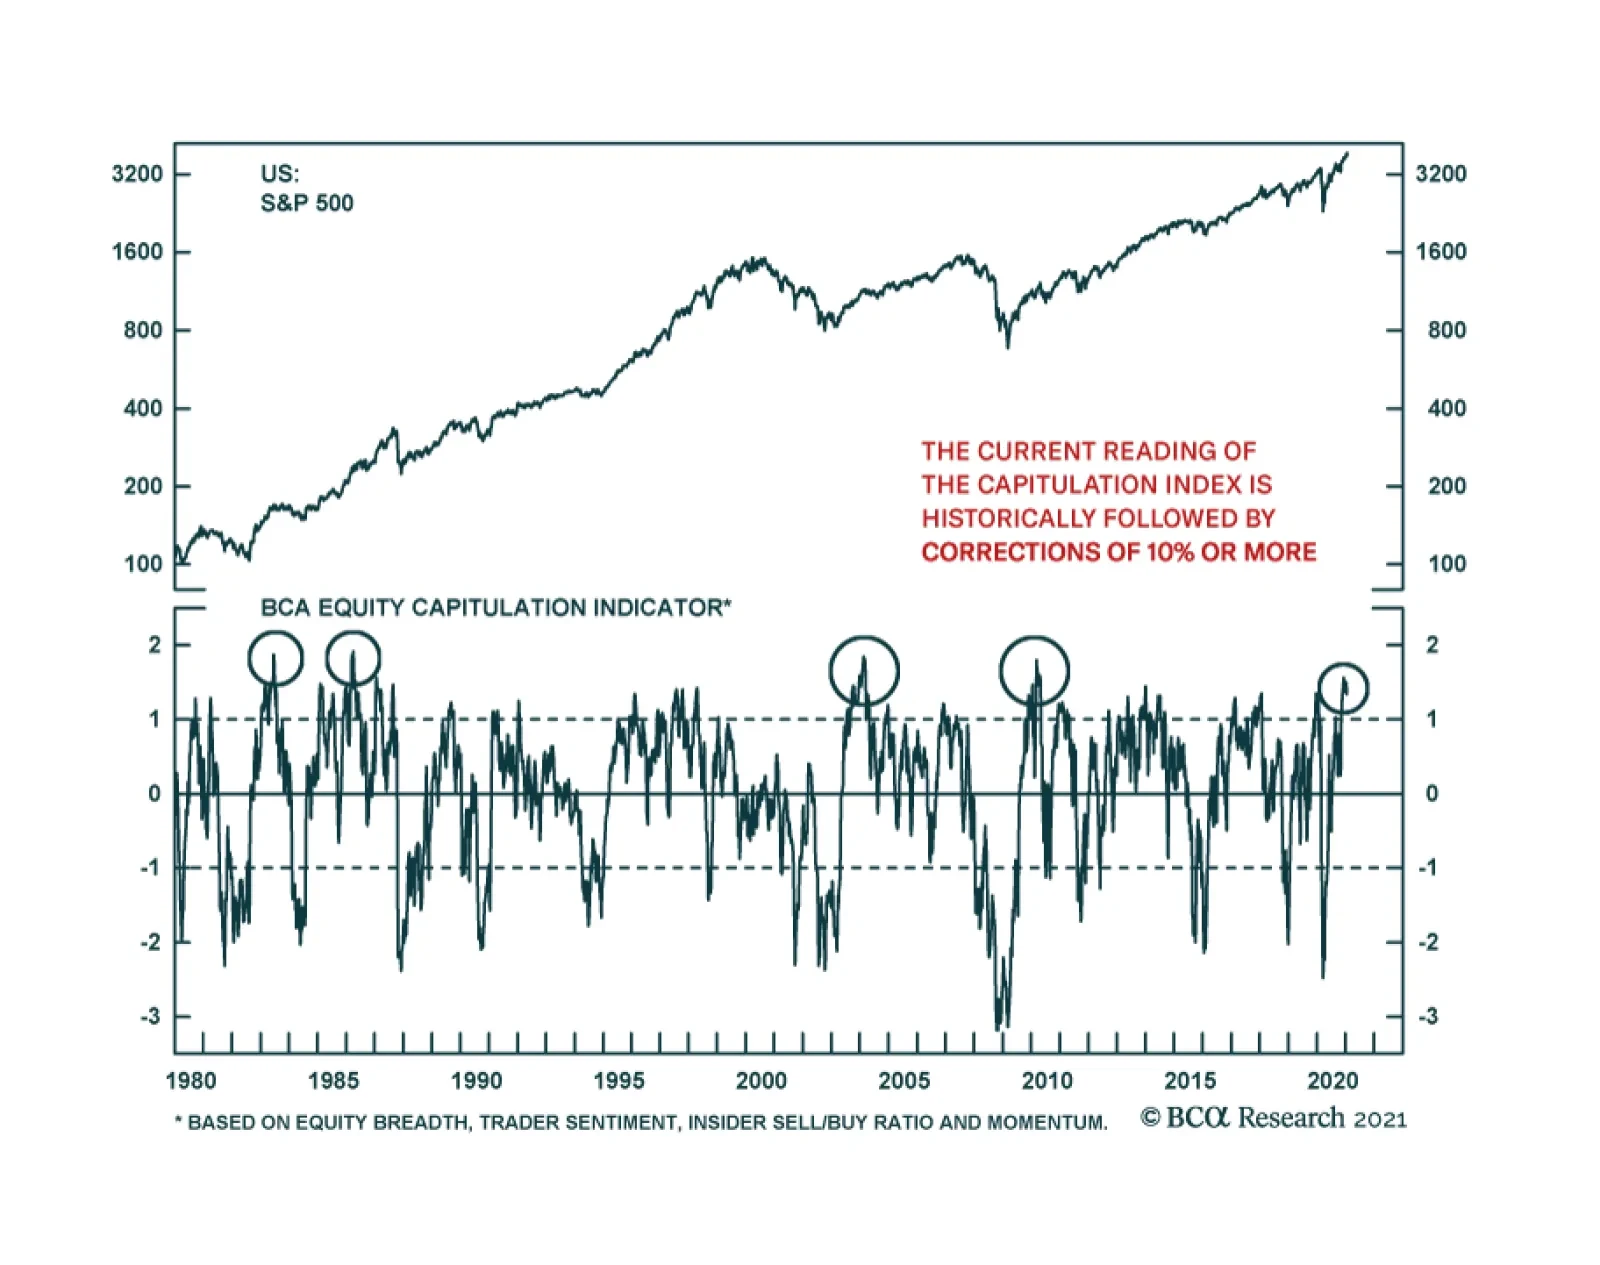
The S&P 500’s tactical vulnerability is only increasing. One of our favorite technical indicators is suggesting that the risk of a correction is very elevated. The BCA Equity Capitulation Index is at its highest level since 2010 and 2004, two readings…

Highlights Our baseline view is that inflation will increase only modestly over the next few years before accelerating in the middle of the decade. Nevertheless, the risks are skewed towards an earlier and sharper increase in inflation in the US and, to a lesser extent, in the other major economies. The first round of stimulus left US households with $1.5 trillion in excess savings, equivalent to 10% of annual consumption. The stimulus deal Congress reached in December and President Biden’s proposed package would inject an additional $300 billion per month into the economy through the end of September. According to the Congressional Budget Office, the monthly output gap is $80 billion. The true number may be even lower since the CBO’s estimate does not take into account the temporary disruption to the supply side of the economy from the pandemic or the potential disincentive to work from unusually generous unemployment benefits. In and of itself, inflation is not necessarily bad for stocks. Inflation is only bad for stocks when it triggers monetary policy tightening. The bar for the Fed to raise rates is still very high, which suggests that equities will weather a temporary burst of inflation. Nevertheless, investors should hedge against the risk that inflation will surprise on the upside. This calls for reducing duration in fixed-income portfolios to below-benchmark levels, favoring inflation-protected securities over nominal bonds, and owning more real assets such as gold and farmland. Investors should also favor value stocks over growth stocks. Commodity producers are overrepresented in value indices, while banks will benefit from steeper yield curves. The Austerians Give Up In his 2011 State Of The Union Address, President Obama declared that “Families across the country are tightening their belts and making tough decisions. The federal government should do the same.” And so the government did. According to calculations by the Brookings Institution, tighter fiscal policy subtracted about 1.2 percentage points from annual GDP growth between 2011 and 2014 (Chart 1). Chart 1US Fiscal Easing Gave Way To Fiscal Drag Soon After The Great Recession
Stagflation In A Few Months?
Stagflation In A Few Months?
The US was not alone. As Chart 2 illustrates, most advanced economies tightened fiscal policy not long after the Great Recession officially ended. In the case of countries such as Italy and Spain, the tightening came in response to market duress. In other cases such as those involving Germany and the UK, the tightening occurred against the backdrop of fairly low borrowing costs. Chart 2Fiscal Austerity Was The Favored Post-GFC Policy Prescription
Stagflation In A Few Months?
Stagflation In A Few Months?
After the pandemic struck, most governments were quick to loosen fiscal policy again (Chart 3). However, unlike ten years ago, calls for reducing the flow of red ink have been a lot more muted this time around. Chart 3Fiscal Policy In 2020: Governments Eased Significantly In Response To The Unfolding Crisis
Stagflation In A Few Months?
Stagflation In A Few Months?
Back in 2010, the OECD – the go-to source for conventional thinking on all economic matters – opined that “monetary policy must be normalized” and that “exit from exceptional fiscal support must start now, or by 2011 at the latest.” Today, the OECD admits that it made a “mistake” in pushing for austerity so soon after the recession ended. “The first lesson is to make sure governments are not tightening in the one to two years following the trough of GDP” explained Laurence Boone, the OECD’s current chief economist, to the FT earlier this month. The OECD’s change of heart partly reflects political reality – assistance for businesses and workers who lost income due to lockdowns is more palatable than bailouts for banks and for homeowners who took on more debt than they could afford. Yet, there is an important economic dimension to the policy pivot as well. The huge spike in bond yields that many pundits predicted a decade ago never materialized. Despite soaring debt levels, real bond yields in the US and most other economies are near record lows (Chart 4). Even the Italian 10-year yield stands at a mere 0.68% now that the ECB has effectively promised to backstop European governments. Chart 4Governments Enjoy Low Borrowing Costs
Governments Enjoy Low Borrowing Costs
Governments Enjoy Low Borrowing Costs
The Bondholder Who Cried Wolf Chart 5Generous Government Transfers Boosted Household Savings
Generous Government Transfers Boosted Household Savings
Generous Government Transfers Boosted Household Savings
After many false alarms, could the inflationistas get the last laugh in 2021? The idea is not entirely far-fetched. Consider the case of the US. Chart 5 shows that US households are sitting on $1.5 trillion of excess savings – equivalent to 10% of annual consumption. The amount of dry powder US households have at their disposal will only get larger. Taken together, the stimulus deal Congress reached in December and President Biden’s proposed fiscal package would inject an average of $300 billion per month into the economy through the end of September. Republicans and centrist Democrats in the Senate may force Biden to winnow down his stimulus plans to something closer to $1 trillion. Nevertheless, this still would provide about $200 billion in incremental monthly support. Official estimates made by the Congressional Budget Office last summer imply that the monthly output gap – the difference between what the economy is capable of producing and what it actually is producing – is currently only $80 billion. In fact, the true output gap may be even lower than this. First, GDP has recovered more rapidly than the CBO had projected. Second, official estimates of the output gap do not control for the fact that part of the economy’s productive capacity – certain retail establishments, hotels, airlines, etc. – has been rendered either fully or partly inoperative due to the pandemic. Third, official estimates also do not account for the fact that generous jobless benefits may have made some workers less eager to find work, thus temporarily raising the natural rate of unemployment. Inflation: Movin’ On Up If the demand for goods and services exceeds supply, prices are likely to go up. How much will they rise? In the near term, inflation is certain to increase from very low levels, if only due to base effects. As my colleague Ryan Swift has noted, both core PCE and core CPI inflation will soon spike above 2% on an annualized basis even if consumer prices rise by a meager 0.15% per month, as the deflationary March and April 2020 data points fall out of the rolling 12-month average (Chart 6). Looking beyond the next few months, the trajectory for inflation will depend on the degree to which the economy overheats. In some categories, there is already evidence of excess demand. US core goods inflation is running at 1.6%, the highest level since 2012. The ISM manufacturing Prices Paid index points to further upside for goods inflation. Soaring commodity prices tell a similar tale (Chart 7). Chart 6Base Effects Will Push Inflation Higher
Base Effects Will Push Inflation Higher
Base Effects Will Push Inflation Higher
Chart 7Further Upside For Goods Inflation And Commodity Prices
Further Upside For Goods Inflation And Commodity Prices
Further Upside For Goods Inflation And Commodity Prices
While services inflation has been more downbeat, that could change as the labor market tightens (Chart 8). Housing inflation is also set to bottom. The National Multifamily Housing Council’s Apartment Market Tightness Index remains in contractionary territory. However, the closely-linked Sales Volume Index recently jumped to the highest level in nine years (Chart 9). Sales volume led the Market Tightness Index coming out of the last recession. If that happens again, shelter inflation should creep up. Chart 8A Pickup In Services Inflation Is Awaiting A Tighter Labor Market
A Pickup In Services Inflation Is Awaiting A Tighter Labor Market
A Pickup In Services Inflation Is Awaiting A Tighter Labor Market
Chart 9Shelter Inflation Could Bottom Soon
Shelter Inflation Could Bottom Soon
Shelter Inflation Could Bottom Soon
A Self-Fulfilling Prophecy? Like most macroeconomic phenomena, inflation is subject to feedback loops. If households expect prices to increase initially but then fall back down once the stimulus has lapsed, they may defer some of their spending until prices return to normal. This could prevent prices from rising in the first place. In contrast, if households expect prices to rise and then keep rising, they may try to expedite their purchases. This would supercharge spending. One can see that there is a self-fulfilling process at work. If households expect prices to remain broadly stable, then they will remain broadly stable. If households expect prices to rise a lot, then they will rise a lot. Imagine last year’s Great Toilet Paper Shortage but on an economy-wide scale. A similar self-fulfilling process works at the firm level. If firms expect prices to rise only briefly, they will try to run down their inventories as quickly as possible to take advantage of temporarily high profit margins. The additional supply will limit any increase in prices. In contrast, if firms expect selling prices to keep rising, they may hoard inventory to take advantage of future higher prices. Likewise, firms may be reluctant to raise wages in response to a temporary overheating of the economy for fear that this would lock in a higher cost structure. In contrast, firms would be more willing to raise wages if they thought that prices would keep rising. Hence, the expectation of rising inflation could trigger a price-wage spiral. Lifting The Anchor The inflationary scenario described above could play out if long-term inflation expectations become unmoored. Central banks have invested a lot of effort in trying to anchor inflation expectations at around 2%. To the extent that they have fallen short of their goal, it is because prices have risen less than desired (Chart 10). Chart 10Central Banks Have Missed Their Inflation Targets
Stagflation In A Few Months?
Stagflation In A Few Months?
To remedy the shortfall in inflation, the Fed has pledged to allow inflation to rise above 2% for a few years, with the aim of bringing the price level back to its long-term target trend. The risk is that such an inflation overshoot happens sooner and is more pronounced than policymakers desire. Christina Romer, the former chair of the Council of Economic Advisers in the Obama administration, famously wrote a paper entitled “It Takes A Regime Shift.” Using the example of Roosevelt’s decision to take the US off the gold standard in 1933, she argued that major monetary policy decisions could permanently jolt inflation expectations. It is too early to say whether the Fed’s new inflation-targeting framework will go down in history as a “regime shift.” What one can say with more confidence is that the rollout of this framework is coming at a tumultuous time. Policymakers and business leaders routinely talk about the “The Great Reset” – the notion that the pandemic provides a once-in-a-lifetime opportunity to shift policy in a new, rather curious, direction. Central bankers better hope that inflation expectations are not reset too much. Investment Implications Our baseline view is that inflation will increase only modestly over the next few years before accelerating in the middle of the decade. Nevertheless, as highlighted in this week’s report, the risks are skewed towards an earlier and sharper increase in inflation in the US and, to a lesser extent, in the other major economies. The spectre of higher inflation is unsettling to many investors. However, in and of itself, inflation is not necessarily bad for stocks. Inflation is only bad for stocks when it triggers monetary policy tightening. In the absence of rate hikes, rising inflation would push real rates lower. This would be quite good for stocks, as the experience of the past nine months demonstrates (Chart 11). As noted above, the bar for the Fed to withdraw monetary support is fairly high. This suggests that rising inflation is unlikely to derail the bull market in stocks. Of course, if both actual inflation and inflation expectations were to jump too much, the Fed would have to intervene. With that in mind, investors should position their portfolios to withstand rising inflation. This calls for reducing duration in fixed-income portfolios to below-benchmark levels, favoring inflation-protected securities over nominal bonds, and owning more real assets such as gold and farmland. Chart 11Lower Real Yields Have Lifted Equity Prices
Lower Real Yields Have Lifted Equity Prices
Lower Real Yields Have Lifted Equity Prices
Chart 12Bank Stocks Tend To Outperform When Inflation Expectations And Bond Yields Are Rising
Bank Stocks Tend To Outperform When Inflation Expectations And Bond Yields Are Rising
Bank Stocks Tend To Outperform When Inflation Expectations And Bond Yields Are Rising
Investors should also favor value stocks over growth stocks. Commodity producers are overrepresented in value indices, and would benefit from rising inflation. Banks are also overrepresented in value indices. Chart 12 shows that banks tend to outperform when inflation expectations and long-term bond yields are rising. Peter Berezin Chief Global Strategist peterb@bcaresearch.com Global Investment Strategy View Matrix
Stagflation In A Few Months?
Stagflation In A Few Months?
Special Trade Recommendations This table provides trade recommendations that may not be adequately represented in the matrix on the preceding page.
Stagflation In A Few Months?
Stagflation In A Few Months?
Current MacroQuant Model Scores
Stagflation In A Few Months?
Stagflation In A Few Months?
Obey The Rolling Stop And Crystallize Gains In The “Back To Work” Trade
Obey The Rolling Stop And Crystallize Gains In The “Back To Work” Trade
In the September 8thStrategy Report we first created the “Back To Work” basket and recommended investors to gain exposure to the reopening trade by initiating a long “Back To Work”/short “COVID-19 Winners” pair trade. More recently, and in light of the handsome gains that this trade has produced, we instituted a 5% rolling stop in order to protect profits. Yesterday, our stop was triggered compelling us to crystallize 21.5% in gains since inception. Not only did this long/short trade serve its purpose by capturing the economic reopening and vaccine related rollout euphoria, but it also outperformed the market by 700bps as the SPX rose only by 14.5% since September 8th. Bottom Line: Lock in 21.5% gains in the long “Back-To Work”/short “COVID-19 Winners” pair trade since the early-September inception.
Highlights Chinese equities have rallied enthusiastically since the COVID-19 outbreak and are now exposed to underlying political and geopolitical risks. Xi Jinping’s intention is to push forward reform and restructuring, creating a significant risk of policy overtightening over the coming two years. In the first half of 2021, the lingering pandemic and fragile global environment suggest that overtightening will be avoided. But the risk will persist throughout the year. Beijing’s fourteenth five-year plan and new focus on import substitution will exacerbate growing distrust with the US. We still doubt that the Biden administration will reduce tensions substantially or for very long. Chinese equities are vulnerable to a near-term correction. The renminbi is at fair value. Go long Chinese government bonds on the basis that political and geopolitical risks are now underrated again. Feature The financial community tends to view China’s political leadership as nearly infallible, handling each new crisis with aplomb. In 2013-15 Chinese leaders avoided a hard landing amid financial turmoil, in 2018-20 they blocked former President Trump’s trade war, and in 2020 they contained the COVID-19 pandemic faster than other countries. COVID was especially extraordinary because it first emerged in China and yet China recovered faster than others – even expanding its global export market share as the world ordered more medical supplies and electronic gadgets (Chart 1). COVID-19 cases are spiking as we go to press but there is little doubt that China will use drastic measures to curb the virus’s spread. It produced two vaccines, even if less effective than its western counterparts (Chart 2). Monetary and fiscal policy will be utilized to prevent any disruptions to the Chinese New Year from pulling the rug out from under the economic recovery. Chart 1China Grew Global Market Share, Despite COVID
China Grew Global Market Share, Despite COVID
China Grew Global Market Share, Despite COVID
Chart 2China Has A Vaccine, Albeit Less Effective
China Geopolitical Outlook 2021
China Geopolitical Outlook 2021
In short, China is seen as a geopolitical juggernaut that poses no major risk to the global bull market in equities, corporate bonds, and commodities – the sole backstop for global growth during times of crisis (Chart 3). The problem with this view is that it is priced into markets already, the crisis era is fading (despite lingering near-term risks), and Beijing’s various risks are piling up. Chart 3China Backstopped Global Growth Again
China Geopolitical Outlook 2021
China Geopolitical Outlook 2021
First, as potential GDP growth slows, China faces greater difficulty managing the various socioeconomic imbalances and excesses created by its success – namely the tug of war between growth and reform. The crisis shattered China’s attempt to ensure a smooth transition to lower growth rates, leaving it with higher unemployment and industrial restructuring that will produce long-term challenges (Chart 4). Chart 4China's Unemployment Problem
China's Unemployment Problem
China's Unemployment Problem
The shock also forced China to engage in another blowout credit surge, worsening the problem of excessive leverage and reversing the progress that was made on corporate deleveraging in previous years. Second, foreign strategic opposition and trade protectionism are rising. China’s global image suffered across the world in 2020 as a result of COVID, despite the fact that President Trump’s antics largely distracted from China. Going forward there will be recriminations from Beijing’s handling of the pandemic and its power grab in Hong Kong yet Trump will not be there to deflect. By contrast, the Biden administration holds out a much greater prospect of aligning liberal democracies against China in a coalition that could ultimately prove effective in constraining its international behavior. China’s turn inward, toward import substitution and self-sufficiency, will reinforce this conflict. In the current global rebound, in which China will likely be able to secure its economic recovery while the US is supercharging its own, readers should expect global equity markets and China/EM stocks to perform well on a 12-month time frame. We would not deny all the positive news that has occurred. But Chinese equities have largely priced in the positives, meaning that Chinese politics and geopolitics are underrated again and will be a source of negative surprises going forward. The Centennial Of 1921 The Communist Party will hold a general conference to celebrate its 100th birthday on July 1, just as it did in 1981, 1991, 2001, and 2011. These meetings are ceremonial and have no impact on economic policy. We examined nominal growth, bank loans, fixed asset investment, industrial output, and inflation and observed no reliable pattern as an outcome of these once-per-decade celebrations. In 2011, for example, General Secretary Hu Jintao gave a speech about the party’s triumphs since 1921, reiterated the goals of the twelfth five-year plan launched in March 2011, and reminded his audience of the two centennial goals of becoming a “moderately prosperous society” by 2021 and a “modern socialist country” by 2049 (the hundredth anniversary of the People’s Republic). China is now transitioning from the 2021 goals to the 2049 goals and the policy consequences will be determined by the Xi Jinping administration. Xi will give a speech on July 1 recapitulating the fourteenth five-year plan’s goals and his vision for 2035 and 2049, which will be formalized in March at the National People’s Congress, China’s rubber-stamp parliament. As such any truly new announcements relating to the economy should come over the next couple of months, though the broad outlines are already set. There would need to be another major shock to the system, comparable to the US trade war and COVID-19, to produce a significant change in the economic policy outlook from where it stands today. Hence the Communist Party’s 100th birthday is not a driver of policy – and certainly not a reason for authorities to inject another dose of massive monetary and credit stimulus following the country’s massive 12% of GDP credit-and-fiscal impulse from trough to peak since 2018 (Chart 5). The overarching goal is stability around this event, which means policy will largely be held steady. Chart 5China's Big Stimulus Already Occurred
China's Big Stimulus Already Occurred
China's Big Stimulus Already Occurred
Far more important than the centenary of the Communist Party is the political leadership rotation that will begin on the local level in early 2022, culminating in the twentieth National Party Congress in the fall of 2022.1 This was supposed to be the date of Xi’s stepping down, according to the old schedule, but he will instead further consolidate power – and may even name himself Chairman Xi, as the next logical step in his Maoist propaganda campaign. This important political rotation will enable Xi to elevate his followers to higher positions and cement his influence over the so-called seventh generation of Chinese leaders, pushing his policy agenda far into the future. Ahead of these events, Beijing has been mounting a new battle against systemic risks, as it did in late 2016 and throughout 2017 ahead of the nineteenth National Party Congress. The purpose is to prevent the economic and financial excesses of the latest stimulus from destabilizing the country, to make progress on Xi’s policy agenda, and to expose and punish any adversaries. This new effort will face limitations based on the pandemic and fragile economy but it will nevertheless constitute the default setting for the next two years – and it is a drag on growth rather than a boost. The importance of the centenary and the twentieth party congress will not prevent various risks from exploding between now and the fall of 2022. Some political scandals will likely emerge as foreign or domestic opposition attempts to undermine Xi’s power consolidation – and at least one high-level official will inevitably fall from grace as Xi demonstrates his supremacy and puts his followers in place for higher office. But any market reaction to these kinds of events will be fleeting compared to the reaction to Xi’s economic management. The economic risk boils down to the implementation of Xi’s structural reform agenda and his threshold for suffering political pain in pursuit of this agenda. For now the risk is fairly well contained, as the pandemic is still somewhat relevant, but going forward the tension between growth and reform will grow. Bottom Line: The hundredth birthday of the Communist Party is overrated but the twentieth National Party Congress in 2022 is of critical importance to the governance of China over the next ten years. These events will not prompt a major new dose of stimulus and they will not prevent a major reform push or crackdown on financial excesses. But as always in China there will still be an overriding emphasis on economic and social stability above all. For now, this is supportive of the new global business cycle, commodity prices, and emerging market equities. The Fourteenth Five-Year Plan (2021-25) The draft proposal of China’s fourteenth five-year plan (2021-25) will be ratified at the annual “two sessions” in March (Table 1). The key themes are familiar from previous five-year plans, which focused on China’s economic transition from “quantity” to “quality” in economic development. Table 1China’s 14th Five Year Plan
China Geopolitical Outlook 2021
China Geopolitical Outlook 2021
China is seen as having entered the “high quality” phase of development – and the word quality is used 40 times in the draft. As with the past five years, the Xi administration is highlighting “supply-side structural reform” as a means of achieving this economic upgrade and promoting innovation. But Xi has shifted his rhetoric to highlight a new concept, “dual circulation,” which will now take center stage. Dual circulation marks a dramatic shift in Chinese policy: away from the “opening up and reform” of the liberal 1980s-2000s and toward a new era of import substitution and revanchism that will dominate the 2020s. Xi Jinping first brought it up in May 2020 and re-emphasized it at the July Politburo meeting and other meetings thereafter. It is essentially a “China First” policy that describes a development path in which the main economic activity occurs within the domestic market. Foreign trade and investment are there to improve this primary domestic activity. Dual circulation is better understood as a way of promoting import substitution, or self-reliance – themes that emerged after the Great Recession but became more explicit during the trade war with the US from 2018-20. The gist is to strengthen domestic demand and private consumption, improve domestic rather than foreign supply options, attract foreign investment, and build more infrastructure to remove internal bottlenecks and improve cross-regional activity (e.g. the Sichuan-Tibet railway, the national power grid, the navigation satellite system). China has greatly reduced its reliance on global trade already, though it is still fairly reliant when Hong Kong is included (Chart 6). The goals of the fourteenth five-year plan are also consistent with the “Made in China 2025” plan that aroused so much controversy with the Trump administration, leading China to de-emphasize it in official communications. Just like dual circulation, the 2025 plan was supposed to reduce China’s dependency on foreign technology and catapult China into the lead in areas like medical devices, supercomputers, robotics, electric vehicles, semiconductors, new materials, and other emerging technologies. This plan was only one of several state-led initiatives to boost indigenous innovation and domestic high-tech production. The response to American pressure was to drop the name but maintain the focus. Some of the initiatives will fall under new innovation and technology guidelines while others will fall under the category of “new types of infrastructure,” such as 5G networks, electric vehicles, big data centers, artificial intelligence operations, and ultra-high voltage electricity grids. With innovation and technology as the overarching goals, China is highly likely to increase research and development spending and aim for an overall level of above 3% of GDP (Chart 7). In previous five-year plans the government did not set a specific target. Nor did it set targets for the share of basic research spending within research and development, which is around 6% but is believed to need to be around 15%-20% to compete with the most innovative countries. While Beijing is already a leader in producing new patents, it will attempt to double its output while trying to lift the overall contribution of technology advancement to the economy. Chart 6China Seeks To Reduce Foreign Dependency
China Seeks To Reduce Foreign Dependency
China Seeks To Reduce Foreign Dependency
Dual circulation will become a major priority affecting other areas of policy. Reform of state-owned enterprises (SOEs), for example, will take place under this rubric. The Xi administration has dabbled in SOE reform all along, for instance by injecting private capital to create mixed ownership, but progress has been debatable. Chart 7China Will Surge R&D Spending
China Will Surge R&D Spending
China Will Surge R&D Spending
The new five-year plan will incorporate elements of an existing three-year action plan approved last June. The intention is to raise the competitiveness of China’s notoriously bloated SOEs, making them “market entities” that play a role in leading innovation and strengthening domestic supply chains. However, there is no question that SOEs will still be expected to serve an extra-economic function of supporting employment and social stability. So the reform is not really a broad liberalization and SOEs will continue to be a large sector dominated by the state and directed by the state, with difficulties relating to efficiency and competitiveness. Notwithstanding the focus on quality, China still aims to have GDP per capita reach $12,500 by 2025, implying 5%-5.5% annual growth from 2021-25, which is consistent with estimates of the International Monetary Fund (Chart 8). This kind of goal will require policy support at any given time to ensure that there is no major shortfall due to economic shocks like COVID-19. Thus any attempts at reform will be contained within the traditional context of a policy “floor” beneath growth rates – which itself is one of the biggest hindrances to deep reform. Chart 8China's Growth Target Through 2025
China's Growth Target Through 2025
China's Growth Target Through 2025
Chart 9Stimulus Correlates With Carbon Emissions
Stimulus Correlates With Carbon Emissions
Stimulus Correlates With Carbon Emissions
As the economy’s potential growth slows the Communist Party has been shifting its focus to improving the quality of life, as opposed to the previous decades-long priority of meeting the basic material needs of the society. The new five-year plan aims to increase disposable income per capita as part of the transition to a domestic consumption-driven economy. The implied target will be 5%-5.5% growth per year, down from 6.5%+ previously, but the official commitment will be put in vague qualitative terms to allow for disappointments in the slower growing environment. The point is to expand the middle-income population and redistribute wealth more effectively, especially in the face of stark rural disparity. In addition the government aims to increase education levels, expand pension coverage, and, in the midst of the pandemic, increase public health investment and the number of doctors and hospital beds relative to the population. Beijing seems increasingly wary of too rapid of a shift away from manufacturing – which makes sense in light of the steep drop in the manufacturing share of employment amid China’s shift away from export-dependency. In the thirteenth five-year plan, Beijing aimed to increase the service sector share of GDP from 50.5% to 56%. But in the latest draft plan it sets no target for growing services. Any implicit goal of 60% would be soft rather than hard. Given that manufacturing and services combined make up 93% of the economy, there is not much room to grow services further unless policymakers want to allow even faster de-industrialization. But the social and political risks of rapid de-industrialization are well known – both from the liquidation of the SOEs in the late 1990s and from the populist eruptions in the UK and US more recently. Beijing is likely to want to take a pause in shifting away from manufacturing. But this means that China’s exporting of deflation and large market share will persist and hence foreign protectionist sentiment will continue to grow. The fourteenth five-year plan ostensibly maintains the same ambitious targets for environmental improvement as in its predecessor, in terms of water and energy consumption, carbon emissions, pollution levels, renewable energy quotas, and quotas for arable land and forest coverage. But in reality some of these targets are likely to be set higher as Beijing has intensified its green policy agenda and is now aiming to hit peak carbon emissions by 2030. China aims to be a “net zero” carbon country by 2060. Doubling down on the shift away from fossil fuels will require an extraordinary policy push, given that China is still a heavily industrial economy and predominantly reliant on coal power. So environmental policy will be a critical area to watch when the final five-year plan is approved in March, as well as in future plans for the 2026-30 period. As was witnessed in recent years, ambitious environmental goals will be suspended when the economy slumps, which means that achieving carbon emissions goals will not be straightforward (Chart 9), but it is nevertheless a powerful economic policy theme and investment theme. Xi Jinping’s Vision: 2035 On The Way To 2049 At the nineteenth National Party Congress, the critical leadership rotation in 2017, Xi Jinping made it clear that he would stay in power beyond 2022 – eschewing the nascent attempt of his predecessors to set up a ten-year term limit – and establish 2035 as a midway point leading to the 2049 anniversary of the People’s Republic. There are strategic and political goals relevant to this 2035 vision – including speculation that it could be Xi’s target for succession or for reunification with Taiwan – but the most explicit goals are, as usual, economic. Chart 10Xi Jinping’s 2035 Goals
China Geopolitical Outlook 2021
China Geopolitical Outlook 2021
Officially China is committing to descriptive rather than numerical targets. GDP per capita is to reach the level of “moderately developed countries.” However, in a separate explanation statement, Xi Jinping declares, “it is completely possible for China to double its total economy or per capita income by 2035.” In other words, China’s GDP is supposed to reach 200 trillion renminbi, while GDP per capita should surpass $20,000 by 2035, implying an annual growth rate of at least 4.73% (Chart 10). There is little reason to believe that Beijing will succeed as much in meeting future targets as it has in the past. In the past China faced steady final demand from the United States and the West and its task was to bring a known quantity of basic factors of production into operation, after lying underutilized for decades, which made for high growth rates and fairly predictable outcomes. In the future the sources of demand are not as reliable and China’s ability to grow will be more dependent on productivity enhancements and innovation that cannot be as easily created or predicted. The fourteenth five-year plan and Xi’s 2035 vision will attempt to tackle this productivity challenge head on. But restructuring and reform will advance intermittently, as Xi is unquestionably maintaining his predecessors’ commitment to stability above all. Outlook 2021: Back To The Tug Of War Of Stimulus And Reform The tug of war between economic stimulus and reform is on full display already in 2021 and will become by far the most important investment theme this year. If China tightens monetary and fiscal policy excessively in 2021, in the name of reform, it will undermine its own and the global economic recovery, dealing a huge negative surprise to the consensus in global financial markets that 2021 will be a year of strong growth, rebounding trade, a falling US dollar, and ebullient commodity prices. Our view is that Chinese policy tightening is a significant risk this year – it is not overrated – but that the government will ultimately ease policy as necessary and avoid what would be a colossal policy mistake of undercutting the economic recovery. We articulated this view late last year and have already seen it confirmed both in the Politburo’s conclusions at the annual economic meeting in December, and in the reemergence of COVID-19, which will delay further policy tightening for the time being. The pattern of the Xi administration thus far is to push forward domestic reforms until they run up against the limits of economic stability, and then to moderate and ease policy for the sake of recovery, before reinitiating the attack. Two key developments initially encouraged Xi to push forward with a new “assault phase of reform” in 2021: First, a new global business cycle is beginning, fueled by massive monetary and fiscal stimulus across the world (not only in China), which enables Xi to take actions that would drag on growth. Second, Xi Jinping has emerged from the US trade war stronger than ever at home. President Trump lost the election, giving warning to any future US president who would confront China with a frontal assault. The Biden administration’s priority is economic recovery, for the sake of the Democratic Party’s future as well as for the nation, and this limits Biden’s ability to escalate the confrontation with China, even though he will not revoke most of Trump’s actions. Biden’s predicament gives Beijing a window to pursue difficult domestic initiatives before the Biden administration is capable of turning its full attention to the strategic confrontation with China. The fact that Biden seeks to build a coalition of states first, and thus must spend a great deal of time on diplomacy with Europe and other allies, is another advantageous circumstance. China is courting and strengthening relations with Europe and those very allies so as to delay the formation of any effective coalition (Chart 11). Chart 11China Courts EU As Substitute For US
China Geopolitical Outlook 2021
China Geopolitical Outlook 2021
Thus, prior to the latest COVID-19 spike, Beijing was clearly moving to tighten monetary and fiscal policy and avoid a longer stimulus overshoot that would heighten the country’s long-term financial risks and debt woes. This policy preference will continue to be a risk in 2021: Central government spending down: Emergency fiscal spending to deal with the pandemic will be reduced from 2020 levels and the budget deficit will be reined in. The Politburo’s chief economic planning event, the Central Economic Work Conference in December, resulted in a decision to maintain fiscal support but to a lesser degree. Fiscal policy will be “effective and sustainable,” i.e. still proactive but lower in magnitude (Chart 12). Local government spending down: The central government will try to tighten control of local government bond issuance. The issuance of new bonds will fall closer to 2019 levels after a 55% increase in 2020. New bonds provide funds for infrastructure and investment projects meant to soak up idle labor and boost aggregate demand. A cut back in these projects and new bonds will drag on the economy relative to last year (Chart 13). Chart 12China Pares Government Spending On The Margin
China Geopolitical Outlook 2021
China Geopolitical Outlook 2021
Chart 13China Pares Local Government Spending Too
China Geopolitical Outlook 2021
China Geopolitical Outlook 2021
Monetary policy tightening up: The People’s Bank of China aims to maintain a “prudent monetary policy” that is stable and targeted in 2021. The intention is to avoid any sharp change in policy. However, PBoC Governor Yi Gang admits that there will be some “reasonable adjustments” to monetary policy so that the growth of broad money (M2) and total social financing (total private credit) do not wildly exceed nominal GDP growth (which should be around 8%-10% in 2021). The risk is that excessive easiness in the current context will create asset bubbles. The implication is that credit growth will slow to 11%-12%. This is not slamming on the brakes but it is a tightening of credit policy. Macro-prudential regulation up: The People’s Bank is reasserting its intention to implement the new Macro-Prudential Assessment (MPA) framework designed to tackle systemic financial risk. The rollout of this reform paused last year due to the pandemic. A detailed plan of how the country’s various major financial institutions will adopt this new mechanism is expected in March. The implication is that Beijing is turning its attention back to mitigating systemic financial risks. This includes closer supervision of bank capital adequacy ratios and cross-border financing flows. New macro-prudential tools are also targeting real estate investment and potentially other areas. Larger established banks will have a greater allowance for property loans than smaller, riskier banks. At the same time, it is equally clear that Beijing will try to avoid over-tightening policy: The COVID outbreak discourages tightening: This outbreak has already been mentioned and will pressure leaders to pause further policy tightening at least until they have greater confidence in containment. The vaccine rollout process also discourages economic activity at first since nobody wants to go out and contract the disease when a cure is in sight. Local government financial support is still robust: Local governments will still need to issue refinancing bonds to deal with the mountain of debt coming into maturity and reduce the risk of widespread insolvency. In 2020, they issued more than 1.8 trillion yuan of refinancing bonds to cover about 88% of the 2 trillion in bonds coming due. In 2021, they will have to issue about 2.2 trillion of refinancing bonds to maintain the same refinancing rate for a larger 2.6 trillion yuan in bonds coming due (Table 2). Thus while Beijing is paring back its issuance of new bonds to fund new investment projects, it will maintain a high level of refinancing bonds to prevent insolvency from cascading and undermining the recovery. Table 2Local Government Debt Maturity Schedule
China Geopolitical Outlook 2021
China Geopolitical Outlook 2021
Monetary policy will not be too tight: The People’s Bank’s open market operations in January so far suggest that it is starting to fine-tune its policies but that it is doing so in an exceedingly measured way so as not to create a liquidity squeeze around the traditionally tight-money period of Chinese New Year. The seven-day repo rate, the de facto policy interest rate, has already rolled over from last year’s peak. The takeaway is that while Beijing clearly intended to cut back on emergency monetary and fiscal support this year – and while Xi Jinping is clearly willing to impose greater discipline on the economy and financial system prior to the big political events of 2021-22 – nevertheless the lingering pandemic and fragile global environment will ensure a relatively accommodative policy for the first half of 2021 in order to secure the economic recovery. The underlying risk of policy tightening is still significant, especially in the second half of 2021 and in 2022, due to the underlying policy setting. Investment Takeaways The CNY-USD has experienced a tremendous rally in the wake of the US-China phase one trade deal last year and Beijing’s rapid bounce-back from the pandemic. The trade weighted renminbi is now trading just about at fair value (Chart 14). We closed our CNY-USD short recommendation and would stand aside for now. China’s current account surplus is still robust, real reform requires a fairly strong yuan, and the Biden administration will also expect China not to depreciate the currency competitively. Thus while we anticipate the CNY-USD to suffer a surprise setback when the market realizes that the US and China will continue to clash despite the end of the Trump administration, nevertheless we are no longer outright short the currency. Chinese investable stocks have rallied furiously on the stimulus last year as well as robust foreign portfolio inflows. The rally is likely overstretched at the moment as the COVID outbreak and policy uncertainties come to the fore. This is also true for Chinese stocks other than the high-flying technology, media, and telecom stocks (Chart 15). Domestic A-shares have rallied on the back of Alibaba executive Jack Ma’s reappearance even though the clear implication is that in the new era, the Communist Party will crack down on entrepreneurs – and companies like fintech firm Ant Group – that accumulate too much power (Chart 16). Chart 14Renminbi Fairly Valued
Renminbi Fairly Valued
Renminbi Fairly Valued
Chart 15China: Investable Stocks Overbought
China: Investable Stocks Overbought
China: Investable Stocks Overbought
Chart 16Communist Party, Jack Ma's Boss
Communist Party, Jack Ma's Boss
Communist Party, Jack Ma's Boss
Chart 17Go Long Chinese Government Bonds
Go Long Chinese Government Bonds
Go Long Chinese Government Bonds
Chinese government bond yields are back near their pre-COVID highs (though not their pre-trade war highs). Given the negative near-term backdrop – and the longer term challenges of restructuring and geopolitical risks over Taiwan and other issues that we expect to revive – these bonds present an attractive investment (Chart 17). Housekeeping: In addition to going long Chinese 10-year government bonds on a strategic time frame, we are closing our long Mexican industrials versus EM trade for a loss of 9.1%. We are still bullish on the Mexican peso and macro/policy backdrop but this trade was premature. We are also closing our long S&P health care tactical hedge for a loss of 1.8%. Matt Gertken Vice President Geopolitical Strategy mattg@bcaresearch.com Yushu Ma Research Associate yushu.ma@bcaresearch.com Footnotes 1 Indeed the 2022 political reshuffle has already begun with several recent appointments of provincial Communist Party secretaries.
According to BCA Research’s European Investment Strategy service, the longevity of the bull market depends on four things: sales, wages, taxes, and the bond yield. Until yields rise significantly, long-term investors should stay in equities. Sales tend to…
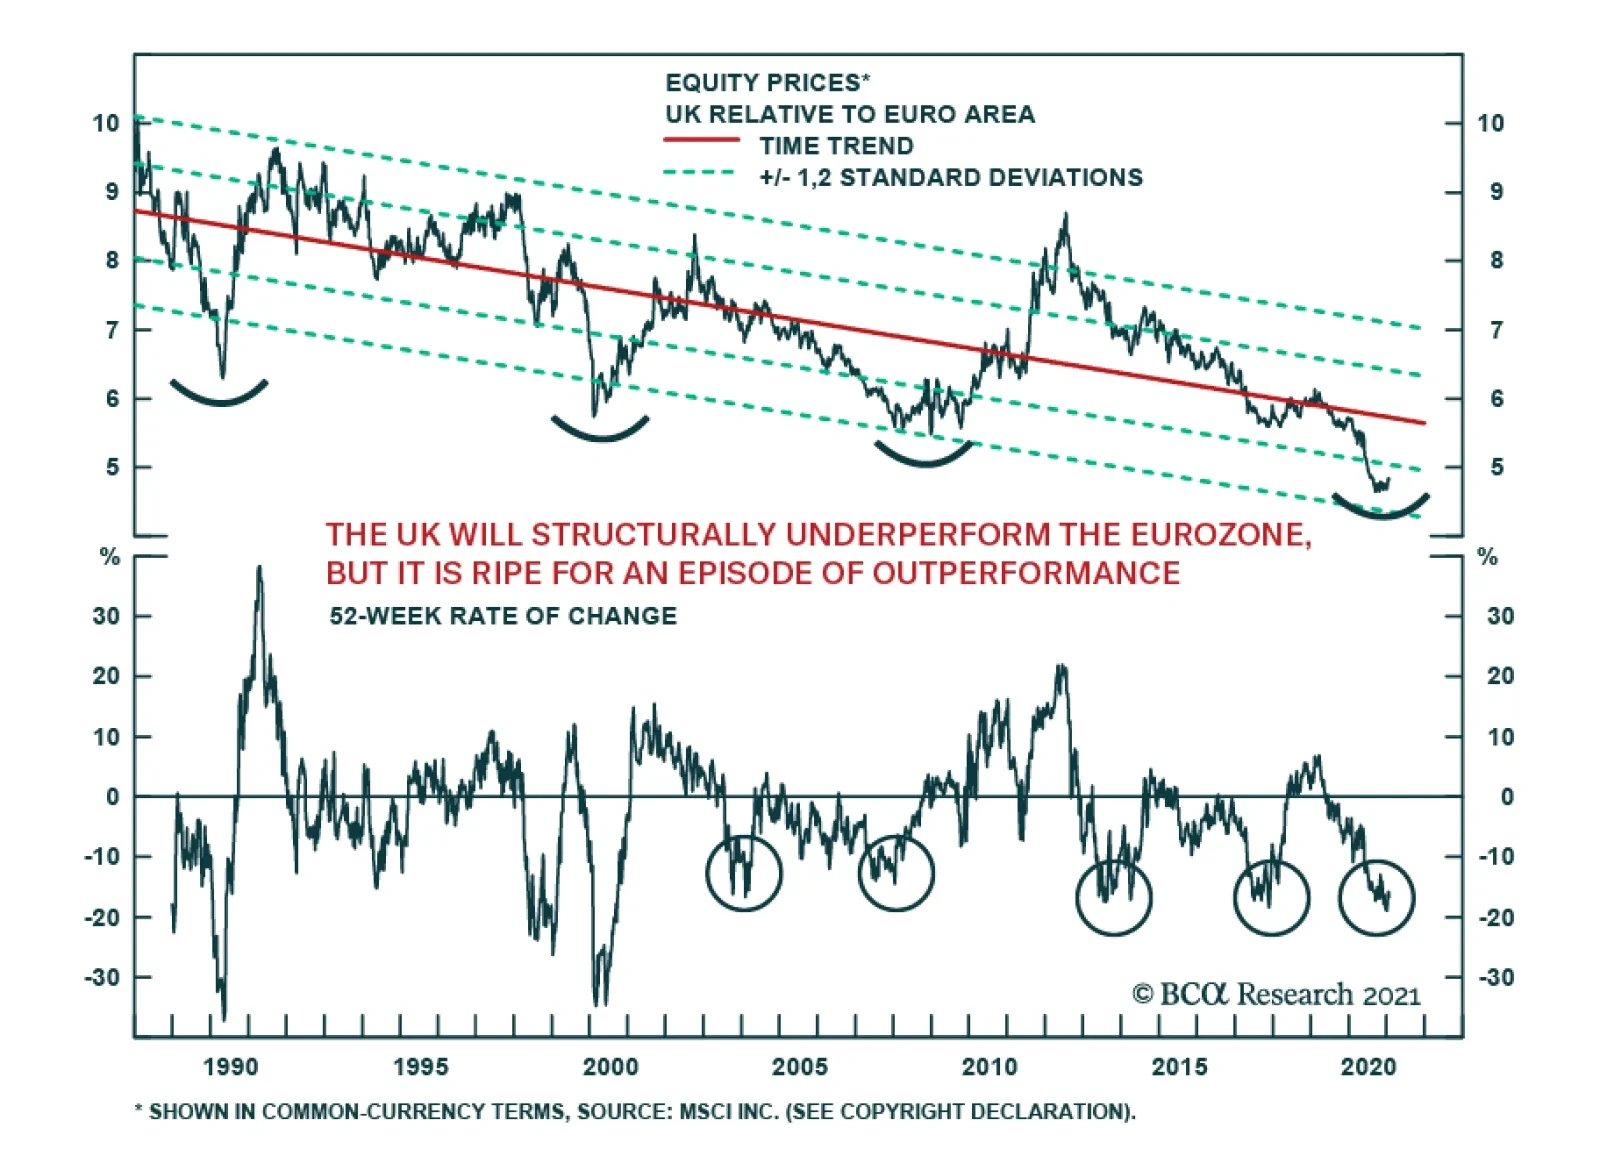
While it is well known that UK equities have been in a secular downtrend against the US, it is often less appreciated that they have greatly underperformed euro area stocks for the past 32 years. There is little reason to believe that the secular…
Highlights Higher corporate taxes mean that the structural profit margin will drift lower. Combined with only modestly rising sales, aggregate stock market profits will continue to go nowhere, as they have since 2008. Hence, the continuation of the structural bull market will depend on multiple expansion and a declining global bond yield, as it has since 2008. The good news is that the relationship between a declining bond yield and stock market valuation is exponential. This means that the equity bull market will end when the yield on the US 10-year T-bond and the yield on the Italian 10-year BTP reach zero. Until then, long-term investors should stay in equities. But avoid the three sectors whose profits are in terminal decline: oil and gas, basic resources, and banks (other than for brief countertrend trades). Fractal trade: underweight European basic resources. Feature Feature ChartThe Post-2008 Bull Market Is Due To Higher Valuations, Not Profits
The Post-2008 Bull Market Is Due To Higher Valuations, Not Profits
The Post-2008 Bull Market Is Due To Higher Valuations, Not Profits
A core tenet of investment is under threat. The core tenet is that the stock market goes up because profits go up. This tenet is under threat because, since 2008, the global stock market has nearly doubled while profits have gone nowhere. Granted, the pandemic took its toll on profits in 2020. But we are looking at forward earnings per share, the profits anticipated over the next 12 months. Forward earnings per share are discounting a V-shaped recovery in 2021, and have recovered almost all their pandemic losses. Yet the remarkable thing is that even after this snapback, profits are no higher today than they were in August 2008! This remarkable observation leads to a salutary conclusion. The global stock market has nearly doubled since 2008 because the multiple paid for unchanged profits has nearly doubled (Feature Chart). Furthermore, the reason that the multiple has nearly doubled is that the global bond yield has collapsed. Empirically, the valuation of the global stock market is tightly connected with the simple average of the (inverted) yields on the safest sovereign bond, the US T-bond, and the riskier sovereign bond, the Italian BTP. The salutary conclusion is that the raging bull market since 2008 is entirely due to the collapse in bond yields (Chart I-2). Chart I-2The Post-2008 Bull Market Is Due To The Collapse In Bond Yields
The Post-2008 Bull Market Is Due To The Collapse In Bond Yields
The Post-2008 Bull Market Is Due To The Collapse In Bond Yields
Flat Profits Hide Big Winners And Big Losers The preceding analysis applies to the global stock market, and its profits, taken as a sum of the parts. But among the parts are some big winners and some big losers. Although overall profits have gone nowhere since 2008, some sector profits have been in major structural uptrends while other sector profits have been in terminal decline. The major profit uptrends are in technology +170 percent, and healthcare +110 percent (Chart I-3). And the terminal declines are in oil and gas -80 percent, basic resources -40 percent, and banks -35 percent (Chart I-4). Chart I-3The Sector Profits In Structural Uptrends
The Sector Profits In Structural Uptrends
The Sector Profits In Structural Uptrends
Chart I-4The Sector Profits In Structural Downtrends
The Sector Profits In Structural Downtrends
The Sector Profits In Structural Downtrends
It follows that among stock markets, the major profit uptrends are in those markets with a high weighting to the sector profits in uptrends: specifically, tech-heavy US +55 percent, healthcare-heavy Denmark +40 percent, and tech-heavy Korea +25 percent (Chart I-5). And the major profit downtrends are in those markets with a high weighting to the sector profits in terminal decline: specifically, bank-heavy Spain -55 percent, Italy -45 percent, and Austria -45 percent (Chart I-6). Chart I-5The Stock Market Profits In Structural Uptrends
The Stock Market Profits In Structural Uptrends
The Stock Market Profits In Structural Uptrends
Chart I-6The Stock Market Profits In Structural Downtrends
The Stock Market Profits In Structural Downtrends
The Stock Market Profits In Structural Downtrends
When profits are in terminal decline, the valuation boost from lower bond yields is not enough to take the stock market higher. Hence, ask an investor in Spain or Italy when the equity bull market will end, and he will look at you quizzically. In Spain and Italy, the bull market ended thirteen years ago! In Spain and Italy, the bull market ended thirteen years ago. One important message for long-term investors is that when a sector’s profits go into structural decline, it is terminal. It is almost unheard of for these sectors to return to structural growth. Furthermore, the support to the sector price from falling bond yields is not enough to offset the weight of collapsing profits. In any case, bond yields cannot fall forever. Hence, long-term investors should stick with the growth sectors. And avoid the three sectors whose profits are in terminal decline: oil and gas, basic resources, and banks. Profit Margins Peaked In 2008 It seems counterintuitive that aggregate stock market profits have gone nowhere since 2008. After all, the world economy has experienced a long expansion during which the revenues of globally listed companies have grown by over 40 percent (Chart I-7). Chart I-7Post-2008, Sales Have Expanded But Profits Have Gone Nowhere
Post-2008, Sales Have Expanded But Profits Have Gone Nowhere
Post-2008, Sales Have Expanded But Profits Have Gone Nowhere
If sales are up while profits have gone nowhere, then, as an accounting identity, it means that the profit margin has eroded (Chart I-8). In turn, if profits are taking a smaller share of sales, then, as another accounting identity, some other component must be taking a larger share. That other component has been wages. Wages, as a share of income, reached their low-point just after the 2008 financial crisis, since when they have been trending higher, eroding the profit margin (Chart I-9). Chart I-8The Profit Margin Peaked ##br##In 2008
The Profit Margin Peaked In 2008
The Profit Margin Peaked In 2008
Chart I-9The Wage Share Of Income Bottomed After The 2008 Crisis
The Wage Share Of Income Bottomed After The 2008 Crisis
The Wage Share Of Income Bottomed After The 2008 Crisis
Interestingly, this demonstrates that if wages are rising faster than income, it does not necessarily lead to consumer price inflation. Instead, as we have seen since 2008, it can just erode the profit margin. Hence, looking ahead, a key question is what will happen to the wage share of income? What will happen to the profit margin? Another component of income that can erode the profit margin is corporate taxes. So, a further question is what will happen to the corporate tax rate? Predicting The End Of The Bull Market The longevity of the bull market depends on four things: sales, wages, taxes, and the bond yield. Let’s address all four in turn. Sales tend to grow most strongly immediately after a severe recession. Unlike the severe sales recessions of 2008 and 2015, the pandemic recession only made a short-lived dent to the revenues of listed companies. From this starting point, we can expect only modest growth in sales through the next few years. Wages will be subject to opposing forces. High structural unemployment in the post-pandemic world will constrain wage growth. Against this, the wage share of income should benefit from a coordinated global agenda of ‘levelling up’ through, for example, higher minimum wages and increased rights and benefits for workers. Taken together, the wage share of income is likely to go sideways. The much bigger threat to profits is higher corporate taxes. Indeed, after reaching a low after the 2008 financial crisis, the US corporate tax rate did start to rise for a while, before the Trump tax cuts took the corporate tax rate back to a low. However, the newly installed Biden administration, supported by a Democratic House and Senate, is highly likely to reverse the Trump tax cuts, with corporate taxes bearing the brunt (Chart I-10). Chart I-10Corporate Taxes Will Go Up
Corporate Taxes Will Go Up
Corporate Taxes Will Go Up
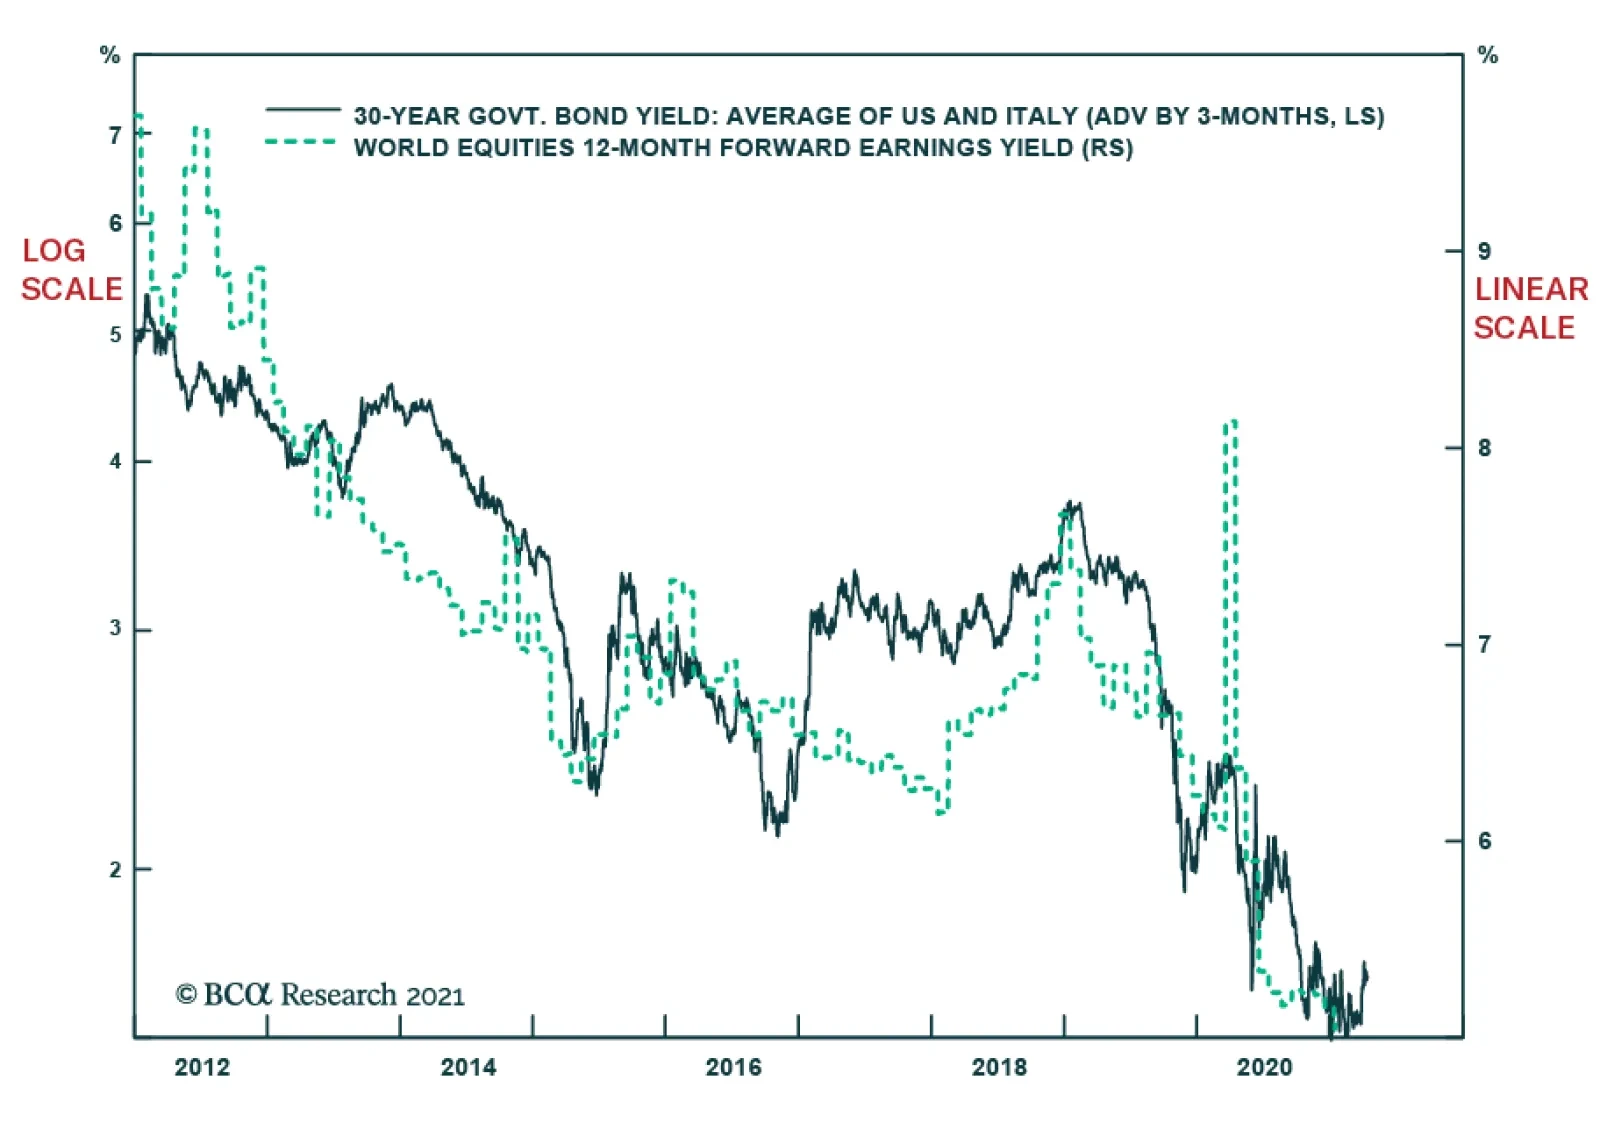
Elsewhere in the world too, governments are desperately seeking ways to mitigate – or at least, contain – ballooning deficits that have paid for the pandemic. Raising corporate taxes is an easy and politically expedient answer. The UK finance minister, Rishi Sunak, is strongly hinting that corporate taxes are going up. The big threat to profits is higher corporate taxes. Higher corporate taxes with a flat wage share of income means that the structural profit margin will continue to drift lower. Combined with gently rising sales, the likely outcome is that aggregate stock market profits will continue to go nowhere, just as they have since 2008. Hence, the continuation of the structural bull market will depend on multiple expansion and a declining global bond yield, just as it has since 2008. Here we can present some good news. The relationship between the declining bond yield and stock market valuation is exponential. This is because as bond yields approach their lower bound, bond prices have less additional upside but more downside. This extra riskiness of bonds means that investors demand a reduced (and ultimately no) risk premium on equities versus bonds. In effect, as bond yields decline, the required return on equities collapses. And as valuation is just the inverse of required return, valuations soar. Chart I-11 demonstrates this exponential relationship in practice. Note that the bond yield is on the logarithmic left scale while the stock market earnings yield is on the linear right scale. The logarithmic versus linear scales visually demonstrate that at a lower bond yield, a given change in the bond yield has a much greater impact on the earnings yield. Chart I-11The Relationship Between Bond Yields And Stock Market Valuations Is Exponential
The Relationship Between Bond Yields And Stock Market Valuations Is Exponential
The Relationship Between Bond Yields And Stock Market Valuations Is Exponential
We conclude that the equity bull market will end when the global bond yield can go no lower. In practical terms, this means when the yield on the US 10-year T-bond and the yield on the Italian 10-year BTP reach zero. Until then, long-term investors should stay in equities. Fractal Trading System* The recent outperformance of European basic materials is vulnerable to reversal, given that its fragile 65-day fractal structure has reliably indicated previous reversals. Accordingly, underweight European basic resources versus the market, setting a profit target and symmetrical stop-loss at 4 percent. The rolling 12-month win ratio now stands at 59 percent. Chart I-12Europe: Basic Resources Vs. Market
Europe: Basic Resources Vs. Market
Europe: Basic Resources Vs. Market
When the fractal dimension approaches the lower limit after an investment has been in an established trend it is a potential trigger for a liquidity-triggered trend reversal. Therefore, open a countertrend position. The profit target is a one-third reversal of the preceding 13-week move. Apply a symmetrical stop-loss. Close the position at the profit target or stop-loss. Otherwise close the position after 13 weeks. * For more details please see the European Investment Strategy Special Report “Fractals, Liquidity & A Trading Model,” dated December 11, 2014, available at eis.bcaresearch.com. Dhaval Joshi Chief European Investment Strategist dhaval@bcaresearch.com Fractal Trading System Cyclical Recommendations Structural Recommendations Closed Fractal Trades Trades Closed Trades Asset Performance Currency & Bond Equity Sector Country Equity Indicators Bond Yields Chart II-1Indicators To Watch - Bond Yields
Indicators To Watch - Bond Yields
Indicators To Watch - Bond Yields
Chart I-2Indicators To Watch - Bond Yields
Indicators To Watch - Bond Yields
Indicators To Watch - Bond Yields
Chart I-3Indicators To Watch - Bond Yields
Indicators To Watch - Bond Yields
Indicators To Watch - Bond Yields
Chart I-4Indicators To Watch - Bond Yields
Indicators To Watch - Bond Yields
Indicators To Watch - Bond Yields
Interest Rate Chart I-5Indicators To Watch - Interest Rate Expectations
Indicators To Watch - Interest Rate Expectations
Indicators To Watch - Interest Rate Expectations
Chart I-6Indicators To Watch - Interest Rate Expectations
Indicators To Watch - Interest Rate Expectations
Indicators To Watch - Interest Rate Expectations
Chart I-7Indicators To Watch - Interest Rate Expectations
Indicators To Watch - Interest Rate Expectations
Indicators To Watch - Interest Rate Expectations
Chart I-8Indicators To Watch - Interest Rate Expectations
Indicators To Watch - Interest Rate Expectations
Indicators To Watch - Interest Rate Expectations
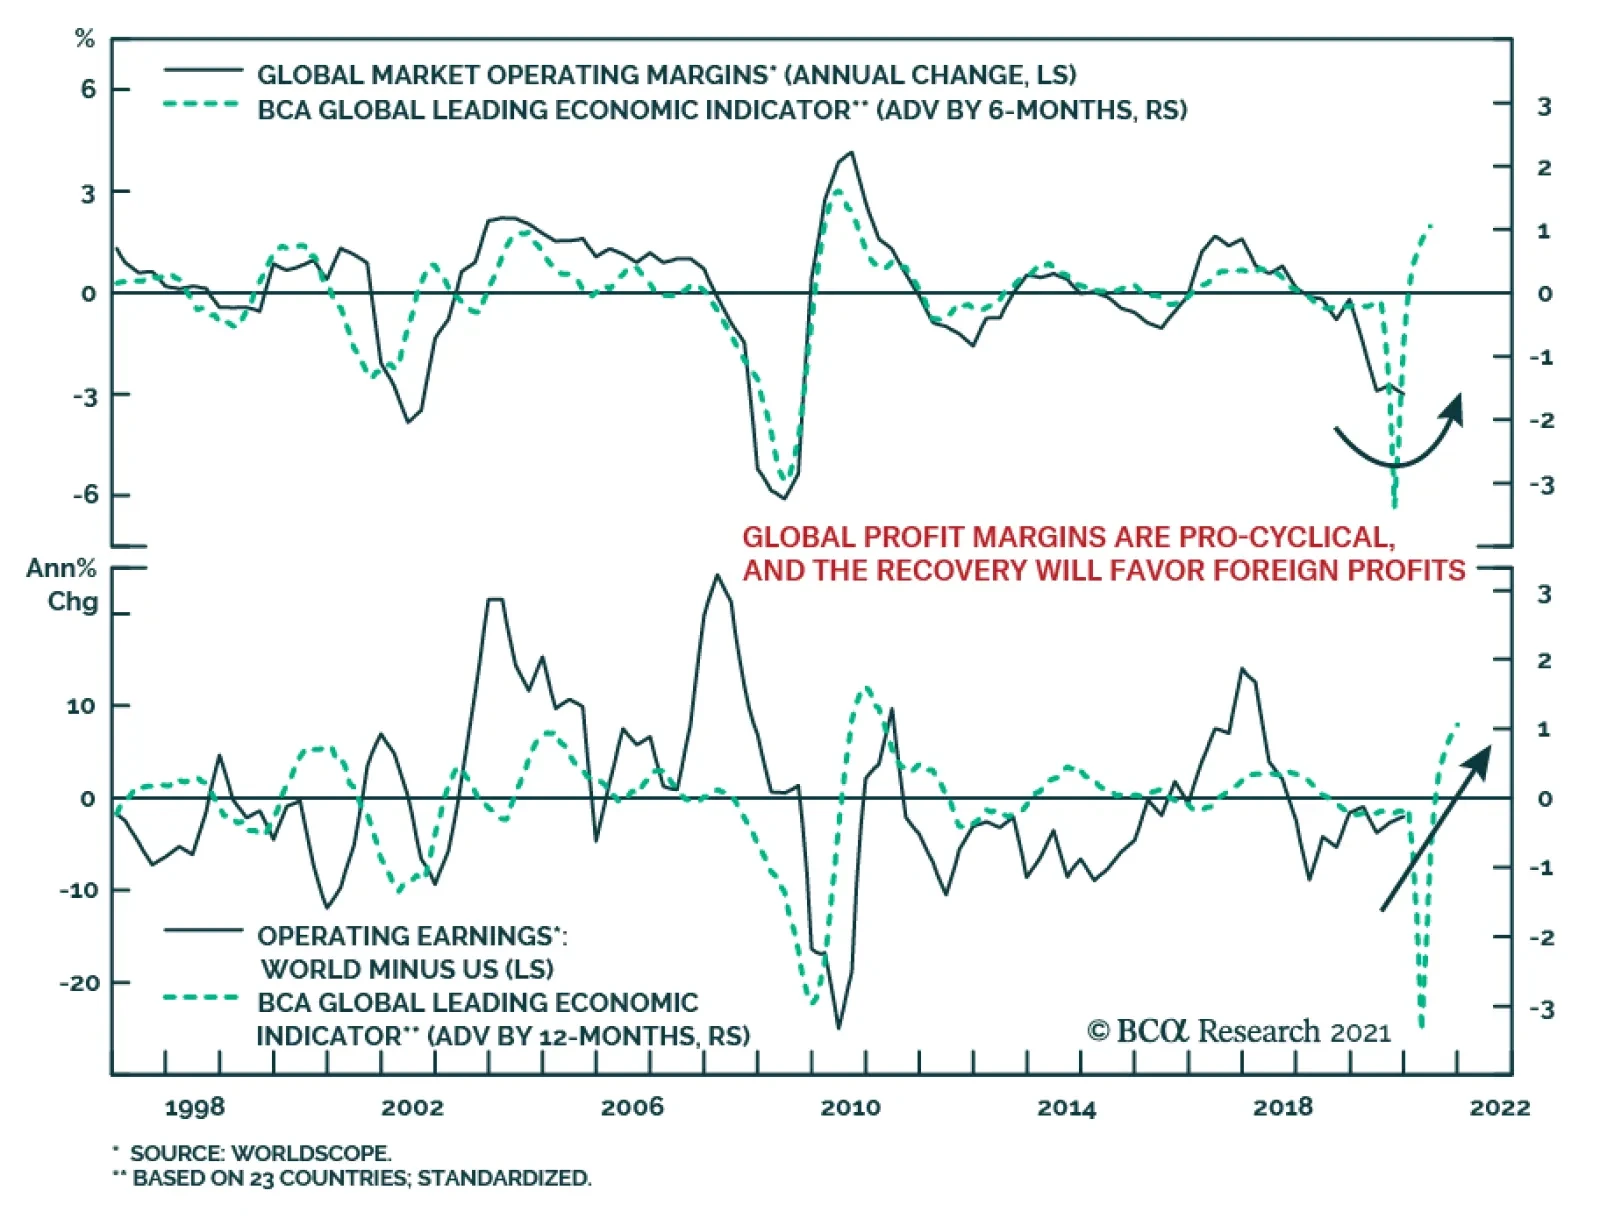
Global profit margins are set to improve meaningfully in 2021 because they are very pro-cyclical and they will track the acceleration in the BCA Global Leading Economic Indicator. Rising profit margins and increasing sales will allow stock prices to grow into…
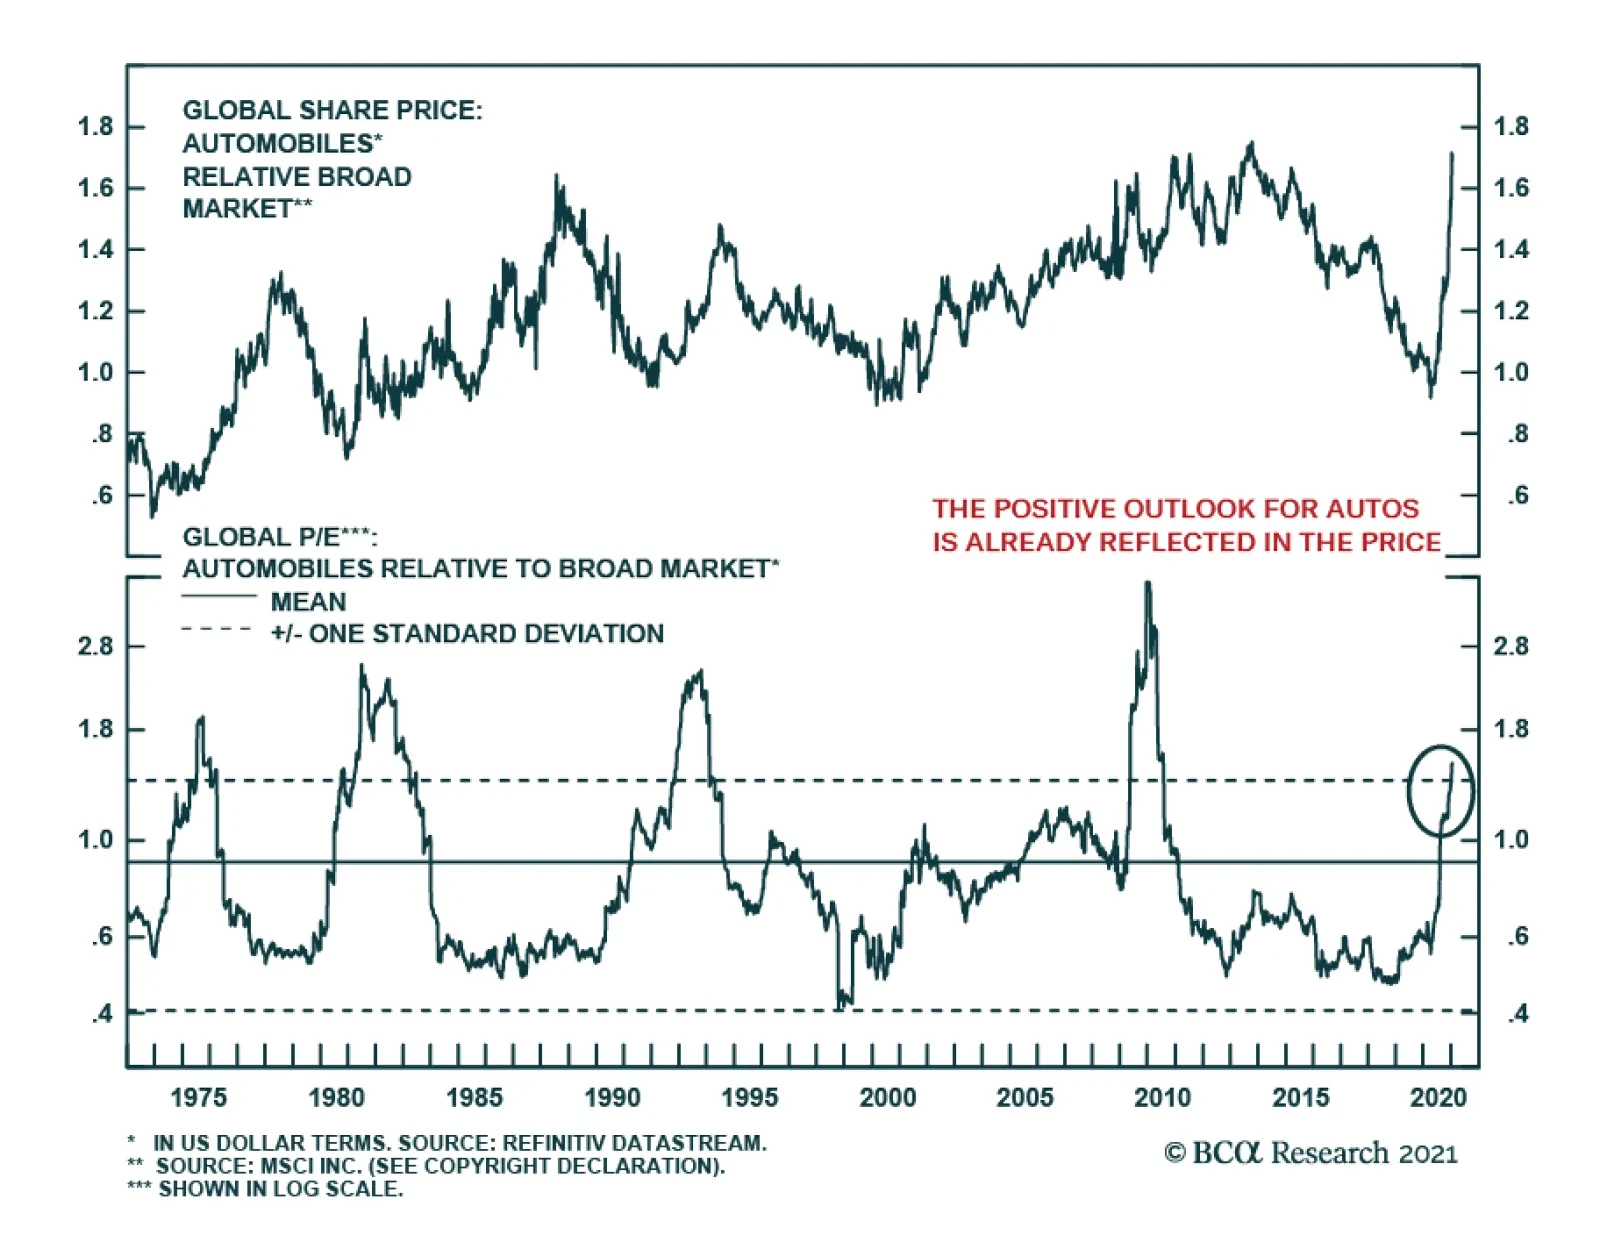
As we expected back in June, global automotive stocks revved up and have been on a rip since H2, following a multi-year period of underperformance. After participating in this rally, we now believe that prices have gotten ahead of themselves and it is time to…