Factors
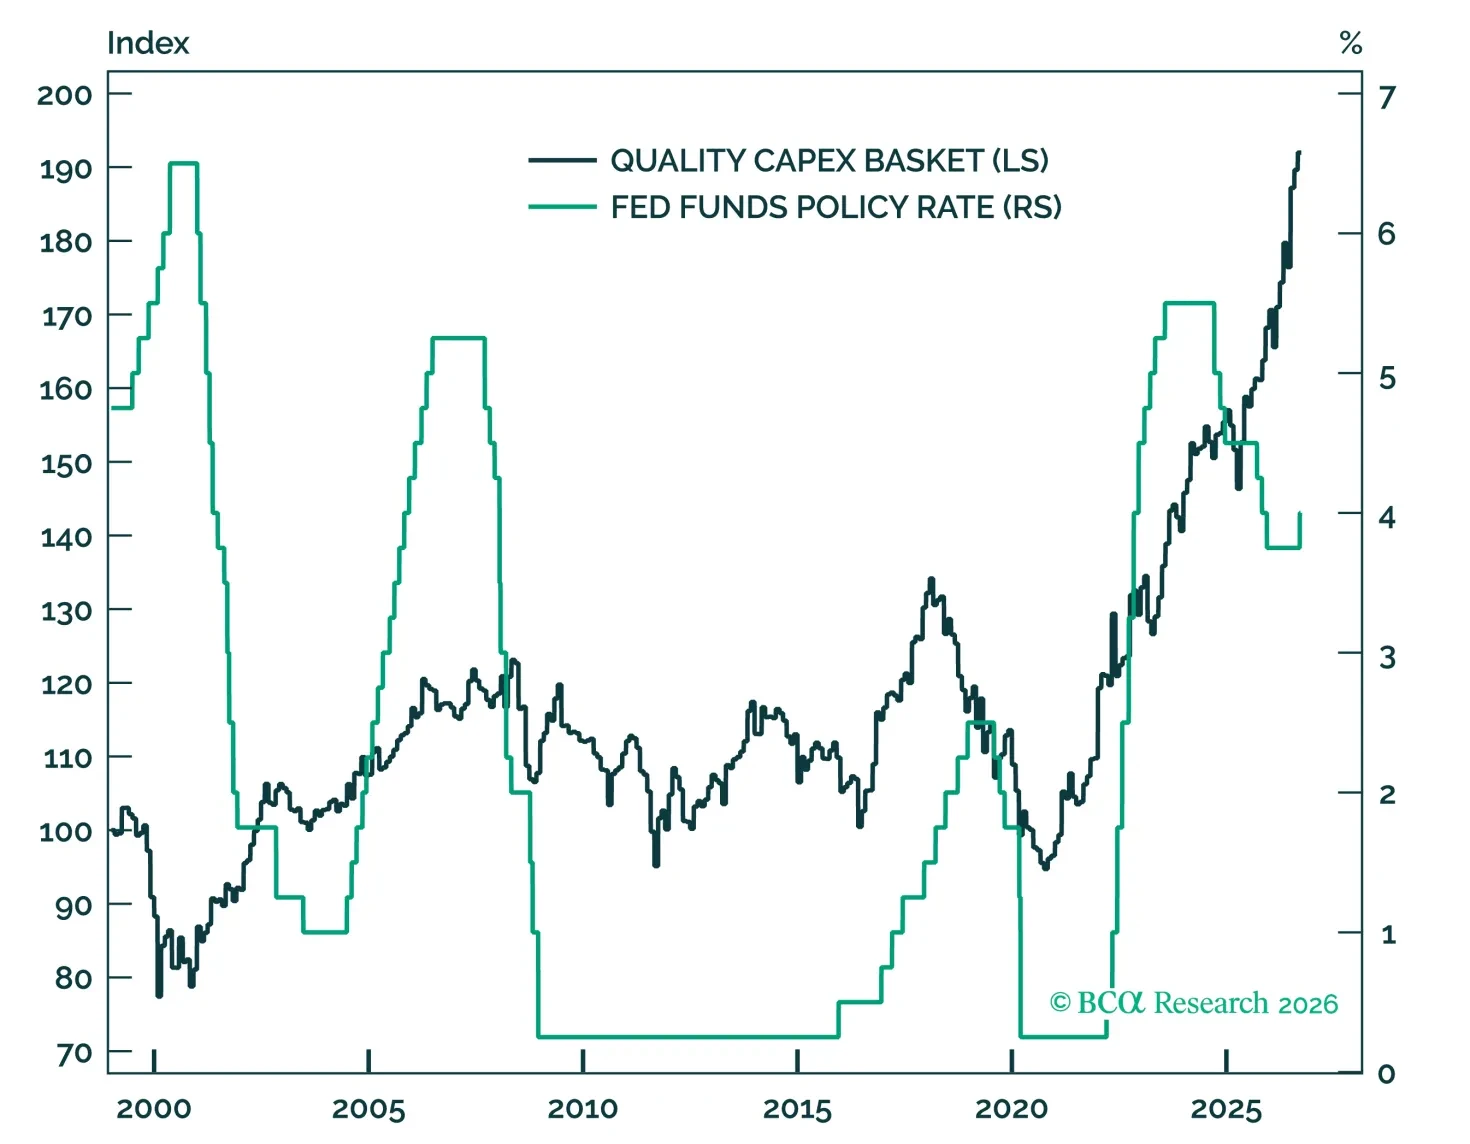
The Fed’s first hike is unlikely to be an equity-market cliff. Recent multiple compression has absorbed some of the rate shock, while bond risk premia, rate volatility, and inflation expectations remain contained. Stocks have typically climbed through hiking cycles, but we favor moving up in quality through our long/short Quality Capex Basket.
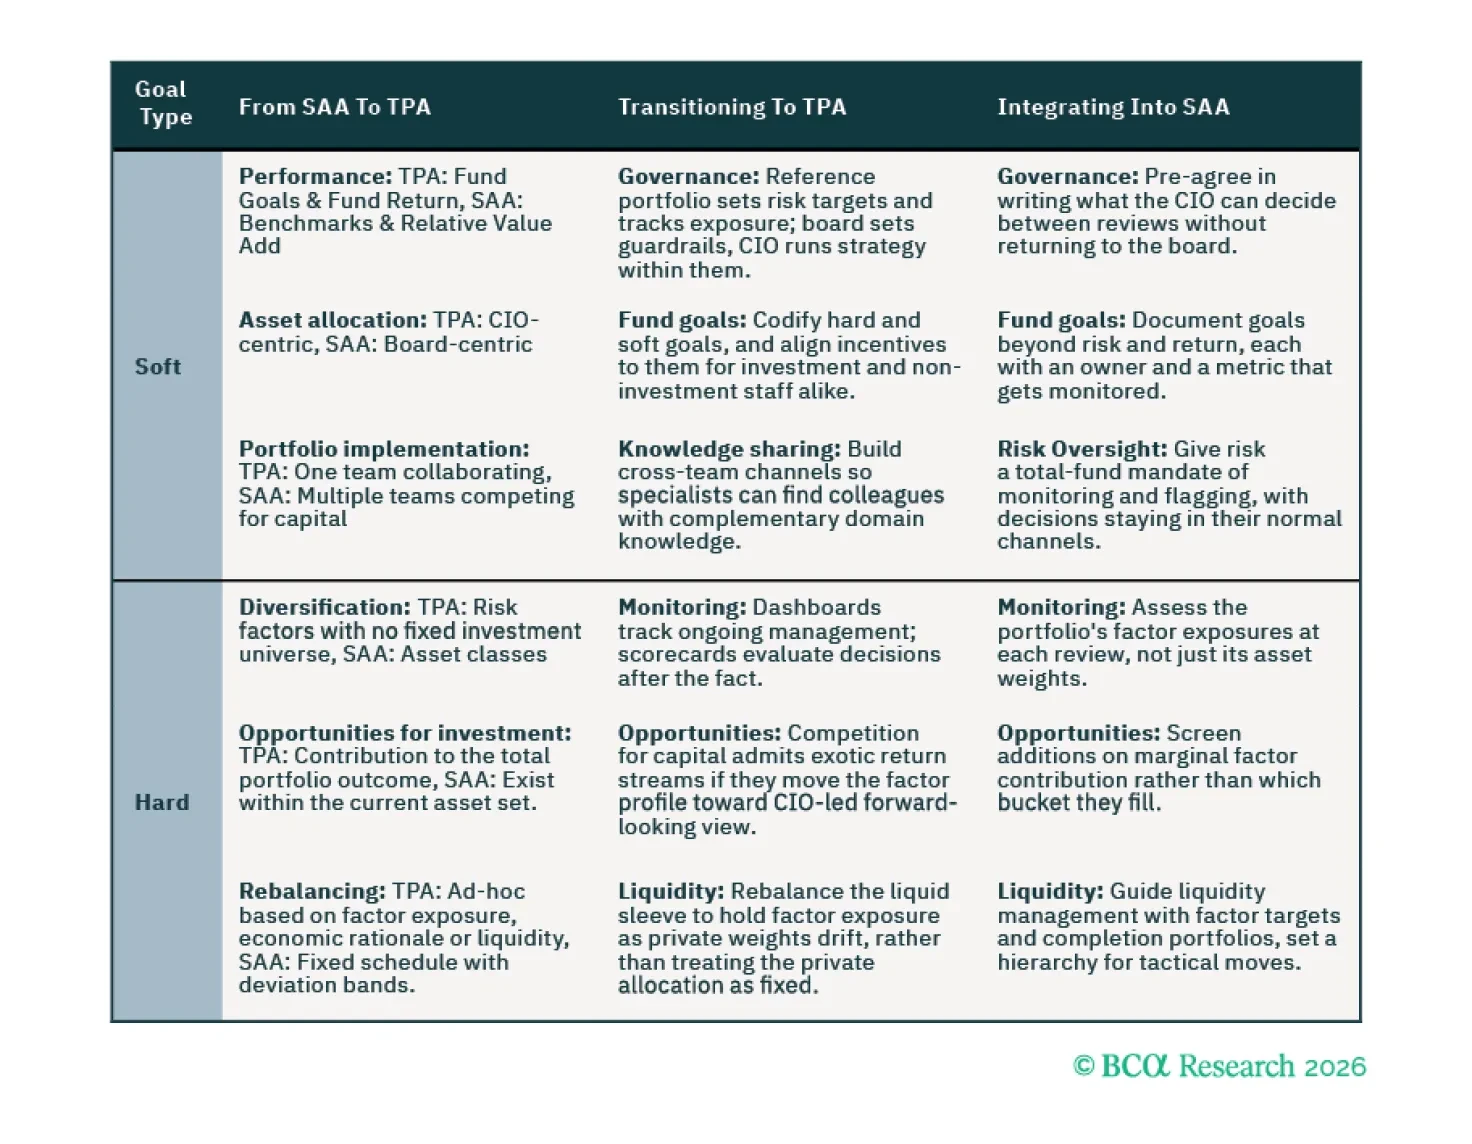
High-profile adoptions of the Total Portfolio Approach (TPA) and the often-cited outperformance of TPA funds have generated FOMO among funds following an SAA framework. Buzzwords and vague rulesets frustrate anyone trying to learn more. We combed through the TPA literature, built practical examples, and found that many components are just best practices, repackaged. Our suggestion: look past the hype, adopt what fits, ignore what doesn't.
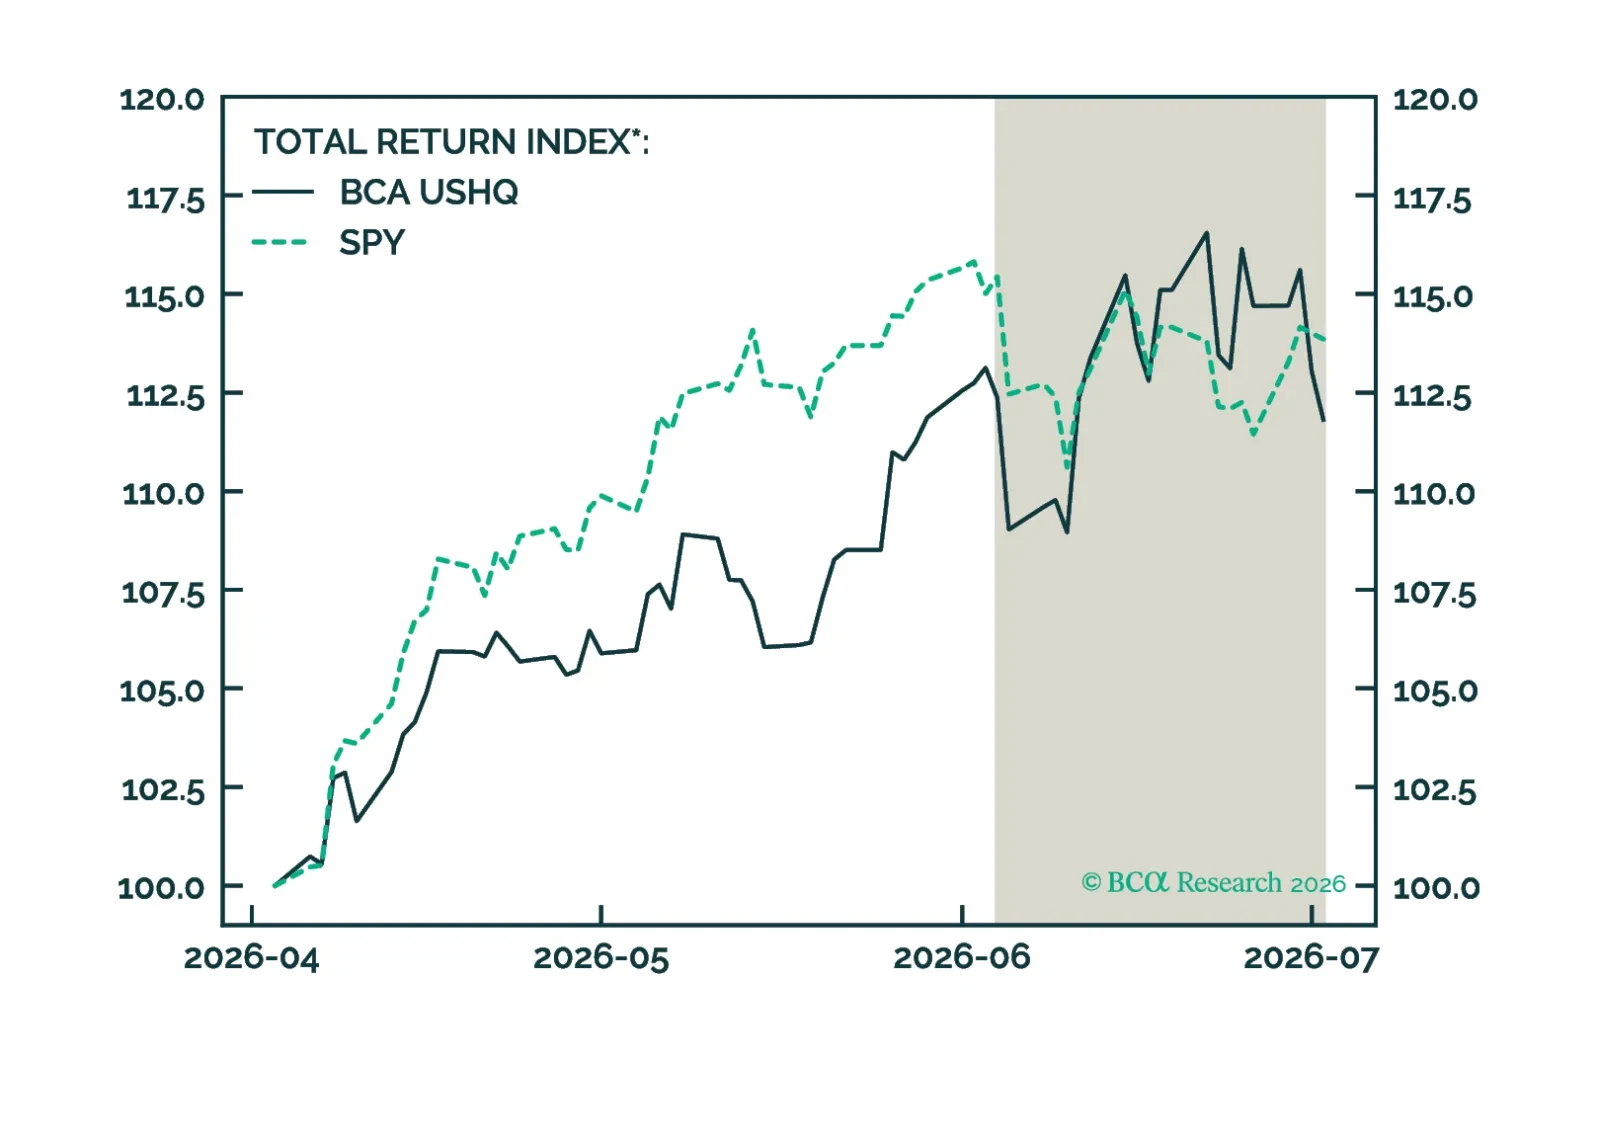
The US High Quality (USHQ) portfolio outperformed its benchmark through June, returning -0.50%, while its SPY benchmark returned -1.37%. On a trailing three-month basis, the USHQ portfolio’s performance was weaker than the benchmark, with USHQ underperforming by approx. 205bps.
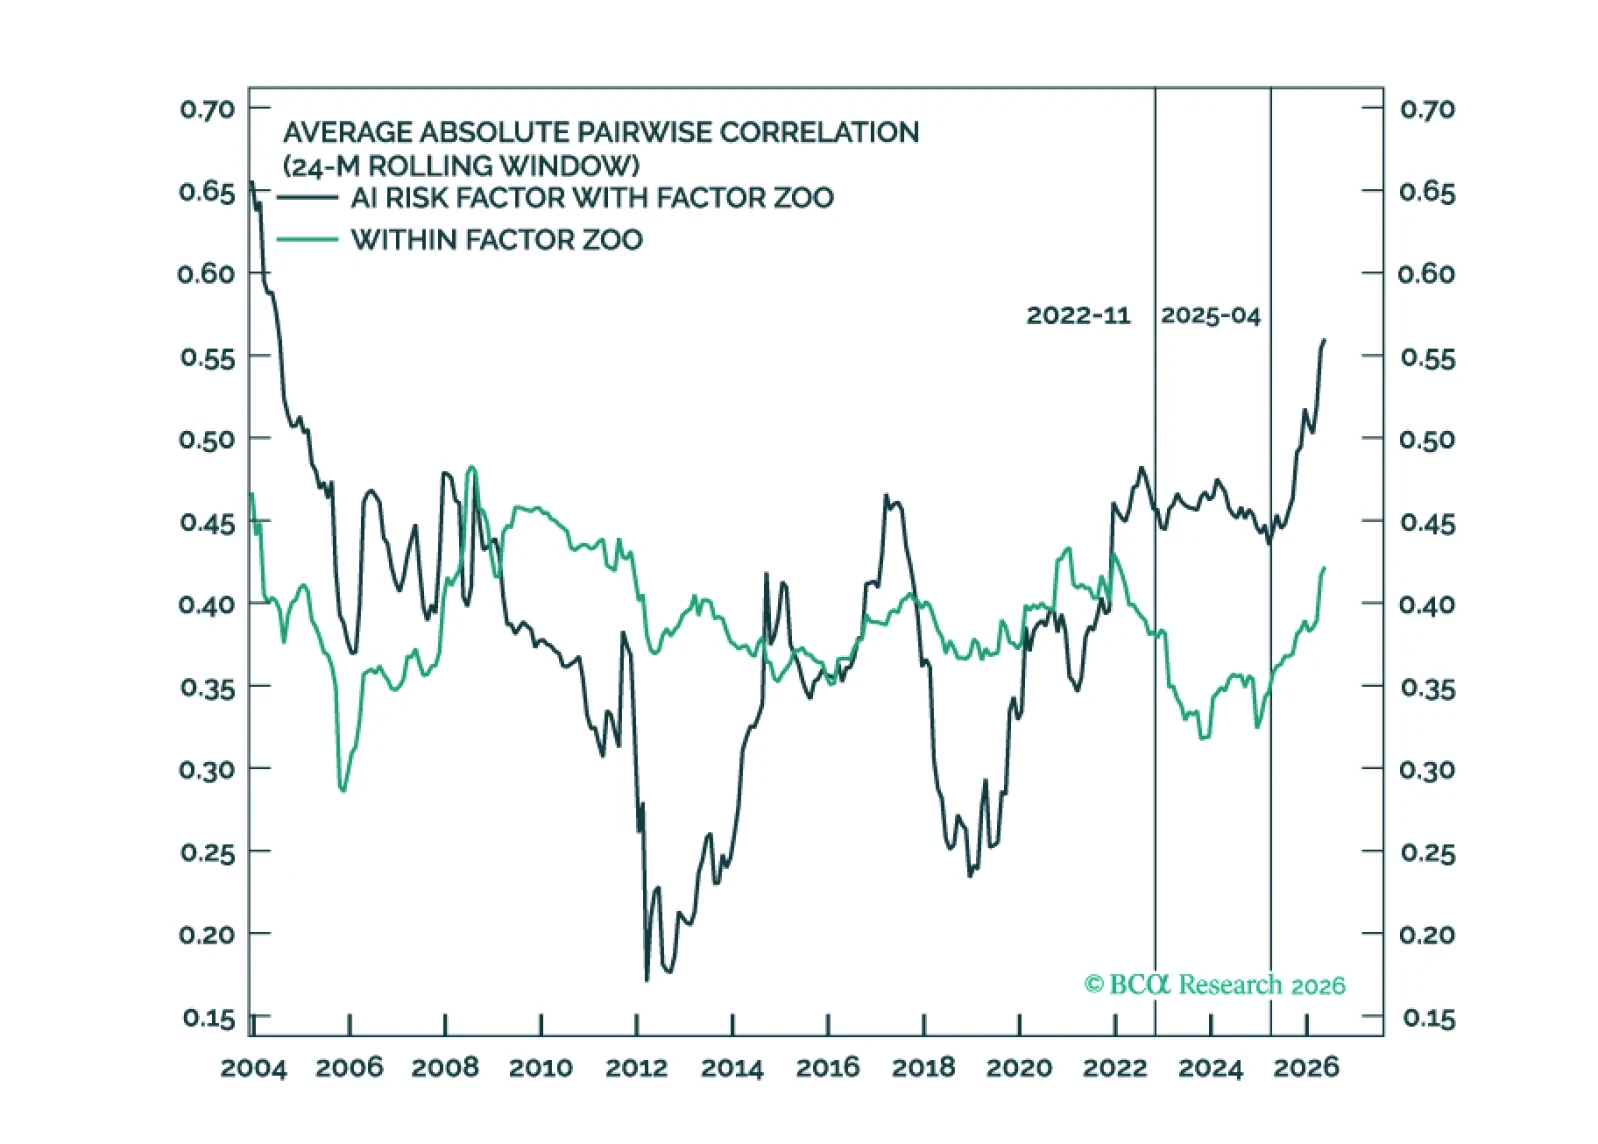
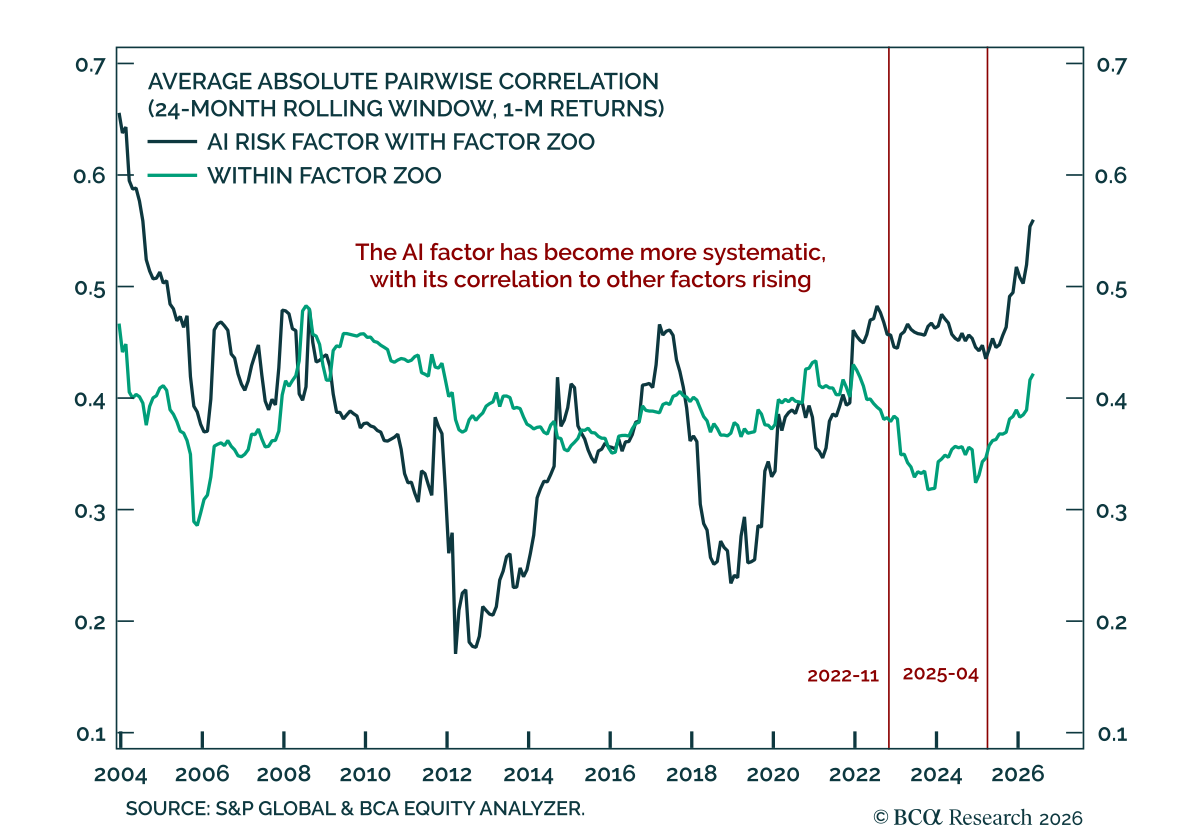
The S&P 500 has become increasingly concentrated. We know that. But the critical question is not how many stocks are driving the market; it is how many factors are driving stocks. We define an AI risk factor to test whether AI has become the dominant common exposure throughout much of the factor zoo.
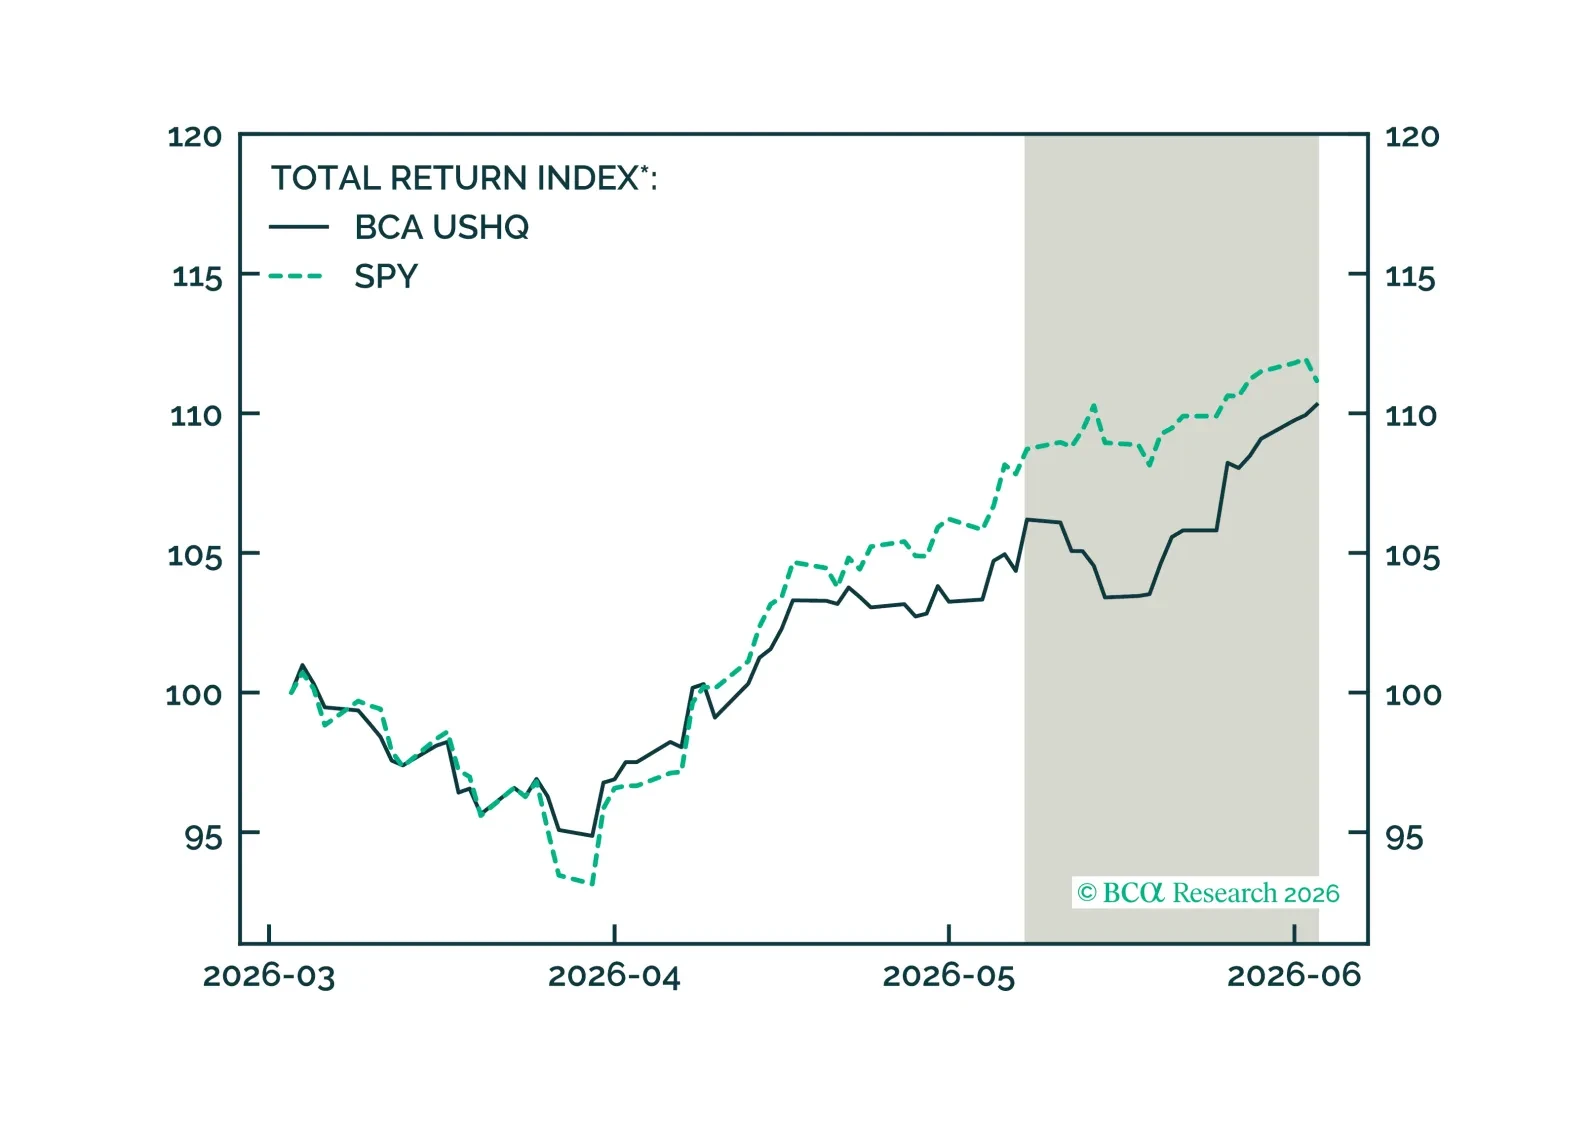
The US High Quality (USHQ) portfolio outperformed its benchmark through May, returning 3.88%, while its SPY benchmark returned 2.25%. On a trailing three-month basis, the USHQ portfolio’s performance was weaker than the benchmark, with USHQ underperforming by approx. 86bps.
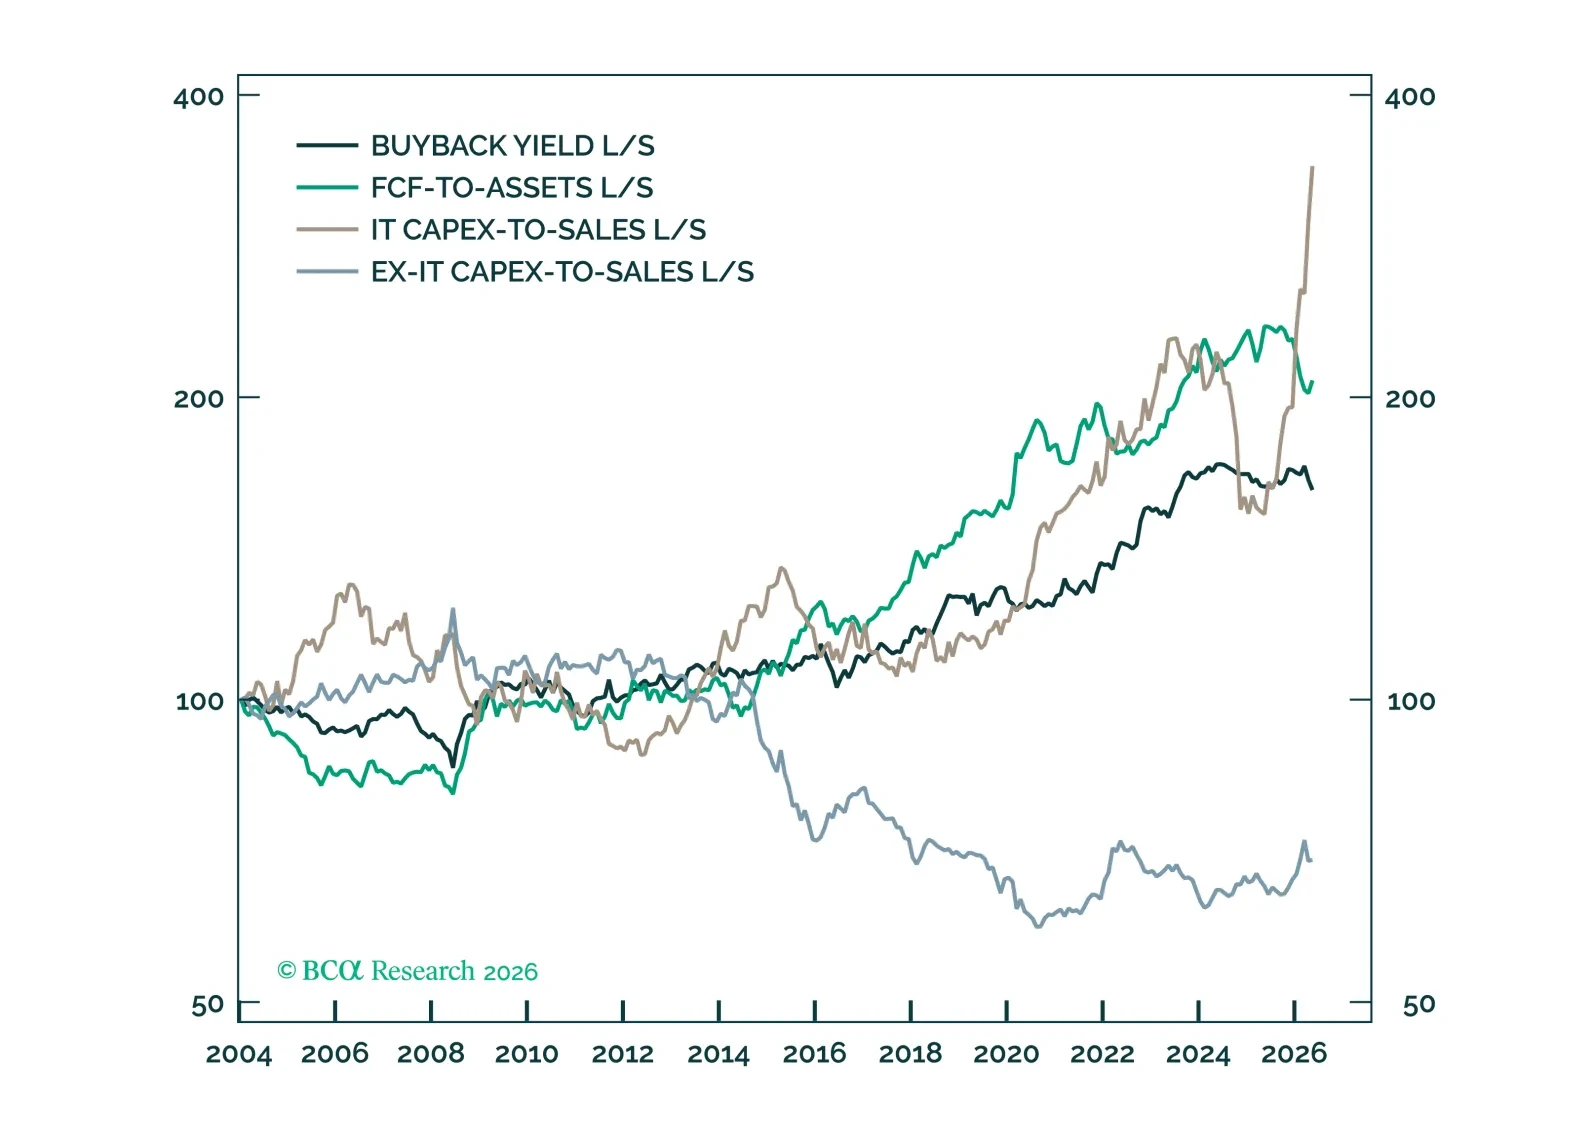
Tech, and increasingly the market, is moving from a cash-return regime to a reinvestment regime. After the GFC, investors rewarded companies that returned cash to investors. In the AI cycle, they are rewarding companies that put that cash back to work. This is not just a story of falling free cash flow; it is the mirror image of a market rewarding reinvestment. Tech has defined both regimes, revealing the old cash-flow “stars” as sector bets masquerading as alpha.
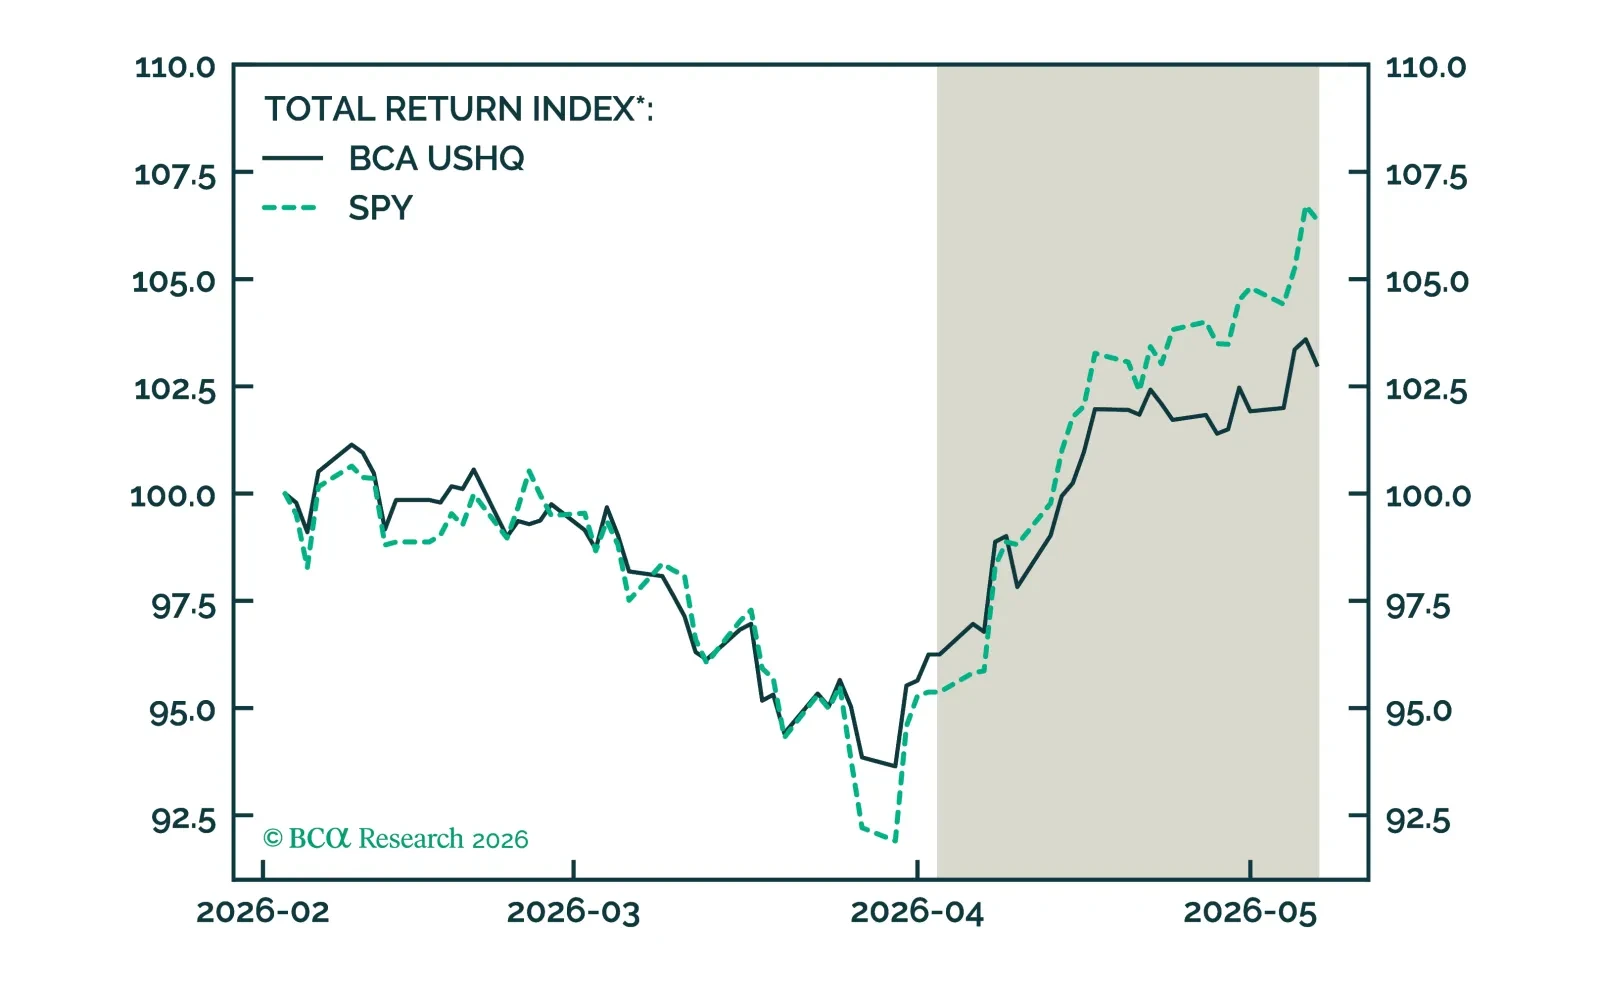
The US High Quality (USHQ) portfolio underperformed its benchmark through April, returning 7.02%, while its SPY benchmark returned 11.55%. On a trailing three-month basis, the USHQ portfolio’s performance was weaker than the benchmark as well, with USHQ underperforming by approx. 338bps.
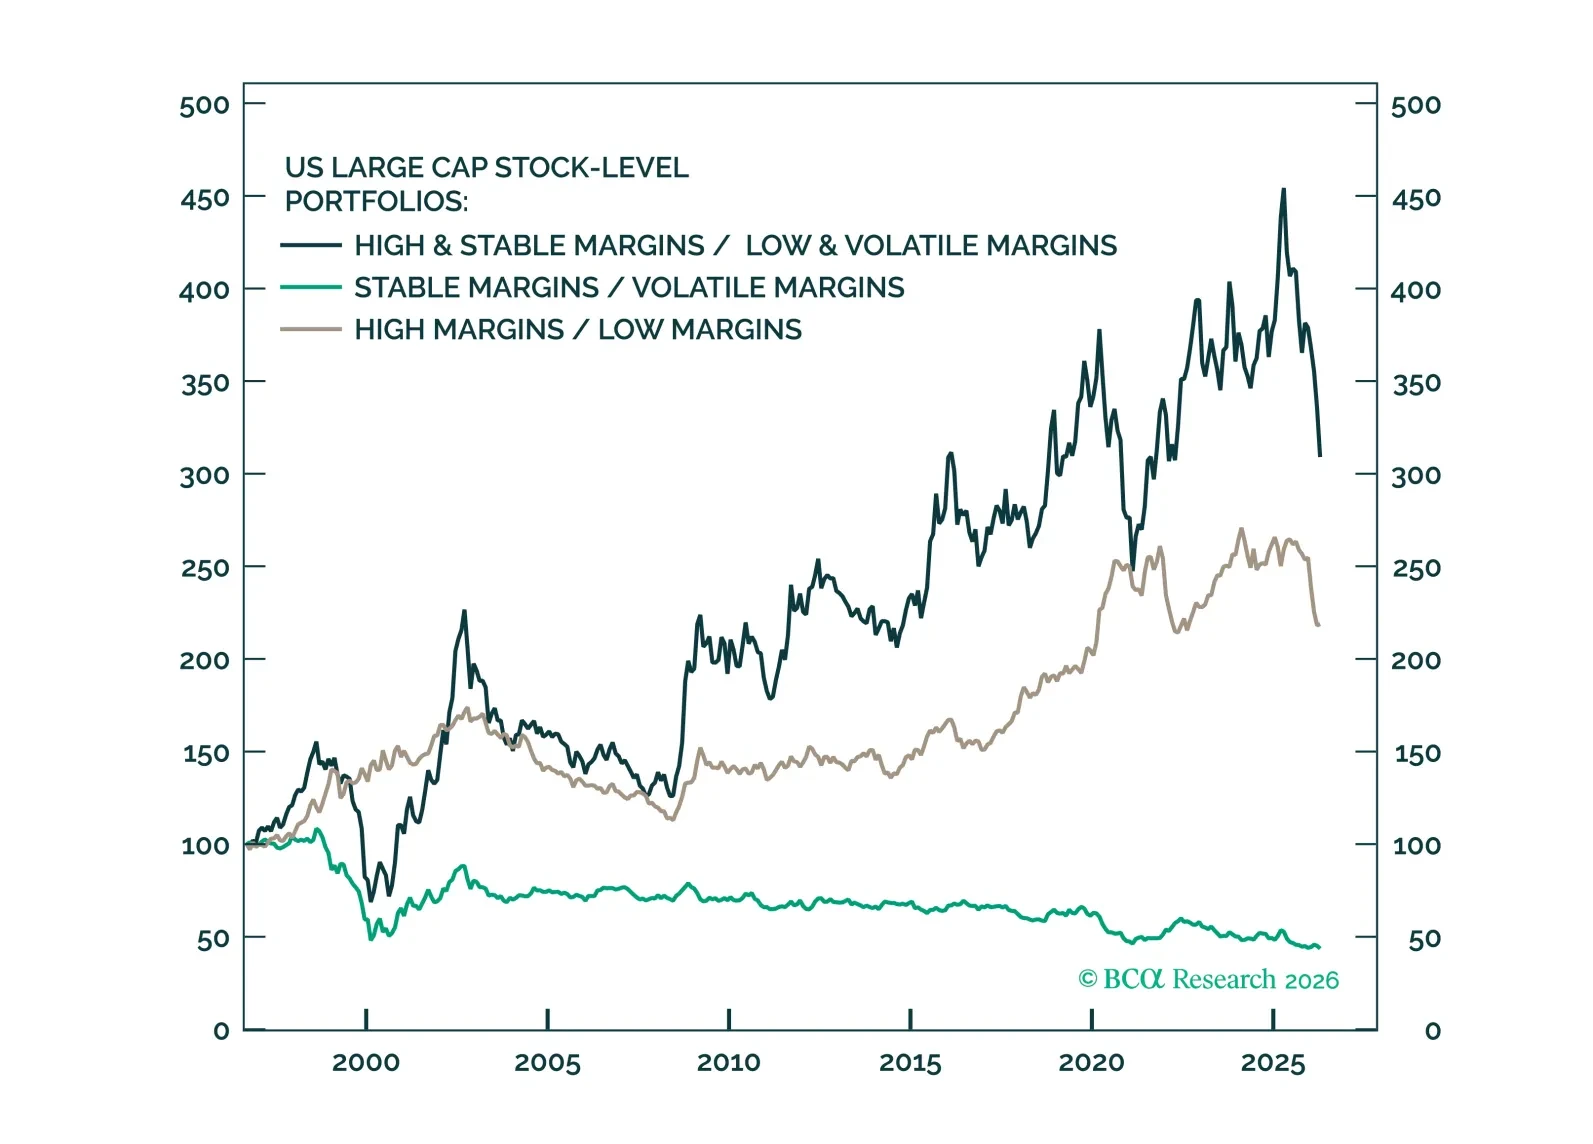
Based on our previous work on margins, three aspects of margins may matter to investors: their level, their variability, and their likely trend. We add two margin-themed baskets: a stock-level High & Stable vs. Low & Volatile basket and an industry-level AI-Supported vs. AI-Insulated basket.
Based on our previous work on margins, three aspects of margins may matter to investors: their level, their variability, and their likely trend. We add two margin-themed baskets: a stock-level High & Stable vs. Low & Volatile basket and an industry-level AI-Supported vs. AI-Insulated basket.