AI
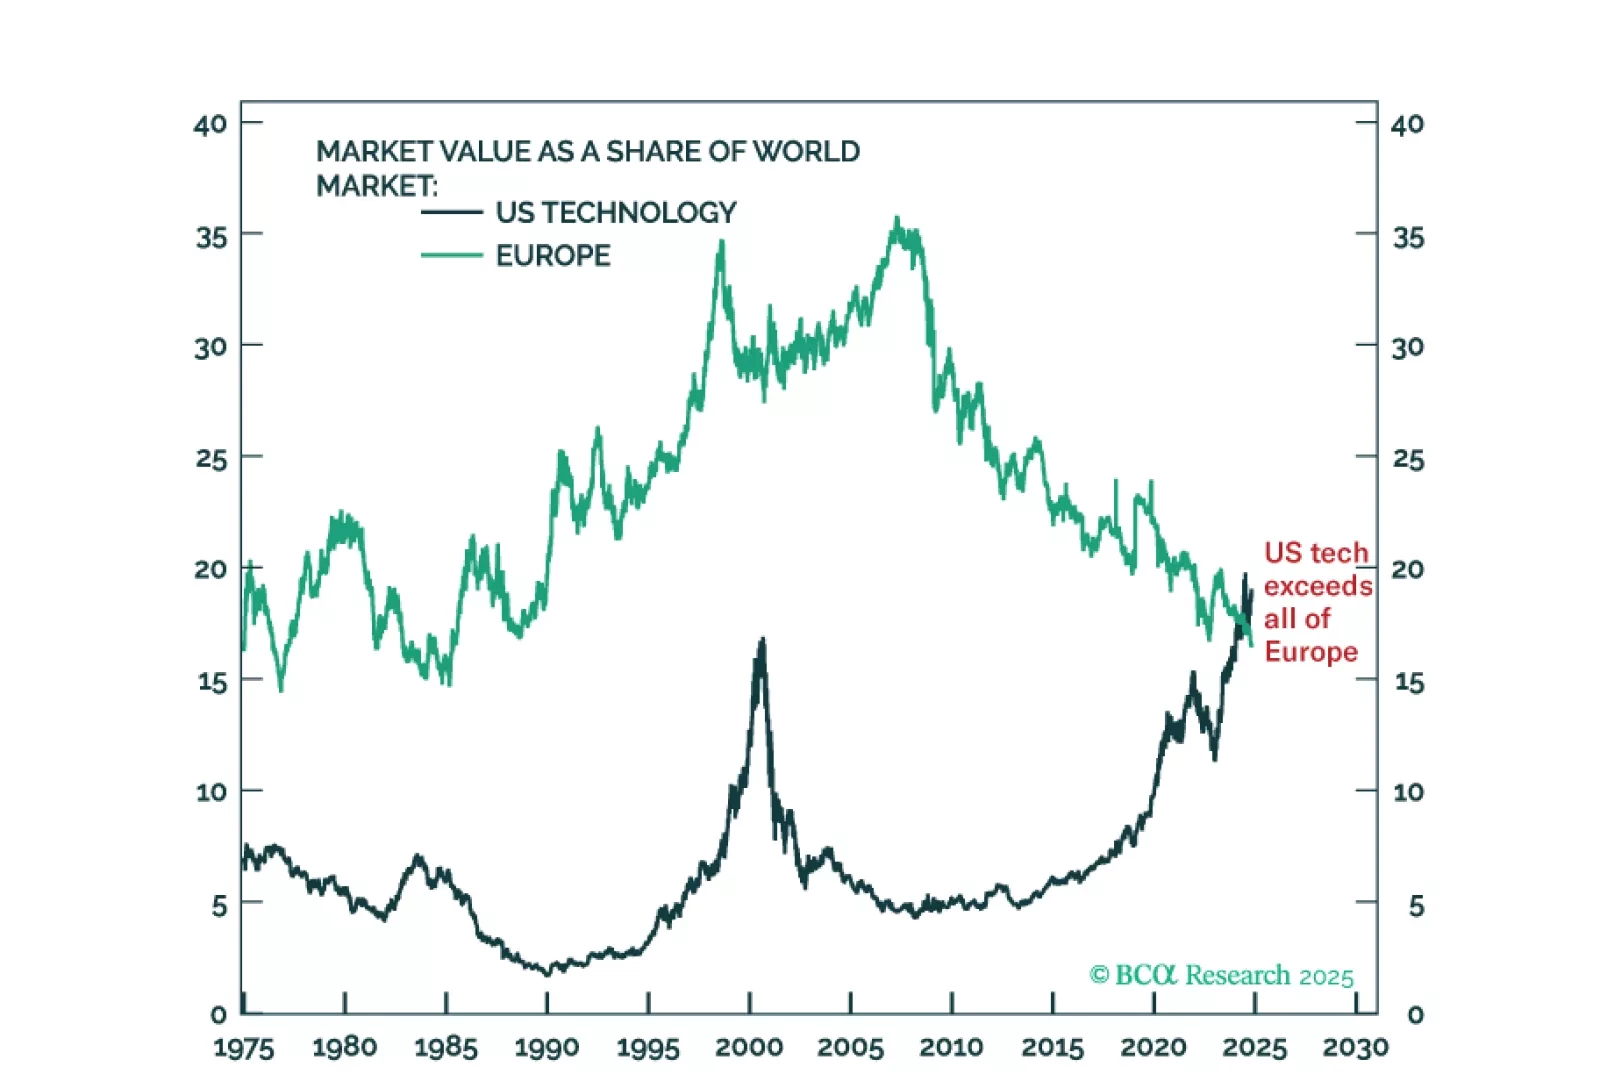
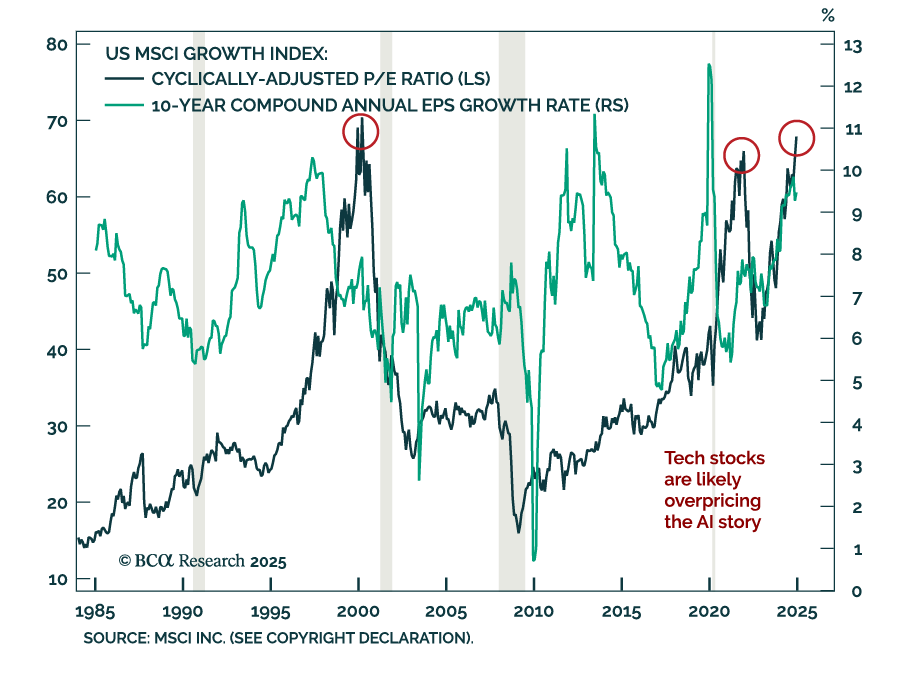
US tech stocks as a share of world stock market capitalisation is at an all-time high that exceeds even the peak of the dot com mania in 2000. At the other extreme, Europe’s share in the world stock market is at a 50-year low. While I am optimistic about the potential of generative-AI, I am not as manically optimistic as the market. And while I am concerned about the current malaise in Europe’s economy and politics, I am not as depressingly concerned as the market. For me, the AI mania combined with Europe’s current malaise is a 50-year mispricing… and opportunity. Plus: go tactically short coffee.
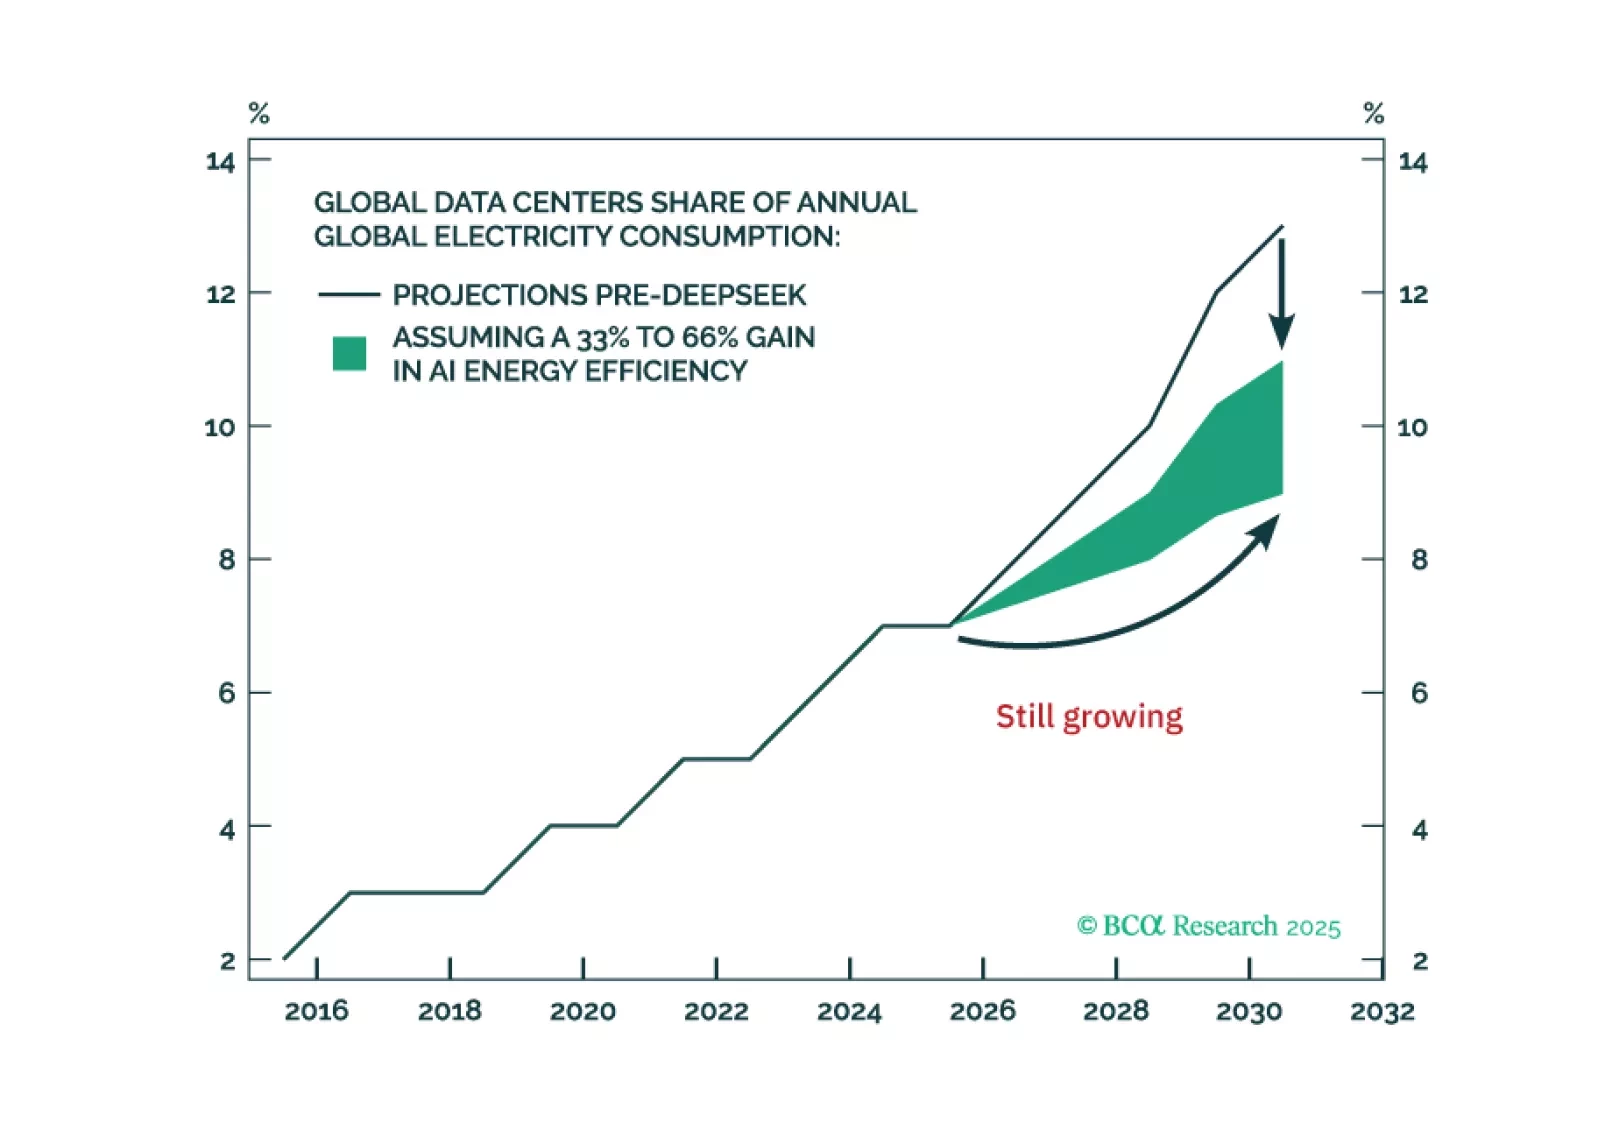
AI will continue to support future nuclear energy demand. Investors should view the recent pullback as a buying opportunity.
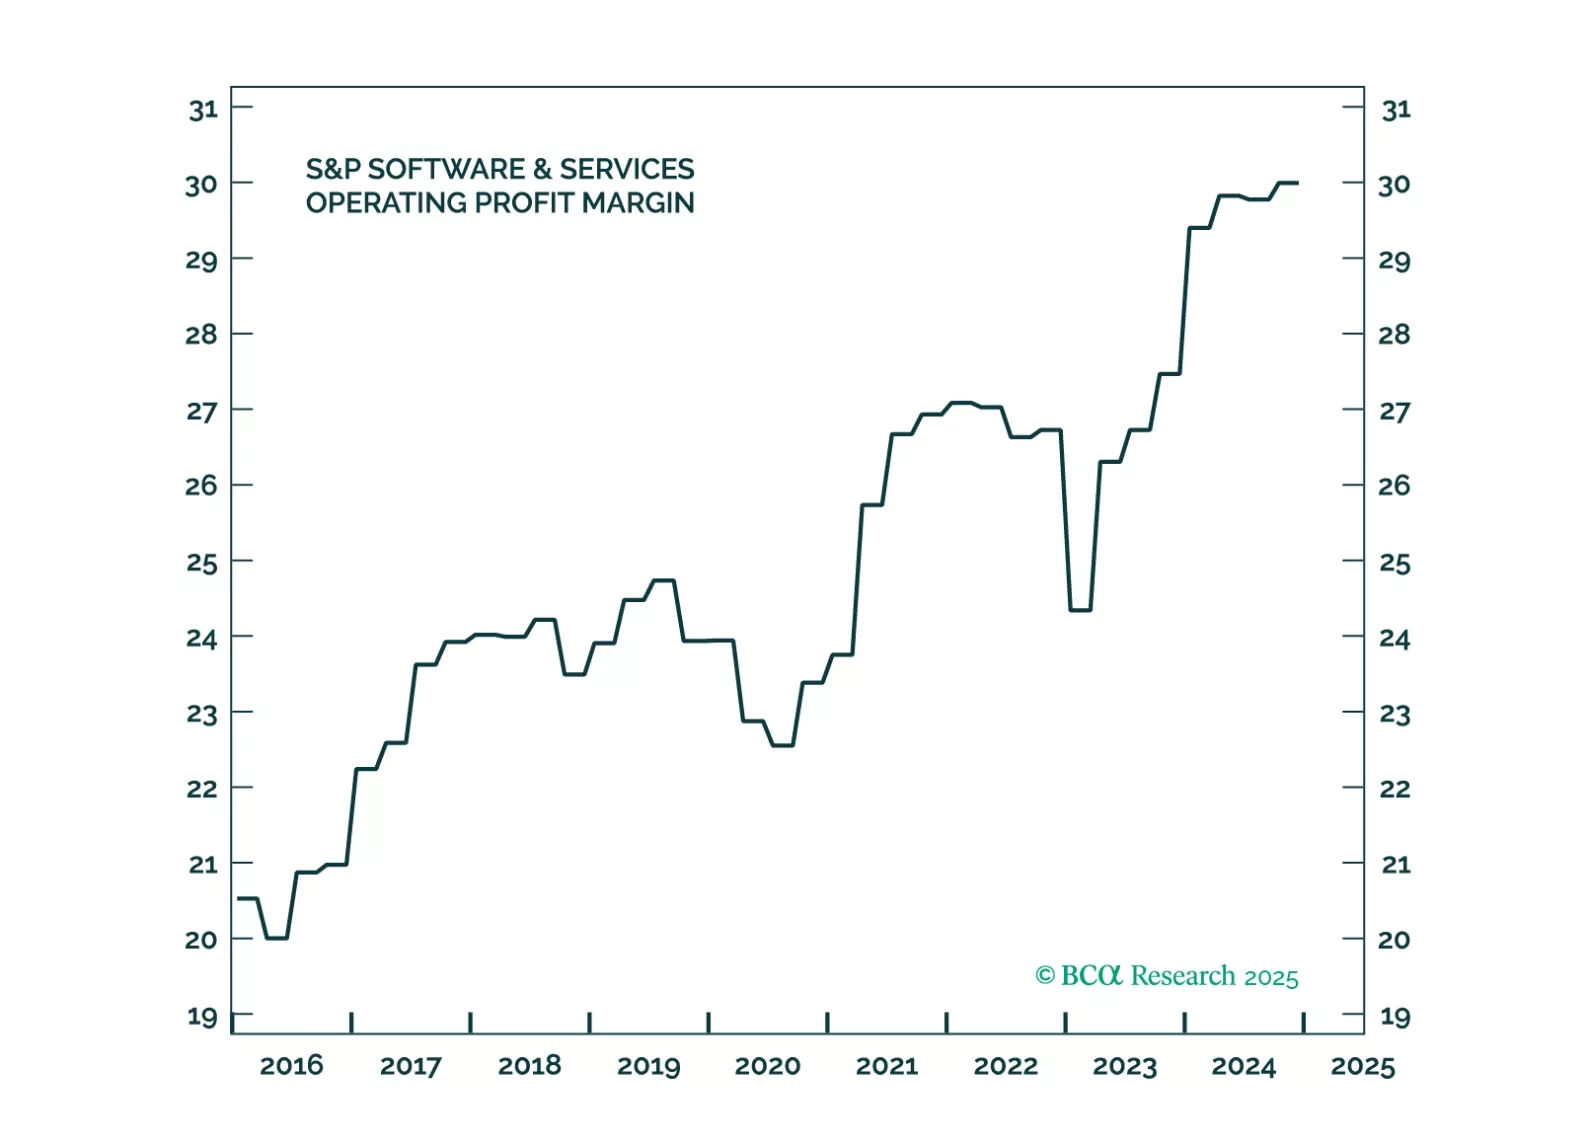
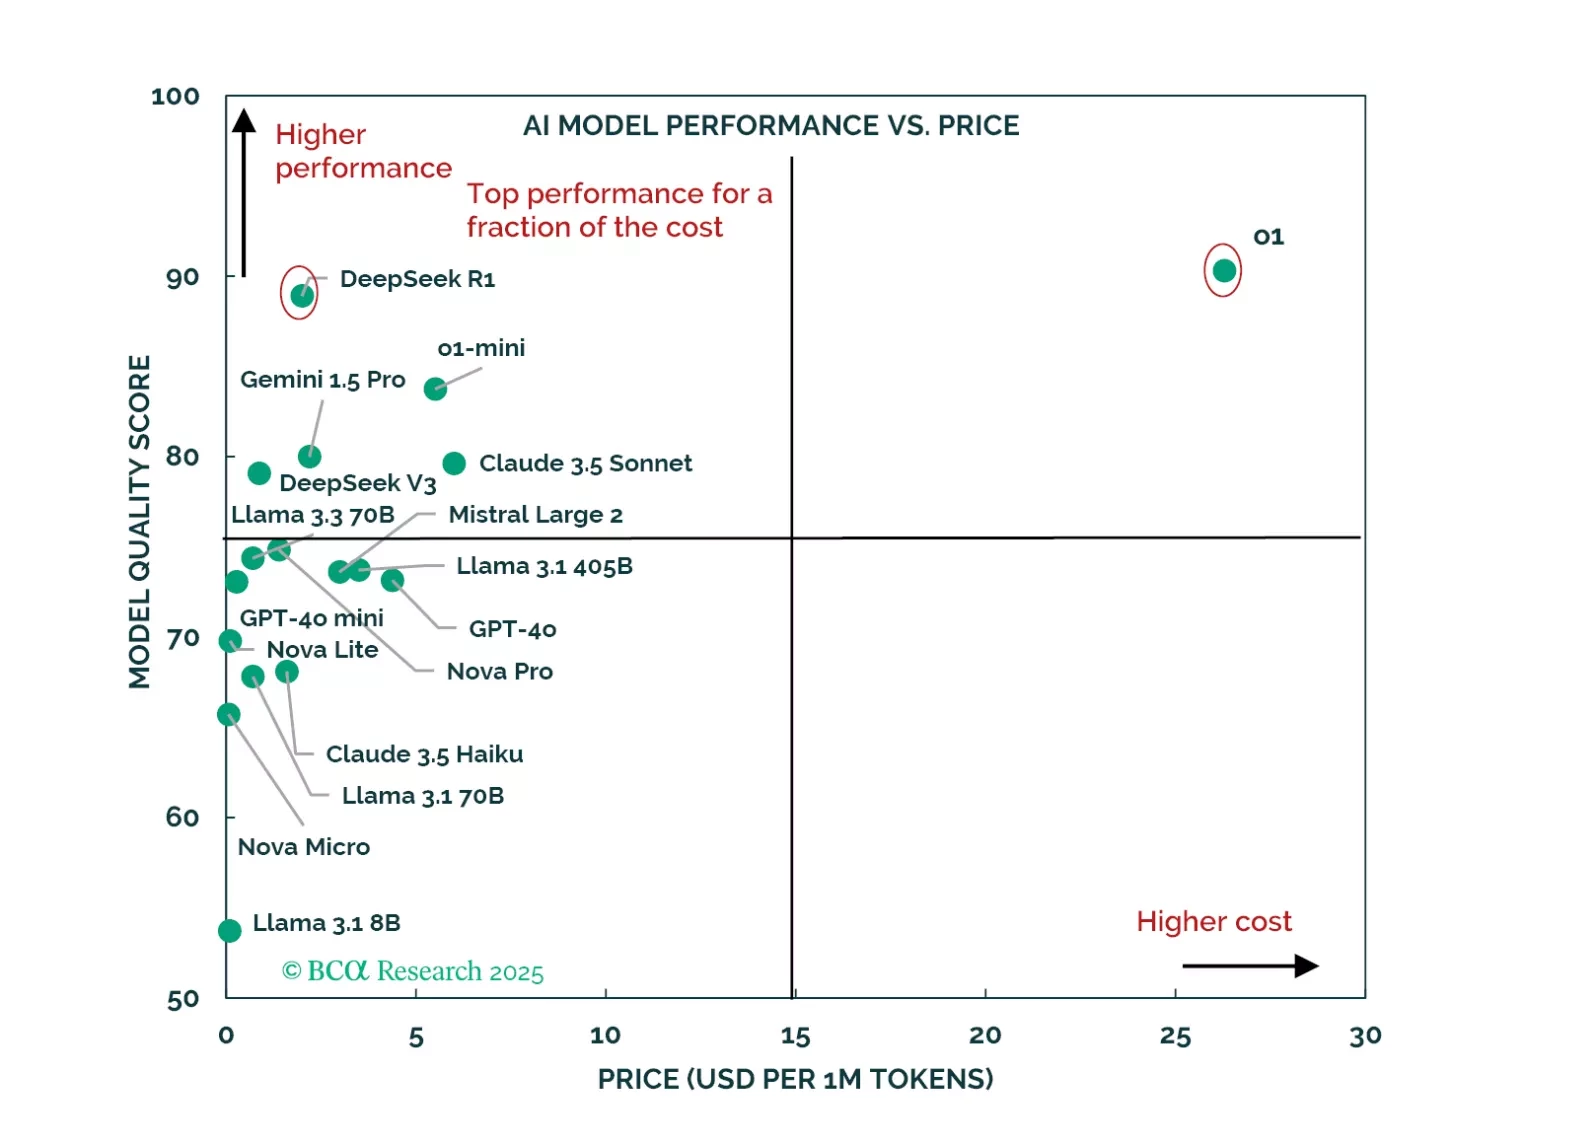
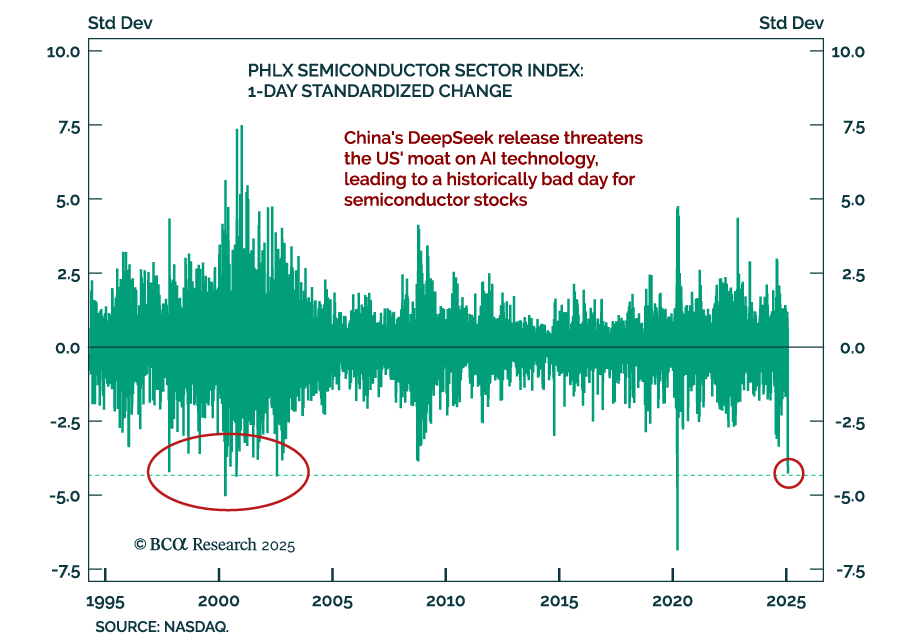
GAI is a double-edged sword for S&S. Companies without GAI applications find that GAI crowds out their offering from IT budgets. In contrast, companies with GAI offering find that high inference costs make new products less lucrative than the cloud-subscription model that has propelled their margins to all-time highs. The effect of DeepSeek on the industry is generally positive, as it will help it lower costs of GAI-based software products.
In this Special Report, we share our “thoughts from the field,” gathered during a week of panels and conversations at the World Economic Forum in Davos. Our main takeaways include China’s rising global presence (despite its deceptive absence at the forum), the rising consensus on AI investment as the new corporate best practice, mounting stakes in the AI race, and the global shift toward MAGA-branded ideology as President Trump enters his second term. We also reflect on the surprising lack of geopolitical focus in the discussions and the forum’s broader role in the global geopolitical landscape.
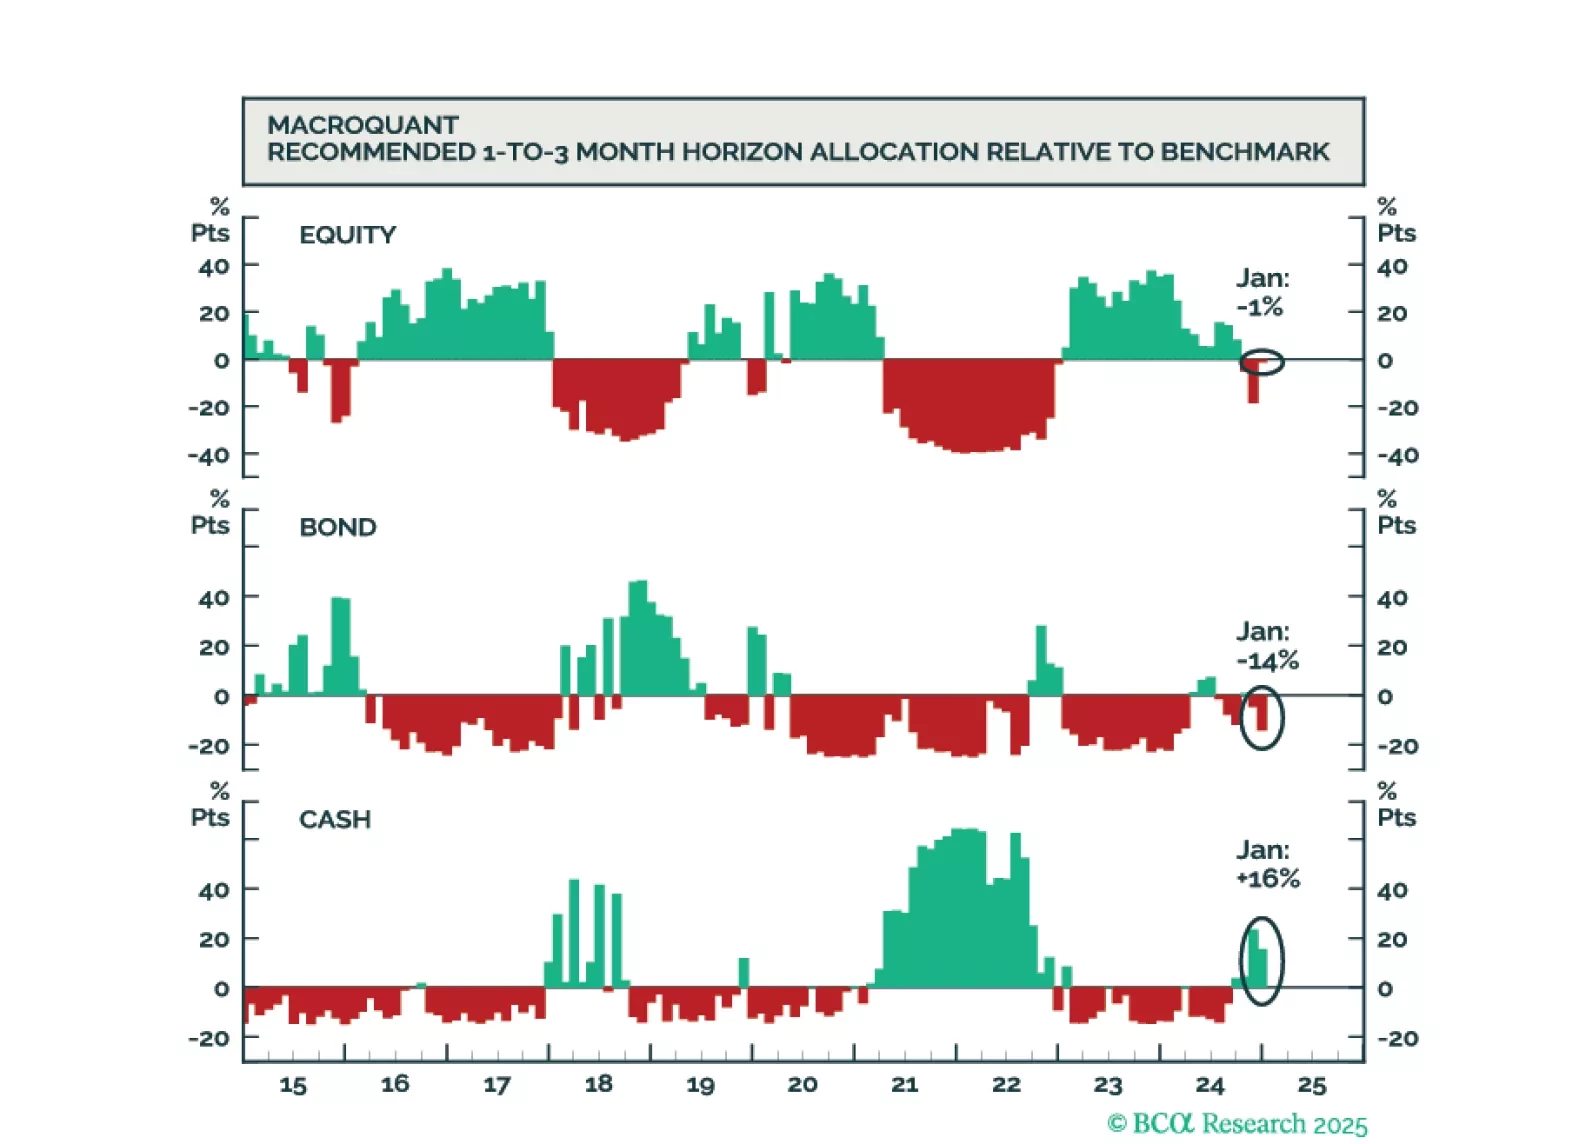
While the US economy could remain upright on the tightrope for a while longer, it will inevitably fall, leading to a major bear market in stocks. We will be looking to our MacroQuant model for guidance on when to turn fully defensive. We are not there yet.
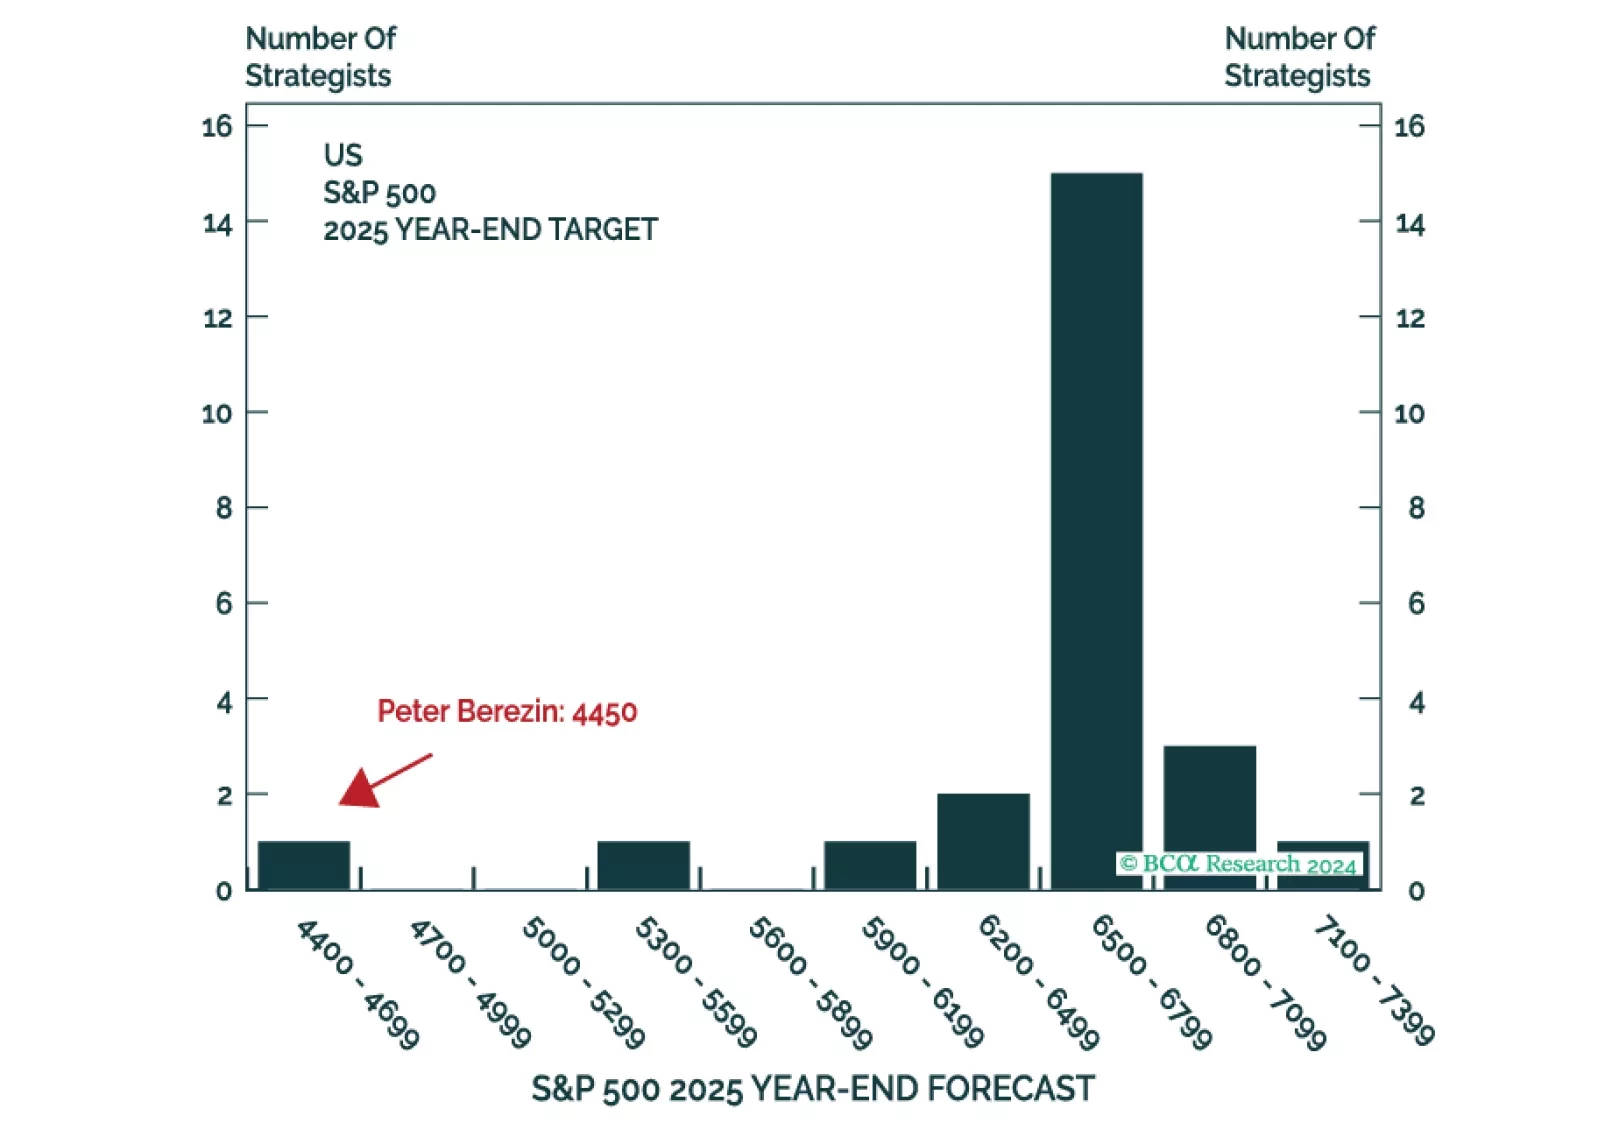
This is the time of the year when strategists are busy sending out their annual outlooks. Here on the Global Investment Strategy team, we decided to go one step further. Rather than pontificating about what could happen in 2025, we decided to harness the power of the multiverse to tell you what did happen (in at least one highly representative timeline).
Next week, please join me for a Webcast on Tuesday, December 17 at 10:30 AM EST (3:30 PM GMT, 4:30 PM CET) to discuss the economy and financial markets.
And with that, I will sign off for the year. I wish you and your loved ones a very happy and healthy 2025. We will be back in the first week of January with our MacroQuant Model Update.
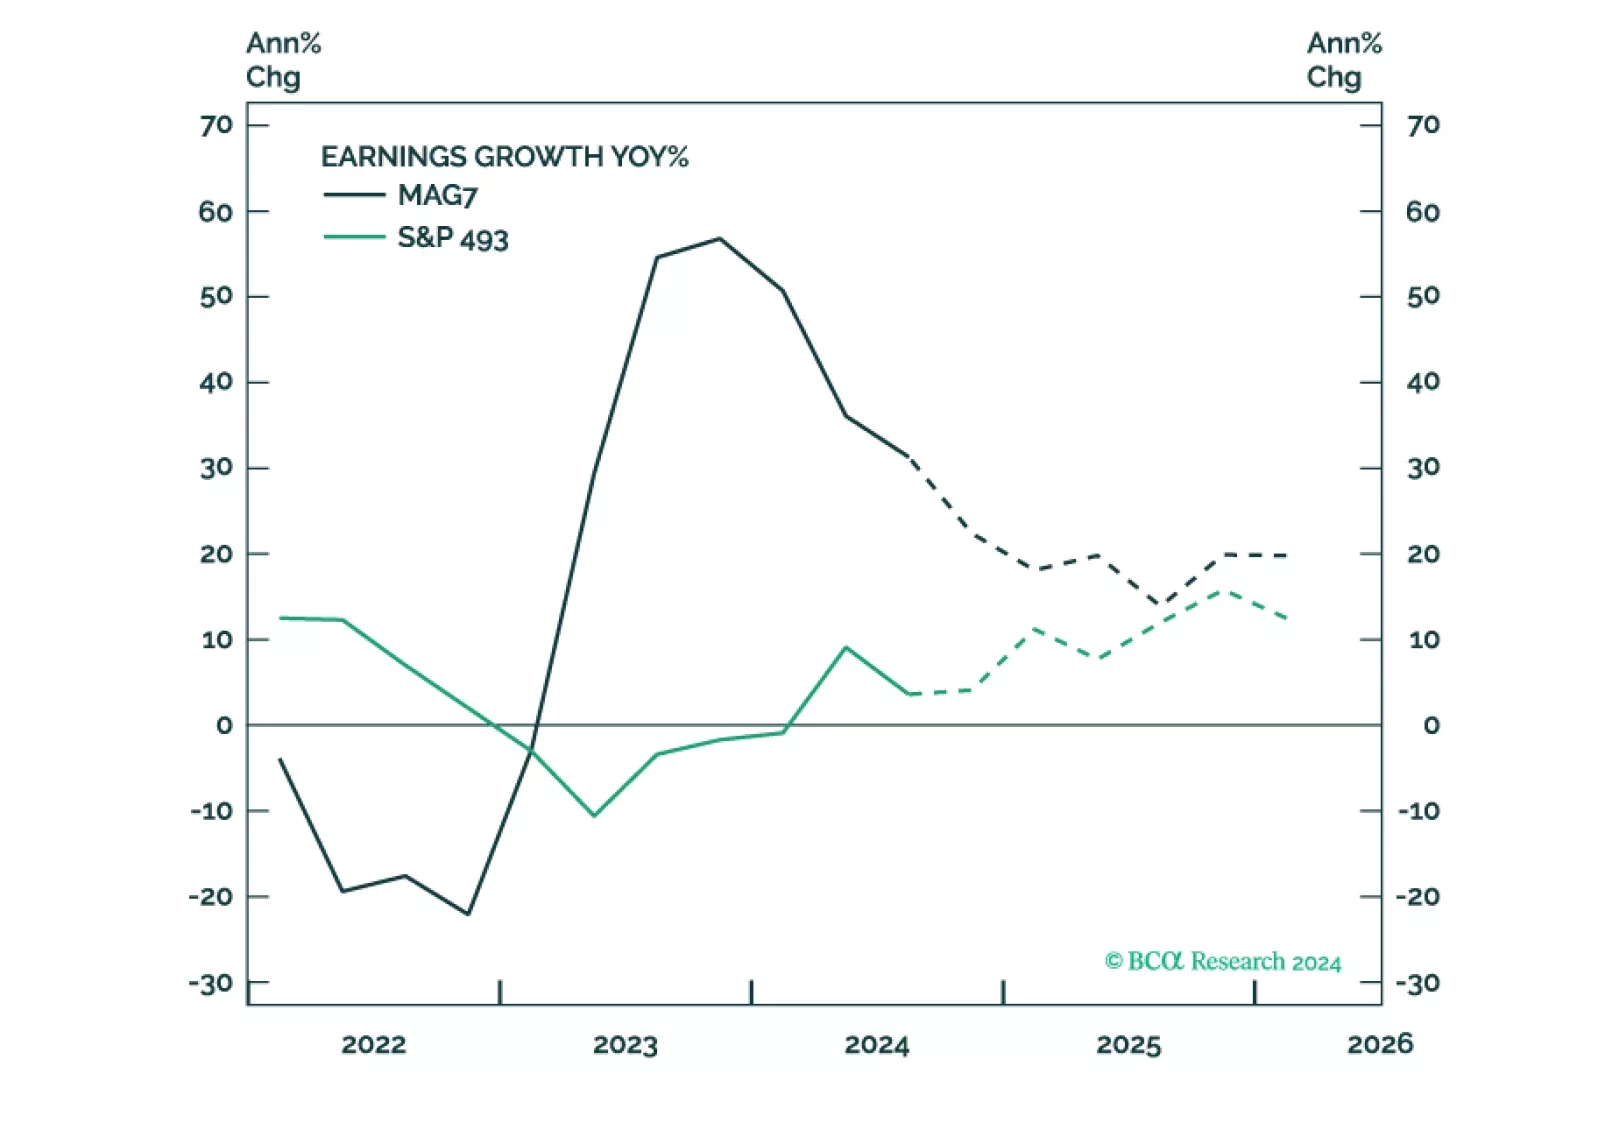
Trump's policies aim to support domestic producers and will be pro-growth and inflationary, at least initially. This environment is supportive of equities. Earnings will likely be strong, but elevated valuations make equities prone to a correction. Earnings growth broadening will translate into performance broadening – the S&P 493, Cyclicals, Value, Small and Mid are likely to outperform.