Aluminum
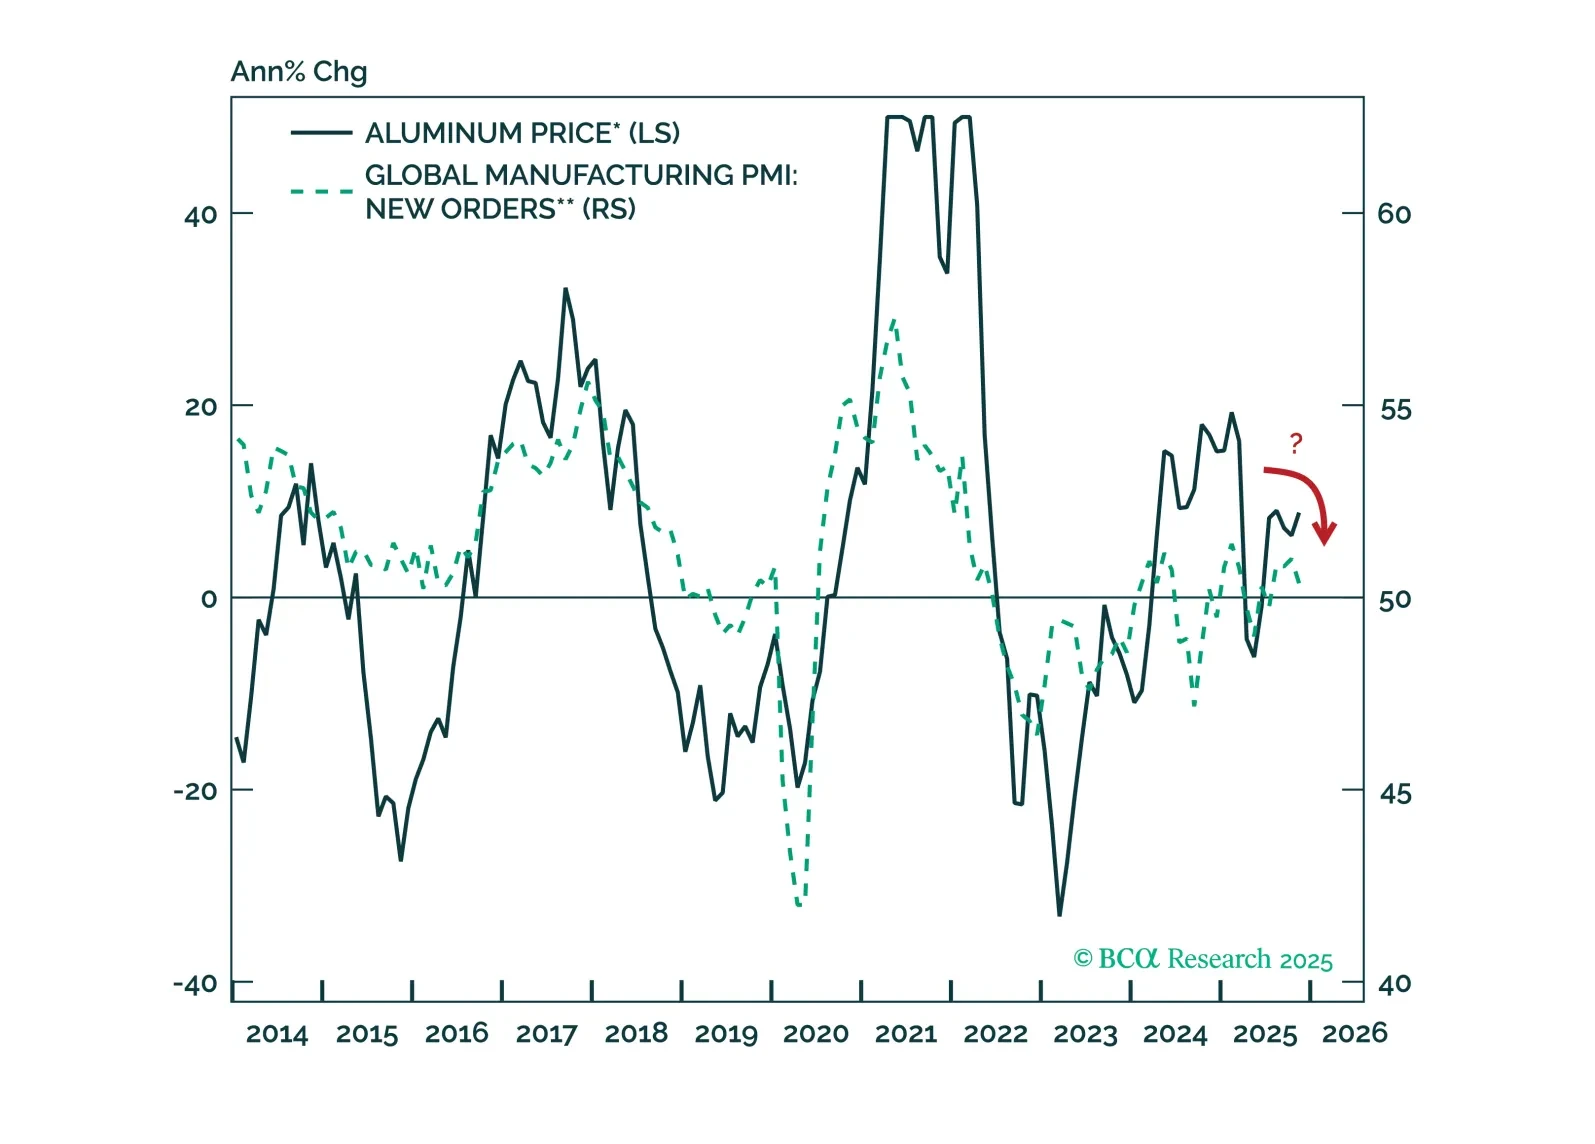
The forces that have recently propelled aluminum prices will remain supportive over the near term. However, beyond the coming months, aluminum prices will retreat as bearish cyclical pressures overwhelm over the course of 2026.
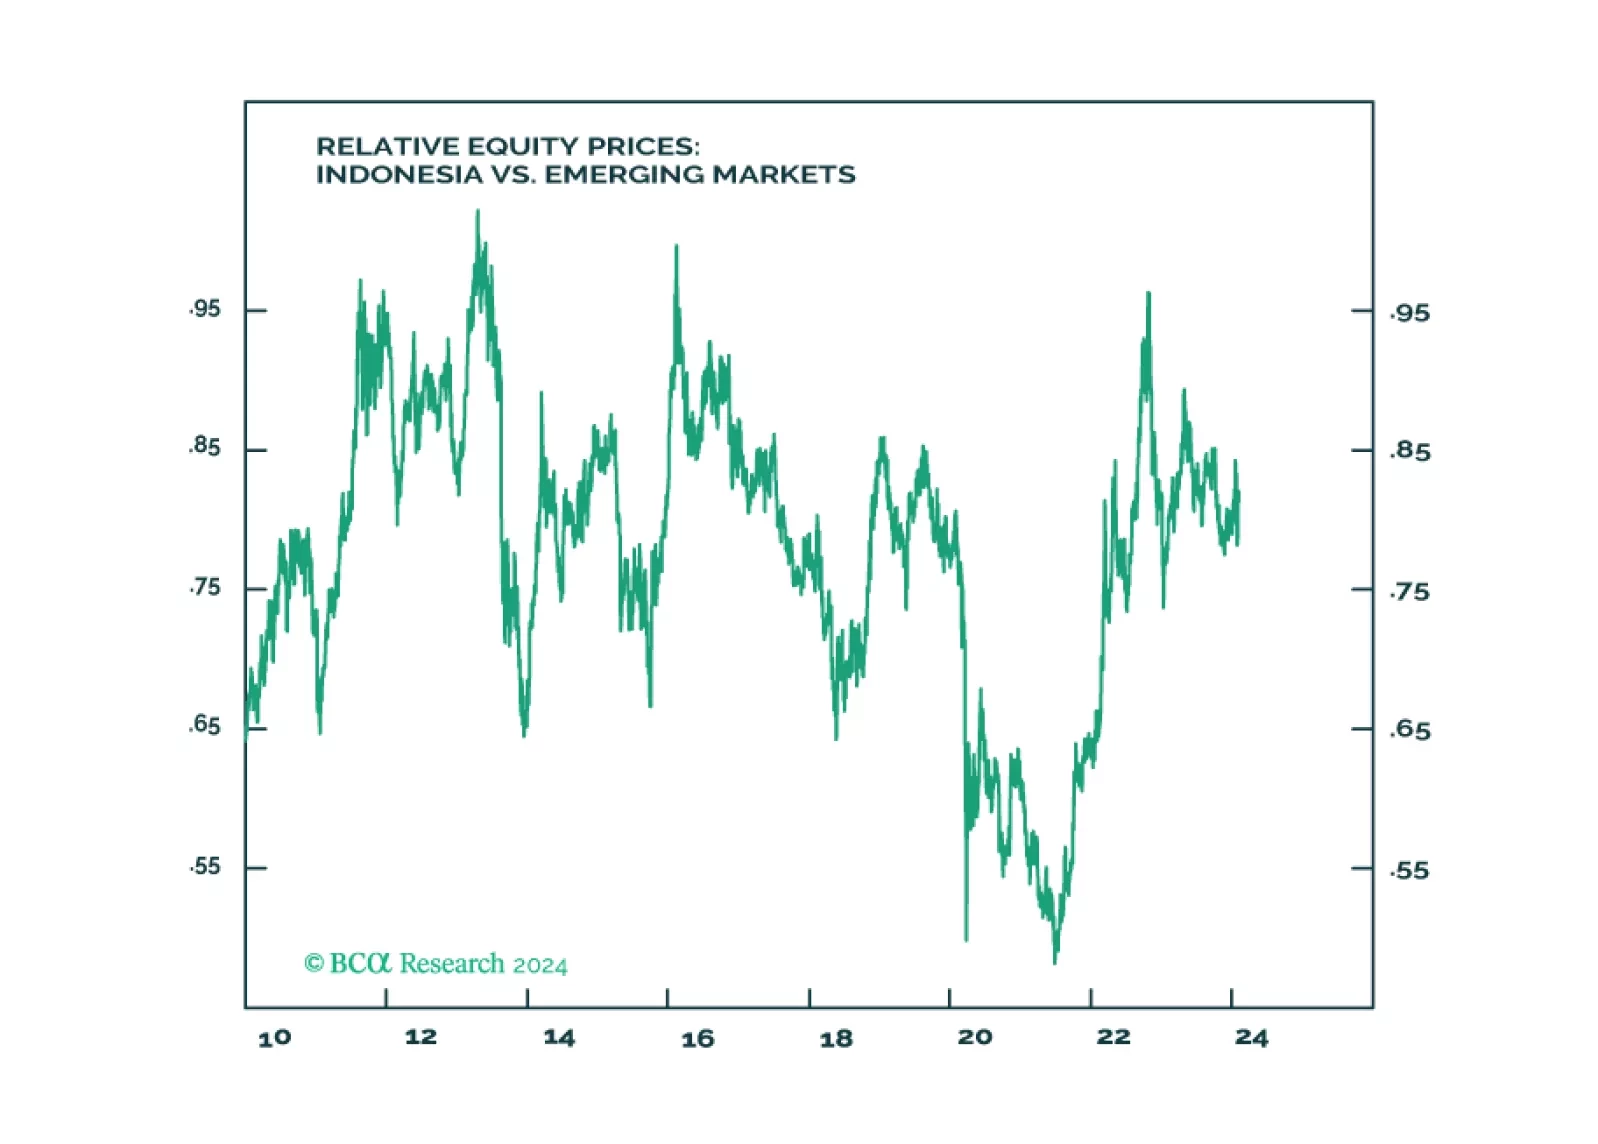
Indonesia will not revert to dictatorship. Yet the guardrails against authoritarianism are also constraining the actions of the next government in tackling near term domestic and regional challenges. For long-term positioning, use potential selloff from a “dictatorship scare” to build position as structural outlook for Indonesia is positive due to the China-West divorce and the global energy transition.

Executive Summary EU Metal Industry Under Threat Russia’s threat to cut off all remaining exports of natural gas to the EU via Ukraine will further imperil the bloc’s struggling metals industry, particularly aluminum smelting – where half of its capacity already has been shut – and zinc refining. The EU will have to prioritize energy security over its renewable-energy goals, given the challenges its manufacturing industries will confront for the next 3-5 years. Surging imports of raw copper concentrates and unwrought metal will consolidate the global dominance of China’s copper refiners, which sharply increased their treatment and refining charges this week. The US likely will see more investment in metals mining and refining on the back of the EU distress, which realistically cannot be addressed until gas and power prices fall to levels that allow them to sustain their operations. Bottom Line: Ongoing supply shocks to the EU’s base-metals industry will force the bloc to prioritize energy security over its renewable-energy goals. This will drive the bloc’s demand for liquified natural gas (LNG) and oil higher, even after short-term measures to increase LNG intake and distribution capacity are completed over the next 2-3 years. We expect the equities of oil and gas producers to outperform metals miners over this period. After being stopped out, we will be re-instating our long XOP ETF position at tonight’s close. Feature Earlier this month, Eurometaux, the EU metals lobbying group, published a memo to the European Commission drawing attention to “Europe’s worsening energy crisis and its existential threat to our future.”1 This is not hyperbole. At the heart of the industry’s woes is a chronic shortage of energy – in any form – for industrial use. Utilities are signing long-term LNG supply contracts to address this shortage, but they can expect to wait 3-4 years or more before gas arrives on Europe’s shores.2 Spot and one-off cargoes will become available over that time, but most of the existing LNG production is under long-term contract. Oil, coal, and nuclear energy are available for power generation, industrial applications and space-heating, and they increasingly are being used in the bloc, but these too are constrained.3 Measures to address the chronic energy shortage hammering the EU base-metals industry will take years to effect, and could come too late to meaningfully preserve existing refining capacity, which has been contracting for years (Chart 1).4 Most of the EU’s metals production is accounted for by aluminum, copper and zinc, which are extremely energy intensive, copper only less so (Chart 2). The surge in LNG prices following Russia's invasion of Ukraine propelled electricity prices higher, given gas is the marginal fuel for EU power generation (Chart 3). This crushed zinc and aluminum refining. Half of the EU’s aluminum smelter capacity – ~ 1mm MT – will be curtailed or shuttered this year, according to European Aluminum.5 Chart 1EU Metal Industry Under Threat Chart 2EU Metals Are Extremely Energy Intensive Chart 3EU Power Price Surge Crushes Metals Refining The surge in European electricity prices and the resulting curtailment or shuttering of zinc refining paced the 2.6% y/y decline in global output in 1H22, which took global production down to 6.77mm MT, according to the International Lead and Zinc Study group. Europe accounts for ~ 15% of global zinc refining.6 Refined zinc consumption fell 3% y/y in 1H22 to 6.74mm MT. China Bingeing On Copper Global refined copper output in the January – July 2022 period slightly outpaced usage – with 3% growth in the former and 2.6% growth in the latter, according to the International Copper Study Group (ICSG). On the back of this report, we lowered our expected supply growth estimate to 3% this year, (Chart 4). This brings our estimate for total supply down by ~400k MT vs. our previous iteration to 25.3mm MT. We are keeping our estimate of 2023 supply growth rate at ~ 4.5%. Our copper demand estimate is a function of real GDP estimated by the World Bank, and remains at just under 26mm MT and 27.2 mm MT for 2022 and 2023 respectively. As a result of the lower 2022 production growth rate, our forecasted copper deficit has widened to ~ 605k tons in 2022 and 480k tons in 2023. The mismatch in supply and demand levels will keep inventories in China and the West under pressure (Charts 5A and 5B). Chart 4Copper Supply Estimate Lowered Chart 5AChinese Copper Inventories Continue To Draw Chart 5BAs Do Stocks In The West China’s imports of copper condensates – the raw material used to make refined copper – surged to 16.65mm tons over January – August 2022, up 9% y/y. Imports of unwrought and semi-fabricated copper were up 8% over the same period at 3.9mm MT, according to Mysteel.com. As is to be expected, treatment and refining charges at Chinese smelters also moved higher: for 3Q22, refiners were charging $93/MT, up $13 from 2Q22 levels and $23/MT from 4Q21, according to Reuters. These charges increase when raw-material supplies increase, and vice versa. This is meant to be a floor charged for refining concentrates to produce refined copper. Real USD Matches US PPI After Re-Opening In an unusual turn of events, the USD Real Effective Exchange Rate (REER) has been moving higher along with the US Producer Price Index for all commodities. This trend started as the global economy accelerated its re-opening in 2021 (Chart 6). The USD has a profound affect on commodity prices: Most globally traded commodities are denominated in USD, funded in USD and invoiced in USD. This is the channel through which the Fed’s monetary policy impacts commodity buyers ex-US. A stronger dollar means commodities in local-currency terms are more expensive, and vice versa. It also means production costs in states that do not peg their currencies to the USD go down, and vice versa. Chart 6Real USD Gains With US PPI During Reopening Given the USD’s elevated level, copper prices in local-currency terms will continue to face a massive headwind on the demand side, and a massive tailwind on the production side. For households and firms buying commodities, or durable goods with a lot of metals in them (copper, stainless steel, etc.), Fed policy has a direct effect on how their budgets get allocated.7 In the short and long run macroeconomic variables such as the USD influence copper prices by increasing the cost of copper ex-US when the dollar rallies, and vice versa. Fundamental variables like tight inventories, which arise when demand is consistently above supply, impart an upward price bias to the copper forward curve (backwardation increases as inventories decrease). Domestic economic factors matter, too. Copper prices have been pummeled by the meltdown of China’s property sector, which has been the growth engine for the country’s economy, accounting for ~ 30% of its copper demand. The USD has remained well bid following Russia’s invasion of Ukraine, presenting a powerful headwind to commodity prices in general. This is particularly true for refined copper, given China accounts for more than 50% of total global consumption. China’s RMB dropped 11.4% vs. the USD from the start of the year to now. This has not stood in the way of a sharp increase in imports of the copper ore and refined metal this year, despite the country’s weak economic performance. Given China’s property-market slowdown and its zero-tolerance COVID-19 policy and its attendant lockdowns, it is difficult to pinpoint a cause for its increased copper demand. It may be opportunistic purchasing – buying the metal when prices are far lower than their peak earlier this year – or it could signal a post-Communist Party Congress increase in economic activity (e.g., more fiscal stimulus hitting the system) officials are preparing for. Investment Implications The EU’s metals-refining sector faces existential challenges as a result of the bloc’s energy crisis. Significant employers – not just the metal refiners – will be confronting limited energy supply and higher costs for years, given the tightness in conventional energy markets – oil, gas and coal. The renewable-energy sector also faces daunting challenges, as a result of difficulties faced by metals refiners and the energy crisis they presently confront. It is worthwhile noting that none of the renewables technology is possible without metals. Given the abundant lessons re reliance on a single supply source Russia’s invasion of Ukraine has provided, we expect investment in US metals mining and refining to increase, as consumers of copper, aluminum and zinc seek to diversify away from Chinese dominance of this sector. This will take time to build out, just as the increase in LNG supplies will take time. This likely will keep a bid under the USD, as manufacturing, mining and refining capex investment shifts to the US. We expect the EU’s drive to secure conventional energy will drive the bloc’s demand for liquified natural gas (LNG) and oil higher, even after currently planned short-term measures to increase LNG intake and distribution capacity are completed over the next 2-3 years. After being stopped out this past week, we will be re-instating our long XOP ETF position on tonight’s close, consistent with our view. Robert P. Ryan Chief Commodity & Energy Strategist rryan@bcaresearch.com Ashwin Shyam Research Analyst Commodity & Energy Strategy ashwin.shyam@bcaresearch.com Commodities Round-Up Energy: Bullish. European Commission President Ursula von der Leyen proposed additional economic sanctions against Russia yesterday including extending price caps on oil to third countries, following the call-up of reserves in Russia last week, and a veiled threat to use nuclear weapons against Ukraine. In a related matter, Gazprom, the state-owned gas producer and trading company, threatened to cut off the remaining gas sales to Europe via Ukraine – close to half the ~ 80mm cm /d still being sold via pipeline to the continent (Chart 7). It is apparent the EU has been anticipating a full shut-off of Russian pipeline gas shipments, which likely motivates von der Leyen’s proposal. Any proposal to increase sanctions on Russia would have to be unanimously approved. Base Metals: Bullish. In a boost to prospective Chile copper production, a BHP executive indicated he expects regulatory uncertainties in the largest copper producing state to ease. BHP mentioned earlier this year that legal certainty in Chile would be key to investing over USD 10 billion in the state. Earlier this month, Chilean voters rejected a constitution, which, among other things, could have curtailed mining operation by including new taxes and environmental regulations. Precious Metals: Neutral. In their Q2 platinum balances report, the World Platinum Investment Council (WPIC) expects FY 2022 surplus to rise more than 50% vs. its Q1 estimates to 974k oz. Weak platinum ETF demand resulting from a strong USD and rising interest rates is expected to outweigh operational constraints in South African and North American mining operations. Bolstering supply is the fact that Russian platinum – which constitutes ~11% of global supply – has been reaching buyers. However, this security of supply may not last. Once buyers’ long-term contracts for Russian platinum end, as in the case with aluminum, companies may self-sanction, turning to the spot market and other producing states instead. For palladium, SFA Oxford sees the metal's surplus dropping to ~92% y/y, as demand is expected to increase and production is forecast to fall (Chart 8). Chart 7 Chart 8 Footnotes 1 Please see Europe’s non-ferrous metals producers call for emergency EU action to prevent permanent deindustrialisation from spiralling electricity and gas prices, posted by Eurometaux 6 September 2022. 2 See, e.g., Exclusive: German utilities close to long-term LNG deals with Qatar, sources say published by reuters.com 20 September 2022. 3 For additional discussion, please see Energy Security Rolls Over EU's ESG Agenda, which we published 28 July 2022. It is available at ces.bcaresearch.com. 4 Please see Agenda for a resilient European metals supply for the green and digital transitions, posted by Eurometaux in mid-2020. 5 Please see Reconciling growth and decarbonisation amidst the energy crisis, posted by European Aluminium May 2022. 6 Please see Column: European smelter hits mean another year of zinc shortfall published by reuters.com 17 May 2022. 7 Please see "Global Dimensions of U.S. Monetary Policy" by Maurice Obstfeld, which appeared in the February 2020 issue of International Journal of Central Banking for an in-depth discussion and analysis. Investment Views and Themes Strategic Recommendations Trades Closed in 2022
HighlightsThe power shortage in China due to depleted coal inventories and low hydro availability will push copper and aluminum inventories lower, as refineries there – which account for roughly one-half of global capacity – are shut to conserve power (Chart of the Week).Given the critical role base metals will play in the decarbonization of the global economy, alternative capacity will have to be incentivized ex-China by higher prices to reduce refining-concentration risk in the future.Unexpectedly low renewable-energy output in the EU and UK following last year's cold winter will keep competition with China for LNG cargoes elevated this winter. It also highlights the unintended consequences of phasing down fossil-fuel generation without sufficient back-up.The US Climate Prediction Center kept its expectation for a La Niña at 70-80%, which raises the odds of a colder-than-normal winter for the Northern Hemisphere. Normal-to-warmer temps cannot be entirely dismissed, however.Increased production of highly efficacious COVID-19 vaccines globally – particularly in EM economies – will stoke economic growth and release pent-up demand among consumers.We remain long 1Q22 natgas exposure via call spreads; long commodity index exposure (S&P GSCI and COMT ETF) to benefit from increasing backwardation as inventories of industrial commodities fall; and long the PICK ETF to benefit from expected tightening of base metals markets.FeatureNatgas prices are surging in the wake of China's and Europe's scramble to cover power shortages arising from depleted coal inventories and low hydroelectric generation in the former, and unexpectedly low output from renewables in the latter (Chart 2).1Given all the excitement of record-high gas prices in the EU and surging oil prices earlier this week, it is easy to lose sight of the longer-term implications of these developments for the global decarbonization push. Chart of the WeekBase Metals Refining Concentrated In China Chart 2Surge In Gas Prices Continues Global copper inventories have been tightening (Chart 3) along with aluminum balances (Chart 4).2 Power shortages in China- which accounts for ~40% of global refined copper output and more than 50% of refined aluminum - are forcing shutdowns in production by authorities seeking to conserve energy going into winter. In addition, the upcoming Winter Olympics in February likely will keep restrictions on steel mills, base-metals refiners, and smelters in place, so as to keep pollution levels down and skies blue. Chart 3Supply-Demand Balance Tightening In Copper Chart 4Along With Aluminum Balances... This will keep prices well supported and force manufacturers to draw on inventories, which will keep forward curves for copper (Chart 5) and aluminum (Chart 6) backwardated. Higher costs for manufactured goods can be expected as well, which will exacerbate the cost-push inflation coming through from clogged global supply chains. This slowdown in global supply chains is largely the result of global aggregate demand improving at a faster rate than supply.3 Chart 5Copper Prices And Backwardation Chart 6...Will Increase Along With Aluminum The pressures on base metals markets highlight the supply-concentration risks associated with the large share of global refining capacity located in China. This makes refined base metals supplies and inventories globally subject to whatever dislocations are impacting China at any point in time. As the world embarks on an unprecedented decarbonization effort, this concentration of metals refining capacity becomes increasingly important, given the centrality of base metals in the build-out of renewable-energy and electric-vehicles (EVs) globally (Chart 7).In addition, increasing tension between Western states and China supports arguments to diversify supplies of refined metals in the future (e.g., the US, UK and Australia deal to supply US nuclear-powered submarine technology to Australia, and the tense Sino-Australian trade relationship that led to lower Chinese coal inventories).4 Chart 7The Need For Refined Metals Grows EU's Renewables Bet SoursUnlike China, which gets ~ 11% of its electricity from renewables and ~ 63% of its power from coal-fired generation (Chart 8), the EU gets ~ 26% of its power from renewables and ~ 13% from coal (Chart 9). In fact, the EU's made a huge bet on renewables, particularly wind power, which accounts for ~55% of its renewables supply. Chart 8China's Dependence On Coal … Chart 9… Greatly Exceeds The EU's Unexpectedly low renewable-energy output in the EU and UK this summer – particularly wind power – forced both to scramble for natgas and coal supplies to cover power needs.5 As can be seen in Chart 9, the EU has been winding down its fossil-fuel-fired electric generation in favor of renewables. When the wind stopped blowing this year the EU was forced into an intense competition with China for LNG cargoes in order to provide power and rebuild storage for the coming winter (Chart 10). Chart 10The Scramble For Natgas Continues The current heated – no pun intended – competition for natgas going into the coming winter is the result of two policy errors, which will be corrected by Spring of next year. On China's side, coal inventories were allowed to run down due to diplomacy, which left inventories short going into winter. In the EU, wind power availability fell far short of expectations, another result of a policy miscalculation: Nameplate wind capacity is meaningless if the wind stops blowing. Likewise for sun on a cloudy day.Natgas Price Run-Up Is TransitoryThe run-up in natgas prices occasioned by China's and the EU's scramble for supplies is transitory. Still, uncertainty as to the ultimate path global gas prices will take is at its maximum level at present.The US Climate Prediction Center kept its expectation for a La Niña at 70-80%, which raises the odds of a colder-than-normal winter for the Northern Hemisphere. Even so, this is a probabilistic assessment: Normal-to-warmer temps cannot be dismissed, given this probability. A normal to warmer winter would leave US inventories and the availability to increase LNG exports higher, which would alleviate much of the pricing pressure holding Asian and European gas prices at eye-watering levels presently.Going into 1Q22, we expect increased production of highly efficacious COVID-19 vaccines globally – particularly in EM economies – will stoke economic growth and release pent-up demand among consumers as hospitalization and death rates continue to fall (Chart 11).6 At that point, we would expect economic activity to pick up significantly, which would be bullish for natgas. We also expect US and Russian natgas production to pick up, with higher prices supporting higher rig counts in the US in particular. Chart 11Expect Continued COVID-19 Progress Investment ImplicationsAs the world embarks on an unprecedented decarbonization effort, it is important to follow the supply dynamics of base metals, which will provide the materials needed to build out renewable generation and EVs.The current price pressure in natural gas markets resulting from policy miscalculations cannot be ignored. Still, this pressure is more likely to be addressed quickly and effectively than the structural constraints in base metals markets.On the base metals side, producers remain leery of committing to large capex projects at the scale implied by policy projections for the renewables buildout.7In addition, current market conditions highlight concentration risks in these markets – particularly on the refining side in base metals, where much of global capacity resides in China. On the production and refining side of EV materials, battery technology remains massively concentrated to a few countries (e.g., cobalt mining and refining in the Democratic Republic of Congo and China, respectively).This reinforces our view that oil and gas production and consumption likely will not decay sharply unless and until these capex issues and concentration risks are addressed. For this reason, we remain bullish oil and gas. Robert P. Ryan Chief Commodity & Energy Strategistrryan@bcaresearch.comAshwin ShyamResearch AssociateCommodity & Energy Strategyashwin.shyam@bcaresearch.com Commodities Round-UpEnergy: BullishDelegates at OPEC 2.0's Ministerial Meeting on Monday likely will agree to increase the amount of oil being returned to markets by an additional 100-200k b/d. This would take the monthly production rate of production being restored from 400k b/d to 500-600k b/d. Depending on how quickly mRNA vaccine production in large EM markets is rolled out, this incremental increase could remain in place into 2Q22. This would assuage market concerns prices could get to the point that demand is destroyed just as economic re-opening is beginning in EM economies. Our view remains that the producer coalition led by Saudi Arabia and Russia will continue to balance the need for higher revenues of member states with the fragile recovery in EM economies. We continue to expect prices in 2022 to average $75/bbl and $80/bbl in 2023 (Chart 12). This allows OPEC 2.0 states to rebuild their balance sheets and fund their efforts to diversify their economies without triggering demand destruction.Base Metals: BullishA power crunch and decarbonization policies in China are supporting aluminum prices at around 13-year highs, after reaching a multi-year peak earlier this month (Chart 13). The energy-intensive electrolytic process of converting alumina to metal makes aluminum production highly sensitive to fluctuations in power prices. High power prices and electricity shortages are impacting aluminum companies all over China, one of which is Yunnan Aluminium. According to the Financial Times, the company accounts for 10% of total aluminum supply in the world’s largest producer.Precious Metals: BullishGold prices dipped following a hawkish FOMC meeting last week. More Fed officials see a rate hike in 2022, compared to the previous set of projections released in June. Fed Chair Jay Powell also hinted at a taper in the asset purchase program on the back of a rebounding US economy, provided a resurgence in COVID-19 does not interrupt this progress. A confirmation of what markets were expecting – i.e., paring asset purchases by year-end – and possible rate hikes next year have buoyed the US dollar and Treasury yields. The USD competes directly with gold for safe-haven investment demand. Higher interest rates will increase the opportunity cost of holding the yellow metal. As a result, gold prices will be subdued when the USD is strengthening. We remain bearish the USD, and, therefore, bullish gold. Chart 12Oil Forecasts Hold Steady Chart 12Aluminum Prices Recovering Footnotes1 Please see China's Yunnan imposes output curbs on aluminium, steel, cement makers published by reuters.com on September 13, 2021.2 NB: Global aluminum inventory data are unreliable and we do not publish them.3 Please see, e.g., Supply Chains, Global Growth, and Inflation, published by gspublishing.com on September 20, 2021.4 Please see US-China: War Preparation Pushes Commodity Demand, a Special Report we published on August 26, 2021, for further discussion.5 We discuss this in last week's report entitled Natgas Markets Continue To Tighten, which is available at ces.bcaresearch.com.6 Please see Upside Price Risk Rises For Crude, which updated our oil-price balances and forecasts. We highlight the recent agreements to mass produce the highly effective mRNA COVID-19 vaccines globally as bullish for oil prices. It also will be bullish for natgas and other commodities.7 Please see Assessing Risks To Our Commodity Views, which we published on July 8, 2021, for additional discussion. Investment Views and ThemesStrategic RecommendationsTactical TradesCommodity Prices and Plays Reference TableTrades Closed in 2021Summary of Closed Trades

Aluminum prices recently accelerated sharply following several months of relative inactivity. The recent rally was triggered by fears of a disruption in bauxite supplies - the primary source of aluminum - following a military coup in Guinea earlier this…
Highlights The US Climate Prediction Center gives ~ 70% odds another La Niña will form in the August – October interval and will continue through winter 2021-22. This will be a second-year La Niña if it forms, and will raise the odds of a repeat of last winter's cold weather in the Northern Hemisphere.1 Europe's natural-gas inventory build ahead of the coming winter remains erratic, particularly as Russian flows via Ukraine to the EU have been reduced this year. Russia's Nord Stream 2 could be online by November, but inventories will still be low. China, Japan, South Korea and India – the four top LNG consumers in Asia – took in 155 Bcf of the fuel in June. A colder-than-normal winter would boost demand. Higher prices are likely in Europe and Asia (Chart of the Week). US storage levels will be lower going into winter, as power generation demand remains stout, and the lingering effects from Hurricane Ida reduce supplies available for inventory injections. Despite spot prices trading ~ $1.30/MMBtu above last winter's highs – currently ~ $4.60/MMBtu – we are going long 1Q22 NYMEX $5.00/MMBtu natgas calls vs short NYMEX $5.50/MMBtu natgas calls expecting even higher prices. Feature Last winter's La Niña was a doozy. It brought extreme cold to Asia, North America and Europe, which pulled natural gas storage levels sharply lower and drove prices sharply higher as the Chart of the Week shows. Natgas storage in the US and Europe will be tight going into this winter (Chart 2). Europe's La Niña lingered a while into Spring, keeping temps low and space-heating demand high, which delayed the start of re-building inventory for the coming winter. In the US, cold temps in the Midwest hampered production, boosted demand and caused inventory to draw hard. Chart of the WeekA Return Of La Niña Could Boost Global Natgas Prices Chart 2Europe, US Gas Stocks Will Be Tight This Winter Summer in the US also produced strong natgas demand, particularly out West, as power generators eschewed coal in favor of gas to meet stronger air-conditioning demand. This is partly due to the closing of coal-fired units, leaving more of the load to be picked up by gas-fired generation (Chart 3). The EIA estimates natgas consumption in July was up ~ 4 Bcf/d to just under 76 Bcf/d. Hurricane Ida took ~ 1 bcf/d of demand out of the market, which was less than the ~ 2 Bcf/d hit to US Gulf supply resulting from the storm. As a result, prices were pushed higher at the margin. Chart 3Generators Prefer Gas To Coal US natgas exports (pipeline and LNG) also were strong, at 18.2 Bcf/d in July (Chart 4). We expect US LNG exports, in particular, to resume growth as the world recovers from the COVID-19 pandemic (Chart 5). This strong demand and exports, coupled with slightly lower supply from the Lower 48 states – estimated at ~ 98 Bcf/d by the EIA for July (Chart 6) – pushed prices up by 18% from June to July, "the largest month-on-month percentage change for June to July since 2012, when the price increased 20.3%" according to the EIA. Chart 4US Natgas Exports Remain Strong Chart 5US LNG Exports Will Resume Growth Chart 6US Lower 48 Natgas Production Recovering Elsewhere in the Americas, Brazil has been a strong bid for US LNG – accounting for 32.3 Bcf of demand in June – as hydroelectric generation flags due to the prolonged drought in the country. In Asia, demand for LNG remains strong, with the four top consumers – China, Japan, South Korea, and India – taking in 155 Bcf in June, according to the EIA. Gas Infrastructure Ex-US Remains Challenged A combination of extreme cold weather in Northeast Asia, and a lack of gas storage infrastructure in Asia generally, along with shipping constraints and supply issues at LNG export facilities, led to the Asian natural gas price spike in mid-January.2 Very cold weather in Northeast Asia, drove up LNG demand during the winter months. In China, LNG imports for the month of January rose by ~ 53% y-o-y (Chart 7).3 The increase in imports from Asia coincided with issues at major export plants in Australia, Norway and Qatar during that period. Chart 7China's US LNG Exports Surged Last Winter, And Remain Stout Over The Summer Substantially higher JKM (Japan-Korea Marker) prices incentivized US exporters to divert LNG cargoes from Europe to Asia last winter. The longer roundtrip times to deliver LNG from the US to Asia – instead of Europe – resulted in a reduction of shipping capacity, which ended up compounding market tightness in Europe. Europe dealt with the switch by drawing ~ 18 bcm more from their storage vs. the previous year, across the November to January period. Countries in Asia - most notably Japan – however, do not have robust natural gas storage facilities, further contributing to price volatility, especially in extreme weather events. These storage constraints remain in place going into the coming winter. In addition, there is a high probability the global weather pattern responsible for the cold spells around the globe that triggered price spikes in key markets globally – i.e., a second La Niña event – will return. A Second-Year La Niña Event The price spikes and logistical challenges of last winter were the result of atmospheric circulation anomalies that were bolstered by a La Niña event that began in mid-2020.4 The La Niña is characterized by colder sea-surface temperatures that develops over the Pacific equator, which displaces atmospheric and wind circulation and leads to colder temperatures in the Northern Hemisphere (Map 1). Map 1La Niña Raises The Odds Of Colder Temps The IEA notes last winter started off without any exceptional deviations from an average early winter, but as the new year opened "natural gas markets experienced severe supply-demand tensions in the opening weeks of 2021, with extremely cold temperature episodes sending spot prices to record levels."5 In its most recent ENSO update, the US Climate Prediction Center raised the odds of another La Niña event for this winter to 70% this month. If similar conditions to those of the 2020-21 winter emerge, US and European inventories could be stretched even thinner than last year, as space-heating demand competes with industrial and commercial demand resulting from the economic recovery. Global Natgas Supplies Will Stay Tight JKM prices and TTF (Dutch Title Transfer Facility) prices are likely to remain elevated going into winter, as seen in the Chart of the Week. Fundamentals have kept markets tight so far. Uncertain Russian supply to Europe will raise the price of the European gas index (TTF). This, along with strong Asian demand, particularly from China, will keep JKM prices high (Chart 8). The global economic recovery is the main short-term driver of higher natgas demand, with China leading the way. For the longer-term, natural gas is considered as the ideal transition fuel to green energy, as it emits less carbon than other fossil fuels. For this reason, demand is expected to grow by 3.4% per annum until 2035, and reach peak consumption later than other fossil fuels, according to McKinsey.6 Chart 8BCAs Brent Forecast Points To Higher JKM Prices Spillovers from the European natural gas market impact Asian markets, as was demonstrated last winter. Russian supply to Europe – where inventories are at their lowest level in a decade – has dropped over the last few months. This could either be the result of Russia's attempts to support its case for finishing Nord Stream 2 and getting it running as soon as possible, or because it is physically unable to supply natural gas.7 A fire at a condensate plant in Siberia at the beginning of August supports the latter conjecture. The reduced supply from Russia, comes at a time when EU carbon permit prices have been consistently breaking records, making the cost of natural gas competitive compared to more heavy carbon emitting fossil fuels – e.g., coal and oil – despite record breaking prices. With Europe beginning the winter season with significantly lower stock levels vs. previous years, TTF prices will remain volatile. This, and strong demand from China, will support JKM prices. Investment Implications Natural gas prices are elevated, with spot NYMEX futures trading ~ $1.30/MMBtu above last winter's highs – currently ~ $4.60/MMBtu. Our analysis indicates prices are justifiably high, and could – with the slightest unexpected news – move sharply higher. Because natgas is, at the end of the day, a weather market, we favor low-cost/low-risk exposures. In the current market, we recommend going long 1Q22 NYMEX $5.00/MMBtu natgas calls vs short NYMEX $5.50/MMBtu natgas calls expecting even higher prices. This is the trade we recommended on 8 April 2021, at a lower level, which was stopped out on 12 August 2021 with a gain of 188%. Robert P. Ryan Chief Commodity & Energy Strategist rryan@bcaresearch.com Ashwin Shyam Research Associate Commodity & Energy Strategy ashwin.shyam@bcaresearch.com Commodities Round-Up Energy: Bullish Earlier this week, Saudi Aramco lowered its official selling price (OSP) by more than was expected – lowering its premium to the regional benchmark to $1.30/bbl from $1.70/bbl – in what media reports based on interviews with oil traders suggest is an attempt to win back customers electing not to take volumes under long-term contracts. This is a marginal adjustment by Aramco, but still significant, as it shows the company will continue to defend its market share. Pricing to Northwest Europe and the US markets is unchanged. Aramco's majority shareholder, the Kingdom of Saudi Arabia (KSA), is the putative leader of OPEC 2.0 (aka, OPEC+) along with Russia. The producer coalition is in the process of returning 400k b/d to the market every month until it has restored the 5.8mm b/d of production it took off the market to support prices during the COVID-19 pandemic. We expect Brent crude oil prices to average $70/bbl in 2H21, $73/bbl in 2022 and $80/bbl in 2023. Base Metals: Bullish Political uncertainty in Guinea caused aluminum prices to rise to more than a 10-year high this week (Chart 9). A coup in the world’s second largest exporter of bauxite – the main ore source for aluminum – began on Sunday, rattling aluminum markets. While iron ore prices rebounded primarily on the record value of Chinese imports in August, the coup in Guinea – which has the highest level of iron ore reserves – could have also raised questions about supply certainty. This will contribute to iron-ore price volatility. However, we do not believe the coup will impact the supply of commodities as much as markets are factoring, as coup leaders in commodity-exporting countries typically want to keep their source of income intact and functioning. Precious Metals: Bullish Gold settled at a one-month high last Friday, when the US Bureau of Labor Statistics released the August jobs report. The rise in payrolls data was well below analysts’ estimates, and was the lowest gain in seven months. The yellow metal rose on this news as the weak employment data eased fears about Fed tapering, and refocused markets on COVID-19 and the delta variant. Since then, however, the yellow metal has not been able to consolidate gains. After falling to a more than one-month low on Friday, the US dollar rose on Tuesday, weighing on gold prices (Chart 10). Chart 9 Chart 10 Footnotes 1 Please see the US Climate Prediction Center's ENSO: Recent Evolution, Current Status and Predictions report published on September 6, 2021. 2 Please see Asia LNG Price Spike: Perfect Storm or Structural Failure? Published by Oxford Institute for Energy Studies. 3 Since China LNG import data were reported as a combined January and February value in 2020, we halved the combined value to get the January 2020 amount. 4 Please see The 2020/21 Extremely Cold Winter in China Influenced by the Synergistic Effect of La Niña and Warm Arctic by Zheng, F., and Coauthors (2021), published in Advances in Atmospheric Sciences. 5 Please see the IEA's Gas Market Report, Q2-2021 published in April 2021. 6 Please see Global gas outlook to 2050 | McKinsey on February 26, 2021. 7 Please see ICIS Analyst View: Gazprom’s inability to supply or unwillingness to deliver? published on August 13, 2021. Investment Views and Themes Recommendations Strategic Recommendations Tactical Trades Commodity Prices and Plays Reference Table Trades Closed in 2021 Summary of Closed Trades
Highlights Over the short term – 1-2 years – the pick-up in re-infection rates in Asia and LatAm states with large-scale deployments of Sinopharm and Sinovac COVID-19 vaccines will re-focus attention on demand-side risks to the global recovery (Chart of the Week). The UAE-Saudi impasse re extending the return of additional volumes of OPEC 2.0 spare capacity to the oil market over 2H21 will be short-lived. The UAE's official baseline production will be increased to 3.8mm b/d from 3.2mm b/d presently, and its output in 2H21 will be adjusted accordingly. Over the medium term – 3-5 years out – the risk to the expansion of metal supplies needed for renewables and electric vehicles (EVs) will rise, as left-of-center governments increase taxes and royalties, and carbon prices move higher. Rising metals costs will redound to the benefit of oil and gas producers, and accelerate R+D in carbon- and GHG-reduction technologies. Longer-term – 5-10 years out – the active discouragement of investment in hydrocarbons will contribute to energy shortages. In anticipation of continued upside volatility in commodity prices and share values of oil, gas and metals producers, we remain long the S&P GSCI and COMT ETF, and long equities of producers and traders via the PICK ETF. Feature Our conversations with clients almost invariably leads us to considering the risks to our long-standing bullish views for energy and metals. This week, we reprise some of the highlights of these conversations. In the short term, our bullish call on oil is underpinned by the assumption of continued expansion in vaccinations, which we believe will lead to global economic re-opening and increased mobility, as the world emerges from the devastation of COVID-19. This expectation is once again under scrutiny. On the supply side, the very public negotiations undertaken by the UAE and the leaders of OPEC 2.0 – the Kingdom of Saudi Arabia (KSA) and Russia – over re-basing the UAE's production reminds investors there is substantial spare capacity from the coalition available for the market over the short term. The slow news cycle going into the US Independence Day holiday certainly was a fortuitous time to make such a point. Chart of the WeekWorrisome Uptick Of COVID-19 Cases KSA-UAE Supply-Side Worries The abrupt end to this week's OPEC 2.0 meeting was unsettling to markets. Shortly after the meeting ended – without being concluded – officials from the Biden administration in the US spoke with officials from KSA and the UAE, presumably to encourage resolution of outstanding issues and to get more oil into the market to keep crude oil prices below $80/bbl (Chart 2). We're confident the KSA-UAE impasse re extending the return of additional volumes of spare capacity to the oil market over 2H21 will be short-lived. The UAE's official baseline production number (i.e., its October 2018 output level) will be increased to 3.8mm b/d from 3.2mm b/d presently, and its output in 2H21 will be adjusted accordingly. Coupled with a likely return of Iranian export volumes in 4Q21, this will bring prices down into the mid- to high-$60/bbl range we are forecasting. Chart 2US Pushing For Resolution of KSA-UAE Spat Longer term, markets are worried this incident is a harbinger of a breakdown in OPEC 2.0's so-far-successful production-management strategy, which has lifted oil prices 200% since their March 2020 nadir. At present, the producer coalition has ~ 6-7mm b/d of spare capacity, which resulted from its strategy to keep the level of supply below demand. A breakdown in this discipline – in extremis, another price war of the sort seen in March 2020 or from 2014-2016 – could plunge oil markets into a price collapse that re-visits sub-$40/bbl levels. In our view, economics – specifically the cold economic reality of the price elasticity of supply – continues to work for the OPEC 2.0 coalition: Higher revenues are realized by members of the group as long as relatively small production cuts produce larger revenue gains – e.g., a 5% (or less) cut in production that produces a 20% (or more) increase in price trumps a 20% increase in production that reduces prices by 50%. Besides, none of the members of the coalition possess the wherewithal to endure another shock-and-awe display from KSA similar to the one following the breakdown of the March 2020 OPEC 2.0 meeting. We also continue to expect US shale-oil producers to be disciplined by capital markets, and to retain a focus on providing competitive returns to their shareholders, which will limit supply growth to that which maintains profitability. Until we see actual evidence of a breakdown in the coalition's willingness to maintain its production-management strategy, we will continue to assume it remains operative. Worrisome COVID-19 Re-Infection Trends Reports of increased re-infection rates in Latin American and Asia-Pacific states providing Chinese Sinopharm and Sinovac COVID-19 vaccines will re-focus attention on demand-side risks to the global recovery. Conclusive data on the efficacy of these vaccines is not available at present, based on reporting from Health Policy Watch (HPW).1 The vast majority of these vaccines were purchased in Latin America and the Asia-Pacific region, where ~ 80% of the 759mm doses of the two Chinese vaccines were sold, according to HPW's reporting. This will draw the attention of markets to this risk (Chart 3). Of particular concern are the increases in re-infection rates in the Seychelles and Chile, where the majority of populations in both countries were inoculated with one of the Chinese vaccines. Re-infections in Indonesia also are drawing attention, where more than 350 healthcare workers were re-infected after receiving the Sinovac vaccination.2 The risk of renewed global lockdowns remains small, but if these experiences are repeated globally with adverse health consequences, this assessment could be challenged. Chart 3COVID-19 Returning In High-Vaccination States Transition Risks To A Low-Carbon Economy Over the medium- to long-terms, our metals views are premised on the expectation the build-out of the global EV fleet and renewable electricity generation – including its supporting grids – will require massive increases in the supply of copper, aluminum, nickel, and tin, not to mention iron ore and steel. This surge in demand will be occurring as governments rush headlong into unplanned and unsynchronized wind-downs of investment in the hydrocarbon fuels that power modern economies.3 The big risk here is new metal supplies will not be delivered fast enough to build all of the renewable generation, EVs and their supporting grids and infrastructures to cover the loss of hydrocarbons phased out by policy, legal and boardroom challenges. Such a turn of events would re-invigorate oil and gas production. Renewable energy and electric vehicles are the sine qua non of the drive to achieve net-zero carbon emissions by 2050. However, the rising price of base metals will add to already high costs of rebuilding power grids to make them suitable for green energy. Given miners’ reluctance to invest in new mines, we do not expect metals prices to drop anytime soon. According to Wood Mackenzie, in 2019 the cost of shifting just the US power grid to renewable energy over the next 10 years will amount to $4.5 trillion.4 Given these cost and supply barriers, fossil fuels will need to be used for longer than the IEA outlined in its recent and controversial report on transitioning to a net-zero economy.5 To ensure that fossil fuels can be used while countries work to achieve their net zero goals, carbon capture utilization and storage (CCUS) technology will need to be developed and made cheaper. The main barrier to entry for CCUS technology is its high cost (Chart 4). However, like renewable energy, the more it is deployed and invested in, the cheaper it will become, following the trend seen in the development of renewable energy and EVs, which were aided by large-scale subsidies from governments to encourage the development of the technology. These cost reductions are already visible: In its 2019 report, the Global CCS Institute noted the cost of implementing CCS technology initially used in 2014 had fallen by 35% three years later. Chart 4CCUS Can Be Expensive Metals Mines' Long Lead Times In 2020 the total amount of discovered copper reserves in the world stood at ~ 870mm MT (Chart 5), according to the US Geological Service (USGS). As of 2017, the total identified and undiscovered amount of reserves was ~ 5.6 billion MT.6 The World Bank recently estimated additional demand for copper would amount to ~ 20mm MT p.a. by 2050 (Chart 6).7 Glencore’s recently retired CEO Ivan Glasenberg last month said that by 2050, miners will need to produce around 60mm MT p.a. of copper to keep up with demand for countries’ net zero initiatives.8 Even with this higher estimate, if miners focus on exploration and can tap into undiscovered reserves, supply will cover demand for the renewable energy buildout. Chart 5Copper Reserves Are Abundant Chart 6Call On Base Metals Supply Will Be Massive Out To 2050 While recent legislative developments in Chile and Peru, which together constitute ~ 34% of total discovered copper reserves, could lead to significantly higher costs as left-of-center governments re-write these states' constitutions, geological factors would not be the main constraint to copper supply for the renewables energy buildout: Even if copper mining companies were to move out of these two countries, there still is about 570 million MT in discovered copper reserves, and nearly ten times that amount in undiscovered reserves. As we have written in the past, capital expenditure restraint is the principal reason the supply side of copper markets – and base metals generally – is challenged (Chart 7). Unlike in the previous commodity boom, this time mining companies are focusing on providing returns to shareholders, instead of funding the development of new mines (Chart 8). Chart 7Copper Prices Remains Parsimonious Chart 8Shareholder Interests Predominate Metals Agendas Of course, it is likely metals miners, like oil producers, are waiting to see actual demand for copper and other base metals pick up before ramping capex. Sharp increases in forecasted demand is not compelling for miners, at this point. This means metals prices could stay elevated for an extended period, given the 10-15-year lead times for copper mines (Chart 9). For example, the Kamoa-Kakula mine in the Democratic Republic of Congo (DRC) now being brought on line took roughly 24 years of exploration and development work, before it started producing copper. Technological breakthroughs that increase brownfield projects’ productivity, or significant increases in the amount of recycled copper as a percent of total copper supply would address some of the price pressures arising from the long lead times associated with the development of new copper supply. Another scenario with a non-trivial probability that threatens the viability of metals investing is a breakthrough – or breakthroughs – in CCUS technology, which allows oil and gas producers to remove enough carbon from their fuels to allow firms using these fuels to achieve their net-zero carbon goals. Chart 9Long Lead Times For Mine Development Investment Implications Short-term supply-demand issues affecting the oil market at present are transitory, and do not signal a shift in the fundamentals supporting our bullish call on oil. Our thesis based on continued production discipline remains intact. That said, we will continue to subject it to rigorous scrutiny on a continual basis. Our average Brent forecast for 2021 remains $66.50/bbl, with 2H21 prices averaging $70/bbl. For 2022 and 2023 we continue to expect prices to average $74 and $81/bbl, respectively (Chart 10). WTI will trade $2-$3/bbl lower. Our metals view has become slightly more nuanced, thanks to our client conversations. One of the unintended consequences of the unplanned and uncoordinated rush to a net-zero carbon future will be an improvement in the competitive position of oil and gas as transportation fuels and electric-generation fuels going forward. This will be driven by rising costs of developing and delivering the metals supplies needed to effect the net-zero transition. We expect markets will provide incentives to CCUS technologies and efforts to decarbonize oil and gas fuels, which will contribute to the global effort to arrest rising temperatures. This suggests the rush to sell these assets – which is underway at present – could be premature.9 In the extreme, this could be a true counterbalance to the metals story, if it plays out. Chart 10Our Oil Price View Remains Intact Robert P. Ryan Chief Commodity & Energy Strategist rryan@bcaresearch.com Ashwin Shyam Research Associate Commodity & Energy Strategy ashwin.shyam@bcaresearch.com Commodities Round-Up Energy: Bullish The monthly OPEC 2.0 meeting ended without any action to increase monthly supplies, following the UAE's bid to increase its baseline reference production – determined based on October 2018 production levels – to 3.8mm b/d, up from 3.2mm b/d. S&P Global Platts reported the UAE's Energy Minister, Suhail al-Mazrouei, advanced a proposal to raise its monthly production level under the coalition's overall output deal, while KSA's energy minister, Prince Abdulaziz bin Salman, insisted the UAE follow OPEC 2.0 procedures in seeking an output increase. We do not expect this issue to become a protracted standoff between these states. The disagreement between the ministers is procedural to substantive. Remarks by bin Salman last month – to wit, KSA has a role in containing inflation globally – and his earlier assertions that production policy of OPEC 2.0 would be driven by actual oil demand, as opposed to forecasted oil demand, suggest the Kingdom is not aiming for higher oil prices per se. Base Metals: Bullish Spot benchmark iron ore (62 Fe) prices traded above $222/MT this week in China on the back of stronger steel demand, according to mining.com (Chart 11). Market participants are anticipating further steel-production restrictions and appear to be trying to get out in front of them. Precious Metals: Bullish The USD rally eased this week, allowing gold prices to stabilize following the June Federal Open Market Committee (FOMC) meeting. In the two weeks since the FOMC, our gold composite indicator shows that gold started entering oversold territory (Chart 12). We believe gold prices will start correcting upwards, expecting investor bargain-hunting to pick up after the price drop. The mixed US jobs report, which showed the unemployment rate ticked up more than expected, implies that interest rates are not going to be raised soon. Our colleagues at BCA Research's US Bond Strategy (USBS) expect rates to increase only by end-2022.10 This, along with slightly higher odds of a potential COVID-19 resurgence, will support gold prices in the near-term. Ags/Softs: Neutral The USDA's Crop Progress report for the week ended 4 July 2021 showed 64% of the US corn crop was in good to excellent condition, down from the 71% reported for the comparable 2020 date. The Department reported 59% of the bean crop was in good to excellent shape vs 71% the year earlier. Chart 11 Chart 12 Footnotes 1 Please see Are Chinese COVID Vaccines Underperforming? A Dearth of Real-Life Studies Leaves Unanswered Questions, published by Health Policy Watch, June 18, 2021. 2 According to HPW, the World Health Organization's Emergency Use Listing for these two vaccines "were unique in that unlike the Pfizer, AstraZeneca, Moderna, and Jonhson & Johonson vaccines that it had also approved, neither had undergone review and approval by a strict national or regional regulatory authority such as the US Food and Drug Administration or the European Medicines Agency. Nor have Phase 3 results of the Sinopharm and Sinovac trials been published in a peer-reviewed medical journal. More to the point, post-approval, any large-scale tracking of the efficacy of the Sinovac and Sinopharm vaccine rollouts by WHO or national authorities seems to be missing." 3 Please see A Perfect Energy Storm On The Way, which we published on June 3, 2021 for additional discussion. It is available at ces.bcaresearch.com. 4 Please refer to The Price of a Fully Renewable US Grid: $4.5 Trillion, published by greentechmedia 28 June 2019. 5 Please refer to the IEA's Net Zero By 2050, published in May 2021. 6 Please refer to USGS Mineral Commodity Summaries, 2021. 7 Please refer to Minerals for Climate Action: The Mineral Intensity of the Clean Energy Transition, published by the World Bank. 8 Please refer to Copper supply needs to double by 2050, Glencore CEO says, published by reuters.com on June 22, 2021. 9 Please see the FT's excellent coverage of this trend in A $140bn asset sale: the investors cashing in on Big Oil’s push to net zero published on July 6, 2021. 10 Please refer to Watch Employment, Not Inflation, published by the USBS on June 15, 2021. Investment Views and Themes Strategic Recommendations Tactical Trades Commodity Prices and Plays Reference Table Trades Closed in 2021 Summary of Closed Trades
Highlights Entering 2H21, oil and metals' price volatility will rise as inventories are drawn down to cover physical supply deficits brought about by the re-opening of major economies ex-China. As demand increases and oil and metals supply become more inelastic, forward curves will backwardate further. This will weaken commodity-price correlations with the USD and boost commodity-index returns. Going into next week's OPEC 2.0 meeting, the Kingdom of Saudi Arabia (KSA) and Russia likely will hold off on further production increases, until greater clarity around US-Iran negotiations and the return of Iran as a bona fide exporter is available. Chinese authorities will release 100k MT of copper, aluminum and zinc into tight domestic markets in July. A two-day rally followed the news. Since bottoming in March 2020, the XOP and XME ETFs covering oil and gas producers and metals miners are up ~ 218% and ~ 196%, respectively, following the ~ 230% move in crude oil and the ~ 100% rise copper prices. Higher volatility will present buying opportunities for these ETFs (Chart of the Week). We remain long commodity index exposure – S&P GSCI and COMT ETF – expecting steeper backwardations. We will go long the PICK ETF at tonight's close again, after being stopped out last week with a 23.9% return. Feature Heading into 2H21, industrial commodity markets will continue to tighten. In the case of oil, this is caused by OPEC 2.0's production-management strategy – i.e., keeping supply below demand – and capital discipline among producers in the price-taking cohort.1 Base metals, on the other hand, are tightening because demand is recovering much faster than supply.2 Re-opening of major economies will boost refined-product demand in oil markets – e.g., gasoline and jet fuel – which will leave refiners little choice but to continue drawing on inventories to cover supply shortfalls in the near term (Chart 2). Chart of the WeekResources ETFs Follow Prices Higher Chart 2Refiners Will Continue Drawing Crude Investments Base metals – particularly copper and aluminum – will remain well bid in the face of constrained supply and higher consumption ex-China. Despite China's widely anticipated decision to release strategic stockpiles of copper, aluminum and zinc next month into a tight domestic market – which we flagged last month – continued inventory draws will be required to cover physical deficits in these markets, particularly in copper (Chart 3).3 Chart 3Copper Inventories Will Draw As Demand Ex-China Rises Chart 4Steeper Backwardation, Higher Volatility Higher Vol On The Way As demand for industrial commodities increases and inventories continue to draw, forward curves will become more backwardated – i.e., material delivered promptly (next day or next week) will command a higher price than commodities delivered next month or next year: Consumers value current supply above deferred supply, and producers and merchants have to charge more to cover inventory replacement costs, which increase when prompt demand outstrips supply. The steepening of forward curves for industrial commodities will lead to higher price volatility in oil and metals markets, particularly copper: Demand will confront increasingly inelastic supply. In this evolution, prices will be forced to allocate inelastic supply as demand increases. Sometimes-sharp changes in price are required to equilibrate available supply with demand when this happens. This can be seen clearly in oil markets, but it holds true for all storable commodities (Chart 4).4 Investment Implications Industrial commodity markets are entering a more volatile phase, which will be characterized by sharp price movements up and down over the short term, as demand continues to outpace supply. Our analysis suggests this is the beginning of a more volatile phase in industrial commodity markets. The balance of risk in industrial commodity prices will remain to the upside as volatility increases. In the short term, fundamental imbalances can be addressed over a relatively short months-long horizon – i.e., OPEC 2.0 can release spare capacity over a 3-4 month interval to accommodate rising demand – so that price increases do not destroy demand as oil-exporters are rebuilding their fiscal balance sheets. Base metals markets will have a tougher time in the short run finding the supply to meet surging demand, but it can be done over the next year or so without prices getting to the point where demand-destruction sets in. Over the medium to long term, investor-owned oil and gas producers literally are being directed by policymakers, shareholders and courts toward an extended wind-down of production and investment in future production. Markets have been pricing through just such a situation in the post-COVID-19 world, with OPEC 2.0 managing supply against falling demand and still managing to reduce inventories significantly. If the world follows the IEA's pathway to a decarbonized future – in which no investment in new oil or gas production is required after 2025 – this will become the status quo for these markets going forward.5 Metals producers, on the other hand, are being encouraged to increase marketable supply at a rapid pace to accommodate demand driven by the build-out of renewable energy – chiefly wind and solar – and the grids that will be required to move this energy. Producers, however, remain reluctant to do so, fearing their capex investment to build out supply will produce physical surpluses that depress returns, similar to the last China-led commodity super-cycle. Supplying the necessary base metals to make this happen will be difficult at best, according to Ivan Glasenberg, CEO at Glencore. At this week's Qatar Economic Forum, he said copper supply will have to double between now and 2050 to meet expected demand for this critical metal. “Today, the world consumes 30 million tonnes of copper per year and by the year 2050, following this trajectory, we’ve got to produce 60 million tonnes of copper per year,” he said. “If you look at the historical past 10 years, we’ve only added 500,000 tonnes per year … Do we have the projects? I don’t think so. I think it will be extremely difficult.”6 The volatility we are expecting in oil, gas and base metals prices, will present buy-the-dip opportunities in related equities vehicles. Since bottoming in March 2020, the XOP and XME ETFs covering oil and gas producers and metals miners are up ~ 218% and ~ 196%, respectively, matching the ~ 230% move in crude oil and the ~ 100% rise in copper prices. We remain long commodity index exposure – S&P GSCI, which is up 5.9% and the COMT ETF, which is up 7.6% – expecting steeper backwardations. The trailing stop on our MSCI Global Metals & Mining Producers ETF (PICK) position recommended 10 December 2020 was elected, which stopped us out with a gain of 23.9%. We are getting long the PICK again at tonight's close. Robert P. Ryan Chief Commodity & Energy Strategist rryan@bcaresearch.com Ashwin Shyam Research Associate Commodity & Energy Strategy ashwin.shyam@bcaresearch.com Commodities Round-Up Energy: Bullish Commercial crude oil stocks in the US (ex-SPR barrels) fell 7.6mm barrels w/w in the week ended 18 June 2021, according to the US EIA. Including products, US crude and product inventories were down 5.8mm barrels. US domestic crude oil production was down 100k b/d, ending the week at 11.1mm b/d. Overall product supplied, the EIA's proxy for refined-product demand, was up 180k b/d at 20.75mm b/d, which is 129k b/d below 2019 demand for the same period. At 9.44mm b/d, gasoline demand was just below comparable 2019 consumption of 9.47mm b/d, while jet-fuel demand remains severely depressed vs. comparable 2019 consumption at 1.58mm b/d (vs. 1.92mm b/d). Distillate demand (e.g., diesel fuel) for the week ended 18 June 2021 was 3.95mm b/d vs. 3.97mm b/d for the comparable 2019 period. Base Metals: Bullish Benchmark spot iron ore (62% Fe) prices are holding above $210/MT in trading this week, as demand for the steel input remains strong in China (Chart 5). The Chinese Communist Party (CCP) increased its level of intervention in the iron ore market this week, launching investigations into “malicious speculation,” vowing to “severely punish” anyone found to be engaged in such behavior, according to ft.com.7 Benchmark iron ore prices hit $230/MT in May. We continue to expect exports from Brazil to pick up in 2H21, which will push prices lower in 2H21. Precious Metals: Bullish In the aftermath of last Wednesday’s FOMC meeting gold prices lost nearly $86/oz (Chart 6). Our colleagues at BCA Research's USBS believe markets are paying too much attention to the Fed’s dot plots, and not to the central bank’s verbal guidance.8 Originally, the Fed stated that it will only start raising interest rates once a checklist of three conditions have been met. This checklist includes guidance on actual and expected inflation rates and the labor market. Gold prices did not react to Chair Powell's testimony before the House Select Subcommittee on the Coronavirus Crisis. Ags/Softs: Neutral US spring wheat prices are rallying on the back of dry weather in the northern Plains, while forecasts for benign crop weather in the Midwest pressured soybeans lower this week, according to successfulfarming.com. Chart 5 Chart 6 Footnotes 1 Please see our most recent oil price forecasts published last week in Balance Of Risks Tilts To Higher Oil Prices. It is available at ces.bcaresearch.com. 2 Please see A Perfect Energy Storm On The Way published on June 3, 2021 for further discussion. 3 Please see Less Metal, More Jawboning published on May 27, 2021, which flagged China's likely decision to release strategic stockpiles of base metals. 4 Chart 4 shows implied volatility as a function of the slope of the forward curve, i.e., the difference between the 1st- and 13th-nearby futures divided by the 1st-nearby future vs implied volatilities for Brent and WTI options. This modeling extends Kogan et al (2009), mapping realized volatilities calculated using historical settlements of crude oil futures against the slope of crude oil futures conditioned on 6th- vs. 3rd-nearby futures returns (in %). Please see Kogan, L., Livdan, D., & Yaron, A. (2009), "Oil Futures Prices in a Production Economy With Investment Constraints." The Journal of Finance, 64:3, pp. 1345-1375. 5 Please see fn 2's discussion of the IEA's Net Zero by 2050, A Roadmap for the Global Energy Sector beginning on p. 5 under The Case For A Carbon Tax. 6 Please see Copper supply needs to double by 2050, Glencore CEO says published on June 23, 2021 by reuters.com. Of course, being a copper producer with large-scale base-metals projects due to come on line in the next year or so, Mr. Glasenberg could be talking his book, but as Chart 3 shows, copper has been and likely will be in physical deficits for years. 7 Please see China cracks down on iron ore market, published by ft.com on June 21, 2021. 8 Please see How To Re-Shape The Yield Curve Without Really Trying, published on June 22, 2021. Investment Views and Themes Strategic Recommendations Tactical Trades Commodity Prices and Plays Reference Table Trades Closed in 2021 Summary of Closed Trades
Highlights US labor-market disappointments notwithstanding, the global recovery being propelled by real GDP growth in the world's major economies is on track to be the strongest in 80 years. This growth will fuel commodity demand, which increasingly confronts tighter supply. Higher commodity prices will ensue, and feed through to realized and expected inflation. Manufacturers will continue to see higher input and output prices. Our modeling suggests the USD will weaken to end-2023; however, most of the move already has occurred. Real US rates will remain subdued, as the Fed looks through PCE inflation rates above its 2% target and continues to focus on its full-employment mandate (Chart of the Week). Given these supportive inflation fundamentals, we remain long gold with a price target of $2,000/oz for this year. We are upgrading silver to a strategic position, expecting a $30/oz price by year-end. We remain long the S&P GSCI Dynamic Roll Index ETF (COMT) and the S&P GSCI, expecting tight supply-demand balances to steepen backwardations in forward curves, and long the Global Metals & Mining Producers ETF (PICK). Global economic policy uncertainty will remain elevated until broader vaccine distributions reduce lockdown risks. Feature The recovery of the global economy catalyzed by massive monetary accommodation and fiscal stimulus is on track to be the strongest in the past 80 years, according to the World Bank.1 The Bank revised its growth expectation for real GDP this year sharply higher – to 5.6% from its January estimate of 4.1%. For 2022, the rate of global real GDP growth is expected to slow to 4.3%, which is still significantly higher than the average 3% growth of 2018-19. DM economies are expected to grow at a 4% rate this year – double the average 2018-19 rate – while EM growth is expected to come in at 6% this year vs a 4.2% average for 2018-19. The big drivers of growth this year will be China, where the Bank expects an unleashing of pent-up demand to push real GDP up by 8.5%, and the US, where massive fiscal and monetary support will lift real GDP 6.8%. The Bank expects other DM economies will contribute to this growth, as well. Growth in EM economies will be supported by stronger demand and higher commodity prices, in the Bank's forecast. Commodity demand is recovering faster than commodity supply in the wake of this big-economy GDP recovery. As a result, manufacturers globally are seeing significant increases in input and output prices (Chart 2). Chart of the WeekUS Real Rates Continue To Languish Chart 2Global Manufacturers' Prices Moving Higher These price increases at the manufacturing level reflect the higher-price environment in global commodity markets, particularly in industrial commodities – i.e., bulks like iron ore and steel; base metals like copper and aluminum; and oil prices, which touch most processes involved in getting materials out of the ground and into factories before they make their way to consumers, who then drive to stores to pick up goods or have them delivered. Chart 3Commodity Price Increases Reflected in CPI Inflation Expectations These price pressures are being picked up in 5y5y CPI swaps markets, which are cointegrated with commodity prices (Chart 3). This also is showing up in shorter-tenor inflation gauges – monthly CPI and 2y CPI swaps. Oil prices, in particular, will be critical to the evolution of 5-year/5-year (5y5y) CPI swap rates, which are closely followed by fixed-income markets (Chart 4). Chart 4Oil Prices Are Key To 5Y5Y CPI Swap Rates Higher Gold Prices Expected CPI inflation expectations drive 5-year and 10-year real rates, which are important explanatory variables for gold prices (Chart 5).2 In addition, the massive monetary and fiscal policy out of the US also is driving expectations for a lower USD: Currency debasement fears are higher than they otherwise would be, given all the liquidity and stimulus sloshing around global markets, which also is bullish for gold (Chart 6). Chart 5Weaker Real Rates Bullish For Gold Chart 6Weaker USD Supports Gold All of these effects, particularly the inflationary impacts, are summarized in our fair-value gold model (Chart 7). At the beginning of 2021, our fair-value gold model indicated price would be closer to $2,005/oz, which was well above the actual gold price in January. Gold prices have remained below the fair value model since the beginning of 2021. The model explains gold prices using real rates, TWIB, US CPI and global economic policy uncertainty. Based on our modeling, we expect these variables to continue to be supportive of gold, bolstering our view the yellow metal will reach $2000/ oz this year. Unlike industrial commodities, gold prices are sensitive to speculative positioning and technical indicators. Our gold composite indicator shows that gold prices may be reflecting bullish sentiment. This sentiment likely reflects increasing inflation expectations, which we use as an explanatory variable for gold prices. The fact that gold is moving higher on sentiment is corroborated by the latest data point from Marketvane’s gold bullish consensus, which reported 72% of the traders expect prices to rise further (Chart 8). Chart 7BCAs Gold Fair-Value Model Supports 00/oz View Chart 8Sentiment Supports Oil Prices Investment Implications The massive monetary and fiscal stimulus that saw the global economy through the worst of the economic devastation of the COVID-19 pandemic is now bubbling through the real economy, and will, if the World Bank's assessment proves out, result in the strongest real GDP growth in 80 years. Liquidity remains abundant and interest rates – real and nominal – remain low. In its latest Global Economic Prospects, the Bank notes, " The literature generally suggests that monetary easing, both conventional and unconventional, typically boosts aggregate demand and inflation with a lag of 1-3 years …" The evidence for this is stronger for DM economies than EM; however, as the experience in China shows, scale matters. If the Bank's assessment is correct, the inflationary impulse from this stimulus should be apparent now – and it is – and will endure for another year or two. This stimulus has catalyzed organic growth and will continue to do so for years, particularly in economies pouring massive resources into renewable-energy generation and the infrastructure required to support it, a topic we have been writing about for some time.3 We remain long gold with a price target of $2,000/oz for this year. We are long silver on a tactical basis, but given our growth expectations, are upgrading this to a strategic position, expecting a $30/oz price by year-end. As we have noted in the past, silver is sensitive to all of the financial factors we consider when assessing gold markets, and it has a strong industrial component that accounts for more than half of its demand.4 Supportive fundamentals remain in place, with total supply (mine output and recycling) falling, demand rising and balances tightening (Chart 9). Worth noting is silver's supply is constrained because of underinvestment in copper production at the mine level, where silver is a by-product. On the demand side, continued recovery of industrial and consumer demand will keep silver prices well supported. In terms of broad commodity exposure, we remain long the S&P GSCI Dynamic Roll Index ETF (COMT) and the S&P GSCI, expecting tight supply-demand balances to continue to draw down inventories – particularly in energy and metals markets – which will lead to steeper backwardations in forward curves. Backwardation is the source of roll-yields for long commodity index investments. Investors initially have a long exposure in deferred commodity futures contracts, which are then liquidated and re-established when these contracts become more prompt (i.e., closer to delivery). If the futures' forward curves are backwardated, investors essentially are buying the deferred contracts at a lower price than the price at which the position likely is liquidated. We also remain long the Global Metals & Mining Producers ETF (PICK), an equity vehicle that spans miners and traders; the longer discounting horizon of equity markets suits our view on metals. Chart 9Upgrading Silver To Strategic Position Chart 10Wider Vaccine Distribution Will Support Gold Demand Global economic policy uncertainty will remain elevated until broader vaccine distributions reduce lockdown risks. We expect the wider distribution of vaccines will become increasingly apparent during 2H21 and in 2022. This will be bullish for physical gold demand – particularly in China and India – which will add support for our gold position (Chart 10). Robert P. Ryan Chief Commodity & Energy Strategist rryan@bcaresearch.com Ashwin Shyam Research Associate Commodity & Energy Strategy ashwin.shyam@bcaresearch.com Commodities Round-Up Energy: Bullish The US EIA expects Brent crude oil prices to fall to $60/bbl next year, given its call higher production from OPEC 2.0 and the US shales will outpace demand growth. The EIA expects global oil demand will average just under 98mm this year, or 5.4mm b/d above 2020 levels. For next year, the EIA is forecasting demand will grow 3.6mm b/d, averaging 101.3mm b/d. This is slightly less than the demand growth we expect next year – 101.65mm b/d. We are expecting 2022 Brent prices to average $73/bbl, and $78/bbl in 2023. We will be updating our oil balances and price forecasts in next week's publication. Base Metals: Bullish Pedro Castillo, the socialist candidate in Peru's presidential election, held on to a razor-thin lead in balloting as we went to press. Markets have been focused on the outcome of this election, as Castillo has campaigned on increasing taxes and royalties for mining companies operating in Peru, which accounts for ~10% of global copper production. The election results are likely to be contested by opposition candidate rival Keiko Fujimori, who has made unsubstantiated claims of fraud, according to reuters.com. Copper prices traded on either side of $4.50/lb on the CME/COMEX market as the election drama was unfolding (Chart 11). Precious Metals: Bullish As economies around the world reopen and growth rebounds, car manufacturing will revive. Stricter emissions regulations mean the demand for autocatalysts – hence platinum and palladium – will rise with the recovery in automobile production. Platinum is also used in the production of green hydrogen, making it an important metal for the shift to renewable energy. On the supply side, most platinum shafts in South Africa are back to pre-COVID-19 levels, according to Johnson Matthey, the metals refiner. As a result, supply from the world’s largest platinum producer will rebound by 40%, resulting in a surplus. South Africa accounts for ~ 70% of global platinum supply. The fact that an overwhelming majority of platinum comes from a nation which has had periodic electricity outages – the most recent one occurring a little more than a week ago – could pose a supply-side risk to this metal. This could introduce upside volatility to prices (Chart 12). Ags/Softs: Neutral As of 6 June, 90% of the US corn crop had emerged vs a five-year average of 82%; 72% of the crop was reported to be in good to excellent condition vs 75% at this time last year. Chart 11 Chart 12 Footnotes 1 Please see World Bank's Global Economic Prospects update, published June 8, 2021. 2 In fact, US Treasury Inflation-Indexed securities include the CPI-U as a factor in yield determination. 3 For our latest installment of this epic evolution, please see A Perfect Energy Storm On The Way, which we published last week. It is available at ces.bcareserch.com. 4 Please see Higher Inflation Expectations Battle Lower Risk Premia In Gold Markets, which we published February 4, 2021. It is available at ces.bcareserch.com. Investment Views and Themes Strategic Recommendations Tactical Trades Commodity Prices and Plays Reference Table Trades Closed in 2021 Summary of Closed Trades