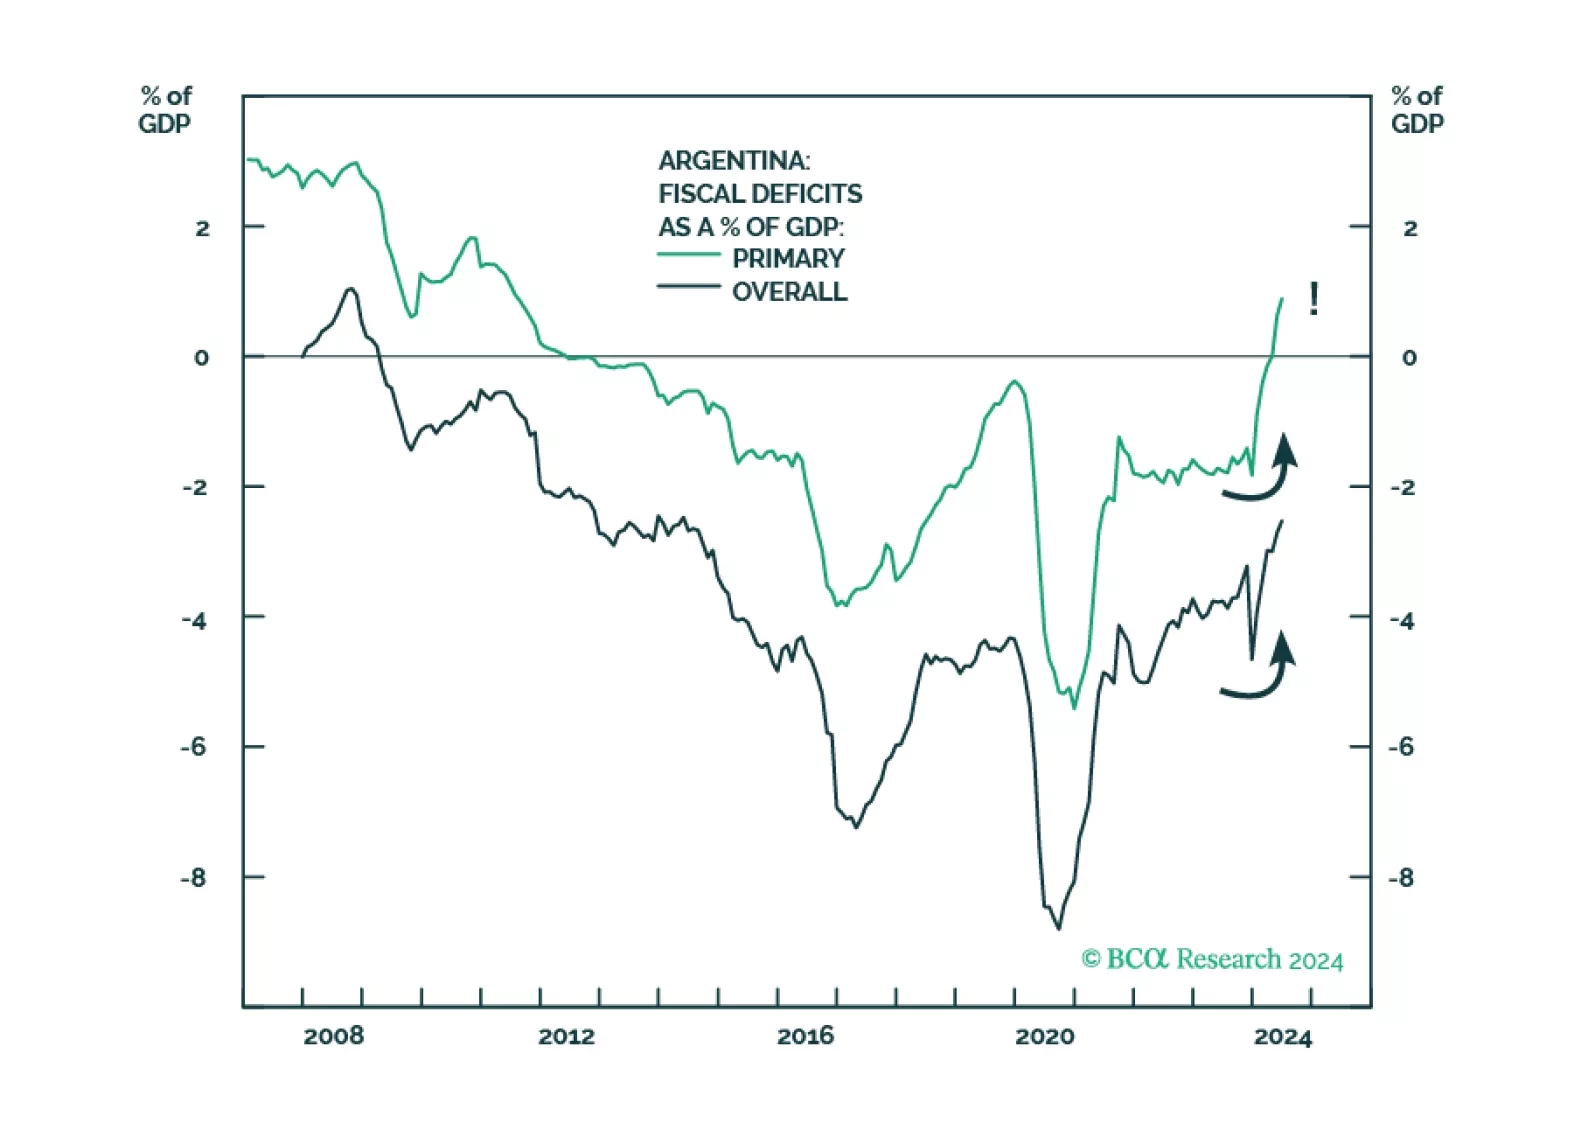
Analyses on the Philippines, Colombia and Argentina are available below. Highlights Global growth conditions, especially outside the U.S., remain bond friendly. Nevertheless, U.S. bonds are overbought and technical factors might exert upward pressure on them in the near term. Our ubiquitous premise remains that EM currencies and EM risk assets are primarily driven by cycles in global trade and the Chinese economy rather than U.S. growth and interest rates. There are no signs of investor capitulation that mark a major bottom in EM risk assets. Feature Given the recent plunge in bond yields around the world, we are devoting this week’s report to discussing the implications of low U.S. bond yields on EM risk assets. Our key takeaway is that lower U.S. bond yields are not a reason to be long EM risk assets and currencies. Low Bond Yields: Reflective Or Stimulative? With respect to ultra-low bond yield, investors and commentators generally subscribe to one of the following two arguments: Bond yields are reflective – i.e. they are indicative of an upcoming economic calamity and thereby signal a bearish outlook for equity and credit markets; The current low levels of bond yields signify a dovish monetary policy stance and hence are bullish for global risk assets. In our opinion, it is not a certainty that the bond market always has perfect foresight of the economic outlook. At the same time, falling global bond yields and easing central banks do not automatically ensure a pickup in global economic activity. Hence, low bond yields do not justify a bullish stance on global stocks and credit markets. Like any other financial market, bonds are driven by time-varying forces. In certain times, bond yields signal a correct trajectory for growth, inflation and monetary policy. At other times, bond prices are driven by investor sentiment and momentum-chasing trading strategies. In times where the latter is occurring, the bond market can send the wrong signal on growth and inflation, as well as misprice the future path of interest rates. U.S. bond yields are presently correct in signaling that global growth continues to decelerate. This is corroborated by many other indicators that we have been publishing. Presently, we have the following observations and reflections on U.S. bond yields: U.S. bond yields are presently correct in signaling that global growth continues to decelerate. This is corroborated by many other indicators that we have been publishing. However, this does not imply that U.S. bond yields will be a reliable leading indicator at the bottom of this business cycle. The basis is that U.S. bond yields did not lead at the top of the cycle. On the contrary, U.S. bond yields lagged the global business cycles by a considerable margin in both 2015-‘16 and in 2018-’19, when the growth slowdown emanated from China/EM. Chart I-1 illustrates that Chinese nominal manufacturing output and import volume growth rolled over in December 2017, yet U.S. bond yields rolled over in October 2018. In recent years, U.S. bond yields have also lagged the global manufacturing PMI index by about six to nine months (Chart I-2, top panel). Chart I-1China’s Business Cycle Led U.S. Bond Yields Chart I-2Global Manufacturing And EM Stocks Led U.S. Bond Yields Remarkably, EM financial markets have been leading U.S. bond yields in recent years, not the other way around (Chart I-2, bottom panel). For some time we have held the view that the ongoing growth slump in China would culminate into a global manufacturing and trade recession that would be negative for the rest of the world, especially for EM, Japan, commodities producers, and Germany. This theme has been the main reason for our negative view on global stocks, especially cyclicals, as well as our positive stance on safe-haven bonds and bullish view on the dollar. Understanding the origins of this global manufacturing and trade downtrend is critical to gauging the evolution of the business cycle. China is the epicenter of this global trade and manufacturing recession. In turn, the root cause of the mainland’s growth slump is money/credit tightening that has occurred in China in both 2017 and early 2018. Money and credit growth remain lackluster in the Middle Kingdom, despite ongoing fiscal and monetary policy easing (Chart I-3). Notably, domestic credit growth and its impulse have been muted, especially when issuance of government bonds is excluded (Chart I-4). The aggregate credit and fiscal stimulus have so far been insufficient to engineer a recovery. Chart I-3China: Fiscal Deficit And Broad Money Growth Chart I-4China: Private Sector Credit Growth Is Weak Federal Reserve’s policy tightening was not the reason behind the current worldwide manufacturing recession. U.S. domestic demand has not been the source of the ongoing global manufacturing and trade recession. U.S. final domestic demand was robust until Q4 2018 and has so far downshifted only modestly (Chart I-5, top panel). Corroborating this, U.S. manufacturing was the last shoe to drop in the global manufacturing recession (Chart I-5, bottom panel). Accordingly, the Federal Reserve’s policy tightening was not the reason behind the current worldwide manufacturing recession. It follows that lower U.S. interest rates might not be essential to instigate a global economic recovery. Critically, the latest plunge in EM currencies and widening in EM credit spreads has occurred amid falling U.S. bond yields and Fed easing. Chart I-5U.S. Economy And Bond Yields Have Lagged In This Cycle Chart I-6U.S. Bond Yields And EM: No Stable Correlation We have long argued against the consensus view that EM equities, credit markets and currencies are much more sensitive to U.S. interest rates than to the global business cycle. Chart I-6 reveals that there has been no stable correlation between U.S. bond yields and EM credit spreads and currencies. Therefore, a bottom in EM currencies and risk assets will occur when global trade and Chinese demand ameliorate rather than as a result of Fed policy. An important question is whether low bond yields are going to support global share prices. Our hunch is that it is not likely.1 First, if U.S. bond yields had not dropped by as much as they have, global equity prices would be lower. In short, reduced long-term interest rate expectations have led investors to pay higher multiples, especially for non-cyclical and growth stocks. The U.S. equity rally since early this year has been due to multiples expansion, especially among non-cyclical and growth stocks. Chart I-7Global Ex-U.S. Share Prices: No Bull Market Here The latter has allowed the S&P 500 to reach new highs recently at a time when global ex-U.S. share prices are not far from their December lows (Chart I-7). Second, falling interest rates are positive for share prices when profits are growing, even if at a slower rate. When corporate profits are contracting, lower interest rates typically do not preclude equity prices from dropping. Going forward, U.S. equities remain at risk due to a potential profit contraction. We do not foresee a recession in U.S. household spending. However, America’s corporate earnings will be under pressure from a stronger dollar and shrinking profit margins due to rising unit labor costs (Chart I-8), notwithstanding the manufacturing recession that is taking hold. Chart I-8U.S. Corporate Profits Are At Risk From Margins One popular narrative attributes exceptionally low bond yields to excess savings over investments. Yet this is not always accurate. Box I-1 below explains why bond yields have little relation to savings and investments in any economy. Chart I-9U.S. Bonds Are High-Yielders Among DM Finally, some investors wonder if the low/negative bond yields in DM ex-U.S. could push U.S. Treasury yields lower. Our take is that it is possible. The spread of U.S. Treasury yields over DM ex-U.S. is very wide, which could entice foreign fixed-income investors to purchase Uncle Sam’s bonds (Chart I-9). What is preventing foreign fixed-income investors from piling into Treasuries is exchange rate risk. If for whatever reason a consensus emerges among global fixed-income investors that the greenback is not going to depreciate in the next 12-18 months, there could be a stampede of foreign investors into U.S. Treasuries, pushing yields considerably lower. In our opinion, the odds are that the broad trade-weighted dollar will stay firm for now and could make new cycle highs. In such a scenario, investor expectations of U.S. currency depreciation will diminish. This could trigger a stampede of foreign fixed-income investors into U.S. bonds. This is not a forecast but a consideration that bond investors should take into account. Bottom Line: Global growth conditions, especially outside the U.S., remain bond friendly. Nevertheless, bonds are overbought and technical factors discussed in Box I-1 below might exert upward pressure on U.S. bond yields in the near term. Implications For EM We explore three scenarios for the direction of U.S. bond yields in the coming weeks and months and the corresponding potential dynamics for EM risk assets and currencies. Scenario 1: U.S. bond yields continue to fall as the global trade and manufacturing recession endures, suppressing global growth. Outcome: EM currencies will depreciate and EM risk assets will suffer more. Scenario 2: U.S. Treasury yields increase because U.S. domestic demand firms up, even if the global trade contraction persists. Outcome: EM currencies will weaken and EM risk assets will sell off further. Scenario 3: U.S. bond yields rise because the global manufacturing recession abates and a recovery in China leads to a global trade revival. Outcome: EM currencies will appreciate and risk assets will rally considerably. Please note that Scenario 3 is not our baseline scenario. The ubiquitous premise in these deliberations is that EM currencies and EM risk assets are primarily driven by cycles in global trade and the Chinese economy rather than U.S. growth and interest rates. EM currencies and EM risk assets are primarily driven by cycles in global trade and the Chinese economy rather than U.S. growth and interest rates. Chart I-10Stay With Short EM Equities / Long 30-Year U.S. Bonds Strategy To capitalize on our view of weaker global growth emanating from China/EM, we have been recommending the following strategy: short EM stocks / long U.S. 30-year Treasuries. This recommendation has panned out nicely, delivering a 21.5% gain since its initiation on April 10, 2017 (Chart I-10). Barring Scenario 3 above, this trade has more upside. EM Financial Markets: No Capitulation So Far Major bottoms in financial markets typically occur after investor capitulation has already taken place. Having reviewed various financial market variables, we conclude that signposts of capitulation in EM risk assets and global equities are absent: The S&P 500 SKEW index is very low. This index reflects the probability that investors are assigning to downside risk in share prices. The SKEW index is currently at one of its lowest readings of the past 30 years (since its existence), which suggests that investors are not hedging themselves against large price swings (Chart I-11). This usually occurs prior to a heightened period of volatility. Chart I-11Are U.S. Equity Investors Complacent? The volatility measures for EM and commodity currencies are still very subdued (Chart I-12). The same is true for EM equity volatility (Chart I-12, bottom panel). Even though EM and commodities currencies as well as EM share prices have fallen substantially, the price of buying insurance is still low – meaning investors are still not particularly worried. This habitually is a sign of complacency. Chart I-12Cyclical Risk Markets: Implied Volatility Remains Low Chart I-13No Capitulation Among EM Equity And Currency Investors Finally, Chart I-13 shows that asset managers’ and leveraged funds’ net long positions in EM equity index futures and high-beta liquid currencies futures were still elevated as of August 15. Bottom Line: There are no signs of investor capitulation that often mark a major bottom in risk assets. BOX 1 Do Bond Yields Equilibrate Savings And Investment? Mainstream economic theory regards bond yields as the interest rate that balances desired savings and desired investment. According to mainstream theory, when desired savings rise relative to desired investment, bond yields drop. The latter induces less savings and more investment equilibrating the system. Conversely, when desired investment increases relative to desired savings, bond yields climb, discouraging investment and incentivizing more savings. The fundamental shortcoming of this economic model stems from the misrepresentation of banking. When a commercial bank buys any security from a non-bank, it originates a new deposit “out of thin air.” The bank does not allocate someone’s deposit into bonds. Diagram I-1 below exhibits this point. When a U.S. bank purchases a dollar-denominated bond from a pension fund, it does not use someone’s deposit to do so. Rather, a new deposit in the U.S. banking system (often at another bank) is created “out of thin air” as a result of the transaction. The amount of bonds commercial banks can purchase is limited only by regulatory norms, liquidity provision by the central bank as well as its management’s willingness to do so. Nobody needs to save for a bank to buy a bond or make a loan. We have written in past reports on money, credit and savings that deposits in the banking system have no relationship with national or household savings. When an individual or company saves, the amount of deposits in the banking system does not change. All in all, banks do not intermediate savings/deposits into credit/loans. They create new deposits “out of thin air” when they originate a loan to or buy any security from a non-bank. Provided that banks do not utilize national savings or existing deposits to acquire bonds, fluctuations in bond yields do not reflect changes in national savings. Holding everything else constant, bond yields could drop if commercial banks buy bonds en masse. The opposite also holds true. Chart I-14 demonstrates that U.S. commercial banks have been augmenting their purchases of various types of bonds. This partially explains why bond yields have plunged (bond yields shown inverted on this chart). If U.S. banks’ bonds purchases mean revert, as they often do, U.S. bond yields could rise. Chart I-14Are U.S. Banks' Purchases Of Bonds Driving Bond Yields? This along with more bond issuance by the U.S. Treasury to refill its Treasury’s General Account at the Fed as well as the existing overbought conditions in government bonds could produce a pick-up in yields. Such a rebound in bond yields would be technical and would not signal fundamental changes in the U.S. or global business cycles, or in the savings-investment balance. Closing Some Positions Long Latin American / short emerging Asian equity indexes. This position has generated a 6% loss since its initiation on October 11, 2018 and we have low confidence that it will generate positive returns going forward. Long Chinese small cap / short EM small-cap stocks. Our bet has been that Chinese private sector companies trading in Hong Kong and represented in the MSCI small-cap index will perform better than the average EM small cap. This strategy has not worked out and has produced a 4.4% loss since its recommendation on November 20, 2013. We are downgrading Colombian equities from neutral to underweight. Please refer to pages 17-20 for a detailed analysis. Instead, we are upgrading the Peruvian bourse from underweight to a neutral allocation within an EM equity portfolio. Our view remains that gold prices will continue outperforming oil.2 Peru benefits from higher gold and silver prices while Colombia is largely an oil play. Consistently, the Peruvian currency will depreciate less than the Colombian peso. These justify this allocation shift between these two bourses. Arthur Budaghyan Chief Emerging Markets Strategist arthurb@bcaresearch.com Philippines: The Currency Holds The Key Government expenditures, in general, and infrastructure investment, in particular, will rise meaningfully in the next few months. Chart II-1Philippine Current Account Deficit Funded By Volatile Portfolio Flows Declining U.S. interest rates coupled with slumping oil prices have supported Philippine financial markets. However, the country’s balance of payments dynamics are still precarious. In particular, Philippine’s wide current account (CA) deficit will need to be funded by volatile foreign portfolio inflows as the basic balance – the sum of CA balance and net FDI – has turned negative (Chart II-1). Critically, the already wide current account deficit is set to balloon even further: First, the 2019 fiscal spending was back-loaded because a Congress impasse delayed the government budget approval to April. Hence, government expenditures, in general, and infrastructure investment, in particular, will rise meaningfully in the next few months. Higher infrastructure spending will drive imports of capital goods higher (Chart II-2). The latter accounts for 32% of total imports. Second, Philippine export growth is likely to contract anew as global trade is not recovering (Chart II-3). Chart II-2Philippine Government Infra Spending Will Accelerate Chart II-3Philippine Exports Will Contract We continue to expect broad portfolio capital outflows from EM. Potential for foreign outflows from the Philippines is large. Foreign ownership of local equities is high at 42%. As to foreign ownership of local currency bonds, it stands at around 13%. A renewed decline in the peso will drive away portfolio flows reinforcing additional currency depreciation. The falling peso will prevent the central bank from reducing interest rates further. Even if the central bank does not hike rates to support the peso, market-driven local rates could rise for a period of time. This is bad news for property stocks – which account for about 27% of the MSCI Philippines index. Having rallied considerably, they are at major risk as local interest rates rise. In addition, these stocks have benefited from strong real estate demand emanating from the Philippine Offshore Gaming Operators (POGO) sector – which itself has been largely driven by Chinese capital flows. Both the Chinese and Philippine authorities have begun cracking down fiercely on these operations because they are link to capital flight out of China. This crackdown will curtail capital flows into these areas and depress revenues of Philippine real estate companies. This will occur at a time when the residential market is experiencing weak demand. We continue to recommend shorting/underweighting property stocks. Finally, small cap stocks are in a bear market and are sending an ominous signal (Chart II-4). Furthermore, this bourse is neither attractive in absolute terms nor relative to EM (Chart II-5). Chart II-4Small-Cap Stocks Are In A Bear Market Chart II-5Philippine Equities Are Expensive Bottom Line: We continue recommending to short the Philippine peso against the U.S. dollar. Overall, EM dedicated investors should continue underweighting the Philippine equity, fixed income and sovereign credit markets within their respective EM universes. Ayman Kawtharani, Editor/Strategist ayman@bcaresearch.com Colombia: A Top In The Business Cycle? Colombia’s business cycle has reached a top and growth will slow considerably in the next 12 months. Falling oil prices and fiscal tightening will cause the Colombian economy to slow down in the next 12 months. What’s more, a depreciating peso and sticky inflation will prevent the central bank (Banrep) from frontloading rate cuts to mitigate the downtrend. The Colombian peso is making new cyclical lows and more weakness is in the cards. While the currency is slightly cheap according to the real effective exchange rate based on unit labor costs (Chart III-1), our negative view on oil prices entails further currency depreciation. Colombia is still very heavily reliant on oil exports – the current account deficit is 4.3% of GDP with oil, but 8.4% excluding it (Chart III-2). Moreover, a chunk of FDIs are destined for the energy sector, and foreign portfolio flows are contingent on exchange rate stability. Therefore, falling oil prices and a weaker peso will result in diminishing FDIs and foreign portfolio flows, reinforcing downward pressure on the currency. Chart III-1The Colombian Peso Is Not That Cheap Chart III-2Current Account Deficit Is Large And Widening Notably, there is a significant pass-through effect from the currency to inflation (Chart III-3). Even though Banrep does not target the exchange rate, having both headline and core inflation above the 3% central target will constrict it from cutting interest rates soon. On the whole, odds are that Colombia’s business cycle has reached a top and growth will slow considerably in the next 12 months. The yield curve is signaling an economic slowdown ahead (Chart III-4). Chart III_3The Exchange Rate And Inflation Chart III-4Domestic Demand Is About To Roll Over Our credit and fiscal spending impulse might be peaking, signifying a top in domestic demand growth (Chart III-5). The impulse is rolling over primarily due to the substantial fiscal tightening. Duque’s administration has slashed expenditures and the latter are contracting in inflation-adjusted terms (Chart III-6). Chart III-5A Top In The Business Cycle? Chart III-6Severe Fiscal Tightening Government revenues are highly dependent on oil exports, and the recent fall in oil prices will bring about a contraction in fiscal revenues. This, and the government’s strong adherence to fiscal surplus, implies no loosening up on the fiscal side. Finally, our proxy for marginal propensity to spend for businesses and households is indicating that growth is about to roll over (Chart III-7). Auto sales are also weakening, and housing sales are contracting (Chart III-8). Chart III-7The Business Cycle Is Peaking Chart III-8Colombia: Certain Segments Have Turned Over Given that both fiscal and monetary policies are unlikely to be relaxed soon, the peso will come under renewed selling pressure, acting as a release valve for the Colombian economy. Investment Recommendations We are downgrading this bourse from neutral to an underweight allocation within a dedicated EM equity portfolio. In its place, we are upgrading Peruvian stocks from underweight to neutral. Continue shorting COP versus RUB. This trade has generated a 14% return since its initiation on May 31st of last year. Finally, within EM local currency bond and sovereign credit portfolios, Colombia warrants a neutral allocation. We also recommend fixed-income investors continue to bet on further yield curve flattening: receive 10-year / pay 1-year swap rates. Juan Egaña, Research Associate juane@bcaresearch.com Argentina: Do Not Catch A Falling Knife The latest rout in Argentine markets has brought fears of another sovereign debt default or restructuring. Are conditions right for buying Argentine markets? Politics complicate the assessment of a debt restructuring and we do not recommend bottom fishing in Argentine financial markets. Looking at the profile of past financial crises and debt defaults, there might be more downside in Argentine asset prices. Sovereign U.S. dollar bond prices remain well above their 2002 and 2008 lows (Chart IV-1). Compared with previous EM financial crises, Argentine stocks might still have considerable downside in U.S. dollar terms (Chart IV-2). Chart IV-1Things Could Get Worse Chart IV-2Historical Patterns Suggest More Downside In Bank Stocks The equity market index has relapsed below its 2018 lows in dollar terms, which technically qualifies as a breakdown and entails fresh lows ahead (Chart IV-3). Chart IV-3A Technical Breakdown In Argentine Equities In addition to political uncertainty and rising possibility of a left-wing run government, the nation’s ability to service its foreign currency debt has deteriorated with the currency plunging to new lows. Specifically, the country has large foreign debts of $275 billion. Foreign obligation payments in the next 12 months are about $40 billion. The government lacks foreign currency reserves and export revenues necessary to service its external debt. The central bank’s net foreign exchange reserves (excluding FX swaps and gold) are about $17 billion. The country’s annual exports are $77.5 billion. With agricultural commodities prices falling, exports will likely shrink. By and large, our downbeat stance from April remains intact. Bottom Line: Investors should continue avoiding and underweighting Argentine financial markets. Andrija Vesic, Research Analyst andrijav@bcaresearch.com Footnotes 1 Please note this is the view of BCA’s Emerging Markets Strategy service and is different from BCA’s house view. Clients can read the debate between various BCA strategists in the report What Goes On Between Those Walls? BCA’s Diverging Views In The Open. Please click on the link to access it. 2 We recommended the long gold / short copper and oil trade on July 11, 2019 and this position remains intact. Equities Recommendations Currencies, Fixed-Income And Credit Recommendations