Biotechnology
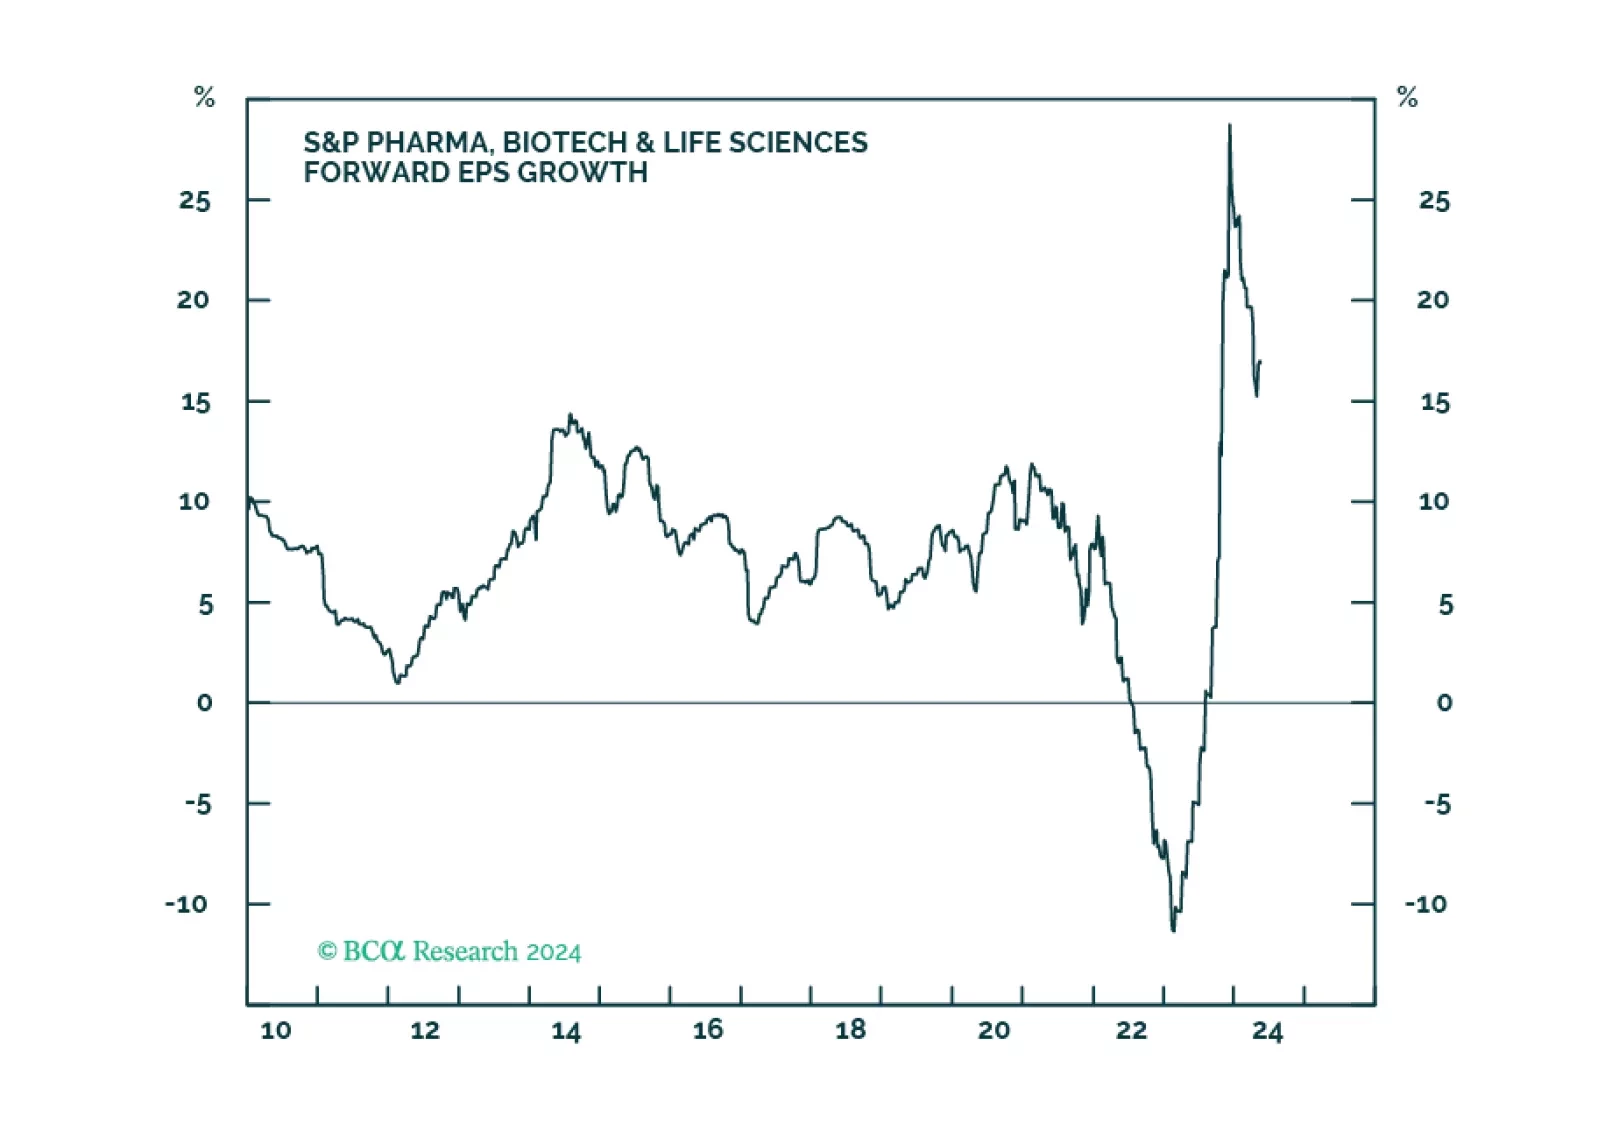
We recommend overweight in Pharma over a tactical and strategic investment horizon, as challenges, that have recently hampered the industry group’s performance, are dissipating. Likely election outcomes are positive for the industry, while major trends like generative AI applied to drug development and an aging population are long-term tailwinds.
Our political forecasting scored wins in 2023 but we failed to capitalize on it adequately in our trade recommendations.

Executive Summary Biden Taps China-Bashing Consensus House Speaker Nancy Pelosi’s visit to Taiwan reflects one of our emerging views in 2022: the Biden administration’s willingness to take foreign policy risks ahead of the midterm elections. Biden’s foreign policy will continue to be reactive and focused on domestic politics through the midterms. Hence global policy uncertainty and geopolitical risk will remain elevated at least until November 8. Biden is seeing progress on his legislative agenda. Congress is passing a bill to compete with China while the Democrats are increasingly likely to pass a second reconciliation bill, both as predicted. These developments support our view that President Biden’s approval rating will stabilize and election races will tighten, keeping domestic US policy uncertainty elevated through November. These trends pose a risk to our view that Republicans will take the Senate, but the prevailing macroeconomic and geopolitical environment is still negative for the ruling Democratic Party. We expect legislative gridlock and frozen US fiscal policy in 2023-24. Close Recommendation (Tactical) Initiation Date Return Long Refinitiv Renewables Vs. S&P 500 Mar 30, 2022 25.4% Long Biotech Vs. Pharmaceuticals Jul 8, 2022 -3.3% Bottom Line: While US and global uncertainty remain high, we will stay long US dollar, long large caps over small caps, and long US Treasuries versus TIPS. But these are tactical trades and are watching closely to see if macroeconomic and geopolitical factors improve later this year. Feature President Biden’s average monthly job approval rating hit its lowest point, 38.5%, in July 2022. However, Biden’s anti-inflation campaign and midterm election tactics are starting to bear fruit: gasoline prices have fallen from a peak of $5 per gallon to $4.2 today, the Democratic Congress is securing some last-minute legislative wins, and women voters are mobilizing to preserve abortion access. These developments mean that the Democratic Party’s electoral prospects will improve marginally between now and the midterm election, causing Senate and congressional races to tighten – as we have expected. US policy uncertainty will increase. Investors will see a rising risk that Democrats will keep control of the Senate – and conceivably even the House – and hence retain unified control of the executive and legislative branches. This “Blue Sweep” risk will challenge the market consensus, which overwhelmingly (and still correctly) expects congressional gridlock in 2023-24. A continued blue sweep would mean larger tax hikes and social spending, while gridlock would neutralize fiscal policy for the next two years. Investors should fade this inflationary blue sweep risk and continue to plan for disinflationary gridlock. First, our quantitative election models still predict that Democrats will lose control of both House and Senate (Appendix). Second, Biden’s midterm tactics face very significant limitations, particularly emanating from geopolitics – the snake in this report’s title. Pelosi’s Trip To Taiwan Raises Near-Term Market Risks One of Biden’s election tactics is our third key view for 2022: reactive foreign policy. Initially we viewed this reactiveness as “risk-averse” but in May we began to argue that Biden could take risky bets given his collapsing approval ratings. Either way, Biden is using foreign policy as a means of improving his party’s domestic political fortunes. In particular, he is willing to take big risks with China, Russia, Iran, and terrorist groups like Al Qaeda. The template is the 1962 congressional election, when President John F. Kennedy largely defied the midterm election curse by taking a tough stance against Russia in the Cuban Missile Crisis (Chart 1). If Biden achieves a foreign policy victory, then Democrats will benefit. If he instigates a crisis, voters will rally around his administration out of patriotism. Nancy Pelosi’s visit to Taipei is the prominent example of this key view. The trip required full support from the US executive branch and military and was not only the swan song of a single politician. It was one element of the Biden administration’s decision to maintain the Trump administration’s hawkish China policy. Thus while Congress passes the $52 billion Chips and Science Act to enhance US competitiveness in technology and semiconductor manufacturing, Biden is also contemplating tightening export controls on computer chip equipment that China needs to upgrade its industry.1 Biden is reacting to a bipartisan and popular consensus holding that the US needs to take concrete measures to challenge China and protect American industry (Chart 2). This is different from the old norm of rhetorical China-bashing during midterms. Chart 1Biden Provokes Foreign Rivals Chart 2Biden Taps China-Bashing Consensus Reactive US foreign policy will continue through November and possibly beyond – including but not limited to China. The US chose to sell long-range weapons to Ukraine and provide intelligence targeting Russian forces, prompting Russia to declare that the US is now “directly” involved in the Ukraine conflict. The US decision to eradicate Al Qaeda leader Ayman Al-Zawahiri also reflects this foreign policy trend. Reactive foreign policy will increase the near-term risk of new negative geopolitical surprises for markets. Note that the 1962 Cuban Missile Crisis analogy is inverted when it comes to the Taiwan Strait. China is willing to take much greater risks than the US in its sphere of influence. The same goes for Russia in Ukraine. If US policy backfires then it may assist the Democrats in the election – but not if Biden suffers a humiliation or if the US economy suffers as a result. Chart 3US Import Prices Will Stay High From Greater China US import prices will continue to rise from Greater China (Chart 3), undermining Biden’s anti-inflation agenda. Supply kinks in the semiconductor industry will become relevant again whenever demand rebounds (Chart 4). Global energy prices will also remain high as a result of the EU’s oil embargo and Russia’s continued tightening of European natural gas supplies. Chart 4New Semiconductor Kinks Will Appear When Demand Recovers OPEC has decided only to increase oil production by 100,000 barrels per day, despite Biden’s visit to Saudi Arabia cap in hand. We argued that the Saudis would give a token but would largely focus on weakening global demand rather than pumping substantially more oil to help Biden and the Democrats in the election. The Saudis know that Biden is still attempting to negotiate a nuclear deal with Iran that would free up Iranian exports. So the Saudis are not giving much relief, and if Biden fails on Iran, oil supply disruptions will increase. Bottom Line: Price pressures will intensify as a result of the US-China and US-Russia standoffs – and probably also the US-Iran standoff. Hawkish foreign policy is not conducive to reducing inflationary ills. Global policy uncertainty and geopolitical risk will remain high throughout the midterm election season, causing continued volatility for US equities. Abortion Boosts Democratic Election Odds Earlier this year we highlighted that the Supreme Court’s overturning of the 1972 Roe v. Wade decision would lead to a significant mobilization of women voters in favor of the Democratic Party ahead of the midterm election. The first major electoral test since the court’s ruling, a popular referendum in the state of Kansas, produced a surprising result on August 2 that confirms and strengthens this thesis. Kansas is a deeply religious and conservative state where President Trump defeated President Biden by a 15% margin in 2020. The referendum was held during the primary election season, when electoral turnout skews heavily toward conservatives and the elderly. Yet Kansans voted by an 18% margin (59% versus 41%) not to amend the constitution, i.e. not to empower the legislature to tighten regulations on abortion. Voter turnout is not yet reported but likely far higher than in recent non-presidential primary elections. Kansans voted in the direction of nationwide opinion polling on whether abortion should be accessible in cases where the mother’s health is endangered. They did not vote in accordance with more expansive defenses of abortion, which are less popular (Chart 5). If the red state of Kansas votes this way then other states will see an even more substantial effect, at least when abortion is on the ballot. Chart 5Abortion Will Mitigate Democrats’ Losses The question is how much of this Roe v. Wade effect will carry over to the general congressional elections. The referendum focused exclusively on abortion. Voters did not vote on party lines. Voters never like it when governments try to take away rights or privileges that have previously been granted. But in November the election will center on other topics, including inflation and the economy. And midterm elections almost always penalize the incumbent party. Our quantitative election models imply that Democrats will lose 22 seats in the House and two seats in the Senate, yielding Congress to the Republicans next year (Appendix). Still, women’s turnout presents a risk to our models. Women’s support for the Democratic Party has not improved markedly since the Supreme Court ruling, as we have shown in recent reports (Chart 6). But the polling could pick up again. Women’s turnout could be a significant tailwind in a year of headwinds for the Democrats. Bottom Line: Democrats’ electoral prospects have improved, as we anticipated earlier this year (Chart 7). This trend will continue as a result of the mobilization of women. Republicans are still highly likely to take Congress but our conviction on the Senate is much lower than it is on the House. Chart 6Biden’s And Democrats’ Approval Among Women Chart 7Democrats’ Odds Will Improve On Margin Reconciliation Bill: Still 65% Chance Of Passing Ultimately Democrats’ electoral performance will depend on inflation, the economy, and cyclical dynamics. If inflation falls over the course of the next three months, then Democrats will have a much better chance of stemming midterm losses. That is why President Biden rebranded his slimmed down “Build Back Better” reconciliation bill as the “Inflation Reduction Act.” We maintain our 65% odds that the bill will pass, as we have done all year. There is still at least a 35% chance that Senator Kyrsten Sinema of Arizona could defect from the Democrats, given that she opposed any new tax hikes and the reconciliation bill will impose a 15% minimum tax on corporations. A single absence or defection would topple the budget reconciliation process, which enables Democrats to pass the bill on a simple majority vote. We have always argued that Sinema would ultimately fall in line rather than betraying her party at the last minute before the election. This is even more likely given that moderate-in-chief, Senator Joe Manchin of West Virginia, negotiated and now champions the bill. But some other surprise could still erase the Democrats’ single-seat majority, so we stick with 65% odds. Most notably the bill will succeed because it actually reduces the budget deficit – by an estimated $300 billion over a decade (Table 1). Deficit reduction was the original purpose of lowering the number of votes required to pass a bill under the budget reconciliation process. Now Democrats are using savings generated from new government caps on pharmaceuticals (a popular measure) to fund health and climate subsidies. Given deficit reduction, it is conceivable that a moderate Republican could even vote for the bill. Table 1Democrats’ Inflation Reduction Act (Budget Reconciliation) Bottom Line: Democrats are more likely than ever to pass their fiscal 2022 reconciliation bill by the September 30 deadline. The bill will cap some drug prices and reduce the deficit marginally, so it can be packaged as an anti-inflation bill, giving Democrats a legislative win ahead of the midterm. However, its anti-inflationary impact will ultimately be negligible as $300 billion in savings hardly effects the long-term rising trajectory of US budget deficits relative to output. The bill will add to voters’ discretionary income and spur the renewable energy industry. And if it helps the Democrats retain power, then it enables further spending and tax hikes down the road, which would prove inflationary. The reconciliation bill, annual appropriations, and the China competition bill were the remaining bills that we argued would narrowly pass before the US Congress became gridlocked again. So far this view is on track. Investment Takeaways Companies that paid a high effective corporate tax rate before President Trump’s tax cuts have benefited relative to those that paid a low effective rate. They stood to suffer most if Trump’s tax cuts were repealed. But Democrats were forced to discard their attempt to raise the overall corporate tax rate last year. Instead the minimum corporate rate will rise to 15%, hitting those that paid the lowest effective rate, such as Big Tech companies, relative to high-tax rate sectors such as energy (Chart 8, top panel). Tactically energy may still underperform tech but cyclically energy could outperform and the reconciliation bill would feed into that trend. Similarly, companies that faced high foreign tax risk, because they made good income abroad but paid low foreign tax rates, stand to suffer most from the imposition of a minimum corporate tax rate (Chart 8, bottom panel). Again, Big Tech stands to suffer, although it has already priced a lot of bad news and may not perform poorly in the near term. Chart 8Market Responds To Minimum Corporate Tax Chart 9Market Responds To New Climate Subsidies Renewable energy stocks have rallied sharply on the news of the Democrats’ reconciliation bill getting back on track (Chart 9). We are booking a 25.4% gain on this tactical trade and will move to the sidelines for now, although renewable energy remains a secular investment theme. Health stocks, particularly pharmaceuticals, have taken a hit from the new legislation as we expected. However, biotech has not outperformed pharmaceuticals as we expected, so we will close this tactical trade for a loss of 3.3%. The reconciliation bill will cap drug prices for only the most popular generic drugs and does not pose as much of a threat to biotech companies (Chart 10). Biotech should perform well tactically as long bond yields decline – they are also historically undervalued, as noted by Dhaval Joshi of our Counterpoint strategy service. So we will stick to long Biotech versus the broad market. US semiconductors remain in a long bull market and will be in heavy demand once global and US economic activity stabilize. They are also likely to outperform competitors in Greater China that face a high and persistent geopolitical risk premium (Chart 11). Chart 10Market Responds To Drug Price Caps Chart 11Market Responds To China Competition Bill Tactically we prefer bonds to stocks, US equities to global equities, defensive sectors to cyclicals, large caps to small caps, and growth stocks to value stocks (Chart 12). The US is entering a technical recession, Europe is entering recession, China’s economy is weak, and geopolitical tensions are at extreme highs over Ukraine, Taiwan, and Iran. The US is facing an increasingly uncertain midterm election. These trends prevent us from adding risk in our portfolio in the short term. However, much bad news is priced and we are on the lookout for positive economic surprises and successful diplomatic initiatives to change the investment outlook for 2023. If the US and China recommit to the status quo in the Taiwan Strait, if Russia moves toward ceasefire talks in Ukraine, if the US and Iran rejoin the 2015 nuclear deal, then we will take a much more optimistic attitude. Some political and geopolitical risks could begin to recede in the fourth quarter – although that remains to be seen. And even then, geopolitical risk is rising on a secular basis. Chart 12Tactically Recession And Geopolitics Will Weigh On Risk Assets Matt Gertken Senior Vice President Chief US Political Strategist mattg@bcaresearch.com Footnotes 1 Alexandra Alper and Karen Freifeld, “U.S. considers crackdown on memory chip makers in China,” Reuters, August 1, 2022, reuters.com. Strategic View Open Tactical Positions (0-6 Months) Open Cyclical Recommendations (6-18 Months) Table A2Political Risk Matrix Table A3US Political Capital Index Chart A1Presidential Election Model Chart A2Senate Election Model Table A4House Election Model Table A5APolitical Capital: White House And Congress Table A5BPolitical Capital: Household And Business Sentiment Table A5CPolitical Capital: The Economy And Markets
Executive Summary US biotech is trading at its greatest discount to the market. Ever. Much of biotech’s underperformance is due to transient factors: specifically, the sell-off in long-duration bonds; the focus on delivering a Covid vaccine; regulatory concerns; a drought in M&A; and a flood of IPOs. Overweight US biotech versus US big-tech, both tactically and structurally. Long-only investors with a time horizon of at least 2 years should go outright long biotech, especially US biotech. If, as we expect, the 30-year T-bond (price) continues to rally, then long-duration sectors and stock markets will resume their outperformance versus shorter-duration sectors and stock markets. Fractal trading watchlist: We focus on biotech, and add US banks versus consumer services, Norway versus China, Greece versus euro area, and BRL/NZD. US Biotech Is Trading At Its Greatest Discount To The Market. Ever Bottom Line: Every now and then comes a rare opportunity to buy a deeply unloved asset at a bargain basement price. We believe that now provides such an opportunity for the beaten-down biotech sector – especially the US biotech sector which is trading at its greatest discount to the market. Ever. Feature Every now and then comes a rare opportunity to buy a deeply unloved asset at a bargain basement price. We believe that now provides such an opportunity for the beaten-down biotech sector – especially the US biotech sector which is trading at its greatest discount to the market. Ever. But before we go into the specifics of biotech, let’s quickly discuss the recent action in the broader market. The Past Year Has Been All About ‘Duration’ A good way to think of any investment is to compress all its cashflows into one future ‘lump-sum payment.’ The length of time to this lump-sum payment is the investment’s ‘duration.’ And the present value of the investment is just the discounted value of this lump-sum payment, where the discount factor will depend on the required return on the investment combined with its duration.1 It follows that, all else being equal, the present value of a long-duration stock must rise and fall in line with the present value of an equally long-duration bond – because their discount factors move in lockstep. And, as we have been banging on in recent weeks, this simple observation is all you need to explain market action over the past year. For the 30-year T-bond, 2.4-2.5 percent is an important resistance level. Given that long-duration indexes such as the Nasdaq, S&P 500 and MSCI Growth have the same duration as the 30-year T-bond, they have been tracking the 30-year T-bond price one-for-one (Chart I-1 and Chart I-2). Hence, when the long-duration bond rallied, these stock markets outperformed shorter-duration indexes such as the FTSE100 and MSCI Value; and when the long-duration bond sold off, they underperformed. Chart I-1The Nasdaq Has Been Tracking The 30-Year T-Bond Price One-For-One Chart I-2MSCI Growth Has Been Tracking The 30-Year T-Bond Price One-For-One The Russian invasion of Ukraine has catalysed a retreat in the 30-year T-bond yield from a ‘line in the sand’ at 2.4-2.5 percent, which we have previously highlighted as an important resistance level. If, as we argued in A Massive Economic Imbalance, Staring Us In The Face, the 30-year T-bond (price) continues to rally, then long-duration sectors and stock markets will resume their outperformance versus shorter-duration sectors and stock markets. US Biotech Is Trading At Its Greatest Discount To The Market. Ever Over the longer term, the bigger driver of the stock price will not be the discount factor on the future lump-sum payment; the bigger driver will be the size of the lump-sum payment itself. For any company, industry, or stock market, this expected lump-sum payment will evolve in line with current profits multiplied by a ‘structural growth multiple.’ It turns out that while current profits are updated every quarter, the structural growth multiple does not change much from quarter to quarter, year to year, or even decade to decade. Yet occasionally, it can phase-shift violently downwards when an event, or realisation, shatters the market’s lofty hopes for structural growth. Occasionally, an event or realisation shatters the market’s lofty hopes for structural growth. For example, after the dot com bubble burst it became clear that the sky-high hopes for non-US tech companies were just pie in the sky. The result was that their structural growth multiple halved, which weighed down non-US tech stocks for the subsequent 10 years (Chart I-3). Chart I-3After The Dot Com Bust, The Structural Growth Multiple For Non-US Tech Collapsed More recently, the realisation that Facebook – or Meta Platforms as it is now known – is losing subscribers was the gestalt moment that shattered hopes for its structural growth. Note that while its 2022 profits are down slightly, the Meta share price has collapsed, indicating a big hit to the structural growth multiple (Chart I-4). Chart I-4Facebook's Structural Growth Multiple Has Collapsed Conversely, there are rare occasions when a phase-shift down in a structural growth multiple is unwarranted or has gone too far. Right now, a case in point is the biotech sector, especially the US biotech sector. Relative to the relationship of the 2010s decade, US biotech’s structural growth multiple has halved (Chart I-5). The result is that US biotech is trading at the greatest valuation discount to the market (-20 percent). Ever. It is also trading at its greatest valuation discount to the broader tech sector (-35 percent). Ever (Chart I-6 and Chart I-7). Chart I-5US Biotech's Structural Growth Multiple Has Halved, But Is Such A Massive De-Rating Justified? Chart I-6US Biotech Is Trading At Its Greatest Ever Discount To The Market... Chart I-7...And Its Greatest Ever Discount To Big-Tech Another way of putting it is that in the post-pandemic era, while the structural growth multiple for the broader tech sector is largely unchanged, the structural growth multiple for biotech has collapsed by 40 percent (Charts I-8, I-11). Begging the question, is such a massive structural de-rating justified? Chart I-8US Tech's Structural Growth Multiple ##br##Is Unchanged... Chart I-9...But US Biotech's Structural Growth Multiple Has Collapsed Chart I-10Global Tech's Structural Growth Multiple##br## Is Unchanged... Chart I-11...But Global Biotech's Structural Growth Multiple Has Collapsed Much Of Biotech’s Underperformance Is Due To Transient Factors We have identified five culprits for biotech’s recent underperformance, but they are largely transient: The sell-off in long-duration bonds: Ironically, though the market has downgraded biotech’s structural growth, it has still behaved like a long-duration sector that has tracked the sell-off in the 30-year T-bond. Hence, if the long-duration bond rallies, it will boost biotech stocks. The focus on delivering a Covid vaccine: While biotech was developing a Covid vaccine, investors became enamoured with the sector, but once the vaccine was delivered, investors fell out of love with the sector. Yet there is more to biotech than a provider of vaccines, and as we show in the final section, the sell-off has gone too far. Regulatory concerns: In the US there has been some concern about the dilution of a biotech company’s intellectual property (IP) rights – known as March-In-Rights – if government funding or research has contributed to an innovation. In practice though, the sophistication of most innovations means that IP would remain with the innovator. There has also been concern about drug pricing reform, but as is normal in any negotiation, the opening extreme position is likely to get watered down. A drought in M&A: The focus on Covid, plus the uncertainty around regulation, has led to a drought in the M&A activity that is usually the mechanism to crystallize value. Still, for long-term investors, value is value, whether it is crystallized or not. Furthermore, the drought in M&A cannot last forever. A flood of IPOs: The more than 100 biotech IPOs in 2021 was double the usual rate, creating an oversupply and indigestion for specialist investors in the sector. But given the poor performance of the sector, the IPO flood is likely to recede through 2022-23 in a self-correction. So, we come back to the question: is it right to price a structural growth outlook for biotech worse than the overall market and much worse than for big-tech? If anything, it is big-tech that faces the much greater existential risk in the form of Web 3.0 – which will remove big-tech’s current ownership of the internet, thereby wiping out its very lucrative business model. Look out for our upcoming Special Report on this major theme. To repeat, the market is valuing US biotech at a record 40 percent discount to big-tech, and at its most unloved versus the broad market, when most of the headwinds it faces are transient. All of which leads to two investment conclusions. The market is valuing US biotech at a record 40 percent discount to big-tech, and at its most unloved versus the broad market. Overweight US biotech versus US big-tech, both tactically and structurally. Long-only investors with a time horizon of at least 2 years should go outright long biotech, especially US biotech. Fractal Trading Watchlist This week’s analysis focusses on our main theme, biotech, and we add US banks versus consumer services, Norway versus China, Greece versus euro area, and BRL/NZD. Reinforcing the arguments in the preceding sections, US biotech is deeply oversold versus broader tech, reaching a point of fractal fragility that signalled several significant turning-points through the past two decades (Chart I-12). Accordingly, this week’s recommended trade is to go long US biotech versus US tech, setting the profit target and symmetrical stop-loss at 17.5 percent. Chart I-12US Biotech Is Deeply Oversold Versus Broader Tech US Banks Are At Risk Of Reversal Norway's Outperformance Could End Greece's Snapback At A Resistance Point BRL/NZD At A Resistance Point Dhaval Joshi Chief Strategist dhaval@bcaresearch.com Footnotes 1 Defined fully, the duration of an investment is the weighted-average of the times of its cashflows, in which the weights are the present values of the cashflows. Fractal Trading System Fractal Trades 6-Month Recommendations Structural Recommendations Closed Fractal Trades Indicators To Watch - Bond Yields Chart II-1Indicators To Watch - Bond Yields ##br##- Euro Area Chart II-2Indicators To Watch - Bond Yields ##br##- Europe Ex Euro Area Chart II-3Indicators To Watch - Bond Yields ##br##- Asia Chart II-4Indicators To Watch - Bond Yields ##br##- Other Developed Indicators To Watch - Interest Rate Expectations Chart II-5Indicators To Watch - Interest Rate Expectations Chart II-6Indicators To Watch - Interest Rate Expectations Chart II-7Indicators To Watch - Interest Rate Expectations Chart II-8Indicators To Watch - Interest Rate Expectations
Highlights In the short term, the US stock market price will track the 30-year T-bond price, with every 10 bps move in the yield moving the stock market and bond price by 2.5 percent. We think that the bond market will not allow the stock market to suffer a peak-to-trough decline of more than 15-20 percent. Given that the drawdown is already 10 percent, it equates to no more than 20-40 bps of upside for the 30-year T-bond yield, to a level of 2.3-2.5 percent. Hence, we are quite close to an entry-point for both stocks and long-duration bonds. In the next few years, the structural bull market will continue, ending only at the ultimate low in the 30-year bond yield. But on a 5-year horizon, the blockchain will be the undoing of the US stock market – by undermining the vast profits that the US tech behemoths make from owning, controlling, and manipulating our data and the digital content that we create. In that sense, the blockchain will ultimately reveal – and pop – a ‘super bubble’. Fractal trading watchlist: We add Korea and CAD/SEK, and update bitcoin, biotech, and nickel versus silver. Feature Chart of the WeekIf The Market Is Not Far From Its Fundamentals, Can This Really Be A 'Super Bubble'? Why has the stock market started 2022 on such a poor footing? Chart I-2 and Chart I-3 identify the main culprit. Through the past year, the tech-heavy Nasdaq index has been tracking the 30-year T-bond price on a one-for-one basis, while the broader S&P 500 shows a connection that is almost as good. Chart I-2The Nasdaq Has Been Tracking The 30-Year T-Bond Price One-For-One... Chart I-3…The S&P 500 Has Also Been Tracking The 30-Year T-Bond Price Therefore, as the 30-year T-bond price has taken a tumble, so have growth-heavy stock markets. Put simply, the ‘bond component’ of these stock markets has been dominating recent performance, overwhelming the ‘profits component’ which tends to move more glacially. It follows that the short-term direction of the stock market has been set – and will continue to be set – by the direction of the 30-year T-bond price. Stocks And Bonds Are Nearing A ‘Pinch Point’ The next few paragraphs are necessarily technical, but worth absorbing – as they are fundamental to understanding the stock market’s recent sell-off, as well as its future evolution. The duration of any investment quantifies how far into the future its cashflows lie, by averaging those cashflows into one theoretical future ‘lump sum’. For a bond, the duration also equals the percentage change in the bond price for every 1 percent change in its yield.1 Crucially, the duration of the US stock market is the same as that of the 30-year T-bond, at around 25 years. Therefore, if all else were equal, the US stock market price should track the 30-year T-bond price, with every 10 bps move in the yield moving the stock market and bond prices by 2.5 percent. In the long run of course, all else is not equal. The 30-year T-bond generates a fixed income stream, whereas the stock market generates income that tracks profits. Allowing for this difference, the US stock market should track: (The 30-year T-bond price) multiplied by (profits expected in the year ahead) multiplied by (a constant) In which the constant expresses the theoretical lump-sum payment 25 years ahead as a multiple of the profits in the year ahead – and thereby quantifies the expected structural growth in profits. We can ignore this constant if the structural growth in profits does not change. Nevertheless, remember this constant, as we will come back to it later when we discuss a putative ‘super bubble’. The ‘bond component’ of the stock market has been dominating recent performance. This model for the stock market seems simplistic. Yet it provides an excellent explanation for the market’s evolution through the past 40 years (Chart I-4), as well as through the past year in which, to repeat, the bond component has been the dominant driver. Chart I-4The US Stock Market = The 30-Year T-Bond Price Multiplied By Profits In the short term then, given the 25 year duration of the US stock market, every 10 bps rise in the 30-year T-bond yield will drag down the stock market by 2.5 percent. We can also deduce that the sell-off will be self-limiting and self-correcting, because at some ‘pinch point’ the bond market will assess that the deflationary impulse from financial instability will snuff out the recent inflationary impulse in the economy. Where is that pinch point? Our sense is that the bond market will not allow the stock market to suffer a peak-to-trough decline of more than 15-20 percent. Given that the drawdown is already 10 percent, it equates to no more than 20-40 bps of upside for the 30-year T-bond yield, to a level of 2.3-2.5 percent. Hence, we are quite close to an entry-point for both stocks and long-duration bonds. The Case Against A ‘Super Bubble’ (And The Case For) As is typical, the recent market setback has unleashed narratives of an almighty bubble starting to pop. Stealing the headlines is value investor Jeremy Grantham of GMO, who claims that “today in the US we are in the fourth super bubble of the last hundred years.” Is there any merit to Mr. Grantham’s claim? An investment is in a bubble if its price has completely broken free from its fundamentals. For example, in the dot com boom, the stock market did become a super bubble. But as we have just shown, the US stock market today is not that far removed from its fundamental components of the 30-year T-bond price multiplied by profits. At first glance then, Mr. Grantham appears to be wrong (Chart of the Week). Still, if the underlying components – the 30-year T-bond and/or profits – were in a bubble, then the stock market would also be in a bubble. In this regard, isn’t the deeply negative real yield on long-dated bonds a sure sign of a bubble? The answer is, not necessarily. As we explained last week in Time To Get Real About Real Interest Rates, the deeply negative real yield on Treasury Inflation Protected Securities (TIPS) is premised on an expected rate of inflation that we should take with a huge dose of salt. Putting in a more realistic forward inflation rate, the real yield on long-dated bonds is positive, albeit just. What about profits – are they in a bubble? The US (and world) profit margin stands at an all-time high, around 20 percent greater than its post-GFC average (Chart I-5). But a 20 percent excess is not quite what we mean by a bubble. Chart I-5Profit Margins Are At An All-Time High There is one final way that Mr. Grantham could be right, and for this we must come back to the previously mentioned constant which quantifies the expected long-term growth in profits. If this expected structural growth were to collapse, then the stock market would also collapse. This is precisely what happened to the non-US stock market after the dot com bust, when the expected structural growth – and therefore the structural valuation – phase-shifted sharply lower (Chart I-6 and Chart I-7). As a result, the non-US stock market also phase-shifted sharply lower from the previous relationship with its fundamentals (Chart I-8). Could the same ultimately happen to the US stock market? Chart I-6The Structural Growth And Valuation Of Non-US Stocks Phase-Shifted Down... Chart I-7...Could The Same Happen To ##br##US Stocks? Chart I-8Non-US Stocks Phase-Shifted Lower From Their Previous Relationship With Fundamentals The answer is yes – and the main risk comes from the blockchain and its threat to the pseudo-monopoly status that the US tech behemoths have in owning, controlling, manipulating, and monetising our data and the digital content that we create. If the blockchain returned that ownership and control back to us, it would devastate the profits of Facebook, Google, and the other behemoths that dominate the US stock market. If the expected structural growth were to collapse, then the stock market would also collapse. That said, the blockchain is a long-term risk to the stock market, likely to manifest itself on a 5-year horizon. Before we get there, in the next deflationary shock, the 30-year T-bond yield has the scope to decline by at least 150 bps, equating to a 40 percent increase in the ‘bond component’ of the US stock market. To conclude, the structural bull market will end only at the ultimate low in the 30-year bond yield. And then, the blockchain will reveal – and pop – a ‘super bubble’. Fractal Trading Watchlist This week we add Korea and CAD/SEK, and update bitcoin, biotech, and nickel versus silver. Of note, the near 30 percent underperformance of Korea through the past year has reached the point of fractal fragility that has signalled previous major reversals in 2015, 2017 and 2019 (Chart I-9). Accordingly, this week’s recommended trade is to go long Korea versus the world (MSCI indexes), setting the profit target and symmetrical stop-loss at 8 percent. Chart I-9Korea Is Approaching A Turning Point Versus The World Korea Approaching A Turning Point Versus EM CAD/SEK Could Reverse Bitcoin Near A First Support Level Biotech Approaching A Major Buy Nickel Approaching A Sell Versus Silver Dhaval Joshi Chief Strategist dhaval@bcaresearch.com Footnotes 1 Defined fully, the duration of an investment is the weighted average of the times of its cashflows, in which the weights are the present values of the cashflows. Fractal Trading System Fractal Trades 6-Month Recommendations Structural Recommendations Closed Fractal Trades Indicators To Watch - Bond Yields Chart II-1Indicators To Watch - Bond Yields - ##br##Euro Area Chart II-2Indicators To Watch - Bond Yields - ##br##Europe Ex Euro Area Chart II-3Indicators To Watch - Bond Yields - ##br##Asia Chart II-4Indicators To Watch - Bond Yields - ##br##Other Developed Indicators To Watch - Interest Rate Expectations Chart II-5Indicators To Watch - Interest Rate Expectations Chart II-6Indicators To Watch - Interest Rate Expectations Chart II-7Indicators To Watch - Interest Rate Expectations Chart II-8Indicators To Watch - Interest Rate Expectations
Highlights Upgrade The Health Care Sector To An Overweight: Expressed through an overweight position in Health Care Equipment and Services, and an equal weight position in Pharmaceuticals and Biotech The Sector Faces A Few Tailwinds: Recovery of delayed elective procedures and hospital visits will accelerate health care sector sales and profit growth into the balance of the year Aging baby boomers and longer life expectancy will further boost health care spending The Democratic Party’s “blue wave” victory in 2020 has had little effect on health care policy, as the Biden administration has sidelined the party’s most ambitious proposals to deal with the pandemic. This is hardly a tailwind, but the political backdrop for the sector is better than was initially expected There Are Also Headwinds: Reducing or capping drug prices is a bipartisan interest, and may result in imports, price regulation, or inflation indexing, further increasing price pressures The Biden administration’s anti-trust stance may preclude mergers that allow medtech companies to acquire new technology and help hospitals realize economies of scale and preserve razor thin margins Patent expiration for blockbuster drugs is expected to peak in 2023, reducing overall drug spending by $160 billion from 2019 to 2023, and further increasing price pressure from the generic drug manufacturers Overweight Health Care: This as a defensive sector, which will fare well during the slowdown stage of the business cycle. Its performance will also be aided by post-Covid-19 tailwinds. The sector is cheap, and profitability is improving (Chart 1, top panel). Overweight Health Care Equipment And Service Providers: We prefer this industry group to Pharmaceuticals and Biotech, as it faces less intense price pressures, does not face bipartisan political scrutiny, is more profitable, and enjoys resilient profit margins (Chart 1, second panel). Equal Weight Pharma: This industry faces many challenges, such as upcoming patent cliff and generic competition, political and regulatory uncertainty, and declining profitability, which explains the significant valuation discount but makes it risky (Chart 1, bottom panel). Feature In conjunction with our colleagues from the US Political Strategy Team (USPS), today we publish a “deep dive” report on the US Health Care sector. The sector faces significant long-term political and regulatory headwinds, and understanding the political landscape is necessary to making the right investment decisions. The Health Care sector consists of two industry groups: Pharmaceuticals and Biotech, and Health Care Equipment and Services. In this report, we will assess the overall attractiveness of the sector in terms of its investment characteristics, as well as its outlook in the context of the current macroeconomic backdrop and potential political developments. Further, we will drill down into each industry group to provide more granular investment recommendations. We upgrade the Health Care sector to an overweight, expressed through an overweight position in Health Care Equipment and Services, and an equal weight position in Pharmaceuticals and Biotech. Chart 1Fundamentals Are Improving Recent Performance Being a defensive sector, Health Care outperformed the S&P 500 by about 12% in the midst of the pandemic, only to lag the market during the recovery rally (Chart 2). Chart 2Health Care Outperformed During The Lockdowns, But Lagged In A Recovery Rally Chart 3Health Care Sector Breakdown By Key Segment Health Care Sector Overview Health Care sector is very important to the US economy. After all, the US commands the highest health care spending in the world – 17% of GDP, $500B in sales annually. The sector constitutes about 13% of the S&P 500 index by market capitalization and is split equally between Pharmaceuticals and Biotech, and Health Care Equipment and Services, which itself consists of Health Care Providers and Equipment Manufacturers (Chart 3). Health Care Providers is a category which includes major hospitals, health insurers, and pharmacy chains, is the largest segment of the sector, and contributes 49% of the sector revenue. However, this is an industry under a significant price pressure from well-organized buyers such as private and government health insurance and has EBIT margins of only 8%. Pharma and Biotech is the second largest segment and delivers 33.5% of the sector revenue. This industry group faces its own unique challenges, such as patent expirations, politics, and competition from generic drug manufacturers. Yet, thanks to limited time patent protection, this industry manages to achieve EBIT margins of 12.2%. Health Care Equipment and Services is the smallest, contributing only 17% of all sector revenue, but it is the most promising and profitable segment, with EBIT margins circa 20%. The medical devices industry was able to preserve some its pricing power. Health Care Sector Tailwinds Recovery of Delayed Procedures And Hospital Visits Continues While health care earnings were relatively resilient throughout 2020, growth will accelerate into the balance of the year thanks to the recovery of delayed elective procedures and hospital visits following the easing of lockdown measures. These procedures are not only most lucrative for hospitals, but also increase demand for prescription drugs and translate into profits for medtech. Moreover, there is still a significant backlog of delayed procedures to work through. According to CFRA, medical utilization will not only recover, but will also increase by about 3% over a 2019 base by the year-end. Aging Baby Boomers Will Further Accelerate Health Care Spending Global demographic trends bode well for long-term health care spending: The share of the world’s population aged 65 years or over increased to 9.3% in 2020. People live longer thanks to medical innovations and increases in per-capita spending on health care. Longer life expectancy contributes to the rising incidence of chronic diseases, increases in spending on prescription drugs, medical facilities, and services. It also helps that in the developed world, and in the US in particular, baby boomers are the most affluent demographic group. The M&A Environment Has Been Hot M&A activity is booming for Health Care Equipment and Services. Medical equipment companies continue to seek to increase their exposure to nascent technologies with significant growth potential, while hospital chains consolidate to realize economies of scale and increased influence over suppliers and customers. However, as for pharma, many companies already carry high levels of debt, which precludes significant M&A activity. Blue Wave Has Had Little Effect On Health Care Policy (So Far) In principle, the blue wave was perceived as unfavorable to the Health Care sector, but in practice, so far, its effect has been neutral. The narrow margins in the House (4 seats) and Senate (0 seats, de facto 1 seat) reduce the effectiveness of the blue wave. Moreover President Biden has sidelined the party’s interests on health care for the time being. He did not include a public health insurance option in his American Families Plan, nor did he push for Medicare to take an active role in negotiating drug prices. He even sidelined the Democrats’ plan to expand the eligibility age for Medicare. Of course, he is still formally committed to these policies, and he will try to revisit health care in 2022. But by then it will be campaign season for the 2022 midterms and the odds of getting significant legislation passed will fall sharply. Of course, the current White House health care policy is hardly a tailwind. It is still conceivable (albeit low odds) that House Speaker Nancy Pelosi could convince the Senate leadership to insert the party’s more ambitious aims into the American Families Plan as the final draft of this fall’s budget reconciliation bill is prepared. Plus the Department of Health and Human Services will unveil a slew of new rules and regulations as the administration tries to compensate for the lack of bold initiatives. But on the margin the political backdrop for the sector is less negative than initially expected. Health Care Sector Headwinds While the sector enjoys these tailwinds, there are a few dark clouds gathering on the horizon, creating a lot of uncertainty and a more challenging policy backdrop. Reducing Or Capping Drug Prices Is A Bipartisan Issue Reducing or capping the price of drugs is one of the few bipartisan legislative priorities. Trump focused on this issue as well as Biden, which shows it is a vote getter as both parties are courting older voters. Executive orders are pushing key federal agencies to promote generics and biosimilars to reduce name-brand drug prices. Some of the ideas being circulated are: Allow drug imports from Canada and other countries (a big legal battle looms but the initiative is bipartisan and popular). Negotiate drug prices over Medicare with pharmaceuticals instead of having the companies freely set the prices. Limit high-launch prices of novel specialty drugs. (The administration is still formally committed to this.) Link drug price increases to inflation or an International Pricing Index. (Likely to occur at some point.) Having said that, while the situation remains fluid, so far health care and drug prices have not been a priority for Biden. A single lost vote in the Senate could derail his signature American Jobs and Families Plan reconciliation bill. Therefore he wants the bill to focus on $200 billion in subsidies for the existing Affordable Care Act. He does not want to add new controversial measures and revive the Obama administration’s bruising political battles over government involvement in health care. He also does not want to take any actions seen as punitive for the industries that cared for people during the pandemic and invented the vaccines. Biden Administration Anti-Trust Stance Biden’s administration is positioning itself to be very forward on anti-trust issues, which is a big change from the previous administration. Executive Order 14036 on anti-trust and competition takes aim at hospital consolidation, which is said to cause a low supply of health care and higher prices. Indeed, hospitals have been gobbling up smaller providers for over a decade to prop up their razor thin margins. Other M&As across the sector have occurred, like drug retailers buying insurers. The order also says that health insurers need to standardize the options they provide – limiting company flexibility and straight-jacketing pricing schemes. This policy development has a caveat, which may mitigate some of the clauses. The executive order does not involve concrete action that would stop this process. But it does exhort the Department of Health and Human Services and the Federal Trade Commission to develop new rules. Note that there are legislative constraints to muscular anti-trust enforcement, namely that new interpretations of anti-trust are unlikely to pass judiciary review. Therefore, there is a need for new legislation to overrule the judiciary/courts. But, as mentioned, Biden is not willing to risk his larger legislative priorities and hardly any big bills will pass in 2022. This means that the primary risk for now comes from agency rule-making, or new executive orders. Hence there is a shift in executive approach to these issues that will create a lot of uncertainty and put downward pressure on the performance of the sector. This risk could grow later, after the market prices in the positive news that Biden has not prioritized bold legislation in this sector. Patent Cliff Patent cliff is one of the key headwinds the pharmaceutical industry is facing: patent expiration for blockbuster drugs with global revenues exceeding $1B, is expected to peak in 2023. According to IQVIA, the decrease in spending on branded medicines is expected to reduce overall drug spending by $160 billion from 2019 to 2023. Macroeconomic Backdrop Is Favorable To The Health Care Sector Growth Is Slowing: Defensives Rule The business cycle has shifted into a slowdown stage. The earnings cycle has also peaked (Chart 4). We have written about this over the past few weeks, and by now it is baked into the market consensus. To position for a slowdown, we recommended rotation to Growth in the beginning of June. Defensive sectors like Health Care also thrive when growth rolls over. In fact, according to our analysis (Chart 5), Health Care and its constituent Industry Groups tend to do even better than Growth style during a slowdown. Chart 4Earnings Have Rolled Over Chart 5Health Care Outperforms During The Slowdown Stage Of The Business Cycle... Health Care is also a sector that benefits from rate stabilization, as it can be characterized as a “stable, quality growth”, as much of its cash flow growth extends far into the future (Chart 6). Chart 6...And When Rates Are Falling Health Care Is A Domestic Industry Health Care is a relatively domestically focused industry, as it derives about 39% of its sales from outside the US – compared with 42% for the S&P 500, and 58% for the Technology sector. As a result, investors perceive Health Care to be a safe haven in times of appreciating USD, as its earnings are more insulated from currency moves. As a result, Health Care relative returns are positively correlated with the DXY (Chart 7). The dollar has been appreciating since the beginning of June, which bodes well for the outperformance of the sector (Chart 8). Chart 7Health Care Is Domestically Focused And Is Insulated From An Appreciating Dollar Chart 8Positive Correlation With The Dollar Fundamentals Sector Is Cheap The Health Care sector is inexpensive and is trading with an about 20% discount to the S&P 500, both on a trailing and forward basis. According to the BCA Valuation Indicator, it’s trading 2 std below its long-term average (Chart 9). Within the sector, Pharma and Biotech is the cheapest industry group and its valuation discount is dictated by its unique challenges (Table 1). Chart 9Unloved & Undervalued? Table 1Summary Of Valuations And Growth Expectations Earnings Growth Expectations Are Stable For Health Care Valuation discount may be explained by the fact that sector earnings growth expectations for the next 12 months are about half of those for the broad index, i.e., 10% vs 20% (Table 1). For Q2-21, analysts expect YoY growth of 36% for the sector and 68% for the S&P 500. However, this earnings differential is misleading as Health Care earnings were resilient throughout the pandemic, while the cyclical components of the S&P 500 have collapsed. Thus, differences in expectation are mostly due to the 2020 base effect. Indexing 12 months forward EPS to one in July 2019, we see that Health Care earnings have been stable, and now exceed the level of S&P 500 earnings (Chart 10). Chart 10Health Care Earnings Are Resilient Margins Are Under Pressure While immediate earnings growth expectations look good, the degree to which the sector is losing pricing power is a source for concern (Chart 11). Health Care sector margins have been eroding for years now (Chart 12). Pricing pressure is a perennial concern for the sector as third-party payers, including the government and private health insurance chains seek to reduce the mounting costs of health care in the US. Chart 11Pricing Power Is Fading Chart 12Margins Have Been Eroding For Years Medicare and Medicaid have recently become a larger proportion of revenues for health care facilities, which is unfavorable for these companies because government health programs tend to have lower reimbursement rates than private sector payers. In turn, large hospital chains put price pressure on drug manufacturers and medical equipment suppliers. Lastly, Pharma faces competition from the generic drug manufacturers with which they have little product differentiation. R&D And Capex Are Rebounding During the pandemic, aiming to preserve cash in their war chests, companies in the sector have reduced their investments into R&D and Capex. More recently, both Capex and R&D have rebounded, cutting into margins. Indeed, the Health Care sector, especially pharma and medtech, is held hostage to R&D and Capex. EvaluatePharma estimates that large investments, typically around $4 billion in R&D, are required for pharma companies before any new products could be approved to be marketed. R&D is the “backbone” of novel drugs, and thus, the extent of R&D spending serves as an important metric to show a company’s commitment to finding new drugs. Medtech is held to similar demands as companies spend more and more to research and develop innovative new products, which are also subject to FDA approval. The only silver lining is that some analysts forecast that increased use of big data analytics or artificial intelligence to enhance processes has the potential to reduce growth in R&D and Capex (Chart 13 & Chart 14). Chart 13Capex Picked Up... Chart 14...So Did R&D Technicals Suggest Healthcare Is Oversold According to the BCA Technical Indicator, the Health Care sector is significantly oversold. This is a contrarian indicator, and positioning suggests that the sector is ripe for a rebound (Chart 15). Cash Yield Is Expected To Pick Up Last but not least, Health Care is one of the highest cash yielding sectors in the S&P 500. In Q1-21 the sector paid shareholders around $20B, the third highest payout in the index behind Financials and Tech. Cash yield is currently around 3% and the sector is in a strong position to ramp up payouts as its cash flows rebound. Chart 15A Good Entry Point Pharmaceuticals And Biotech Faces Many Challenges Pharmaceuticals is one of the most challenging businesses to be in: not only does R&D takes years, and thousands, if not millions, of chemical compounds tested, but also there is absolutely no guarantee of success. And each promising compound has to go through rounds of arduous FDA trials to get approval for a new drug. The price of the new drug is protected for ten to twenty years, after which the original manufacturers face competition from generic drug manufacturers. Generics already account for the majority of drug spending around the world. Many traditional manufacturers have entered the generic drug manufacturing business: if you can’t beat them, join them! As such, the covid-19 vaccine rollout was the biggest catalyst for pharma sales this cycle with millions of people still awaiting their first shot in both developed and emerging countries. Given the steady drip of news about emerging virus variants, we can assume that the pandemic-driven demand for pharma products is here to stay. However, there is a caveat to the story. A number of pharma producers, such as AstraZeneca and Johnson & Johnson, pledged to supply vaccines not for profit, which is also evident in the data. Chart 16& Chart 17 show that while pharma sales took off during the pandemic, both EBIT and margins contracted. Chart 16Vaccines Boost Sales... Chart 17...But Not Profits Of course, decline in profits and margins was transitory since the pandemic also reduced hospital visits for non-Covid patients as well as delayed other procedures like non-urgent surgeries that both require drug usage. As demand for these two categories that positively contribute to profits and margins is starting to bounce back, we expect bottom-line growth numbers to recover for pharma stocks. However, we are more concerned about a longer-term trend in Pharma margins: here we see the effect of patent cliff, the ubiquitous shift to generics, and price pressures from insurers and hospital chains. The political backdrop exacerbates the situation: reducing or capping the price of drugs is one of the few bipartisan priorities, which creates a lot of uncertainty for the industry, and could be a drag on margins for years to come. This poisoned chalice that the industry is facing explains why Pharma trades with a 34% discount to the S&P 500 PE NTM, and 17% discount to Health Care (14.3x, 21.6x and 17.3x respectively). This is the largest discount in the past 25 years. This valuation discount is likely to close – after all, there is a price for everything. However, for now we remain cautious about the prospects for Pharma and Biotech, especially in the context of political uncertainty. Health Care Equipment And Services Is Thriving Increases in hospital visits and resumption of elective medical procedures is great news both for the medical service providers and for medical equipment manufacturing. With 56% of Americans age 12 or older vaccinated, medical utilization is swiftly recovering. Chart 18 shows that sales for the industry group have surged by nearly 20% from the darkest days of the pandemic. This industry group was also able to manage costs during the downturn and exited the pandemic with higher margins. Also, unlike Pharma and Biotech, this industry group is not experiencing a long-term margin erosion trend. Pricing pressures for this industry group are less severe than for Pharma. Competition in certain product categories is often limited to several key players due to various challenges, such as regulation, product liability, and substantial R&D and Capex outlays required to enter the industry. As such, sales growth translates into income growth (Chart 19), and the industry group is able to maintain its margins. Chart 18Equipment Manufacturers Are Thriving Chart 19Strong Earnings All-around Further, political pressures on the industry group appear less severe than those on Pharma and Biotech. True, Democrats are inclined to tax devices and impose price caps, but their initiatives to expand health care access increase overall demand for equipment and services. Another sign, that the current administration focus is not on equipment and services, is that President Biden temporarily exempted medical tech from his “right to repair” executive order, which prevents manufacturers from restricting the right of third parties to repair their devices. While it is a small issue, it signals that Biden is not aggressive on this industry thus far. Overall, we believe that Health Care Equipment And Services is attractive, and it is less affected by some of the negative trends in the sector, but benefits from reopening and demographic tailwinds. Investment Implications Upgrade Health Care Sector - Overweight Health care sector earnings are aided by a number of secular and structural tailwinds: Recovery in hospital visits and volume of elective procedures which also translates into pickup in the use of health care equipment and drugs A large and affluent cohort of aging baby boomers who enjoy a longer life expectancy, but also will spend more on medical procedures and prescription drugs Political backdrop is less negative than expected – and longer-term political risks will likely be stalled for campaigning in 2022 US growth rolling over is also favoring Health Care as a defensive sector that tends to outperform during period of economic slowdown. Further, this sector is cheap and stable earnings growth looks favorable compared to the broad market. Pharmaceuticals And Biotech Industry Group – Equal Weight Like the rest of the sector, this industry group is enjoying post-covid-19 recovery tailwinds. Sales growth has stabilized, but profit margins are perennially depressed. We do believe that over the short term both profits and margins may rebound. However, we are concerned about structural headwinds: political backdrop is unfavorable and will add to the price pressures traditional pharma is facing from generic competition, exacerbated by an upcoming patent cliff. Health Care Equipment and Service Providers – Overweight Like Pharma, this industry group benefits from a resurgence of hospital visits and an increase in the volume of medical procedures. However, it faces much fewer headwinds: the Biden administration has not made the regulation of hospital and medical equipment manufacturers as one of its legislative priorities. This industry group also faces fewer pricing pressures than Pharma. Health Care Equipment and Service Providers is trading with a slight discount to a broad market, while its profitability and margins are expected to pick up significantly. Bottom Line: Overweight Health Care, which is a defensive sector and will fare well in the slowdown stage of the business cycle. Its performance will also be aided by post-covid-19 tailwinds such as resumption in the delayed elective procedures, a significant demand for health care from aging baby boomers, and benign political backdrop. Within the sector we favor Health Care Equipment and Service Providers over Pharmaceuticals and Biotech, as this industry group faces less intense price pressures, is more profitable, and enjoys resilient profit margins, and is currently is flying under “regulatory radar”. Pharma not only suffers from upcoming patent cliff and generic competition, but also faces potential regulatory pressures: these headwinds have affected its long-term profitability and weigh on its performance and valuations. Irene Tunkel Chief Strategist, US Equity Strategy irene.tunkel@bcaresearch.com Matt Gertken Vice President Geopolitical Strategy mattg@bcaresearch.com Recommended Allocation Footnotes
Overweight In last week’s Strategy Report, we made a couple of changes within the health care universe; namely we upgraded pharma to neutral and boosted biotech stocks to overweight both of which lifted the S&P health care sector to an above benchmark allocation. This move serves as a hedge to our overall portfolio positioning. With regard to biotech equities, we posited that this highly fragmented industry is prime for consolidation. Even in the large cap S&P 500 biotech index there is scope for further M&A activity. Not only intra-industry mergers, but also cash rich and drug pipeline extension thirsty Big Pharma is lurking in the shadows ready to deploy their cash hoard. Already, there is an ongoing mini M&A boom and given the recent biotech firms’ success stories in the race to discover the COVID-19 vaccine, they command a high profile in investment banking board rooms (see chart). The implication is that as the M&A boom gains further traction, it effectively reduces the supply of stocks available to investors, consequently driving prices higher. Bottom Line: We reiterate our recent upgrade in the S&P biotech index to overweight. The ticker symbols for the stocks in this index are: BLBG: S5BIOTX– AMGN, ABBV, GILD, VRTX, REGN, ALXN, BIIB, INCY.
Highlights Portfolio Strategy Firming operating metrics, a capex upcycle, rock bottom valuations and deeply oversold conditions all suggest that it no longer pays to be bearish Big Pharma. Upgrade to neutral, today. A looming M&A boom, excess liquidity leaking into biotech stocks, extremely pessimistic Wall Street analysts’ forecasts and severe undervaluation, all suggest that now is the time to go against the grain and overweight biotech equities. Recent Changes Lift the S&P pharmaceuticals index to neutral and remove it from the high-conviction underweight list cementing gains of 12.6% and 10.3% respectively. Boost the S&P biotech index to overweight today. Both of these moves also lift the S&P health care sector to an above benchmark allocation. Table 1 Feature The bulls have taken full control of the equity market and propelled almost every index to fresh all-time highs despite a muted earnings season. Not only are the SPX, the DOW industrials and transports, the NASDAQ composite and the NASDAQ 100 all flirting with uncharted territory, but also more obscure indexes like the Value Line Arithmetic (gauging the average US stock) and Geometric (gauging the median US stock) indexes have also cleared the all-time high bar (Chart 1). On a stock level, bellwether AAPL – the largest stock in the world – has yet to make the leap to new highs despite a blowout profit report and gargantuan buyback announcement, which is cause for near-term concern. Given that the Fed orchestrated this once in a lifetime bonanza, it is also the Fed that can spoil this party, at least temporarily, by removing the proverbial punchbowl. Peering toward the back half of the year, our view remains that the Fed will have to relent and taper asset purchases as inflation will be rearing its ugly head not in a transitory, but more on a semi-permanent fashion. Importantly, the USD can further fan this inflationary impulse. Chart 2 shows that US real GDP expectations are trouncing the rest of the world (ROW) as we first showed in early March. Similarly the ISM manufacturing dichotomy compared with the ROW PMIs is as good as it gets. While this would typically call for a surge in the greenback, counterintuitively we think the path of least resistance is lower for the US dollar as the US economy reaches an inflection point versus the ROW mid-year. Crudely put, if the USD merely ticked up on such a wide economic differential, once Europe and Japan play catch up as the vaccine rollouts and economic reopening smoothen up, then investors will likely flee the US dollar. Chart 1All Time Highs Everywhere Chart 2Relative Growth Expectations At A Zenith With regard to stock market dynamics, this is welcome news for revenue growth, especially for internationally sourced SPX sales that garner a 40% share of total revenues. Since the US dollar floated in the early 1970s, the inverse correlation has increased between top line S&P 500 growth and the greenback (Chart 3). The implication is that a US dollar debasing from current levels will further boost the allure of companies that can raise selling prices. On that front our Corporate Pricing Power Indicator (CPPI) that we recently updated has been on a tear, underscoring that sales growth will soon follow suit (Chart 4). Chart 3Depreciating USD A Boon For SPX Sales Chart 4Rising Inflation Will Boost Revenues Tack on optimistic Chief Executives, and the picture brightens further for SPX revenue prospects. Inflation breakevens also corroborate the messages from our soaring CPPI and surging business confidence (Chart 4). One level down to the SPX GICS1 sector level, Charts 5, 6 & 7 highlight sales growth expectations, with deep cyclicals reigning supreme –especially the energy complex– and defensives the clear laggards (all sectors are compared with the broad market). On the early cyclical front, consumer discretionary equities are forecast to grow sales by 500bps more than the SPX, while financials are slated to trail the overall market by 500bps. Chart 5Consumer Discretionary… Chart 6…And Deep Cyclicals… Chart 7…Have The Upper Hand With regard to the contribution to SPX sales growth for calendar 2021, Table 2 details sector sales growth, sector sales weight, all ranked by sector contribution to SPX sales growth. Chart 8 highlights that consumer discretionary, energy and health care comprise roughly half of the increase in overall revenue growth for 2021. Adding industrials and tech to the mix and these five sectors explain 80% of this year’s projected top line growth contribution to the SPX. Table 2SPX GICS1 Sector Sales Analysis Chart 8Sector Contribution To 2021 SPX Sales Growth Drilling further into industry sub-groups and for inclusion purposes, Table 3 shows our universe of coverage, ranking GICS1 sectors by 12-month forward sales growth and then re-ranking by sub-groups always from highest-to-lowest. Table 3Identifying S&P 500 Sector Sales Growth Leaders And Laggards Circling back to investment implications and gelling everything together, what should investors do given this backdrop? If portfolio managers can stomach volatility and sail through the seasonally weak month of May, then holding the line and sitting tight is the appropriate strategy. However, if investors cannot stomach the bout of volatility that is likely looming, then playing some defense would make sense. We stand closer to the latter camp, and this week we take profits on a defensive group and lift exposure to neutral and boost another beaten down health care sub-group to overweight. These two moves also lift the S&P health care sector to an above benchmark allocation. Exiting The ER The bearish undertones haunting the S&P pharmaceuticals index are well ingrained in investors’ minds and our portfolio has also handsomely benefited from avoiding this key health care industry group. However, it no longer pays to be negative Big Pharma and today we book gains of 12.6% and lift exposure to neutral, and also take this index out of our high-conviction underweight list locking in gains of 10.3% since the early December inception. Chart 9 shows that likely all the adverse news is priced in rock bottom valuations and extremely oversold technical conditions. In fact, the pharma forward P/E ratio is trading at a 40% discount to the SPX and all time low since the GICS reclassification of sectors took place in the early 1990s! While such drubbing is warranted, as this defensive index has to contend an economy exiting recession and also a near unanimous outcry against industry pricing power gains, the easy money has been made on the short/underweight side. This de-rating has coincided with a collapse in relative forward profit growth, on a 12-month and five-year basis, both of which are probing all-time lows (Chart 10). The implication is that the EPS bar is so low it is nearly guaranteed that Big Pharma will surpass it. Such extreme pessimism is contrarily positive and if there is even a whiff of positive profit news, an explosive rally will take root. Chart 9Unloved And Under-owned Chart 10Analysts Have Given Up On Pharma Encouragingly, our macro EPS growth models signal that pharma profits have a strong pulse and will outshine the overall market in the coming year (Chart 11). We recently highlighted the near perfect inverse correlation of the relative share price ratio with the US leading economic indicator and the US ZEW. Similarly, we have shown in the recent past that a number of subcomponents of the ISM manufacturing survey also move inversely with pharma relative profitability. Now that the ISM is at a zenith, staying bearish pharmaceutical stocks will likely prove offside. Meanwhile, Chart 12 shows that the fed funds rate impulse is neither contracting nor weighing on relative share prices. Similarly, the bond market has already priced in two hikes in two years, warning that the relative share price ratio risk/reward tradeoff is slowly shifting to the overweight column. Chart 11Out Of The Ward On the operating front, Big Pharma is investing anew with capex gone parabolic (bottom panel, Chart 13). The last time pharma capital outlays rose over 20%/annum was in the early 1990s! Chart 12There Is A Pulse Chart 13Capex To The Rescue? Industry shipments are climbing roughly at a double digit clip and pharma output is also expanding smartly, underscoring that soon industry productivity will also ascend, which is a boon for profits (Chart 14). Tack on the export relief valve pharma manufacturers are enjoying of late, and factors are falling into place for an earnings led rebound in pharma equities (second panel, Chart 14). Finally, the top panel of Chart 15 highlights that demand for pharmaceuticals in as upbeat as ever and has been significantly diverging from relative share prices. The implication is that this steep gulf will narrow via a catch up phase in the latter. Chart 14Glimmers Of Hope Chart 15Upbeat Demand, But Deflation Is A Tough Pill To Swallow Nevertheless, before getting outright bullish this heavyweight health care sub-group, there are two significant (and related) offsets. Industry pricing power is under attack and will remain in duress until it reaches a new equilibrium (middle panel, Chart 15). As a result, pharmaceutical profit margins have been in an almost uninterrupted multi year squeeze, warranting only a neutral allocation to Big Pharma manufacturers, until these dark profit clouds clear (bottom panel, Chart 15). Netting it all out, firming operating metrics, a capex upcycle, rock bottom valuations and deeply oversold conditions all signal that it no longer pays to be bearish Big Pharma. Upgrade to neutral, today. Bottom Line: Crystalize gains in the S&P pharma index of 12.6% since inception and lift exposure to neutral. We are also removing it from the high-conviction underweight list locking in gains of 10.3% since inception. The ticker symbols for the stocks in this index are: BLBG: S5PHARX– JNJ, PFE, MRK, LLY, BMY, ZTS, CTLT, VTRS, PRGO. Buy Biotech Stocks Against The Grain We recommend investors buy the budding recovery in biotech stocks, and today we are boosting the S&P biotech index to an above benchmark allocation. Rising interest rates have dampened demand for biotech stocks as these high growth stocks should command a lower multiple on the back of a rising discount rate (top panel, Chart 16). Add on waning US dollar liquidity and the relative underperformance phase gets explained away (bottom panel, Chart 16). However, there still remains a sizable gap between relative profits and relative share prices. If our four-pronged bullish thesis that we detail below pans out, then a catch up phase looms in crushed biotech stocks (Chart 17). Chart 16Bearish Story Well Documented Chart 17Peculiarly Wide GapFirst, we posit that this highly fragmented industry is prime for consolidation. Even in the large cap S&P 500 biotech index there is scope for M&A activity. Not only intra-industry mergers, but also cash rich and drug pipeline extension thirsty Big Pharma is lurking in the shadows ready to deploy their cash hoard. Already, there is an ongoing mini M&A boom and given the recent biotech firms’ success stories in the race to discover the COVID-19 vaccine, they command a high profile in investment banking board rooms (Chart 18). Second, as long as the Fed remains committed to ZIRP and margin debt balances continue to balloon, some of this excess liquidity will flow toward biotech stocks that are more speculative than their safe-haven health care brethren. Historically, relative margin debt balances and relative share prices have been joined at the hip, and the message from spiking margin debt uptake is to expect a similar rebound in biotech equities (Chart 19). Chart 18M&A Boom Is Bullish Chart 19Speculative Excesses Go Hand-In-Hand With Biotech Stocks Third, the sell side has thrown in the towel on the prospects of the S&P biotech index. Relative sales growth expectations are negative, relative 12-month and five-year forward growth numbers are sinking like a stone and probing all-time lows (Chart 20). All this analyst pessimism is gaining steam at a time when the S&P biotech dividend yield is 2.5%, roughly 100bps higher than the 10-year US Treasury yield and 125bps higher than the SPX dividend yield (bottom panel, Chart 20). Finally, not only the relatively large dividend yield gap signals that biotech stocks are cheap, but on a forward P/E basis the S&P biotech index trades at a whopping 50% discount to the SPX (fourth panel, Chart 20). Our Valuation Indicator has collapsed to levels that have marked prior bull phases going back 25 years and similarly technicals are as downbeat as ever (Chart 21). Chart 20Low Threshold To Overcome Chart 21Cheap And Oversold In sum, a looming M&A boom, excess liquidity leaking into biotech stocks, extremely pessimistic Wall Street analysts’ forecasts and severe undervaluation, all signal that now is the time to go against the grain and overweight biotech equities. Bottom Line: Lift the S&P biotech index to overweight, today. This upgrade along with the S&P pharma upshift to neutral also lift the S&P health care sector to overweight. The ticker symbols for the stocks in this index are: BLBG: S5BIOTX– AMGN, ABBV, GILD, VRTX, REGN, ALXN, BIIB, INCY. Anastasios Avgeriou US Equity Strategist anastasios@bcaresearch.com Current Recommendations Current Trades Strategic (10-Year) Trade Recommendations Size And Style Views February 24, 2021 Stay neutral cyclicals over defensives January 12, 2021 Stay neutral small over large caps June 11, 2018 Long the BCA Millennial basket The ticker symbols are: (AAPL, AMZN, UBER, HD, LEN, MSFT, NFLX, SPOT, ABNB, V). January 22, 2018 Favor value over growth
The recently instituted S&P biotech rolling stop got triggered yesterday and we crystalized gains of 5% since the February 2019 inception. This index is now downgraded to neutral, but it does not affect the overall S&P health care positioning that remains modestly overweight. The recent selloff in the bond market along with the catch up phase in earnest of the more cyclically sensitive parts of the equity market explain the rolling stop trigger in the S&P biotech index. None of the upbeat demand drivers have changed since our last update, however we are obeying our stop in order to protect profits from a portfolio management perspective. Bottom Line: Trim the S&P biotech index to neutral for a gain of 5% since inception. The ticker symbols for the stocks in this index are: BLBG: S5BIOT – ABBV, ALXN, AMGN, BIIB, GILD, INCY, REGN, VRTX.