Canada

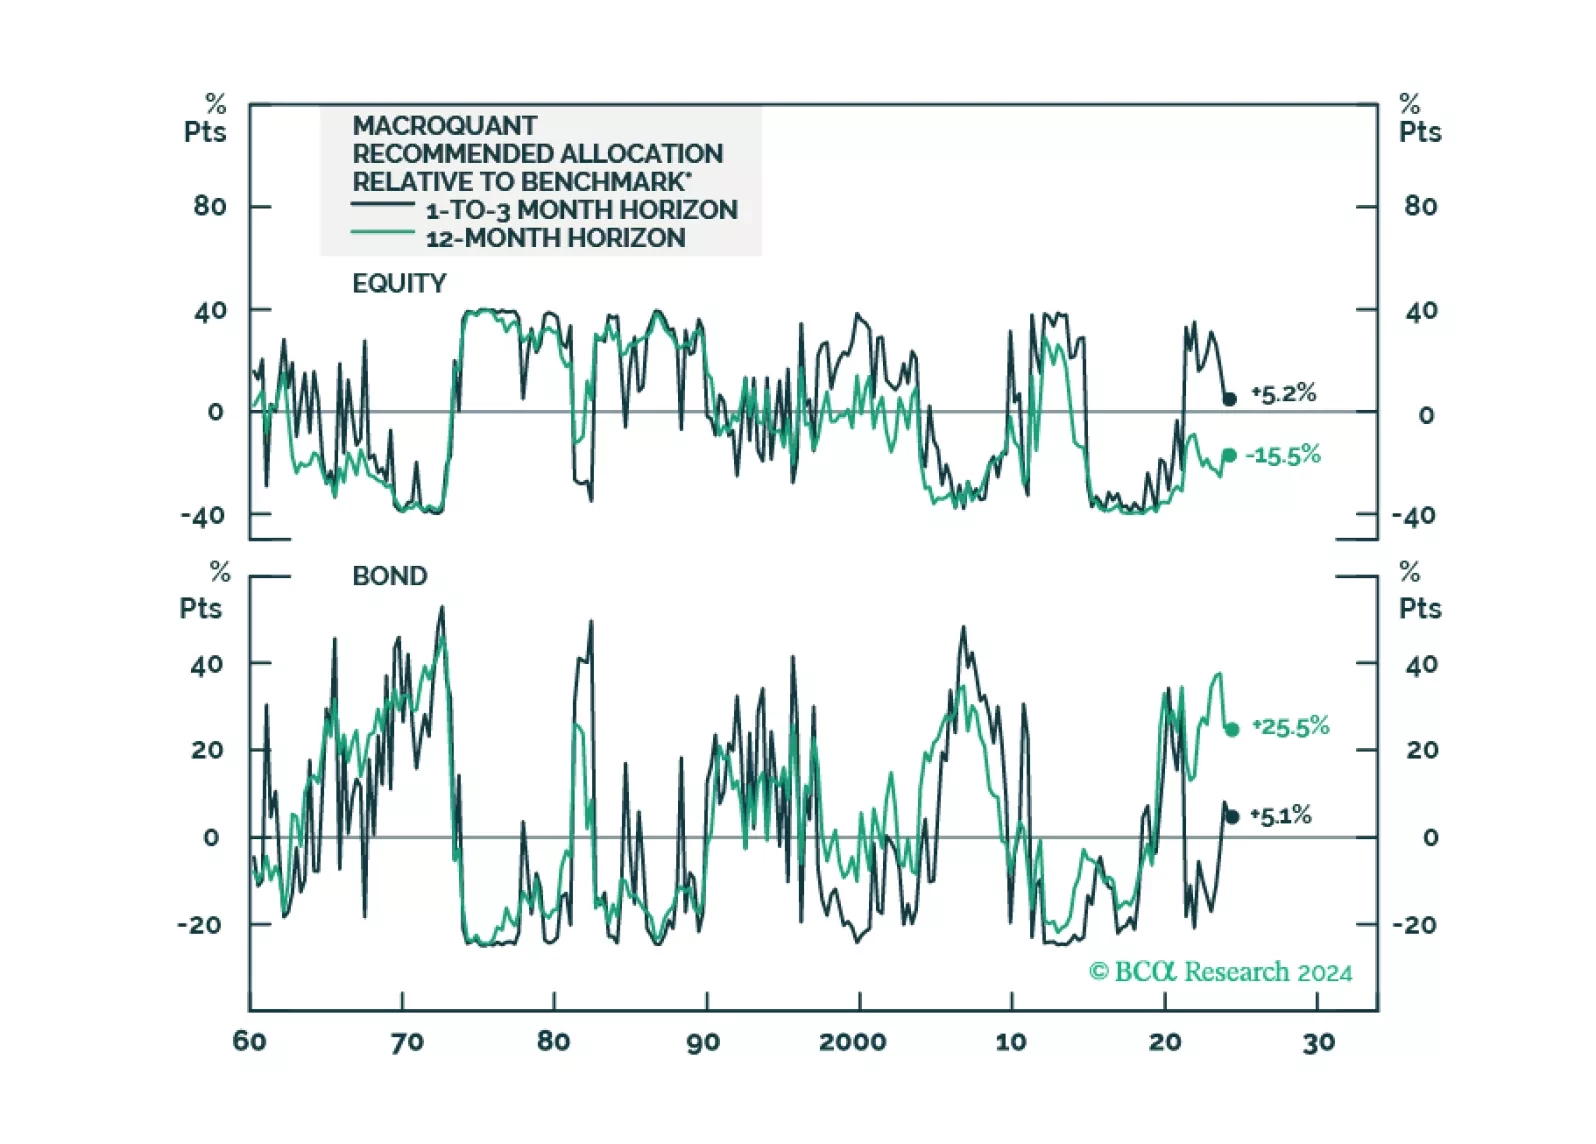
Following the release of the white paper yesterday, today we are sending you the inaugural issue of the MacroQuant Monthly, a report summarizing the output of our next-generation MacroQuant 2.0 model.
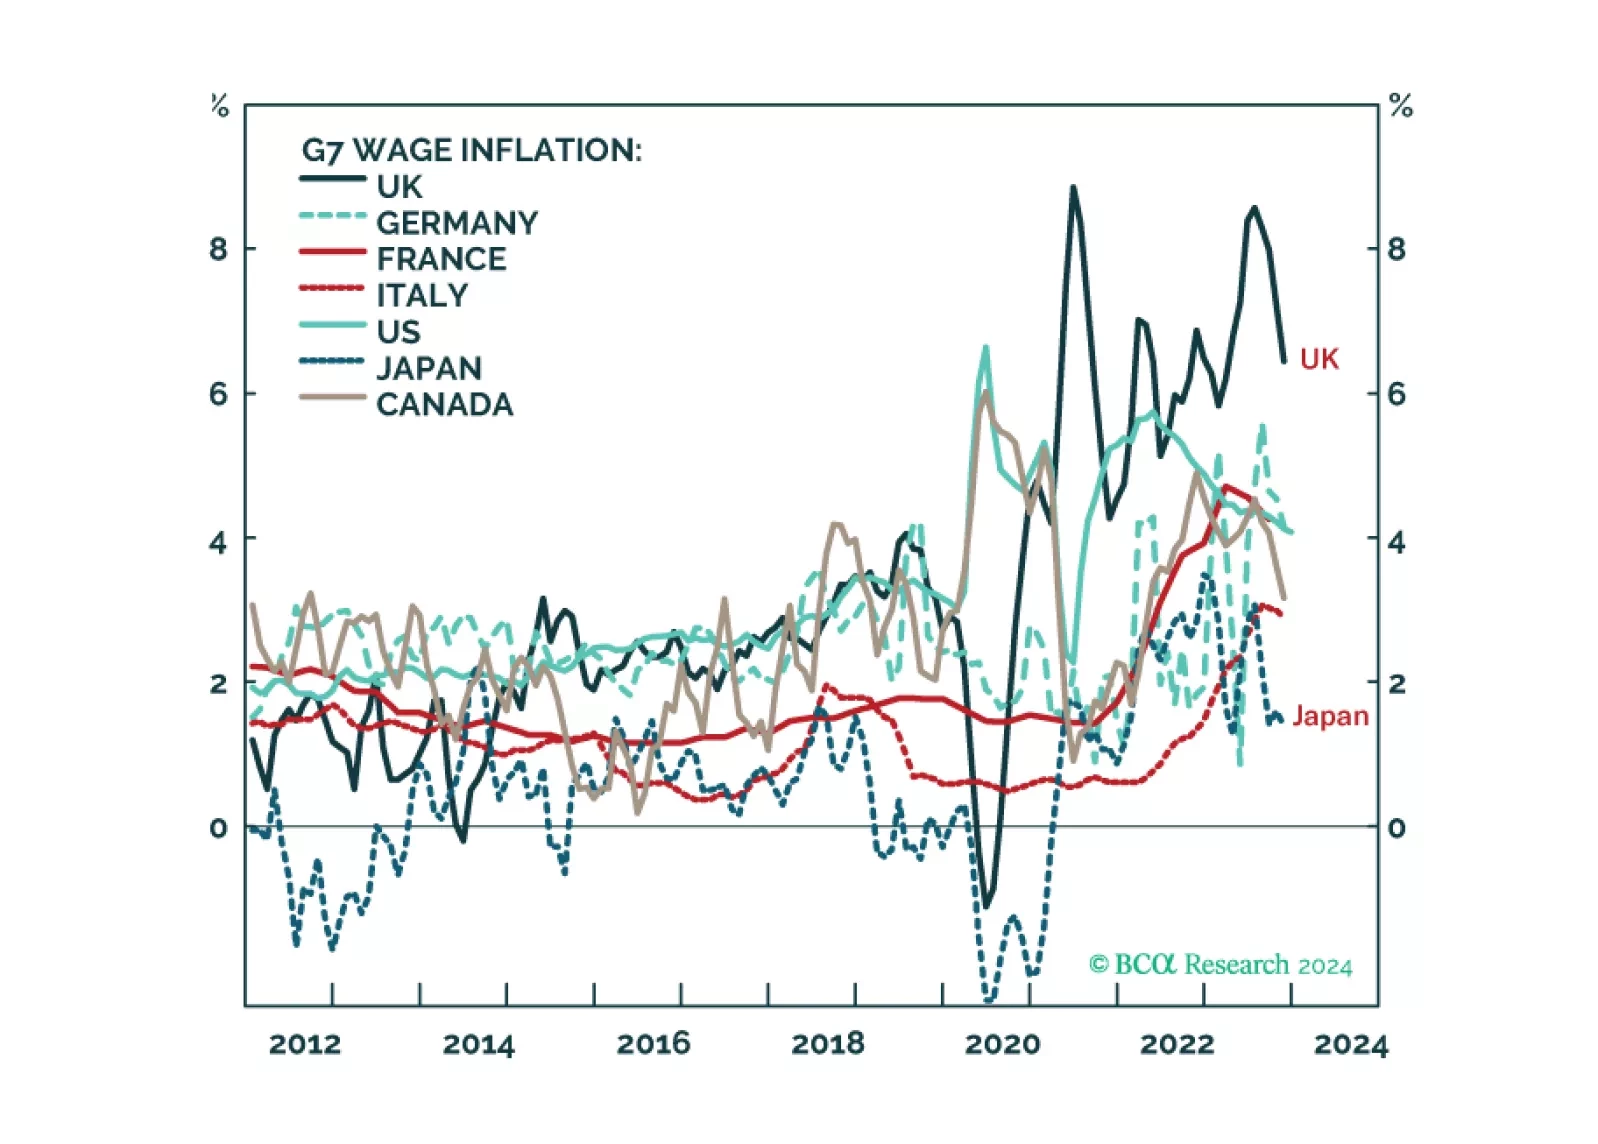
We describe and explain the wide disparity of wage inflation across G7 economies, and discuss what it means for the Fed, ECB, BoE, and BoJ policy moves in the coming year. Plus: we highlight two investments ripe for reversal, and two investments ripe for rebound.
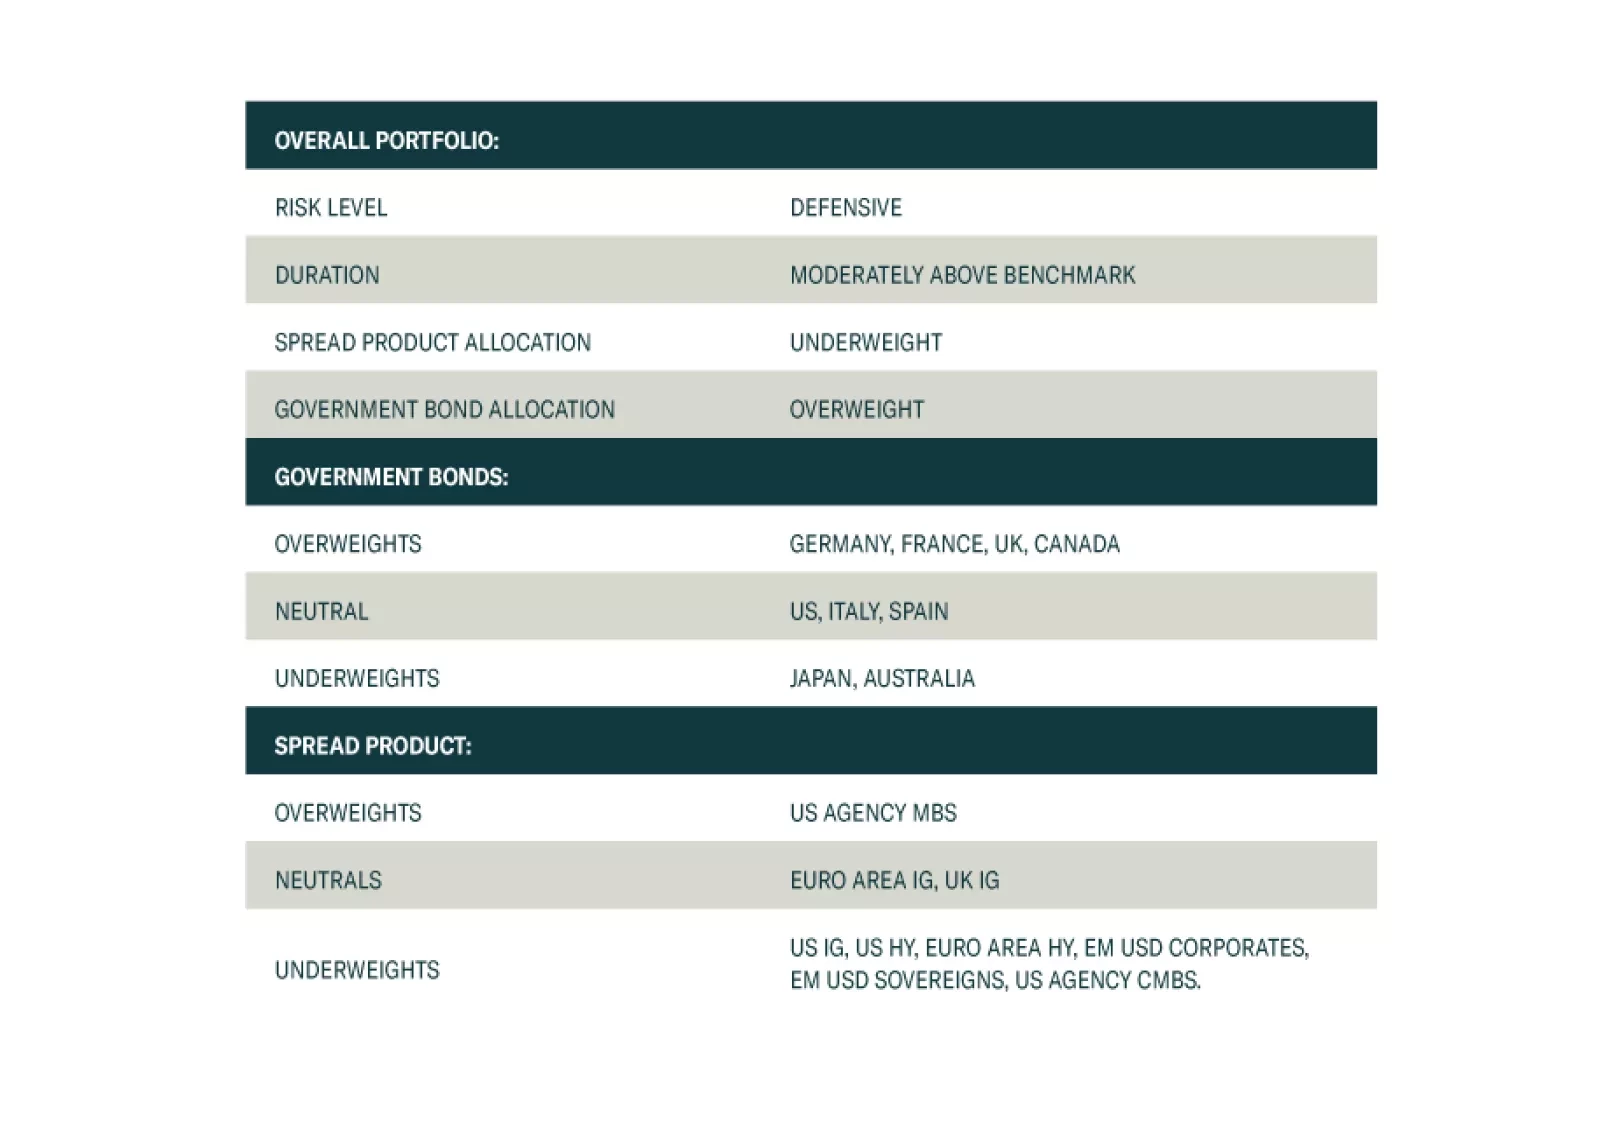
We present the performance review of the Global Fixed Income Strategy Model Bond Portfolio for 2023. We also discuss the outlook for 2024 performance based on our Key Views for the year. The portfolio is positioned to benefit from a year where the global backdrop will be one of weak growth and further declines in inflation, leading central bank to begin cutting interest rates.
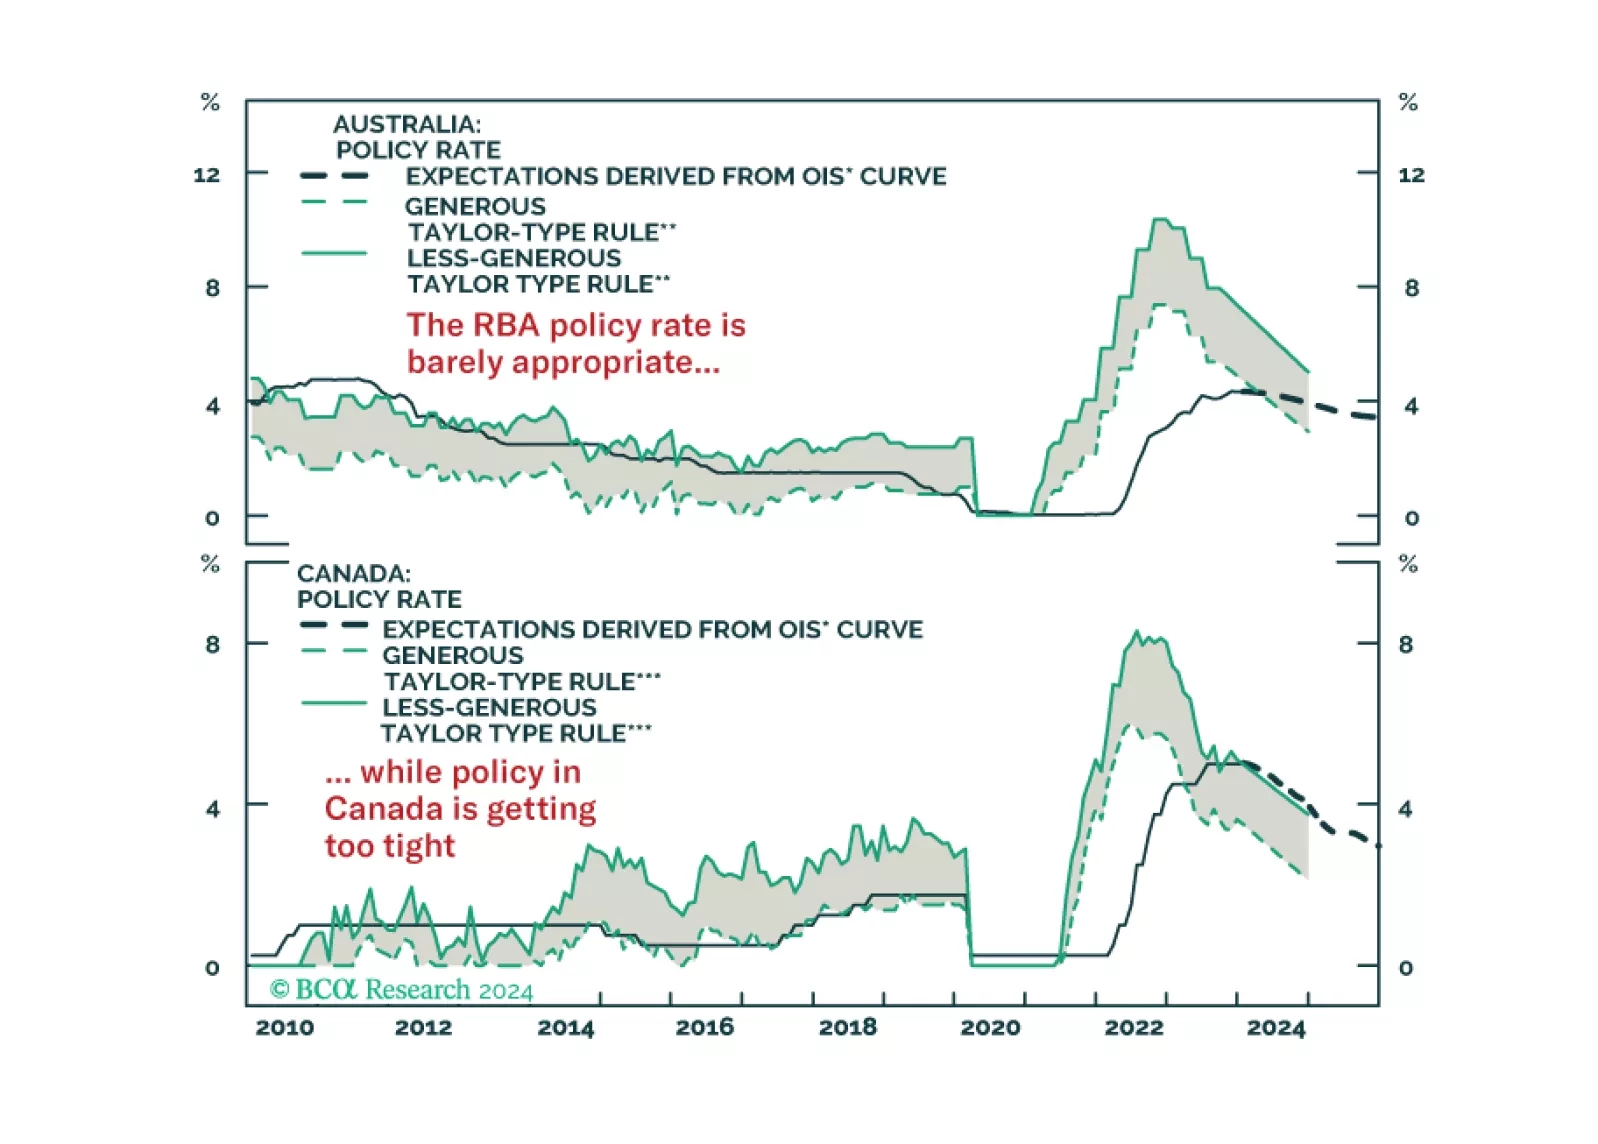
In this Strategy Insight, we assess the monetary policy path for Australia and Canada in 2024 and we discuss how to profit from a growing divergence between the two economies.
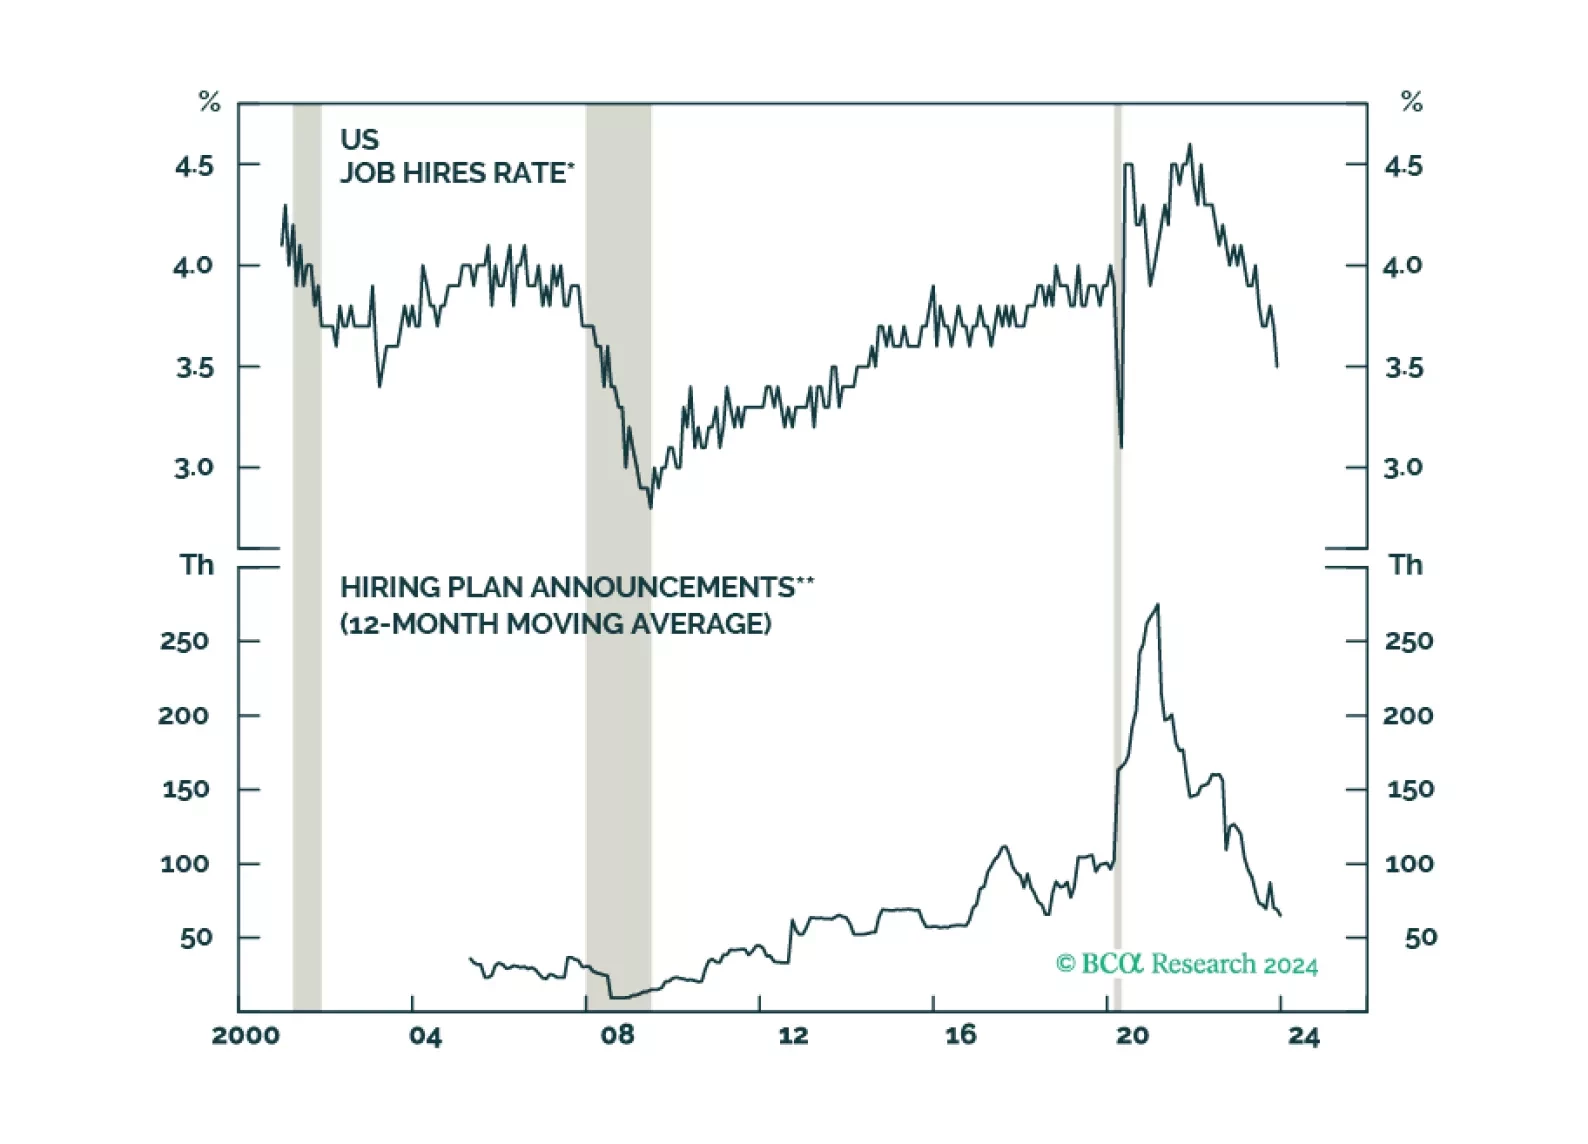
Investors have taken comfort in the fact that unemployment has remained low in the major economies. But underneath the surface, there are clear signs that labor demand is weakening. The clock keeps ticking towards our H2 2024 recession call. After being bullish on risk assets last year, we are slowly turning more defensive.