China

Highlights President Biden has called for the US intelligence community to investigate the origins of COVID-19 and one of Biden’s top diplomats has stated the obvious: the era of “engagement” with China is over. This clinches our long-held view that any Democratic president would be a hawk like President Trump. The US-China conflict – and global geopolitical risk – will revive and undermine global risk appetite. China faces a confluence of geopolitical and macroeconomic challenges, suggesting that its equity underperformance will continue. Domestic Chinese investors should stay long government bonds. Foreign investors should sell into the bond rally to reduce exposure to any future sanctions. The impending agreement of a global minimum corporate tax rate has limited concrete implications that are not already known but it symbolizes the return of Big Government in the western world. Our updated GeoRisk Indicators are available in the Appendix, as well as our monthly geopolitical calendar. Feature In our quarterly webcast, “Geopolitics And Bull Markets,” we argued that geopolitical themes matter to investors when they have a demonstrable relationship with the macroeconomic backdrop. When geopolitics and macro are synchronized, a simple yet powerful investment thesis can be discerned. The US war on terror, Russia’s resurgence, the EU debt crisis, and Brexit each provided cases in which a geopolitically informed macro view was both accessible and actionable at an early stage. Investors generally did well if they sold the relevant country’s currency and disfavored its equities on a relative basis. Chart 1China's Decade Of Troubles
China's Decade Of Troubles
China's Decade Of Troubles
Of course, the market takeaway is not always so clear. When geopolitics and macroeconomics are desynchronized, the trick is to determine which framework will prevail over the financial markets and for how long. Sometimes the market moves to its own rhythm. The goal is not to trade on geopolitics but rather to invest with geopolitics. One of our key views for this year – headwinds for China – is an example of synchronization. Two weeks ago we discussed China’s macroeconomic challenge. In this report we discuss China’s foreign policy challenge: geopolitical pressure from the US and its allies. In particular we address President Biden’s call for a deeper intelligence dive into the origins of COVID-19. The takeaway is negative for China’s currency and risk assets. The Great Recession dealt a painful blow to the Chinese version of the East Asian economic miracle. By 2015, China’s financial turmoil and currency devaluation should have convinced even bullish investors to keep their distance from Chinese stocks and the renminbi. If investors stuck with this bearish view despite the post-2016 rally, on fear of trade war, they were rewarded in 2018-19. Only with China’s containment of COVID-19 and large economic stimulus in 2020 has CNY-USD threatened to break out (Chart 1). We expect the renminbi to weaken anew, especially once the Fed begins to taper asset purchases. Our cyclical view is still bullish but US-China relations are unstable so we remain tactically defensive. Forget Biden’s China Review, He’s A Hawk Chinese financial markets face a host of challenges this year, despite the positive factors for China’s manufacturing sector amid the global recovery. At home these challenges consist of a structural economic slowdown, a withdrawal of policy stimulus, bearish sentiment among households, and an ongoing government crackdown on systemic risk. Abroad the Democratic Party’s return to power in Washington means that the US will bring more allies to bear in its attempt to curb China’s rise. This combination of factors presents a headwind for Chinese equities and a tailwind for government bonds (Chart 2). This is true at least until the government should hit its pain threshold and re-stimulate. Chart 2Global Investors Still Wary
Global Investors Still Wary
Global Investors Still Wary
New stimulus may not occur in 2022. The Communist Party’s leadership rotation merely requires economic stability, not rapid growth. While the central government has a record of stimulating when its pain threshold is hit, even under the economically hawkish President Xi Jinping, a financial market riot is usually part of this threshold. This implies near-term downside, particularly for global commodities and metals, which are also facing a Chinese regulatory backlash to deter speculation. In this context, President Biden’s call for a deeper US intelligence investigation into the origin of COVID-19 is an important confirming signal of the US’s hawkish turn toward China. Biden gave 90 days for the intelligence community to report back to him. We will not enter into the debate about COVID-19’s origins. From a geopolitical point of view it is a moot point. The facts of the virus origin may never be established. According to Biden’s statement, at least one US intelligence agency believes the “lab leak theory” is the most likely source of the virus (while two other agencies decided in favor of animal-to-human transmission). Meanwhile Chinese government spokespeople continue to push the theory that the virus originated at the US’s Fort Detrick in Maryland or at a US-affiliated global research center. What is certain is that the first major outbreak of a highly contagious disease occurred in Wuhan. Both sides are demanding greater transparency and will reject each other’s claims based on a lack of transparency. If the US intelligence report concludes that COVID originated from the Wuhan Institute of Virology, the Chinese government and media will reject the report. If the report exonerates the Wuhan laboratory, at least half of the US public will disbelieve it and it will not deter Biden from drawing a hard line on more macro-relevant policy disputes with China. The US’s hawkish bipartisan consensus on China took shape before COVID. Biden’s decision to order the fresh report introduces skepticism regarding the World Health Organization’s narrative, which was until now the mainstream media’s narrative. Previously this skepticism was ghettoized in US public discourse: indeed, until Biden’s announcement on May 26, the social media company Facebook suppressed claims that the virus came from a lab accident or human failure. Thus Biden’s action will ensure that a large swathe of the American public will always tend to support this theory regardless of the next report’s findings. At the same time Biden discontinued a State Department effort to prove the lab leak theory, which shows that it is not a foregone conclusion what his administration will decide. The good news is that even if the report concluded in favor of the lab leak, the Biden administration would remain highly unlikely to demand that China pay “reparations,” like the Trump administration demanded in 2020. This demand, if actualized, would be explosive. The bad news is that a future nationalist administration could conceivably use the investigation as a basis to demand reparations. Nationalism is a force to be reckoned with in both countries and the dispute over COVID’s origin will exacerbate it. Traditionally the presidents of both countries would tamp down nationalism or attempt to keep it harnessed. But in the post-Xi, post-Trump era it is harder to control. The death toll of COVID-19 will be a permanent source of popular grievance around the world and a wedge between the US and China (Chart 3). China’s international image suffered dramatically in 2020. So far in 2021 China has not regained any diplomatic ground. Chart 3Death Toll Of COVID-19
Biden Confirmed As A China Hawk (GeoRisk Update)
Biden Confirmed As A China Hawk (GeoRisk Update)
The US is repairing its image via a return to multilateralism while the Europeans have put their Comprehensive Agreement on Investment with China on hold due to a spat over sanctions arising from western accusations of genocide (a subject on which China pointedly answered that it did not need to be lectured by Europeans). Notably Biden’s Department of State also endorsed its predecessor’s accusation of genocide in Xinjiang. Any authoritative US intelligence review that solidifies doubts about the WHO’s initial investigation – even if it should not affirm the lab leak theory – would give Biden more ammunition in global opinion to form a democratic alliance to pressure China (for example, in Europe). An important factor that enables the US to remain hawkish on China is fiscal stimulus. While stimulus helps bring about economic recovery, it also lowers the bar to political confrontation (Chart 4). Countries with supercharged domestic demand do not have as much to fear from punitive trade measures. The Biden administration has not taken new punitive measures against China but it is clearly not worried about Chinese retaliation. Chart 4Large Fiscal Stimulus Lowers The Bar To Geopolitical Conflict
Biden Confirmed As A China Hawk (GeoRisk Update)
Biden Confirmed As A China Hawk (GeoRisk Update)
China’s stimulus is underrated in this chart (which excludes non-fiscal measures) but it is still true that China’s policy has been somewhat restrained and it will need to stimulate its economy again in response to any new punitive measures or any global loss of confidence. At least China is limited in its ability to tighten policy due to the threat of US pressure and western trade protectionism. Simultaneous with Biden’s announcement on COVID-19, his administration’s coordinator for Indo-Pacific affairs, Kurt Campbell, proclaimed in a speech that the era of “engagement” with China is officially over and the new paradigm is one of “competition.” By now Campbell is stating the obvious. But this tone is a change both from his tone while serving in President Obama’s Department of State and from his article in Foreign Affairs last year (when he was basically auditioning for his current role in the Biden administration).1 Campbell even said in his latest remarks that the Trump administration was right about the “direction” of China policy (though not the “execution”), which is candid. Campbell was speaking at Stanford University but his comments were obviously aimed for broader consumption. Investors no longer need to wait for the outcome of the Biden administration’s comprehensive review of policy toward China. The answer is known: the Biden administration’s hawkishness is confirmed. The Department of Defense report on China policy, due in June, is very unlikely to strike a more dovish posture than the president’s health policy. Now investors must worry about how rapidly tensions will escalate and put a drag on global sentiment. Bottom Line: US-China relations are unstable and pose an immediate threat to global risk appetite. The fundamental geopolitical assessment of US-China relations has been confirmed yet again. The US is seeking to constrain China’s rise because China is the only country capable of rivaling the US for supremacy in Asia and the world. Meanwhile China is rejecting liberalization in favor of economic self-sufficiency and maintaining an offensive foreign policy as it is wary of US containment and interference. Presidents Biden and Xi Jinping are still capable of stabilizing relations in the medium term but they are unlikely to substantially de-escalate tensions. And at the moment tensions are escalating. China’s Reaction: The Example Of Australia How will China respond to Biden’s new inquiry into COVID’s origins? Obviously Beijing will react negatively but we would not expect anything concrete to occur until the result of the inquiry is released in 90 days. China will be more constrained in its response to the US than it has been with Australia, which called for an international inquiry early last year, as the US is a superior power. Australia was the first to ban Chinese telecom company Huawei from its 5G network (back in 2018) and it was the first to call for a COVID probe. Relations between China and Australia have deteriorated steadily since then, but macro trends have clearly driven the Aussie dollar. The AUD-JPY exchange rate is a good measure for global risk appetite and it is wavering in recent weeks (Chart 5). Chart 5Australian Dollar Follows Macro Trends, Rallies Amid China Trade Spat
Australian Dollar Follows Macro Trends, Rallies Amid China Trade Spat
Australian Dollar Follows Macro Trends, Rallies Amid China Trade Spat
Tensions have also escalated due to China’s dependency on Australian commodity exports at a time of spiking commodity prices. This is a recurring theme going back to the Stern Hu affair. The COVID spat led China to impose a series of sanctions against Australian beef, barley, wine, and coal. But because China cannot replace Australian resources (at least, not in the short term), its punitive measures are limited. It faces rising producer prices as a result of its trade restrictions (Chart 6). This dependency is a bigger problem for China today than it was in previous cycles so China will try to diversify. Chart 6Constraints On China's Tarrifs On Australia
Constraints On China's Tarrifs On Australia
Constraints On China's Tarrifs On Australia
By contrast, China is not likely to impose sanctions on the US in response to Biden’s investigation, unless Biden attacks first. China’s imports from the US are booming and its currency is appreciating sharply. Despite Beijing’s efforts to keep the Phase One trade deal from collapsing, Biden is maintaining Trump’s tariffs and the US-China trade divorce is proceeding (Chart 7). Bilateral tariff rates are still 16-17 percentage points higher than they were in 2018, with US tariffs on China at 19% (versus 3% on the rest of the world) while Chinese tariffs on the US stand at 21% (versus 6% on the rest of the world). The Biden administration timed this week’s hawkish statements to coincide with the first meeting of US trade negotiators with China, which was a more civil affair. Both countries acknowledged that the relationship is important and trade needs to be continued. However, US Trade Representative Katherine Tai’s comments were not overly optimistic (she told Reuters that the relationship is “very, very challenging”). She has also been explicit about maintaining policy continuity with the Trump administration. We highly doubt that China’s share of US imports will ever surpass its pre-Trump peaks. The Biden administration has also refrained so far from loosening export controls on high-tech trade with China. This has caused a bull market in Taiwan while causing problems for Chinese semiconductor stocks’ relative performance (Chart 8). If Biden’s policy review does not lead to any relaxation of export controls on commercial items then it will mark a further escalation in tensions. Chart 7US Tarrifs Reduce China In Trade Deficit
US Tarrifs Reduce China In Trade Deficit
US Tarrifs Reduce China In Trade Deficit
Bottom Line: Until Presidents Biden and Xi stabilize relations at the top, the trade negotiations over implementing the Phase One trade deal – and any new Phase Two talks – cannot bring major positive surprises for financial markets. Chart 8US Export Controls Amid Chip Shortage
US Export Controls Amid Chip Shortage
US Export Controls Amid Chip Shortage
Congress Is More Hawkish Than Biden Biden’s ability to reduce frictions with China, should he seek to, will also be limited by Congress and public opinion. With the US deeply politically divided, and polarization at historically high levels, China has emerged as one of the few areas of agreement. The hawkish consensus is symbolized by new legislation such as the Strategic Competition Act, which is making its way through the Senate rapidly. Congress is also trying to boost US competitiveness through bills such as the Endless Frontier Act. These bills would subject China to scrutiny and potential punitive measures over a broad range of issues but most of all they would ignite US industrial policy , STEM education, and R&D, and diversify the US’s supply chains. We would highlight three key points with regard to the global impact of this legislation: Global supply chains are shifting regardless: This trend is fairly well established in tech, defense, and pharmaceuticals. It will continue unless we see a major policy reversal from China to try to court western powers and reduce frictions. The EU and India are less enthusiastic than the US and Australia about removing China from supply chains but they are not opposed. The EU Commission has recommended new defensive economic measures that cover supply chains in batteries, cloud services, hydrogen energy, pharmaceuticals, materials, and semiconductors. As mentioned, the EU is also hesitating to ratify the Comprehensive Agreement on Investment with China. Hence the EU is moving in the US’s direction independently of proposed US laws. After all, China’s rise up the tech value chain (and its decision to stop cutting back the size of its manufacturing sector) ultimately threatens the EU’s comparative advantage. The EU is also aligned with the US on democratic values and network security. India has taken a harder stance on China than usual, which marks an important break with the past. India’s decision to exclude Huawei from its 5G network is not final but it is likely to be at least partially implemented. A working group of democracies is forming regardless. The Strategic Competition Act calls for the creation of a working group of democracies but the truth is that this is already happening through more effective forums like the G7 and bilateral summits. Just as the implementation of the act would will ultimately depend on President Biden, so the willingness of other countries to adopt the recommendations of the working group would depend on their own executives. Allies have leeway as Biden will not use punitive measures against them: Any policy change from the EU, UK, India, and Australia will be independent of the US Congress passing the Strategic Competition Act. These countries will be self-directed. The US would have to devote diplomatic energy to maintaining a sustained effort by these states to counter China in the face of economic costs. This will be limited by the fact that the Biden administration will be very reluctant to impose punitive measures on allies to insist on their cooperation. The allies will set the pace of pressure on China rather than the United States. This gives the EU an important position, particularly Germany. And yet the trends in Germany suggest that the government will be more hawkish on China after the federal elections in September. Bottom Line: The Biden administration is unlikely to use punitive measures against allies so new US laws are less important than overall US diplomacy with each of the allies. Some allies will be less compliant with US policies given their need for trade with China. But so far there appears to be a common position taking shape even with the EU that is prejudicial to China’s involvement in key sectors of emerging technologies. If China does not respond by reducing its foreign policy assertiveness, then China’s economic growth will suffer. That drag would have to be offset by new supply chain construction in Southeast Asia and other countries. Investment Takeaways The foregoing highlights the international risks facing China even at a time when its trend growth is slowing (Chart 9) and its ongoing struggle with domestic financial imbalances is intensifying. China’s debt-service costs have risen sharply and Beijing is putting pressure on corporations and local governments to straighten out their finances (Chart 10), resulting in a wave of defaults. This backdrop is worrisome for investors until policymakers reassure them that government support will continue. Chart 9China's Growth Potential Slowing
China's Growth Potential Slowing
China's Growth Potential Slowing
Chart 10China's Leaders Struggle With Debt
China's Leaders Struggle With Debt
China's Leaders Struggle With Debt
China’s domestic stability is a key indicator of whether geopolitical risks could spiral out of control. In particular we think aggressive action in the Taiwan Strait is likely to be delayed as long as the Chinese economy and regime are stable. China has rattled sabers over the strait this year in a warning to the United States not to cross its red line (Chart 11). It is not yet clear how Biden’s policy continuity with the Trump administration will affect cross-strait stability. We see no basis yet for changing our view that there is a 60% chance of a market-negative geopolitical incident in 2021-22 and a 5% chance of full-scale war in the short run. Chart 11China PLA Flights Over Taiwan Strait
Biden Confirmed As A China Hawk (GeoRisk Update)
Biden Confirmed As A China Hawk (GeoRisk Update)
Putting all of the above together, we see substantial support for two key market-relevant geopolitical risks: Chinese domestic politics (including policy tightening) and persistent US-China tensions (including but not limited to the Taiwan Strait). We remain tactically defensive, a stance supported by several recent turns in global markets: The global stock-to-bond ratio has rolled over. China is a negative factor for global risk appetite (Chart 12). Global cyclical equities are no longer outperforming defensives. There is a stark divergence between Chinese cyclicals and global cyclicals stemming from the painful transition in China’s bloated industrial economy (Chart 13). Global large caps are catching a bid relative to small caps (Chart 14). Chart 12Global Stock-To-Bond Ratio Rolled Over
Global Stock-To-Bond Ratio Rolled Over
Global Stock-To-Bond Ratio Rolled Over
Chart 13Global Cyclicals-To-Defensives Pause
Biden Confirmed As A China Hawk (GeoRisk Update)
Biden Confirmed As A China Hawk (GeoRisk Update)
Chart 14Global Large Caps Catch A Bid Versus Small Caps
Global Large Caps Catch A Bid Versus Small Caps
Global Large Caps Catch A Bid Versus Small Caps
Cyclically the global economic recovery should continue as the pandemic wanes. China will eventually relax policy to prevent too abrupt of a slowdown. Therefore our strategic portfolio reflects our high-conviction view that the current global economic expansion will continue even as it faces hurdles from the secular rise in geopolitical risk, especially US-China cold war. Measurable geopolitical risk and policy uncertainty are likely to rebound sooner rather than later, with a negative impact on high-beta risk assets. Matt Gertken Vice President Geopolitical Strategy mattg@bcaresearch.com Coda: Global Minimum Tax Symbolizes Return Of Big Government On Thursday, the US Treasury Department released a proposal to set the global minimum corporate tax rate at 15%. The plan is to stop what Treasury Secretary Janet Yellen has referred to as a global “race to the bottom” and create the basis for a rehabilitation of government budgets damaged by pandemic-era stimulus. Although the newly proposed 15% rate is significantly below President Biden’s bid to raise the US Global Intangible Low-Taxed Income (GILTI) rate to 21% from 10.5%, it is the same rate as his proposed minimum tax on corporate book income. Biden is also raising the headline corporate tax rate from 21% to around 25% (or at highest 28%). Negotiators at the OECD were initially discussing a 12.5% global minimum rate. The finance ministers of both France and Germany – where the corporate income tax rates are 32.0% and 29.9%, respectively – both responded positively to the announcement. However, Ireland, which uses low corporate taxes as an economic development strategy, is obviously more comfortable with a minimum closer to its own 12.5% rate. Discussions are likely to occur when G7 finance ministers meet on June 4-5. Countries are hoping to establish a broad outline for the proposal by the G20 meeting in early July. It is highly likely that the OECD will come to an agreement. However, it is not a truly “global” minimum as there will still be tax havens. Compliance and enforcement will vary across countries. A close look at the domestic political capital of the relevant countries shows that while many countries have the raw parliamentary majorities necessary to raise taxes, most countries have substantial conservative contingents capable of preventing stiff corporate tax hikes (Table 1, in the Appendix). Our Geopolitical strategists highlight that the Biden administration’s compromise on the minimum rate reflects its pragmatism as well as emphasis on multilateralism. Any global deal will be non-binding but the two most important low-tax players are already committed to raising corporate rates well above this level: Biden’s plan is noted above, while the UK’s budget for March includes a jump in the business rate to 25% in April 2023 from the current 19%. Ireland and Hungary are the only outliers but they may eventually be forced to yield to such a large coalition of bigger economies (Chart 15). Chart 15Global Minimum Corporate Tax Impact Is Symbolic Rather Than Concrete
Biden Confirmed As A China Hawk (GeoRisk Update)
Biden Confirmed As A China Hawk (GeoRisk Update)
Thus a nominal minimum corporate tax rate is likely to be forged but it will not be truly global and it will not change the corporate rate for most countries. The reality of what companies pay will also depend on loopholes, tax havens, and the effective tax rate. Bottom Line: On a structural horizon, the global minimum corporate tax is significant for showing a paradigm shift in global macro policy: western governments are starting to raise taxes and revenue after decades of cutting taxes. The experiment with limited government has ended and Big Government is making a comeback. On a cyclical horizon, the US concession on global minimum tax is that the Biden administration aims to be pragmatic and “get things done.” Biden is also working with Republicans to pass bills covering some bipartisan aspects of his domestic agenda, such as trade, manufacturing, and China. The takeaway from a global point of view is that Biden may prove to be a compromiser rather than an ideologue, unlike his predecessors. Matt Gertken Vice President Geopolitical Strategy mattg@bcaresearch.com Roukaya Ibrahim Vice President Daily Insights RoukayaI@bcaresearch.com Footnotes 1 Kurt M. Campbell and Jake Sullivan, "Competition Without Catastrophe," Foreign Affairs, September/October 2019, foreignaffairs.com. Section II: Appendix Table 1OECD: Which Countries Are Willing And Able To Raise Corporate Tax Rates?
Biden Confirmed As A China Hawk (GeoRisk Update)
Biden Confirmed As A China Hawk (GeoRisk Update)
GeoRisk Indicator China
China: GeoRisk Indicator
China: GeoRisk Indicator
Russia
Russia: GeoRisk Indicator
Russia: GeoRisk Indicator
UK
UK: GeoRisk Indicator
UK: GeoRisk Indicator
Germany
Germany: GeoRisk Indicator
Germany: GeoRisk Indicator
France
France: GeoRisk Indicator
France: GeoRisk Indicator
Italy
Italy: GeoRisk Indicator
Italy: GeoRisk Indicator
Canada
Canada: GeoRisk Indicator
Canada: GeoRisk Indicator
Spain
Spain: GeoRisk Indicator
Spain: GeoRisk Indicator
Taiwan – Province Of China
Taiwan-Province of China: GeoRisk Indicator
Taiwan-Province of China: GeoRisk Indicator
Korea
Korea: GeoRisk Indicator
Korea: GeoRisk Indicator
Turkey
Turkey: GeoRisk Indicator
Turkey: GeoRisk Indicator
Brazil
Brazil: GeoRisk Indicator
Brazil: GeoRisk Indicator
Australia
Australia: GeoRisk Indicator
Australia: GeoRisk Indicator
Section III: Geopolitical Calendar
BCA Research’s Commodity & Energy Strategy service believes that China's jawboning of participants in metals markets raises the odds the State Reserve Board (SRB) will release some of its massive copper and aluminum stockpiles in the near future. …
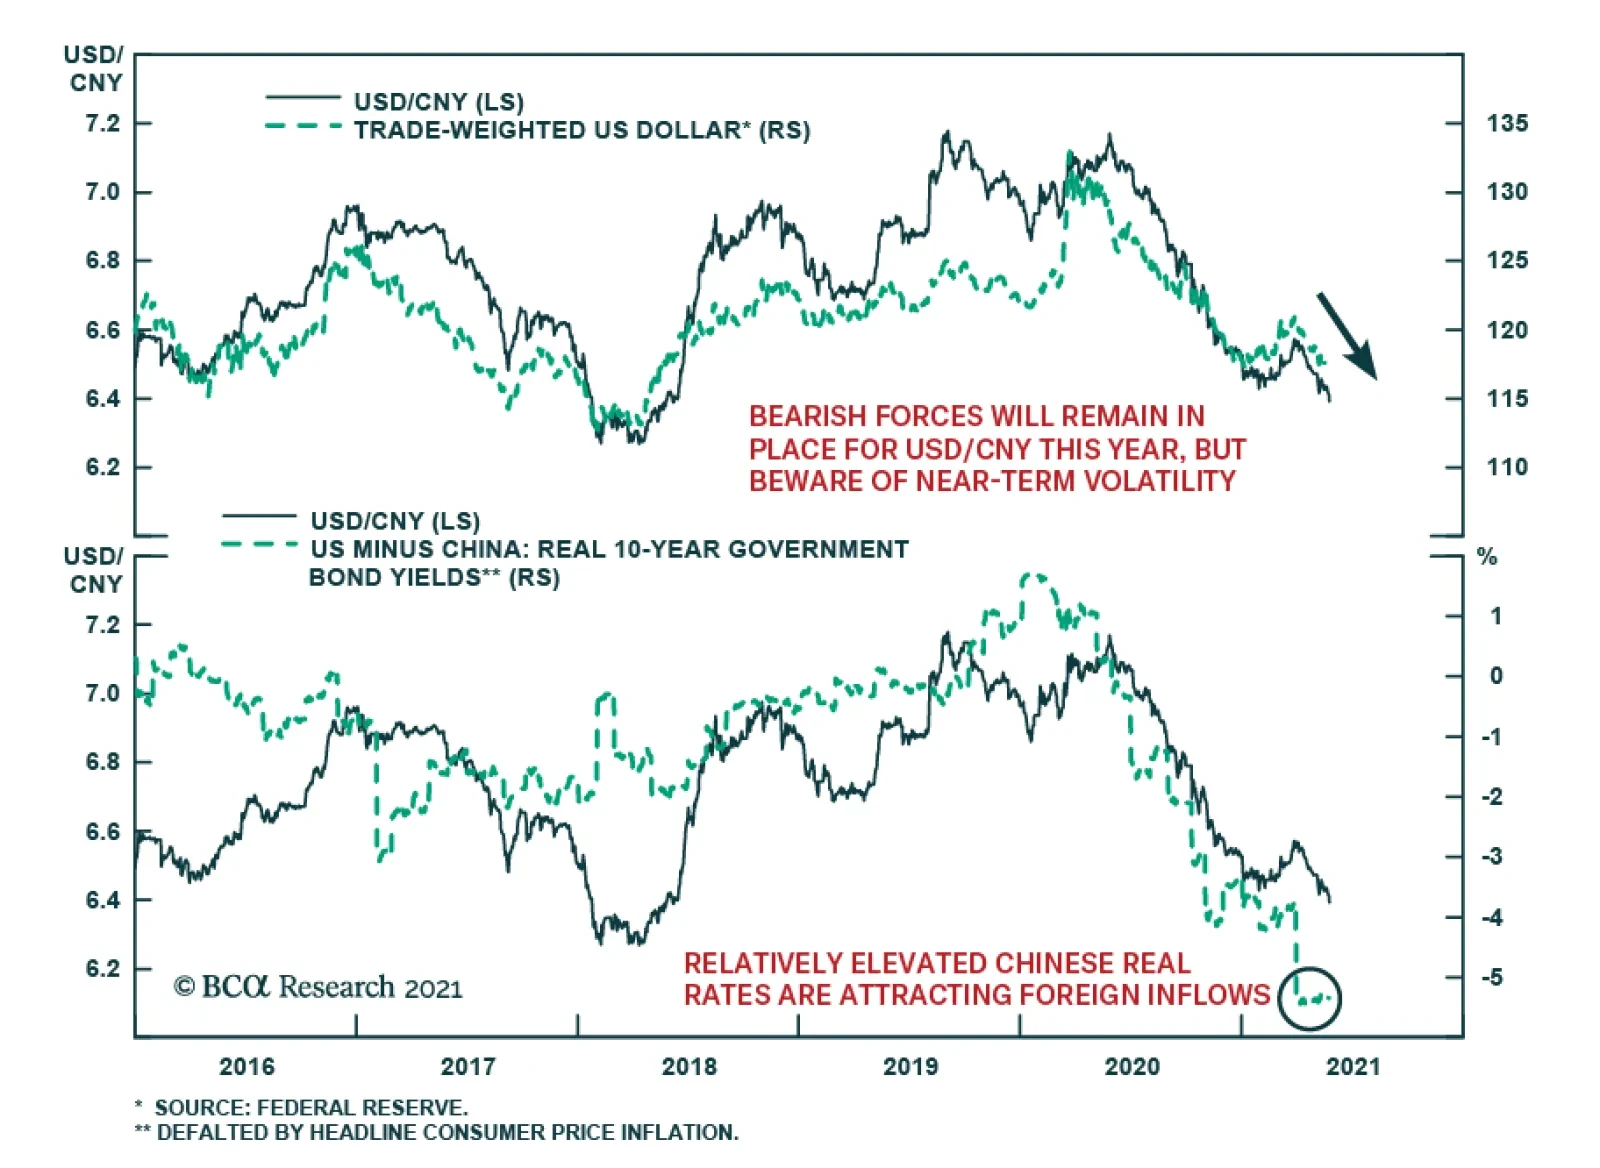
After a period of weakness in the first quarter, RMB strength has been reaffirmed. USD/CNY peaked at the end of March and is down more than 2.5% since then. Broad-based US dollar weakness explains some of the CNY’s recent gains. Nevertheless, the Chinese…
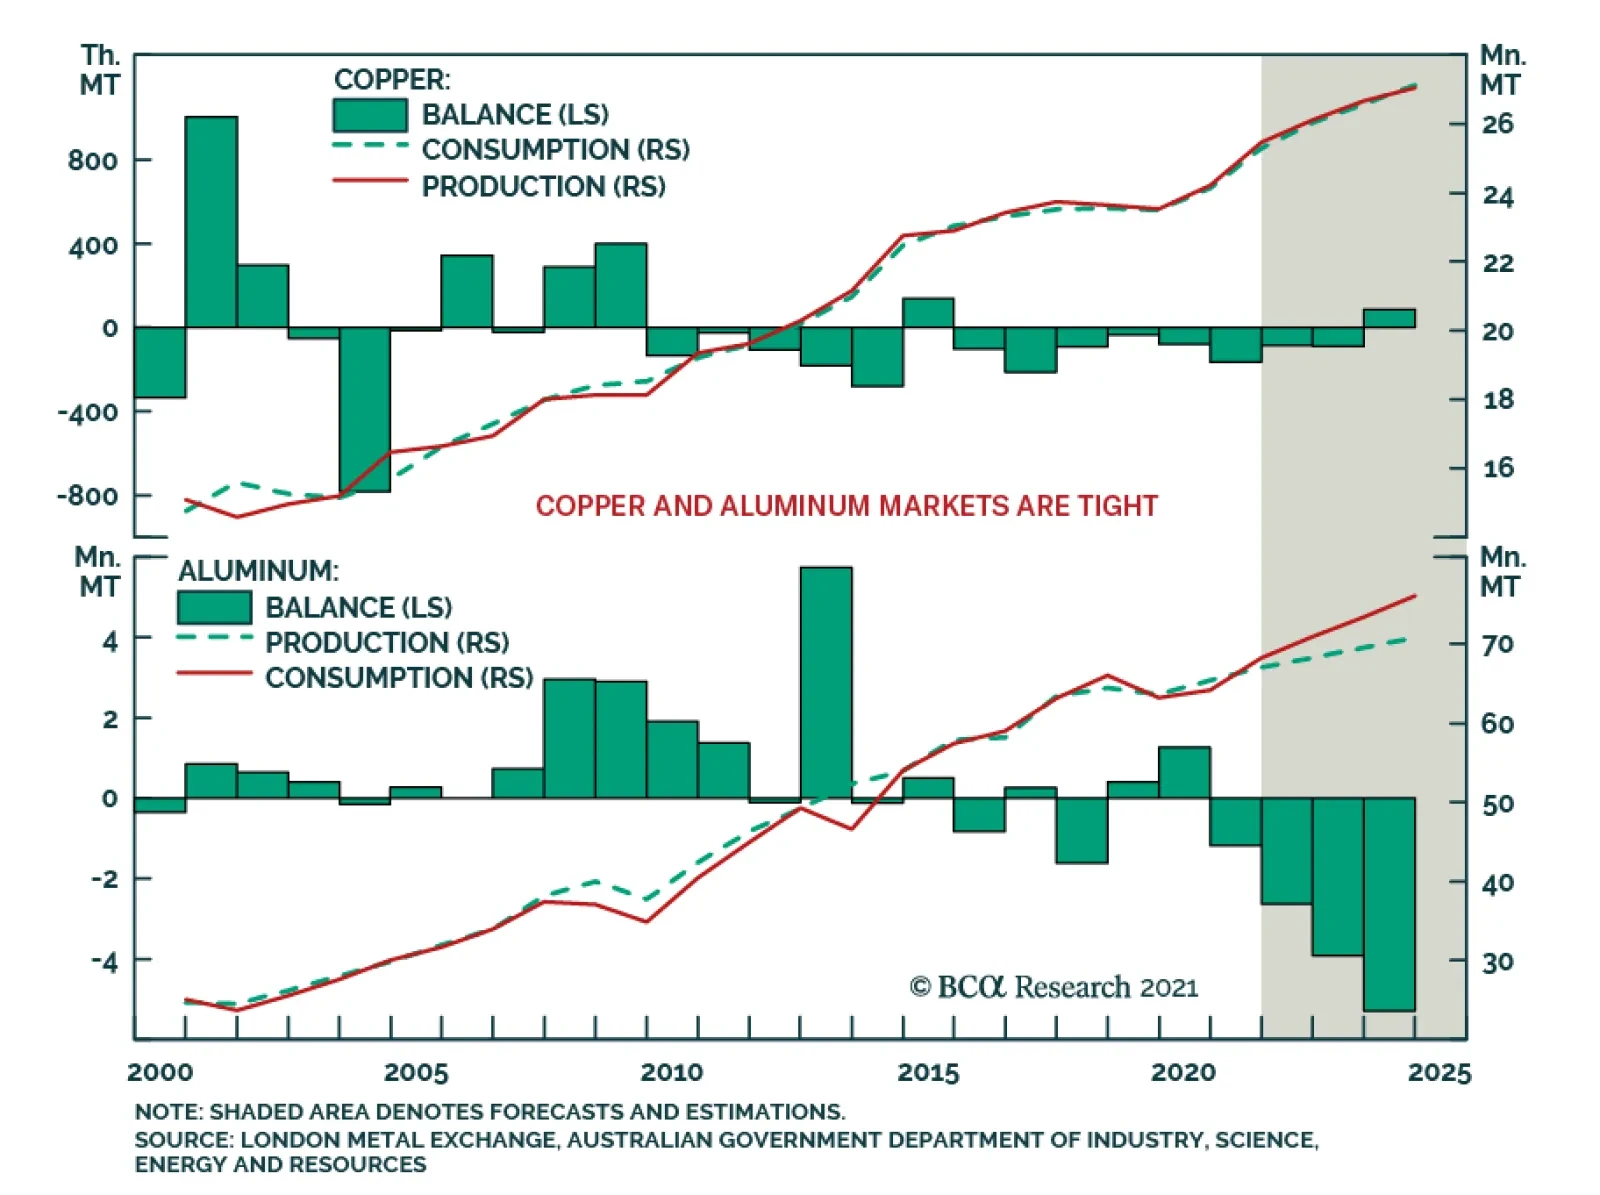
Highlights China's high-profile jawboning draws attention to tightness in metals markets, and raises the odds the State Reserve Board (SRB) will release some of its massive copper and aluminum stockpiles in the near future. Over the medium- to long-term, the lack of major new greenfield capex raises red flags for the IEA's ambitious low-carbon pathway released last week, which foresees the need for a dramatic increase in renewable energy output and a halt in future oil and gas investment to achieve net-zero emissions by 2050. Copper demand is expected to exceed mined supply by 2028, according to an analysis by S&P, which, in line with our view, also sees refined-copper consumption exceeding production this year (Chart of the Week). A constitution re-write in Chile and elections in Peru threaten to usher in higher taxes and royalties on mining in these metals producers, placing future capex at risk. Chile's state-owned Codelco, the largest copper producer in the world, fears a bill to limit mining near glaciers could put as much as 40% of its copper production at risk. We remain bullish copper and look to get long on politically induced sell-offs as the USD weakens. Feature Politicians are inserting themselves in the metals markets' supply-demand evolutions to a greater degree than in the past, which is complicating the short- and medium-term analysis of prices. This adds to an already-difficult process of assessing markets, given the opacity of metals fundamentals – particularly inventories, which are notoriously difficult to assess. Chinese Communist Party (CCP) jawboning of market participants in iron ore, steel, copper and aluminum markets over the past two weeks has weakened prices, but, with the exception of steel rebar futures in Shanghai – down ~ 17% from recent highs, and now trading at ~ 4911 RMB/MT – the other markets remain close to records. Benchmark 62% Fe iron ore at the port of Tianjin was trading ~ 4% lower at $211/MT, while copper and aluminum were trading ~ 5.5% and 6.5% off their recent records at $4.535/lb and $2,350/MT, respectively. In addition to copper, aluminum markets are particularly tight (Chart 2). Jawboning aside, if fundamentals continue to keep prices elevated – or if we see a new leg up – China's high-profile jawboning could presage a release by the State Reserve Board (SRB) of some of its massive copper and aluminum stockpiles in the near term. In the case of copper, market guesses on the size of this stockpile are ~ 2mm to 2.7mm MT. On the aluminum side, Bloomberg reported CCP officials were considering the release of 500k MT to quell the market's demand for the metal. Chart of the WeekContinue Tightening In Copper Expected
Continue Tightening In Copper Expected
Continue Tightening In Copper Expected
Chart 2Aluminum Remains Tight
Aluminum Remains Tight
Aluminum Remains Tight
Brownfield Development Not Sufficient Our balances assessments continue to indicate key base metals markets are tight and will remain so over the short term (2-3 years). Economies ex-China are entering their post-COVID-19 recovery phase. This will be followed by higher demand from renewable generation and grid build-outs that will put them in direct competition with China for scarce metals supplies for decades to come. Markets will continue to tighten. In the bellwether copper market, we expect this tightness to remain a persistent feature of the market over the medium term – 3 to 5 years out – given the dearth of new supply coming to market. Copper prices are highly correlated with the other base metals (Chart 3) – the coefficient of correlation with the other base metals making up the LME's metals index is ~ 0.86 post-GFC – and provide a useful indicator of systematic trends in these markets. Chart 3Copper Correlation With LME Index Ex-Copper
Less Metal, More Jawboning
Less Metal, More Jawboning
Copper ore quality has been falling for years, as miners focused on brownfield development to extend the life of mines (Chart 4). In Chart 5, we show the ratio of capex (in billion USD) to ore quality increases when capex growth is expanding faster than ore quality, and decreases when capex weakens and/or ore quality degradation is increasing. Chart 4Copper Capex, Ore Quality Declines
Less Metal, More Jawboning
Less Metal, More Jawboning
Chart 5Capex-to-Ore-Quality Decline Set Market Up For Higher Prices
Less Metal, More Jawboning
Less Metal, More Jawboning
Falling prices over the 2012-19 interval coincide with copper ore quality remaining on a downward trend, likely the result of previous higher prices that set off the capex boom pre-GFC. The lower prices favored brownfield over greenfield development. Goehring and Rozencwajg found in their analysis of 24 mines, about 80% of gross new reserves booked between 2001-2014 were due not to new mine discoveries but to companies reclassifying what was once considered to be waste-rock into minable reserves, lowering the cut-off grade for development.1 This is consistent with the most recent datapoints in Chart 5, due to falling ore grade values, as companies inject less capex into their operations and use it to expand on brownfield projects. Higher prices will be needed to incentivize more greenfield projects. A new report from S&P Global Market Intelligence shows copper reserves in the ground are falling along with new discoveries.2 According to the S&P analysts, copper demand is expected to exceed mined supply by 2028, which, in line with our view, sees refined-copper consumption exceeding production this year. Renewables Push At Risk Just last week, the IEA produced an ambitious and narrow path for governments to collectively reach a net-zero emissions (NZE) goal by 2050.3 Among its many recommendations, the IEA singled out the overhaul of the global electric grid, which will be required to accommodate the massive renewable-generation buildout the agency forecasts will be needed to achieve its NZE goals. The IEA forecasts annual investment in transmission and distribution grids will need to increase from $260 billion to $820 billion p.a. by 2030. This is easier said than done. Consider the build-out of China's grid, which is the largest grid in the world. To become carbon neutral by 2060, per its stated goals, investment in China’s grid and associated infrastructure is expected to approach ~ $900 billion, maybe more, over the next 5 years.4 The world’s largest fossil-fuel importer is looking to pivot away from coal and plans to more than double solar and wind power capacity to 1200 GW by 2030. Weening China off coal and rebuilding its grid to achieve these goals will be a herculean lift. It comes as no surprise that IEA member states have pushed back on the agency's NZE-by-2050 plan. This primarily is because of its requirement to completely halt fossil-fuel exploration and spending on new projects. Japan and Australia have pushed back against this plan, citing energy security concerns. Officials from both countries have stated that they will continue developing fossil fuel projects, as a back-up to renewables. Japan has been falling behind on renewable electricity generation (Chart 6). Expensive renewables and the unpopularity of nuclear fuel could make it harder for the world’s fifth largest fossil fuels consumer to move away from fossil fuels. Around the same time the IEA released its report, Australia committed $464 million to build a new gas-fired power station as a backup to renewables. Chart 6Japan Will Continue Building Fossil-Fuel Back-Up Generation
Japan Will Continue Building Fossil-Fuel Back-Up Generation
Japan Will Continue Building Fossil-Fuel Back-Up Generation
Just days after the IEA report was published, the G7 nations agreed to stop overseas coal financing. This could have devastating effects for emerging and developing nations‘ electricity grids which are highly dependent on coal. In 2020 70% and 60% of India and China’s electricity respectively were produced by coal (Chart 7).5 Chart 7EM Economies Remain Reliant On Coal-Fired Generation
Less Metal, More Jawboning
Less Metal, More Jawboning
Near-Term Copper Supply Risks Rise Even though inventories appear to be rebuilding, mounting political risks keep us bullish copper (Chart 8). Lawmakers in Chile and Peru are in the process of re-writing their constitutions to, among other things, raise royalties and taxes on mining activities in their respective countries. This could usher in higher taxes and royalties on mining for these metals producers, placing future capex at risk. In addition, Chile's state-owned Codelco, the largest copper producer in the world, fears a bill to limit mining near glaciers could put as much as 40% of its copper production at risk.6 None of these events is certain to occur. Peruvian elections, for one thing, are too close to call at this point, and Chile has a history of pro-business government. However, these are non-trivial odds – i.e., greater than Russian roulette odds of 1:6 – and if any or all of these outcomes are realized, higher costs in copper and lithium prices would result, and miners would have to pass those costs on to buyers. Bottom Line: We remain bullish base metals, especially copper. Another leg up in copper would pull base metals higher with it. We would look to get long on politically induced sell-offs, particularly with the USD weakening, as expected Chart 8Global Copper Inventories Rebuilding But Still Down Y/Y
Global Copper Inventories Rebuilding But Still Down Y/Y
Global Copper Inventories Rebuilding But Still Down Y/Y
Robert P. Ryan Chief Commodity & Energy Strategist rryan@bcaresearch.com Ashwin Shyam Research Associate Commodity & Energy Strategy ashwin.shyam@bcaresearch.com Commodities Round-Up Energy: Bullish Next Tuesday's OPEC 2.0 meeting appears to be a fairly staid affair, with little of the drama attending previous gatherings. Russian minister Novak observed the coalition would be jointly "calculating the balances" when it meets, taking into account the likely official return of Iran as an exporter, according to reuters.com. We expect a mid-year deal on allowing Iran to return to resume exports under the nuclear deal abrogated by the Trump administration in 2019, and reckon Iran has ~ 1.5mm b/d of production it can bring back on line, which likely would return its crude oil production to something above 3.8mm b/d by year-end. We are maintaining our forecast for Brent to average $64.45/bbl in 2H21; $75 and $78/bbl, in 2022 and 2023, respectively. By end 2023, prices trade to $80/bbl. Our forecast is premised on a wider global recovery going into 2H21, and continued production discipline from OPEC 2.0 (Chart 9). Base Metals: Bullish Our stop-losses was elected on our long Dec21 copper position on May 21, which means we closed the position with 48.2% return. The stop loss on our long 2022 vs short 2023 COMEX copper futures backwardation recommendation also was elected on May 20, leaving us with a return of 305%. We will be looking for an opportunity to re-establish these positions. Precious Metals: Bullish We expect the collapse in bitcoin prices, the US Fed’s decision to not raise interest rates, and a weakening US dollar to keep gold prices well bid (Chart 10). China’s ban on cryptocurrency services and Musk’s acknowledgment of the energy intensity of Bitcoin mining sent Bitcoin prices crashing. The Fed’s decision to keep interest rates constant, despite rising inflation and inflation expectations will reduce the opportunity cost of holding gold. According to our colleagues at USBS, the Fed will make its first interest rate hike only after the US economy has reached "maximum employment". The Job Openings and Labor Turnover Survey reported that job openings rose nearly 8% in March to 8.1 million jobs, however, overall hiring was little changed, rising by less than 4% to 6 million. As prices in the US rise and the dollar depreciates, gold will be favored as a store of value. On the back of these factors, we expect gold to hit $2,000/oz. Ags/Softs: Neutral Corn futures were trading close to 20% below recent highs earlier in the week at ~ $6.27/bu, on the back of much faster-than-expected plantings. Chart 9
Brent Prices Going Up
Brent Prices Going Up
Chart 10
US Dollar To Keep Gold Prices Well Bid
US Dollar To Keep Gold Prices Well Bid
Footnotes 1 Please refer to Goehring & Rozencwajg’s Q1 2021 market commentary. 2 Please see Copper cupboard remains bare as discoveries dwindle — S&P study published by mining.com 20 May 2021. 3 Please see Net Zero by 2050 – A Roadmap for the Global Energy Sector, published by the IEA. 4 Please see China’s climate goal: Overhauling its electricity grid, published by Aljazeera. 5 We discuss this in detail in Surging Metals Prices And The Case For Carbon-Capture published 13 May 2021, and Renewables ESG Risks Grow With Demand, which was published 29 April 2021. Both are available at ces.bcaresearch.com. 6 Please see A game of chicken is clouding tax debate in top copper nation, Fujimori looks to speed up projects to tap copper riches in Peru and Codelco says 40% of its copper output at risk if glacier bill passes published by mining.com 24, 23 and 20 May 2021, respectively. Investment Views and Themes Strategic Recommendations Tactical Trades Commodity Prices and Plays Reference Table Trades Closed in 2021 Summary of Closed Trades
Higher Inflation On The Way
Higher Inflation On The Way
The Seventh National Population Census reinforced the magnitude of China’s demographic challenge. The Census showed three meaningful shifts in China’s demographics in the past decade: 1. China is getting old before getting rich. 2. China’s total…
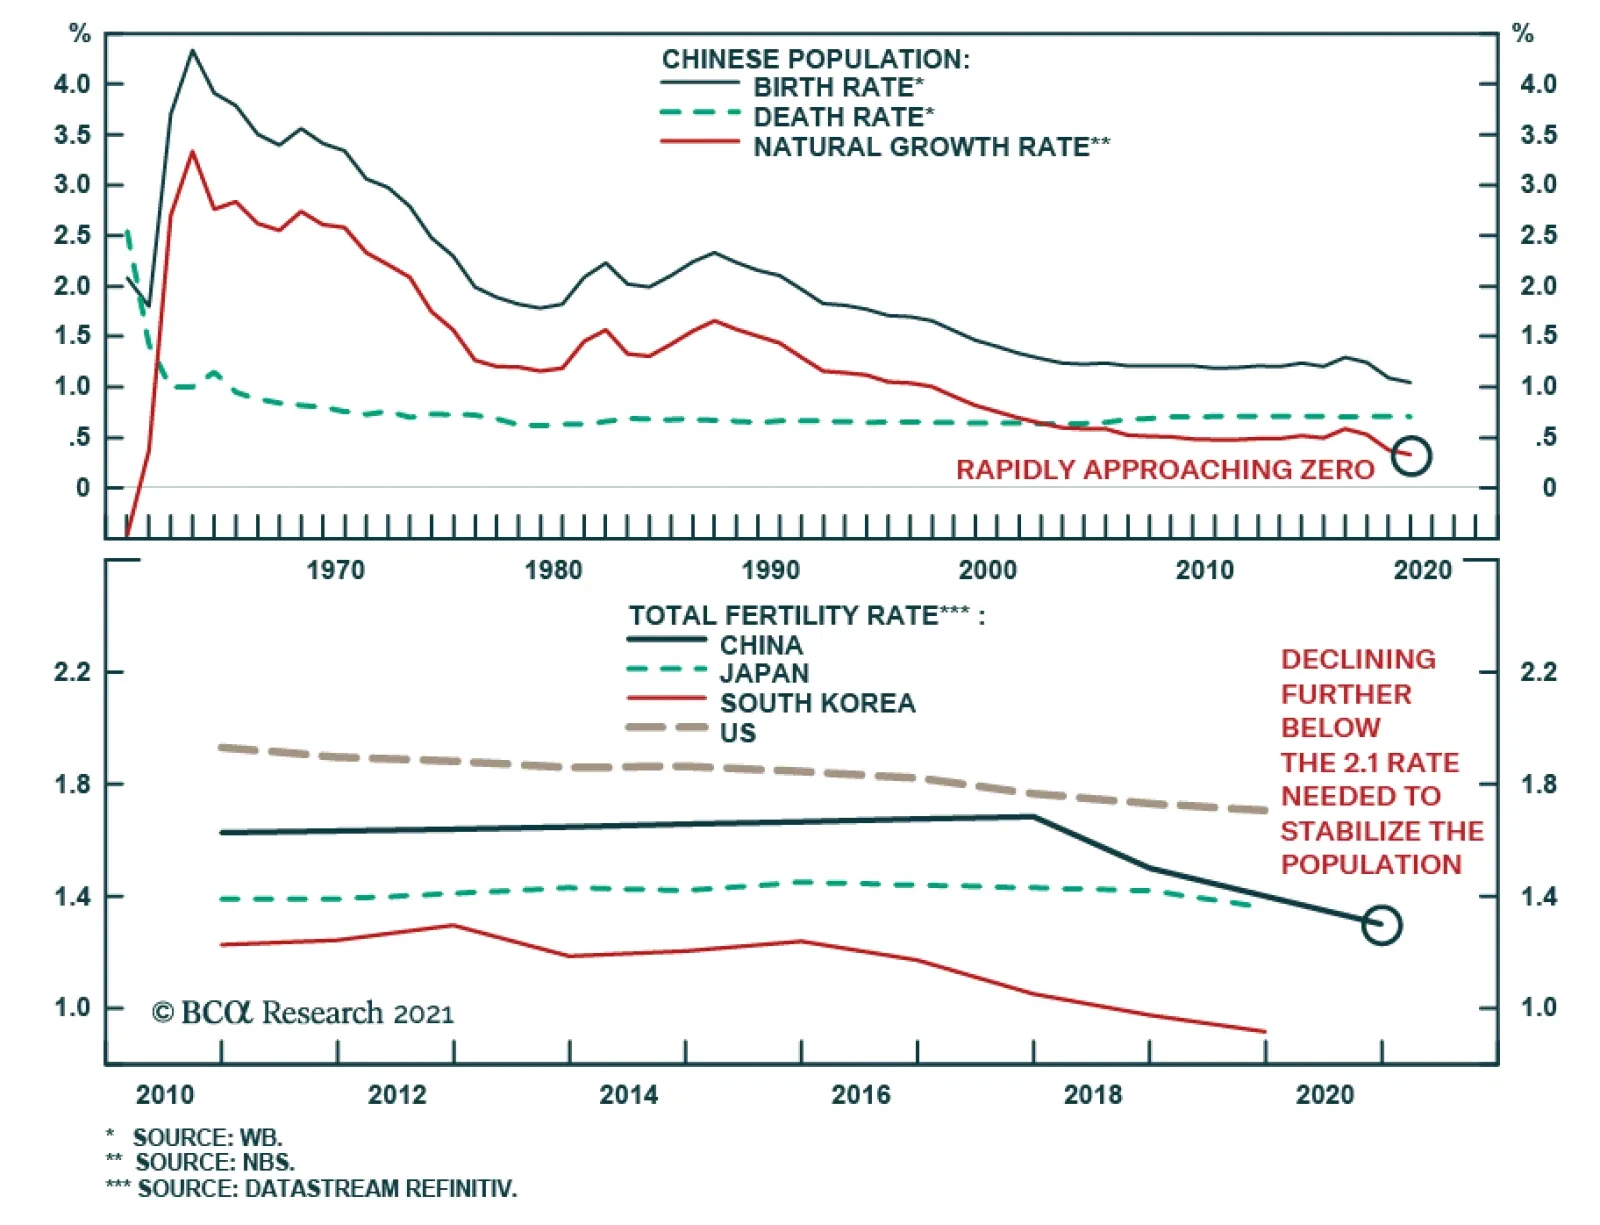
Highlights The Seventh National Population Census highlights the seriousness of China’s demographic deterioration; apart from a shrinking working-age population, the nation’s fertility and birth rates have dropped meaningfully. China’s urbanization rate will likely slow in the second half of this decade. The country’s urban population growth is only slightly positive, while the rural population is declining and aging. Demand for housing will experience a structural downshift, particularly in less developed regions. Competition for labor will become fiercer among regions and sectors, and wage growth will continue to accelerate. However, the manufacturing sector will remain competitive regardless of wage inflation, thanks to the rising quality of China’s labor force and innovation. Interest rates will structurally shift to a lower range, providing some tailwind to Chinese equities and government bonds. Feature The Seventh Population Census, conducted by the National Bureau of Statistics every 10 years, reinforced the magnitude of China’s demographic challenge. The nation’s population is not only aging but is set to start shrinking due to extremely low birth and fertility rates. The main implication is that China’s urbanization rate will slow and property market will likely encounter a structural downshift, tied to declining demand from both its working-age (age 15 to 64) and total population. Demand for housing will increasingly concentrate in top-tier cities because these metropolitan areas have more advantages attracting labor. Secondly, manufacturing will likely maintain its share of GDP, despite China’s push for consumption and growth in the service sector. Importantly, interest rates will continue to shift downward along with a decelerating potential growth; waning interest rates will create a tailwind to China’s capital market in the long term. Highlights From The Census The Census showed three meaningful shifts in China’s demographics in the past decade: 1. China is getting old before getting rich. China is experiencing a worse demographic transition than Japan in the early 1990s, with a lower level of per capita wealth than Japan attained when its working-age population peaked (Chart 1). Over the past ten years China’s population has only expanded by 5.4%, the lowest rate since the first census in 1953. Moreover, the country’s oldest cohort rose from 8.9% in 2010 to 13.5% and the working-age population is falling more quickly than in Japan. China’s working-age population peaked in 2010 and then fell by 6.79 percentage points in the next 10 years. In contrast, Japan’s working-age population peaked in 1992 and fell by 2.18 percentage points in the subsequent decade (Chart 1, top panel). 2. China’s total population is set to start declining in five years. Some demographers project that China’s total population will peak in 2027,1 but a high-level Chinese official recently predicted that the country’s population will start to trend down as early as in 2025.2 The relaxation of the one-child policy in 2015 helped to lift the birthrate (births per 1,000 people) briefly in 2016, before falling sharply again in 2017. The population’s natural growth rate, calculated as birthrate minus deathrate, is rapidly approaching zero (Chart 2). Chart 1China's Working Population Falling Faster Than Japan's In 1990s
China's Working Population Falling Faster Than Japan's In 1990s
China's Working Population Falling Faster Than Japan's In 1990s
Chart 2China's Population Growth Will Turn Negative In Mid-2020s
China's Population Growth Will Turn Negative In Mid-2020s
China's Population Growth Will Turn Negative In Mid-2020s
The birthrate is the main determinant of the population’s natural growth rate given that China’s deathrate has been steady for decades. If the birthrate continues to fall at the current rate, then China will undoubtedly reach a population turning point and will join nations such as Japan, Germany and South Korea, which have negative population growth. 3. A low fertility trap. Chart 3China's Alarmingly Low Fertility Rate Is Set To Decline Even Further...
China's Alarmingly Low Fertility Rate Is Set To Decline Even Further...
China's Alarmingly Low Fertility Rate Is Set To Decline Even Further...
China’s extremely low fertility rate3 is a major contributor to its falling birthrate. The current 1.3 reading is less than in many developed countries, such as Japan with 1.4 and the US with 1.6, and it is far below the fertility rate of 2.1 needed to stabilize a population, according to the United Nations (Chart 3). China’s fertility rate is set to dive even further in the coming years due to structural factors such as a dwindling number of childbearing-age women linked to the one-child policy implemented in the 1980s (Chart 4). China’s high female labor participation rate and low propensity among young people to get married, and the high cost of raising children in urban areas, all are long-standing socio-economic issues hindering the Chinese from having more babies (Chart 5). Chart 4…Due To Fewer Childbearing-Age Women And…
China’s Shifting Demographic Profile
China’s Shifting Demographic Profile
Chart 5...Structural Issues That Curb Chinese Propensity To Produce Babies
...Structural Issues That Curb Chinese Propensity To Produce Babies
...Structural Issues That Curb Chinese Propensity To Produce Babies
Bottom Line: These structural trends will take decades to reverse. China faces a dramatic plunge in its population in the very near future if the authorities do not enact significant and immediate policy changes. Urbanization Pace Will Slow The Census indicates that rapid urbanization continued through 2020, with the rate hitting 64% of the population, up 14 percentage points from 2010. However, the headline number in the urbanization rate understates China’s progress in industrialization, i.e. the country’s rural-to-urban transition has entered a late stage and the current pace cannot be sustained in the future. Significantly, China’s underlying demographic shifts will likely lead to a passive increase in the urbanization rate in the second half of this decade. This trend will curb rather than boost demand in urban areas. The experience of developed countries suggests that the pace of urbanization begins to slow when the rate reaches around 70% (Chart 6). Based on China’s current level, the country should reach the 70% threshold in just six to seven years. Meanwhile, China is much more industrialized than generally perceived: the country’s industrialization rate is currently 85%, which means that 85% of jobs in China are in non-agricultural sectors (Chart 7). Chart 6Urbanization Progress Stabilizes When Reaching 70%
Urbanization Progress Stabilizes When Reaching 70%
Urbanization Progress Stabilizes When Reaching 70%
Chart 7China Is Much More Industrialized Than Commonly Believed
China Is Much More Industrialized Than Commonly Believed
China Is Much More Industrialized Than Commonly Believed
Furthermore, a higher urbanization reading may be the result of negative natural population growth. Given that the urbanization rate is calculated as a percentage of urban population in the total population, a decline in the absolute level of total population (the denominator) could lead to a passive increase in the numerator. Chart 8Japan Has Had A "Passive" Increase In Urbanization Since 2012
Japan Has Had A "Passive" Increase In Urbanization Since 2012
Japan Has Had A "Passive" Increase In Urbanization Since 2012
For example, Japan’s urbanization rate rose significantly during the 2000s, and maintained an upward momentum even as its total population peaked in 2010. However, its urban population growth rate dropped dramatically and turned negative in 2012 – suggesting the increase in the urbanization rate is due to a shrinking total population instead of expanding urbanities (Chart 8). The rising deathrate of the rural elderly population is another important reason for the accelerated increase in Japan's urbanization rate. China’s urban population growth is on a sharp down trend, although it is still slightly positive (Chart 9). However, the rural population has shrunk and aged, which limits future migration from rural to urban areas (Chart 10). China’s rural population has shrunk by almost half from its peak in 1995 to 2020. The share of the rural population 50 years and older doubled in the same period. Chart 9China's Urban Population Growth Is On The Decline...
China's Urban Population Growth Is On The Decline...
China's Urban Population Growth Is On The Decline...
Chart 10...While Rural Population Has Shrunk And Aged
...While Rural Population Has Shrunk And Aged
...While Rural Population Has Shrunk And Aged
Thus, China’s rural-to-urban migration has slowed in the past decade (the trend turned negative last year due to the pandemic). The number of new migrant workers moving from the country to the city tumbled from 12.5 million a year to 2.5 million, and the number of younger migrants (50 years and younger) has contracted since 2017 (Chart 11). Chart 11The Number Of Young Migrant Workers Started Contracting In 2017
The Number Of Young Migrant Workers Started Contracting In 2017
The Number Of Young Migrant Workers Started Contracting In 2017
Bottom Line: Country-to-city migration will be smaller going forward based on a diminishing rural population, an increasing number of elders and a reduced proportion of young people in rural areas. When China’s population peaks, which is highly likely by 2025, its urbanization progress will turn passive and the aggregate population growth in urban areas may also turn negative. Aggregate Housing Demand Will Dwindle The demographic shifts described above will impact the demand for properties and accentuate regional divergences in housing demand and prices. Historically, changes in the working-age population led residential home sales by five to six years. Home sales have fluctuated in a downward trend in the past five years along with a peak in the working-age population in 2015 (Chart 12). Moreover, the sharp deterioration in China’s birthrate means that home sales will be significantly reduced in the next 15-20 years. Chart 12Aggregate Demand For Housing Will Dwindle Along With Smaller Labor Force
Aggregate Demand For Housing Will Dwindle Along With Smaller Labor Force
Aggregate Demand For Housing Will Dwindle Along With Smaller Labor Force
Chart 13Population Is An Important Driver For Urban Development
Population Is An Important Driver For Urban Development
Population Is An Important Driver For Urban Development
The regional divergence in the demand for housing will also widen. Population, especially the labor force, is an important driver for urban development and housing (Chart 13 above). Population migration mainly occurs among 15-59-year-olds, and this cohort is also the main homeowner group. As China’s labor force increasingly flocks to developed areas, the economic development of less developed areas will face greater challenges (Chart 14). Those areas will encounter a combination of declining birthrate and outflow of labor force. This demographic shift is already evident in many two- and third-tier cities where housing prices have lagged far behind the tier-one cities (Chart 15). Chart 14Less Developed Regions Have Seen Net Population Losses In The Past Decade…
China’s Shifting Demographic Profile
China’s Shifting Demographic Profile
Chart 15...And Softening Housing Prices
...And Softening Housing Prices
...And Softening Housing Prices
Bottom Line: The drop in China’s birthrate and working-age population will lead to less demand for housing. However, China’s first-tier cities (and core metropolitan areas) will likely continue to outperform third- and fourth-tier cities in terms of labor growth, consumption and home prices. Labor Measures And Manufacturing Competitiveness Labor shortages in selected sectors and upward pressure on wages will likely intensify in the coming decade. While labor quantity will decrease, the quality of China’s labor force will remain competitive. From an aggregate economy perspective, improving labor productivity and automation can help to offset the smaller number of workers (Chart 16). Following two decades of rapid expansion in the industrial sector, China’s labor shortages began to multiply when the country’s urbanization ratio rose to between 50% and 60%. Looking at Japan and Korea, for example, a shortage in manufacturing labor emerged when the countries’ manufacturing/agricultural employment ratio climbed above one. China’s employment ratio likely have crossed this threshold in the mid-2010s, coinciding with a rollover in its working-age population and a massive jump in wage growth (Chart 17). Chart 16Improving Labor Quality To Offset Smaller Labor Quantity
China’s Shifting Demographic Profile
China’s Shifting Demographic Profile
Chart 17Manufacturing Labor Shortage And Wage Pressure Intensified In Mid-2010s
Manufacturing Labor Shortage And Wage Pressure Intensified In Mid-2010s
Manufacturing Labor Shortage And Wage Pressure Intensified In Mid-2010s
The manufacturing and service sectors will continue to compete with agriculture for labor. The wage gap between urban and rural areas is disappearing and there are signs of labor market tightness in urban settings (Chart 18). While the demand for labor has been flat, labor supply peaked in 2013/14 and has been on the wane since that time, which has resulted in an ascending demand-to-supply ratio in China’s urban labor market (Chart 19). Chart 18Wage Gap Between Urban And Rural Areas Is Disappearing
Wage Gap Between Urban And Rural Areas Is Disappearing
Wage Gap Between Urban And Rural Areas Is Disappearing
Chart 19Urban Labor Supply Can't Keep Up With Demand
Urban Labor Supply Can't Keep Up With Demand
Urban Labor Supply Can't Keep Up With Demand
The bright side is that China’s labor shortage and escalating wages have not eroded the competitiveness of its manufacturing sector. Impressive labor productivity gains and progressively improving labor quality have trumped higher input costs (Chart 20). Consistent with improved productivity, China’s share of global trade continues to build regardless of higher wages, a stronger currency, and import tariffs from the US (Chart 21). The manufacturing sector has gradually climbed the value-added chain in recent years and mounting wage pressures will likely push the corporate sector, particularly in more developed coastal regions, to move further away from a labor-intensive model. Chart 20Rising Wages But Stable Unit Labor Costs
Rising Wages But Stable Unit Labor Costs
Rising Wages But Stable Unit Labor Costs
Chart 21Chinese Exporters Have Maintained Their Global Market Share Despite Higher Costs
Chinese Exporters Have Maintained Their Global Market Share Despite Higher Costs
Chinese Exporters Have Maintained Their Global Market Share Despite Higher Costs
The 14th Five-Year Plan outlined policymakers’ decision to maintain the share of manufacturing in GDP, which is around 30%. Labor productivity in the manufacturing sector is notably higher than in the service sector. In an environment of shrinking labor, keeping workers in a high-productivity sector may be a better way to stabilize potential growth. Bottom Line: The competition for labor between sectors will intensify. Meanwhile, manufacturing’s share of China’s economy will likely be sustained in this decade, which will help to mitigate the speed of the deceleration in China’s growth. Implications On Policy Setting Chart 22AInterest Rates Drop With Aging Population
Interest Rates Drop With Aging Population
Interest Rates Drop With Aging Population
The combination of a weak fertility/birthrate and a decline in the working-age population will weigh on consumption and investment growth, bringing deflationary headwinds to the economy. China’s interest rate regime will likely follow its Asian neighbors to downshift structurally (Chart 22). Despite moderating potential economic growth, a low interest rate environment may be positive for China’s financial asset prices. Chart 22BInterest Rates Drop With Aging Population
Interest Rates Drop With Aging Population
Interest Rates Drop With Aging Population
Chart 22CInterest Rates Drop With Aging Population
Interest Rates Drop With Aging Population
Interest Rates Drop With Aging Population
Chart 23Support Ratios Are Declining Globally
Support Ratios Are Declining Globally
Support Ratios Are Declining Globally
One could argue that a falling support ratio – measured by the number of workers relative to consumers – can lead to inflation (Chart 23). This could happen to the US where baby boomers retire but continue to spend particularly on healthcare, while production falls along with the available workers. As production falls in relation to consumption, inflation could rise. However, this is not the case in China where both production and consumption will fall. Demand from an aging population may increase pockets of inflationary pressures, such as healthcare and elderly care, but it is unlikely to fully offset weakening demand from a declining working-age population and total population. In other words, both the numerator (workers) and denominator (consumers) will be falling in China. While a weakening demographic profile is negative for economic growth, lower prices on capital will make corporate debt-servicing cheaper. Further industrial consolidation aimed at supply-side reforms will also improve corporate profitability. Cheaper capital, improving productivity and efficiency could provide tailwinds to Chinese stocks and government bonds in the long run. Jing Sima China Strategist jings@bcaresearch.com Footnotes 1As of 2020, China’s total population is at 1411.78 million. 2"China faces an economic crisis as a population peak nears," South China Morning Post, April 18, 2021. 3The total fertility rate is based on the number of newborns by women in child-bearing years, which is ages 15-44 or 15-49 by international statistical standards. Cyclical Investment Stance Equity Sector Recommendations
Highlights The number one risk to our upbeat view on European economic activity and assets is a Chinese economic slowdown. The second most important risk to our view is a potential deterioration in the global credit impulse, even outside of China. The third major risk is that the current bout of US inflation proves to be permanent, which, paradoxically, would prompt a deflationary shock for the global economy. Despite these risks, we maintain our favorable view on European assets over the coming 12 to 18 months. However, favoring industrials over materials, and financials over other cyclicals, Swedish equities and peripheral bonds in balanced portfolios mitigate some of these risks. Do not expect the ECB to announce a tapering of its asset purchases at the June meeting. The ECB will lag well behind the Fed and the BoE. Buy European steepeners and US flatteners as a box trade. Feature Over the past three weeks, a sustained marketing push gave us the opportunity to interact intensively with a large subset of our clients (albeit virtually, courtesy of COVID-19). Generally, our positive stance on European assets was well received, but investors are loosely committing themselves to this view and very few are willing to make an aggressive bet on Europe. In fact, in most meetings, we spent more time than usual discussing the risks to our upbeat view on Europe and European cyclical equities. Three risks to our 12- to 18-month view standout. The first is a serious slowdown in Chinese growth. The second is a greater-than-anticipated impact on economic activity as a result of a deterioration in DM credit impulses. The third is stronger-than-expected US inflation. An also-ran was the risk that the current vaccines do not protect against the two variants of the COVID-19 virus dominant in India. However, an increasing body of recent scientific studies demonstrates that this is not the case; hence, this risk has been lowered to minor. Risk #1: A Chinese Slowdown Authorities in China have been constricting credit policy over the past six months. The key tools used have been a regulatory tightening in shadow-banking activities and real estate transactions, moral suasion on small banks to limit the expansion of their loan books, and slowing liquidity injections in the interbank system. Beijing’s policy tightening reflects the following two worries. First, the financial stability risk has increased meaningfully over the past 16 months. China’s corporate debt-to-GDP has increased 13 points to 163%, and is among the highest for major economies (Chart 1). Moreover, Chinese policymakers remain concerned by the middle-income trap, which would become an increasingly likely outcome if the stability of the country’s financial and banking system were compromised. Second, the latest round of stimulus has worsened wealth inequalities. House prices have been robust, yet household disposable income growth is still low by the yardstick of the past 40 years (Chart 2). Thus, a large proportion of China’s population has experienced a decline in housing affordability. Chart 1China"s Financial Stabilitiy Risk
China"s Financial Stabilitiy Risk
China"s Financial Stabilitiy Risk
Chart 2Chinese Households Are Not Doing That Well
Chinese Households Are Not Doing That Well
Chinese Households Are Not Doing That Well
The Chinese economy recently started to feel the impact of the policy tightening. China’s April retail sales data missed expectation by 7.2%, and, as our China Investment Strategy colleagues have observed, the demand side of the economy has lagged behind the recovery in supply ever since China re-opened last year. Credit trends confirm this assessment. The decline in the excess reserve ratio of the Chinese banking system is consistent with the recent deterioration in the credit impulse, which accelerated in April (Chart 3). Since the Great Financial Crisis, weaker Chinese credit flows herald softer global industrial activity and trade (Chart 3, bottom panel). The Chinese slowdown could become a major problem for the European economy and its asset markets. As we recently showed, the sensitivity of European economic activity to global growth has been steadily increasing over the past 20 years (Chart 4). Moreover, the spread between M1 and M2 money supply growth in China best explains the gap between European industrial activity and that of the US (Chart 4, middle and bottom panels). Essentially, M1 minus M2 approximates the Chinese private sector’s marginal propensity to consume, because it captures how fast demand deposits are growing relative to savings deposits. Thus, the recent decline in China’s marginal propensity to consume constitutes a bad omen for European activity and profit growth, both in absolute terms and relative to the US. Chart 3A Policy-Induced Slowdown
A Policy-Induced Slowdown
A Policy-Induced Slowdown
Chart 4Europe Is More Exposed Than The US
Europe Is More Exposed Than The US
Europe Is More Exposed Than The US
The slowdown in China’s economy will hurt European asset prices via multiple channels. Importantly, cyclical stocks are expensive and overbought compared to defensive ones. A meaningful decline in Chinese growth could result in a deep fall in the cyclicals-to-defensives ratio, which would hurt the pro-cyclical EUR/USD exchange rate (Chart 5). A weaker China might also create a significant fall in global yields, because it would hurt global growth, accentuate deflationary forces, and upset investor sentiment. European stocks underperform US equities when global yields decline (Chart 6). Chart 5The Euro Is Pro-Cyclical
The Euro Is Pro-Cyclical
The Euro Is Pro-Cyclical
Chart 6A Key Threat To European Stocks
A Key Threat To European Stocks
A Key Threat To European Stocks
Despite the dire impact that a Chinese economic slowdown normally causes on European growth and assets, this outcome remains a risk and not a base case (albeit, the top risk in our view). First, today is one of the rare occasions when global and European economic activity can decouple from China. The Euro Area’s vaccination campaign is gaining steam, which will allow a re-opening of the economy this summer (Chart 7). The vast pent-up demand in durable goods evident in Europe and the positive impact of the European monetary expansion on the contribution of consumer expenditure to real GDP growth also create powerful offsets (Chart 8). Chart 8European Pent-Up Demand As An Offset
European Pent-Up Demand As An Offset
European Pent-Up Demand As An Offset
Chart 7Improving Vaccine Rollout
Improving Vaccine Rollout
Improving Vaccine Rollout
The global industrial cycle is more buffered than usual against a Chinese economic slowdown. The collapse in the inventory-to-sales ratios around the world will fuel several quarters of restocking, which will boost the global manufacturing sector (Chart 9). Moreover, governments across advanced economies are unleashing large-scale infrastructure plans, such as the $2 trillion bill proposed by the Biden administration in the US or the EUR250 billion budget proposal by the Draghi government in Italy. As the EUR750 billion NGEU funds are disbursed, the tailwind to infrastructure spending will only grow (Chart 10). Additionally, the current spurt in inflation around the world is a relative price shock driven by scarcity created during the pandemic. This price shock incentivizes companies to expand production and capacity to meet demand. As a result, global capex intentions are rising, which will create an additional offset to China. Chart 9Restocking Ahead
Restocking Ahead
Restocking Ahead
Chart 10More Fiscal Support This Way Comes
More Fiscal Support This Way Comes
More Fiscal Support This Way Comes
Finally, constraints on Chinese policymakers limit to how far Chinese growth will decelerate. The Chinese Communist Party Congress, in which the make-up of the politburo is determined for the next five years, takes place in October 2022. However, the weak growth rate of household disposable income creates a headache for China’s leadership. While another round of massive stimulus is unlikely to shore up household disposable income (it has not worked thus far), Beijing will not take the chance to generate another deflationary shock. This constraint creates a natural floor under the growth deceleration that Beijing can tolerate. Thus, while a policy mistake is still possible, it is not our base case scenario. Investment Implication Faced with the aforementioned dynamics, BCA recommends that investors with a short-term investment horizon go neutral on cyclical equities relative to defensive ones. Practically, this means that EUR/USD is likely to continue to churn between 1.18 and 1.235 for the coming two to three months. Additionally, European equities are likely to move sideways relative to their US counterparts over this period. Within cyclical equities, we favor industrials over materials. Commodity prices, and thus the materials sector, are the most exposed to China. Meanwhile, the outlook for infrastructure spending and capex in DM economies has a greater impact on industrial stocks than on materials ones. Technically, industrials remain toward the bottom of their upward-slopping trend channel relative to materials, which suggests further catch up is likely (Chart 11). We also favor European financials over the rest of the cyclical sectors. The negative impact of a greater-than-expected Chinese economic slowdown on global yields will hurt financials. Nonetheless, domestic economic activity affects financials more than it influences the more internationally focused industrials and materials sectors. Thus, if the Eurozone service PMI can slingshot higher, a result of the re-opening of the economy this summer, then European financials will outperform industrials and materials stocks even if the Chinese economy slows (Chart 12). Moreover, financials trade at a large discount compared to these other two cyclical sectors (Chart 12). Chart 11Overweight Industrials Vs Materials
Overweight Industrials Vs Materials
Overweight Industrials Vs Materials
Chart 12Financials As A Protection Against China
Financials As A Protection Against China
Financials As A Protection Against China
Finally, we continue to favor Swedish equities. Industrials and financials account for 65% of the Swedish MSCI benchmark compared to 30% for that of the Euro Area. Therefore, they are particularly exposed to the positive outlook on global infrastructure spending and capex. Moreover, Swedish equities generate a return on equity of 15%, compared to 6% for the Eurozone stocks. To protect against the risk created by a weakening Chinese economy, we recommend investors hedge a long / overweight bet on Sweden with a short / underweight position in Norwegian equities that massively over-represent energy and materials. Risk #2: A Global Credit Impulse Deterioration According to the BIS data, the global credit impulse is on the verge of deteriorating, even outside of China. The G10 plus China annual credit impulse is elevated and peaking (Chart 13, left). Meanwhile, quarterly credit impulses in the US, the Euro Area, and China are negative (Chart 13, right), which often leads to turning points in the annual change in credit flows. Chart 13A Global Credit Impulse Problem
A Global Credit Impulse Problem (I)
A Global Credit Impulse Problem (I)
Chart 13A Global Credit Impulse Problem
A Global Credit Impulse Problem (I)
A Global Credit Impulse Problem (I)
A deterioration in the credit impulse could result in a sharp slowdown in global economic growth, because the deceleration in credit creation is broad-based among the major economies. If global growth decelerates, then European economic activity will also suffer. Table 1Essential Sector Breakdowns
Risks
Risks
The impact on European financial markets will come from lower yields. A growth deceleration prompted by a falling credit impulse will put downward pressure on yields and will hurt the performance of value stocks relative to growth equities. Cyclical equities will also underperform defensive ones. In this scenario, European stocks will lag behind their US counterparts because of their relative sectoral biases (Table 1). Within the European benchmark, Tech-heavy Dutch stocks would perform best once yields begin to decline. The effect on growth of the slowing credit impulse remains a risk and not a base case scenario. Last year’s surge in credit intake mostly reflected precautionary demand. Companies around the world tapped their credit lines or the capital markets early in the crisis to build liquidity buffers. They then continued to borrow to take advantage of the exceptionally low interest rates that prevailed throughout most of the year. Similarly, a large proportion of household borrowing amounted to debt refinancing. As a result, last year’s explosion in credit growth had a limited impact on spending. Thus, the credit impulse’s decline in advanced economies should minimally hurt aggregate demand in the coming months. Investment Implication Investors can protect against this risk by overweighting Italian and Spanish bonds in a balanced portfolio. First, these instruments continue to offer better value than other government bonds around the world. Moreover, if global growth turns out to be weaker than expected, the ECB might have to increase the envelope of the PEPP program, which has greatly benefited peripheral bonds. Moreover, the NGEU and REACT EU program buttress weaker European sovereign borrowers. Therefore, yield-hungry global investors will resume their aggressive purchase of the high-yielding peripheral bonds if global interest rates decline anew because of softening economic activity. Risk #3: Stronger Than Expected US Inflation BCA’s house view is that the current surge in global and US inflation is transitory, even if the pressures could last a few months before ebbing. It is mainly a consequence of inadequate aggregate supply in the face of a sudden surge in demand. We cannot be dogmatic about the inflation risk. The price-components of all the major activity surveys in the world are rising, and, in the US, the inflation expectations of households have risen meaningfully (Chart 14). If an inflation mentality were to take root, then core CPI would not decelerate toward yearend. Stronger-than-expected US core CPI would put significant upward pressure on Treasury yields. First, long-dated inflation expectations could begin to converge to the breakeven rates in the shorter tenors of the curve (Chart 15). More importantly, the Fed would become more hawkish sooner. This faster policy tightening would lift the OIS curve and result in higher real yields as well. Chart 14Are Inflation Expectations Becoming Unmoored?
Are Inflation Expectations Becoming Unmoored?
Are Inflation Expectations Becoming Unmoored?
Chart 15Long-Dated Market-Based Inflation Expectations Still Lag
Long-Dated Market-Based Inflation Expectations Still Lag
Long-Dated Market-Based Inflation Expectations Still Lag
The euro would therefore weaken, and the dollar would rally across the board. European inflationary pressures are limited compared to those of the US. The Eurozone suffers from a larger output gap due to the lagging nature of the European recovery, which more timid fiscal stimulus and Europe’s late start to the vaccination campaign compounded. Consequently, the ECB will not match the Fed’s faster tightening of policy, even in this scenario. Higher US TIPS yields and a stronger dollar would ultimately be deflationary blows to global growth. The dollar would directly tighten EM financial conditions. Higher real yields would destabilize stretched equity prices around the world. The resulting shock to global financial conditions would cause a major slowdown in global growth to occur much earlier than we currently foresee. While yields would rise at first, they would end 2022 at much lower levels than we currently expect because of this deflationary outcome. This combination would be very harmful to European equities, both in absolute terms and relative to the global benchmark. At first, European stocks would probably briefly fare well. Once investors begin to digest the deleterious impact of stronger inflation on global growth, however, the pro-cyclical European market will begin to suffer. Tighter EM financial conditions and underperforming financials will only accentuate the European stock market ills. Much stronger inflation is a risk and not a base case for now, because the current bout of inflation is transitory. The supply-side of the economy is already responding to the signal created by higher prices. Firms are set to increase their inventories and capex intentions are moving higher. Moreover, many of the bottlenecks constraining global supply chains will loosen, as the global economy re-opens in response to the international vaccination campaign. Additionally, current labor shortages in low-wage industry will also dissipate, once the $300 weekly support by the US government ends after the month of September. Thus, the supply of labor will also pick up in the fourth quarter of 2021. Moreover, the Fed could remain tolerant of an inflation overshoot, which would limit the pain of its impact. That being said, there is a real inflation risk due to the global deterioration in the dependency ratio and the shift to the left in terms of the economic preferences of the median voter. However, this danger is backdated to 2024 and beyond, once global labor markets are closer to full employment. Investment Implication There is little protection in our current set of recommendations against this risk, but this is a smaller threat than the previous two risks. However, when viewed alongside the first and second set of risks, the combined probability of a dangerous outcome for the market in general and for Europe in particular has grown compared to six months ago. Thus, while the jury is still out on these questions, it makes sense to de-risk portfolios temporarily, until the reward-to-risk ratio has once again improved. Hence, a tactical neutral stance on cyclical relative to defensive equities and on Europe relative to the rest of the world is appropriate for now. Will The ECB Join The BoC? At its April meeting, the Bank of Canada jolted the market by announcing a much earlier-than-anticipated start to its tapering program. We do not believe that the ECB will follow up at its June meeting. In a recent report, BCA’s Global Fixed-Income Strategy team highlighted the constraint that will prevent the ECB from adjusting policy next month. The main factors are as follows: The results from the ECB’s strategic review have yet to be announced. Adjusting policy before an eventual change in the inflation mandate of the central banks creates an unnecessary risk of policy whipsaw. Yet another policy flip-flop would further mar the ECB’s credibility. Chart 16The ECB Does Not Want To Upend Credit Growth
The ECB Does Not Want To Upend Credit Growth
The ECB Does Not Want To Upend Credit Growth
Loan growth in Europe is slowing down, led by France. However, Italian credit activity is improving in response to the generous TLTRO uptake in the southern economy (Chart 16). At this juncture, a rapid policy adjustment would threaten the recovery, while Europe has yet to re-open. Italian spreads remain fragile. The ECB’s asset purchases are an important contributor to the easing in financial conditions across the periphery. The recent 25bps widening in the BTP-Bund spread is a reminder that European fixed-income markets are not fully tension-free. Thus, a rapid removal of support could prompt a reflex selloff in Italian bonds. The subsequent tightening in financial conditions would unnecessarily feed deflationary pressures in Europe. The euro is strong. If the ECB unsettled the market and removed monetary accommodation as fast or even faster than the Fed, the euro’s rally would suddenly accelerate. This would generate a powerful deflationary shock for Europe that would force the ECB to adjust its inflation forecasts downward. Chart 17Especially When China Creates A Threat
Especially When China Creates A Threat
Especially When China Creates A Threat
The Chinese economy is weak, which increases uncertainty around European economic outcome via the trade channel (Chart 17). Instead, the meetings in the back half of the year are much more likely candidates for the ECB to begin talking about its tapering program. By then, the European economic re-opening will have taken place, to which growth will have responded. The results of the ECB’s strategic reviews will have been announced. Finally, plans will have been ratified for the usage of NGEU funds across the EU, and thus, fiscal clarity will improve. Even if the ECB starts talking before yearend of terminating the PEPP, its communications will indicate that the program’s full envelope will be deployed within the original time frame. Thus, the PEPP program will be in place until the end of March 2022. Moreover, to prevent a rapid deterioration in bank credit, the ECB will continue to provide generous financing to deposit-taking institutions via the TLTRO program. Under these circumstances, the ECB is unlikely to increase its deposit rate before 2014. These views imply that the ECB policy tightening (both on the balance sheet and interest rate fronts) will lag behind that of the Fed, the BoE, the Norges Bank, and the Riksbank. Only the BoJ and the SNB will move after the ECB. The continued involvement of the ECB in the European fixed-income market, along with the elevated likelihood that we remain years away from the first rate hike, confirms that an overweight stance in European peripheral bonds is appropriate. We also continue to overweight corporate credit within European fixed-income portfolios. Our fixed-income colleagues also share these views. Chart 18Justifying A Box Trade
Justifying A Box Trade
Justifying A Box Trade
Finally, the German yield curve should steepen compared to that of the US. Even if the ECB lags well behind the Fed when it comes to tightening policy, the current terminal rate proxy embedded in the EONIA curve is too low (Chart 18). Meanwhile, the earlier lift-off date for interest rates in the US relative to the Euro Area points to rising short rates west of the Atlantic. In this context, a box trade buying steepeners in Europe and flatteners in the US is appropriate, especially since it generates a positive carry of 167 bps (hedged into USD). Mathieu Savary, Chief European Investment Strategist Mathieu@bcaresearch.com Cyclical Recommendations Structural Recommendations Currency Performance
Risks
Risks
Fixed Income Performance Government Bonds
Risks
Risks
Corporate Bonds
Risks
Risks
Equity Performance Major Stock Indices
Risks
Risks
Geographic Performance
Risks
Risks
Sector Performance
Risks
Risks
Closed Trades
Highlights Global oil markets will remain balanced this year with OPEC 2.0's production-management strategy geared toward maintaining the level of supply just below demand. This will keep inventories on a downward trajectory, despite short-term upticks due to COVID-19-induced demand hits in EM economies and marginal supply additions from Iran and Libya over the near term. Our 2021 oil demand growth is lower – ~ 5.3mm b/d y/y, down ~ 800k from last month's estimate – given persistent weakness in realized consumption. We have lifted our demand expectation for 2022 and 2023, however, expecting wider global vaccine distribution and increased travel toward year-end. The next few months are critical for OPEC 2.0: The trajectory for EM demand recovery will remain uncertain until vaccines are more widely distributed, and supply from Iran and Libya likely will increase this year. This will lead to a slight bump in inventories this year, incentivizing KSA and Russia to maintain the status quo on the supply side. We are raising our 2021 Brent forecast back to $63/bbl from $60/bbl, and lifting our 2022 and 2023 forecasts to $75 and $78/bbl, respectively, given our expectation for a wider global recovery (Chart of the Week). Feature A number of evolving fundamental factors on both sides of the oil market – i.e., lingering uncertainty over the return of Iranian and Libyan exports and the strength of the global demand recovery – will test what we believe to be OPEC 2.0's production-management strategy in the next few months. Briefly, our maintained hypothesis views OPEC 2.0 as the dominant supplier in the global oil market. This is due to the low-cost production of its core members (i.e., those states able to attract capital and grow production), and its overwhelming advantage in spare capacity, which we reckon will average in excess of 7mm b/d this year, owing to the massive production cuts undertaken to drain inventories during the COVID-19 pandemic. Formidable storage assets globally – positioned in or near refining centers – and well-developed transportation infrastructures also support this position. We estimate core OPEC 2.0 production will average 26.58mm b/d this year and 29.43mm b/d in 2022 (Chart 2). Chart of the WeekBrent Prices Likely Correct Then Move Higher in 2022-23
Brent Prices Likely Correct Then Move Higher in 2022-23
Brent Prices Likely Correct Then Move Higher in 2022-23
Chart 2OPEC 2.0 Will Maintain Status Quo
OPEC 2.0 Will Maintain Status Quo
OPEC 2.0 Will Maintain Status Quo
The putative leaders of the OPEC 2.0 coalition – the Kingdom of Saudi Arabia (KSA) and Russia – have distinctly different goals. KSA's preference is for higher prices – ~ $70-$75/bbl (basis Brent) to the end of 2022. Higher prices are needed to fund the Kingdom's diversification away from oil. Russia's goal is to keep prices closer to the marginal cost of the US shale-oil producers, who we characterize as the exemplar of the price-taking cohort outside OPEC 2.0, which produces whatever the market allows. This range is ~ $50-$55/bbl. The sweet spot that accommodates these divergent goals is on either side of $65/bbl for this year. OPEC 2.0 June 1 Meeting Will Maintain Status Quo With Brent trading close to $70/bbl, discussions in the run-up to OPEC 2.0's June 1 meeting likely are focused on the necessity to increase the 2.1mm b/d being returned to the market over the May-July period. At present, we do not believe this will be necessary: Iran likely will be returning to the market beginning in 3Q21, and will top up its production from ~ 2.4mm b/d in April to ~ 3.85mm b/d by year-end, in our estimation. Any volumes returned to the market by core OPEC 2.0 in excess of what's already been agreed going into the June 1 meeting likely will come out of storage on an as-needed basis. Libya will likely lift its current production of ~ 1.3mm b/d close to 1.5mm b/d by year end as well. We are expecting the price-taking cohort ex-OPEC 2.0 to increase production from 53.78mm b/d in April to 53.86mm b/d in December, led by a 860k b/d increase in US output, which will take average Lower 48 output in the US (ex-GOM) to 9.15mm b/d by the end of this year (Chart 3). When we model shale output, our expectation is driven by the level of prompt WTI prices and the shape of the forward curve. The backwardation in the WTI forward curve will limit hedged revenues at the margin, which will limit the volume growth of the marginal producer. We expect global production to slowly increase next year, and the year after that, with supply averaging 101.07mm b/d in 2022 and 103mm b/d in 2023. Chart 3US Crude Output Recovers, Then Tapers in 2023
US Crude Output Recovers, Then Tapers in 2023
US Crude Output Recovers, Then Tapers in 2023
Demand Should Lift, But Uncertainties Persist We expect the slowdown in realized DM demand to reverse in 2H21, and for oil demand to continue to recover in 2H21 as the US and EU re-open and travel picks up. This can be seen in our expectation for DM demand, which we proxy with OECD oil consumption (Chart 4). EM demand – proxied by non-OECD oil consumption – is expected to revive over 2022-23 as vaccine distribution globally picks up. As a result, demand growth shifts to EM, while DM levels off. China's refinery throughput in April came within 100k b/d of the record 14.2mm b/d posted in November 2020 (Chart 5). The marginal draw in April stockpiles could also signify that as crude prices have risen higher, the world’s largest oil importer may have hit the brakes on bringing oil in. In the chart, oil stored or drawn is calculated as the difference between what is imported and produced with what is processed in refineries. With refinery maintenance in high gear until the end of this month, we expect product-stock draws to remain strong on the back of domestic and export demand. This will draw inventories while maintenance continues. Chart 4EM Demand Will Recovery Accelerates in 2022-23
EM Demand Will Recovery Accelerates in 2022-23
EM Demand Will Recovery Accelerates in 2022-23
Chart 8China Refinery Runs Remain Strong
China Refinery Runs Remain Strong
China Refinery Runs Remain Strong
COVID-19-induced demand destruction remains a persistent risk, particularly in India, Brazil and Japan. This is visible in the continued shortfall in realized demand vs our expectation so far this year. We lowered our 2021 oil demand growth estimate to ~ 5.3mm b/d y/y, which is down ~ 800k from last month's estimate, given persistent weakness in realized consumption. Our demand forecast for 2022 and 2023 is higher, however, based on our expectation for stronger GDP growth in EM economies, following the DM's outperformance this year, on the back of wider global vaccine distribution year-end (Table 1). Table 1BCA Global Oil Supply - Demand Balances (MMb/d, Base Case Balances)
OPEC 2.0's Production Strategy In Focus
OPEC 2.0's Production Strategy In Focus
Our supply-demand estimates continue to point to a balanced market this year and into 2022-23 (Chart 6). Given our expectation OPEC 2.0's production-management strategy will remain effective, we expect inventories to continue to draw (Chart 7). Chart 6Markets Remained Balanced
Markets Remained Balanced
Markets Remained Balanced
Chart 7Inventories Continue To Draw
Inventories Continue To Draw
Inventories Continue To Draw
CAPEX Cuts Bite In 2023 In 2023, we are expecting Brent to end the year closer to $80/bbl than not, which will put prices outside the current range we believe OPEC 2.0 is managing its production around (Chart 8). We have noted in the past continued weakness in capex over the 2015-2022 period threatens to leave the global market exposed to higher prices (Chart 9). Over time, a reluctance to invest in oil and gas exploration and production prices in 2024 and beyond could begin to take off as demand – which does not have to grow more than 1% p.a. – continues to expand and supply remains flat or declines. Chart 8By 2023 Brent Trades to /bbl
By 2023 Brent Trades to $80/bbl
By 2023 Brent Trades to $80/bbl
Chart 9Low Capex Likely Results In Higher Prices After 2023
OPEC 2.0's Production Strategy In Focus
OPEC 2.0's Production Strategy In Focus
Bottom Line: We are raising our 2021 forecast back to an average of $63/bbl, and our forecasts for 2022 and 2023 to $75 and $78/bbl. We expect DM demand to lead the recovery this year, and for EM to take over next year, and resume its role as the growth engine for oil demand. Longer term, parsimonious capex allocations likely result in tighter supply meeting slowly growing demand. At present, markets appear to be placing a large bet on the buildout of renewable electricity generation and electric vehicles (EVs). If this does not occur along the trajectory of rapid expansion apparently being priced by markets – i.e., the demand for oil continues to expand, however slowly – oil prices likely would push through $80/bbl in 2024 and beyond. Robert P. Ryan Chief Commodity & Energy Strategist rryan@bcaresearch.com Ashwin Shyam Research Associate Commodity & Energy Strategy ashwin.shyam@bcaresearch.com Commodities Round-Up Energy: Bullish The Colonial Pipeline outage pushed average retail gasoline prices in the US to $3.03/gal earlier this week, according to the EIA. This was the highest level for regular-grade gasoline in the US since 27 October 2014. According to reuters.com, the cyberattack that shut down the 5,500-mile pipeline was the most disruptive on record, shutting down thousands of retail service stations in the US southeast. Millions of barrels of refined products – gasoline, diesel and jet fuel – were unable to flow between the US Gulf and the NY Harbor because of the attack, which was launched 7 May 2021 (Chart 10). While most of the system is up and running, problems with the pipeline's scheduling system earlier this week prevented a return to full operation. Base Metals: Bullish Spot copper prices remained on either side of $4.55/lb (~ $10,000/MT) by mid-week following a dip from the $4.80/lb level (Chart 11). We remain bullish copper, particularly as political risk in Chile rises going into a constitutional convention. According to press reports, the country's constitution will be re-written, a process that likely will pave the way for higher taxes and royalties on copper producers.1 In addition, unions in BHP mines rejected a proposed labor agreement, with close to 100% of members voting to strike. In Peru, a socialist presidential candidate is campaigning on a platform to raise taxes and royalties. Precious Metals: Bullish According to the World Platinum Investment Council, platinum is expected to run a deficit for the third consecutive year in 2021, which will amount to 158k oz, on the back of strong demand. Refined production is projected to increase this year, with South Africa driving this growth as mines return to full operational capacity after COVID-19 related shutdowns. Automotive demand is leading the charge in higher metal consumption, as car makers switch out more expensive palladium for platinum to make autocatalysts in internal-combustion vehicles. Ags/Softs: Neutral Corn prices continued to be better-offered following last week's WASDE report, which contained the department's first look at the 2021-22 crop year. Corn production is expected to be up close to 6% over the 2020-21 crop year, at just under 15 billion bushels. On the week, corn prices are down ~ 15.3%. Chart 10
RBOB Gasoline at a High
RBOB Gasoline at a High
Chart 11
Political Risk in Chile and Peru Could Bolster Copper Prices
Political Risk in Chile and Peru Could Bolster Copper Prices
Footnotes 1 Please see Copper price rises as Chile fuels long-term supply concerns published 18 May 2021 by mining.com. Investment Views and Themes Strategic Recommendations Tactical Trades Commodity Prices and Plays Reference Table Trades Closed in 2021 Summary of Closed Trades
Higher Inflation On The Way
Higher Inflation On The Way
Highlights Based on the cyclically adjusted P/E ratio, the MSCI Hong Kong equity index appears very cheap, both in absolute terms and relative to the EM index. We recommend investors upgrade their allocation to the MSCI Hong Kong equity index from underweight to neutral within Asian, global and EM equity portfolios. Due to composition changes over time, the MSCI Hong Kong equity index has become much more defensive, so it will outperform in risk-off phases. If the US dollar rallies, share prices of Hong Kong-domiciled companies will materially outperform in the emerging Asian and EM equity indexes and vice versa. Feature We have been underweighting Hong Kong SAR1 equities2 for some time but now recommend that Asian, global and EM equity portfolios raise their allocation for Hong Kong to neutral. External Macro Drivers Our global macro themes are currently a US economic boom and a slowing mainland economy –and both have negative ramifications for the absolute performance of the MSCI Hong Kong equity index which solely includes Hong Kong-domiciled companies and not the mainland issuers listed in Hong Kong. Due to Hong Kong’s dollar peg to the US dollar, Hong Kong imports US interest rates. Hence, an overheating US economy and rising US Treasury yields will lead to higher bond yields in Hong Kong. The latter is negative for this overleveraged economy. Besides, Hong Kong-domiciled companies are exposed to China’s growth cycles and swings in Chinese share prices. Hence, a slowdown in China is negative for Hong Kong stocks. Chart 1MSCI HK Index Is Defensive In Nature
Strategy For Hong Kong SAR Equities
Strategy For Hong Kong SAR Equities
Critically, even though both a decelerating Chinese economy and higher US bond yields are negative for the absolute performance of Hong Kong stocks, this index might outperform the emerging Asian and EM equity benchmarks in the coming months. The reason is that due to composition changes over time, the MSCI Hong Kong index has become much more defensive (please refer to Box 1 below). Chart 1 reveals that the MSCI Hong Kong index underperforms emerging Asian stocks when Chinese cyclical stocks outperform defensives and vice versa. Have there in recent years been moments when China’s business cycle slowdown coincided with a rise in US Treasury yields? We have identified only one such period – the September 2017-September 2018 – when Chinese growth was downshifting and US Treasury yields were rising (Chart 2, top panel). The bottom panel of Chart 2 illustrates that Hong Kong stocks marginally outperformed the emerging Asian index during this period. Further, Hong Kong relative share performance versus the emerging Asian equity benchmark correlates well with the US trade-weighted dollar (Chart 3). The basis is that Hong Kong’s currency appreciates versus emerging Asian ones in line with the greenback. Chart 2A Replay Of 2018?
Strategy For Hong Kong SAR Equities
Strategy For Hong Kong SAR Equities
Chart 3HK Stocks Outperform Their Asian Peers When The US Dollar Rallies
Strategy For Hong Kong SAR Equities
Strategy For Hong Kong SAR Equities
What is the US dollar outlook? Technically, the broad trade-weighted US dollar is walking on a tightrope. It has failed to break above its 200-day moving average, producing a bearish configuration. Yet, it has not yet broken below its recent lows (Chart 4). In a nutshell, the US currency is set to experience a major move in the coming months: it will either plunge or stage a noticeable rebound. Fundamentally, rising US bond yields and a deceleration in the Chinese economy are supportive of the US dollar. In the first three quarters of 2018 when US bond yields were rising and China’s growth was downshifting, the greenback rallied a great deal. A replay of those dynamics in some form will likely benefit the US dollar. Provided the US economy among major global economic regions is the least sensitive to China’s business cycle, the US dollar tends to appreciate when China’s growth weakens and vice versa (Chart 5). Asia, the rest of EM, the euro area and Japan sell to China much more than the US. Chart 4Broad Trade-Weighted US Dollar Is On The Last Defense Line
Strategy For Hong Kong SAR Equities
Strategy For Hong Kong SAR Equities
Chart 5Trade-Weighted Dollar Appreciates When China Slows
Strategy For Hong Kong SAR Equities
Strategy For Hong Kong SAR Equities
Although we continue to expect a rebound in the US dollar in line with our view of rising US bond yields and a budding slowdown in China in the coming months, our conviction level on the short-term outlook for the US dollar has recently diminished due to poor US dollar price actions. Consistent with this view, we recommend equity investors upgrade their allocation to Hong Kong equities from underweight to neutral but not to overweight within an Asian, global and EM portfolio. If the US dollar plunges, share prices of Hong Kong-domiciled companies will materially underperform the emerging Asian, global and EM equity indexes and vice versa. Box 1 Changed Composition Of Hong Kong Equity Market Don’t rising US, and therefore, Hong Kong bond yields pose a threat to Hong Kong’s economy and share prices? Historically, the Hong Kong equity market was more vulnerable to rising yields in the US than it is now. The basis was that Hong Kong’s private sector has been and remains very leveraged and the property market continues playing a crucial role in the economy and in the stock market. Hong Kong is still very leveraged with the private sector’s debt standing at 350% of GDP and its debt service ratio just passing 30%, among the highest globally. Nevertheless, the composition of the MSCI Hong Kong equity index has undergone dramatic shifts over the years: Table 1Composition Of MSCI HK Index Has Changed
Strategy For Hong Kong SAR Equities
Strategy For Hong Kong SAR Equities
The weight of banks and property stocks within the equity market cap of the MSCI Hong Kong index has fallen from 11% and 38% in 2010 to 6% and 19%, respectively (Table 1). On the contrary, insurance now accounts for 29% and diversified financials for 12% of the market cap of the MSCI Hong Kong Index. In particular, the insurance company AIA Group and Hong Kong Exchanges & Clearing (HKEX) stocks account for 27.5% and 13% of the MSCI Hong Kong equity index, respectively, amounting to 40% altogether. The insurance and diversified financials subsectors are less vulnerable to rising short-term interest rates compared to banks and property stocks. This is why investors should now put less weight on interest rate dynamics when gauging the outlook for Hong Kong equities. There is little value that macro analysis can offer with regards to these two stocks – AIA Group and HKEX. That said, macro analysis is still relevant for banks and property stocks that together currently account for a 25% of the MSCI Hong Kong stock index. Domestic Macro Drivers: Banks and Property Both the banking system and the real estate market are facing structural challenges. Nevertheless, share prices of banks and property developers trade at very low multiples. Their cyclically adjusted P/E ratio is well below its historic mean (Chart 6). Hence, much of the negative news is already factored into their stock prices. Bank profits have been dire as banks have seen falling loan growth, rising non-performing loans (NPLs), and a steep drop in their net interest rate margins (Chart 7). However, we think that much of the bad news has already been priced into the markets. Chart 6Hong Kong Bank And Property Stocks Are Cheap
Strategy For Hong Kong SAR Equities
Strategy For Hong Kong SAR Equities
Chart 7HK Banks: Poor Fundamentals
Strategy For Hong Kong SAR Equities
Strategy For Hong Kong SAR Equities
Chart 8Worsening Residential Property Affordability
Strategy For Hong Kong SAR Equities
Strategy For Hong Kong SAR Equities
Concerning property stocks, as the world’s least affordable housing market for the 11th year running, Hong Kong’s structural decline in housing affordability highlights the lingering income disparity in the financial hub (Chart 8). Low affordability will get much worse if the US Federal Reserve hikes interest rates. The basis is that mortgage rates in Hong Kong are determined by short-term rates, and are therefore closely tied to the Fed’s policy rate rather than US bond yields. Fortunately for Hong Kong, the Fed is not close to hiking interest rates even if US bond yields move higher. Chart 9Low Residential Vacancies
Strategy For Hong Kong SAR Equities
Strategy For Hong Kong SAR Equities
Meanwhile, housing supply in Hong Kong has been tight and will likely remain as such. Private residential vacancy rates are currently extremely low, driven by a tight supply in small and medium unit vacancies which make up 95% of private residential housing completions (Chart 9). Looking forward, based on the number of building permits issued at present, housing supply will see a moderate decline the next couple of years (Chart 10). Another point to note about Hong Kong’s property market is that in the past 12 months, it has probably gotten major support from mainland buyers. Chart 11 shows a recent divergence between residential mortgages and residential units sold. This discrepancy might be explained by increased cash purchases of Hong Kong properties by mainland buyers. It emphasizes mainland purchasers’ continued interest in Hong Kong housing despite high prices. Chart 10Housing Supply Will Continue To Underwhelm
Strategy For Hong Kong SAR Equities
Strategy For Hong Kong SAR Equities
Chart 11A Sign That Mainland Property Buyers Have Been Active In The Past 12 Months
Strategy For Hong Kong SAR Equities
Strategy For Hong Kong SAR Equities
All in all, the Hong Kong property market has probably passed its worst. Bottom Line: Hong Kong banks and the property market face structural challenges, but their share prices have already priced in a lot of bad news. As a result, this will preclude a major decline in their stock prices as Asian/Chinese stocks struggle. Long-Term Considerations Amid The New Political Reality Investors often ask what will happen to (1) Hong Kong’s currency peg and (2) the city’s role as a financial center after Beijing has increased its political control over the city. The currency peg: The Hong Kong and US economies are not an optimum common currency area. They are driven by different drivers and their business cycles do not need to be correlated. Hong Kong’s economy is much more integrated with the mainland economy. Therefore, in the long run, it makes more sense for it to peg its currency to the renminbi than the US dollar. As such, investors should expect the Hong Kong dollar peg to the US dollar to eventually be modified and, ultimately, the Hong Kong dollar will be pegged to the Chinese RMB. This will occur in phases. This is a political decision and it is unlikely to be implemented in the medium term (1-3 years) to avoid financial market upheavals. Also, this transition will be undertaken gradually based on a timetable announced well ahead of time. As long as the RMB remains attractive to global investors, changes to the Hong Kong currency peg can be done in an orderly manner. Devaluation pressures on the Hong Kong dollar will grow when the US dollar and the Chinese yuan come under major appreciation and depreciation pressures, respectively. These are not our baseline scenarios apart from an expected short-term rebound in the US dollar. The reason is the super lax monetary and fiscal policies that the US is pursuing will ensure that the greenback remains in a structural downtrend. In sum, the Hong Kong dollar’s peg will not be threatened for now. Financial center: There have been fears that the new political reality will lead Hong Kong to lose its status as a financial center. We believe such fears are misplaced. As long as China’s capital account controls remain in place, there will be a role for Hong Kong to play by serving as a financial center for the mainland. Odds of the complete removal of capital control in China are very low, even the long run. Investment Conclusions Chart 12HK Stocks Are Cheap In Both Absolute Terms And Relative To EM
Strategy For Hong Kong SAR Equities
Strategy For Hong Kong SAR Equities
Upgrade Hong Kong stocks from underweight to neutral within Asian, global and EM equity portfolios. Equity valuation of Hong Kong stocks are very cheap, both in absolute and relative to EM. The top panel of Chart 12 demonstrates that the cyclically adjusted P/E ratio for the MSCI Hong Kong index in absolute terms is below its mean. Relative to the EM equity index, Hong Kong’s cyclically adjusted P/E ratio is very low (Chart 12, bottom panel). BCA’s Emerging Markets Strategy team is closing its relative trade of being long Taiwanese banks/short Hong Kong banks with a -5.5% loss. Do not bet on the Hong Kong currency devaluation. Arthur Budaghyan Chief Emerging Markets Strategist arthurb@bcaresearch.com Vanessa Wong Ee Shan Research Associate vanessaw@bcaresearch.com Footnotes 1 Hong Kong Special Administrative Region. Hong Kong SAR is referred to herein as Hong Kong. 2Hong Kong equities refers to the MSCI Hong Kong equity index that consists of share prices of Hong Kong-domiciled companies and does not include Chinese stocks trading in Hong Kong.
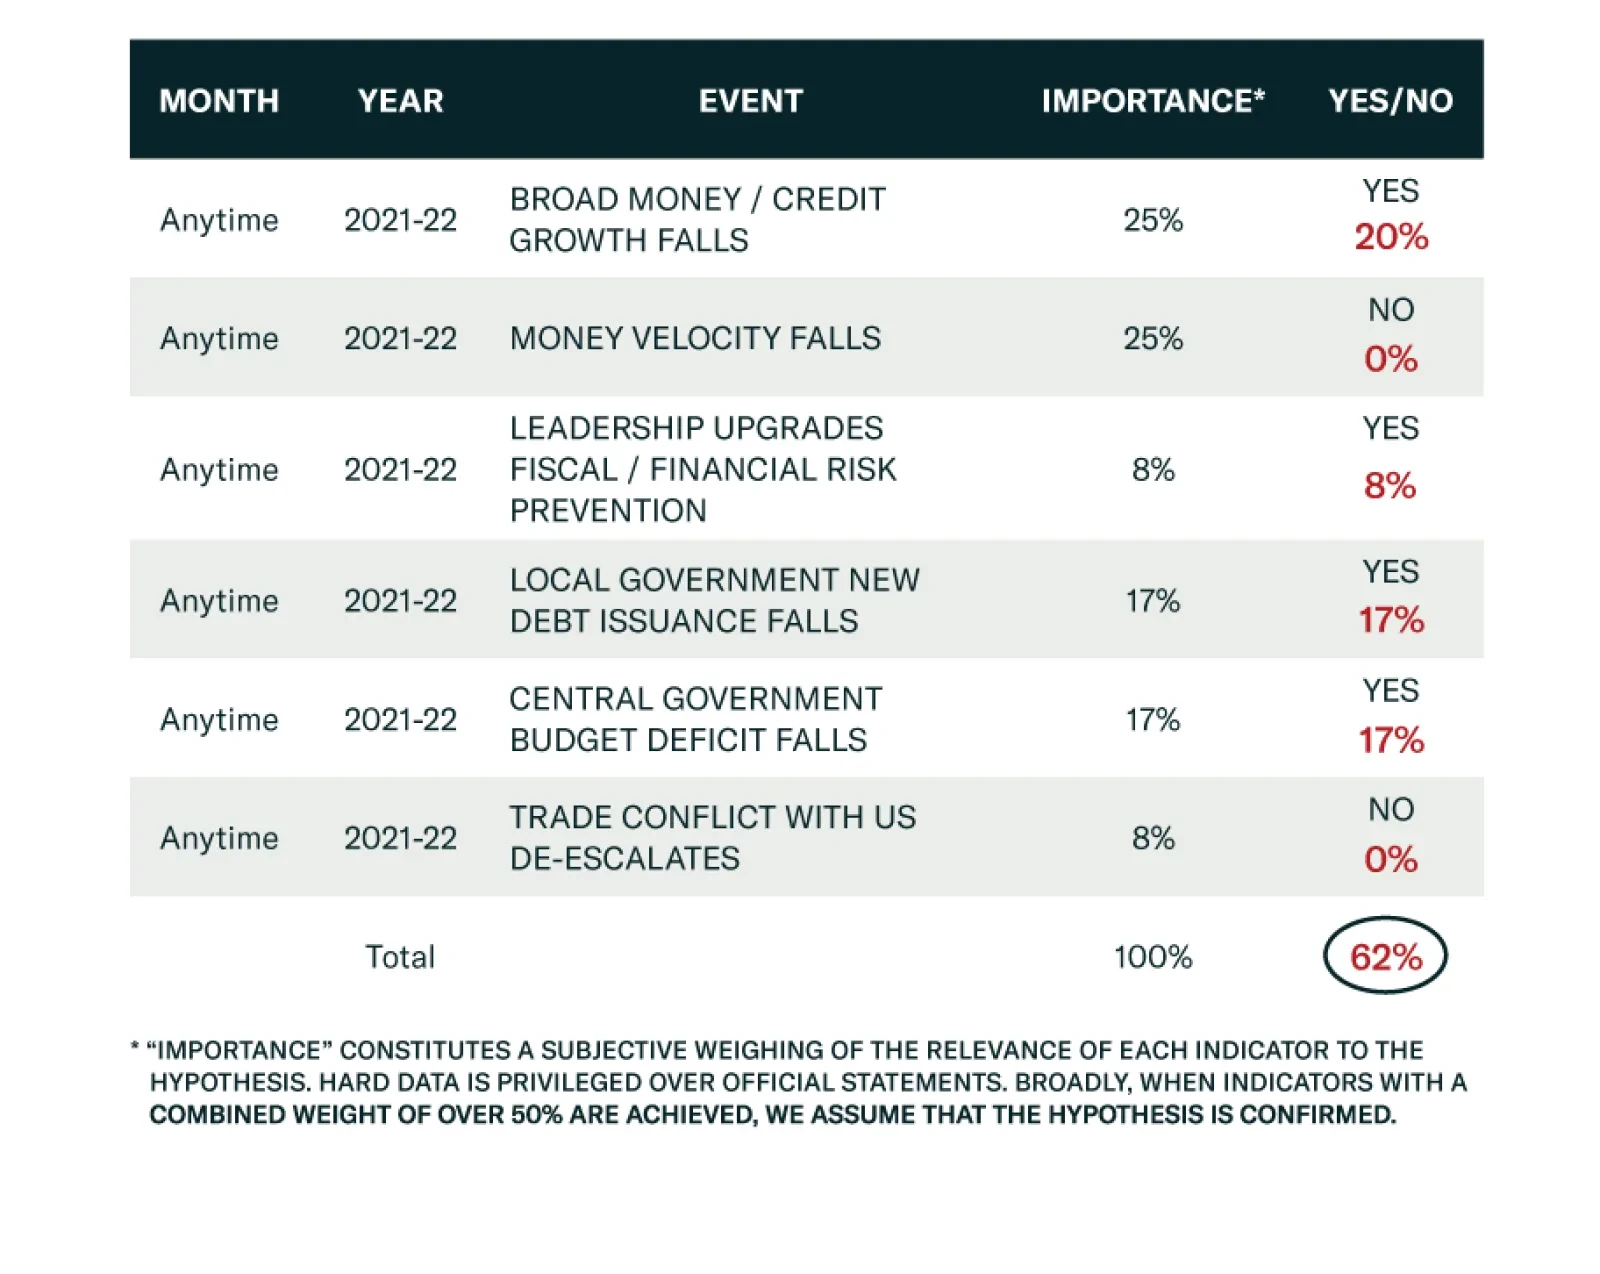
BCA Research’s Geopolitical Strategy service believes that global equities, commodities, and “China plays” are at risk of a substantial correction as a result of China’s policy tightening. China’s troubles stem from the ongoing change of its economic model…