China
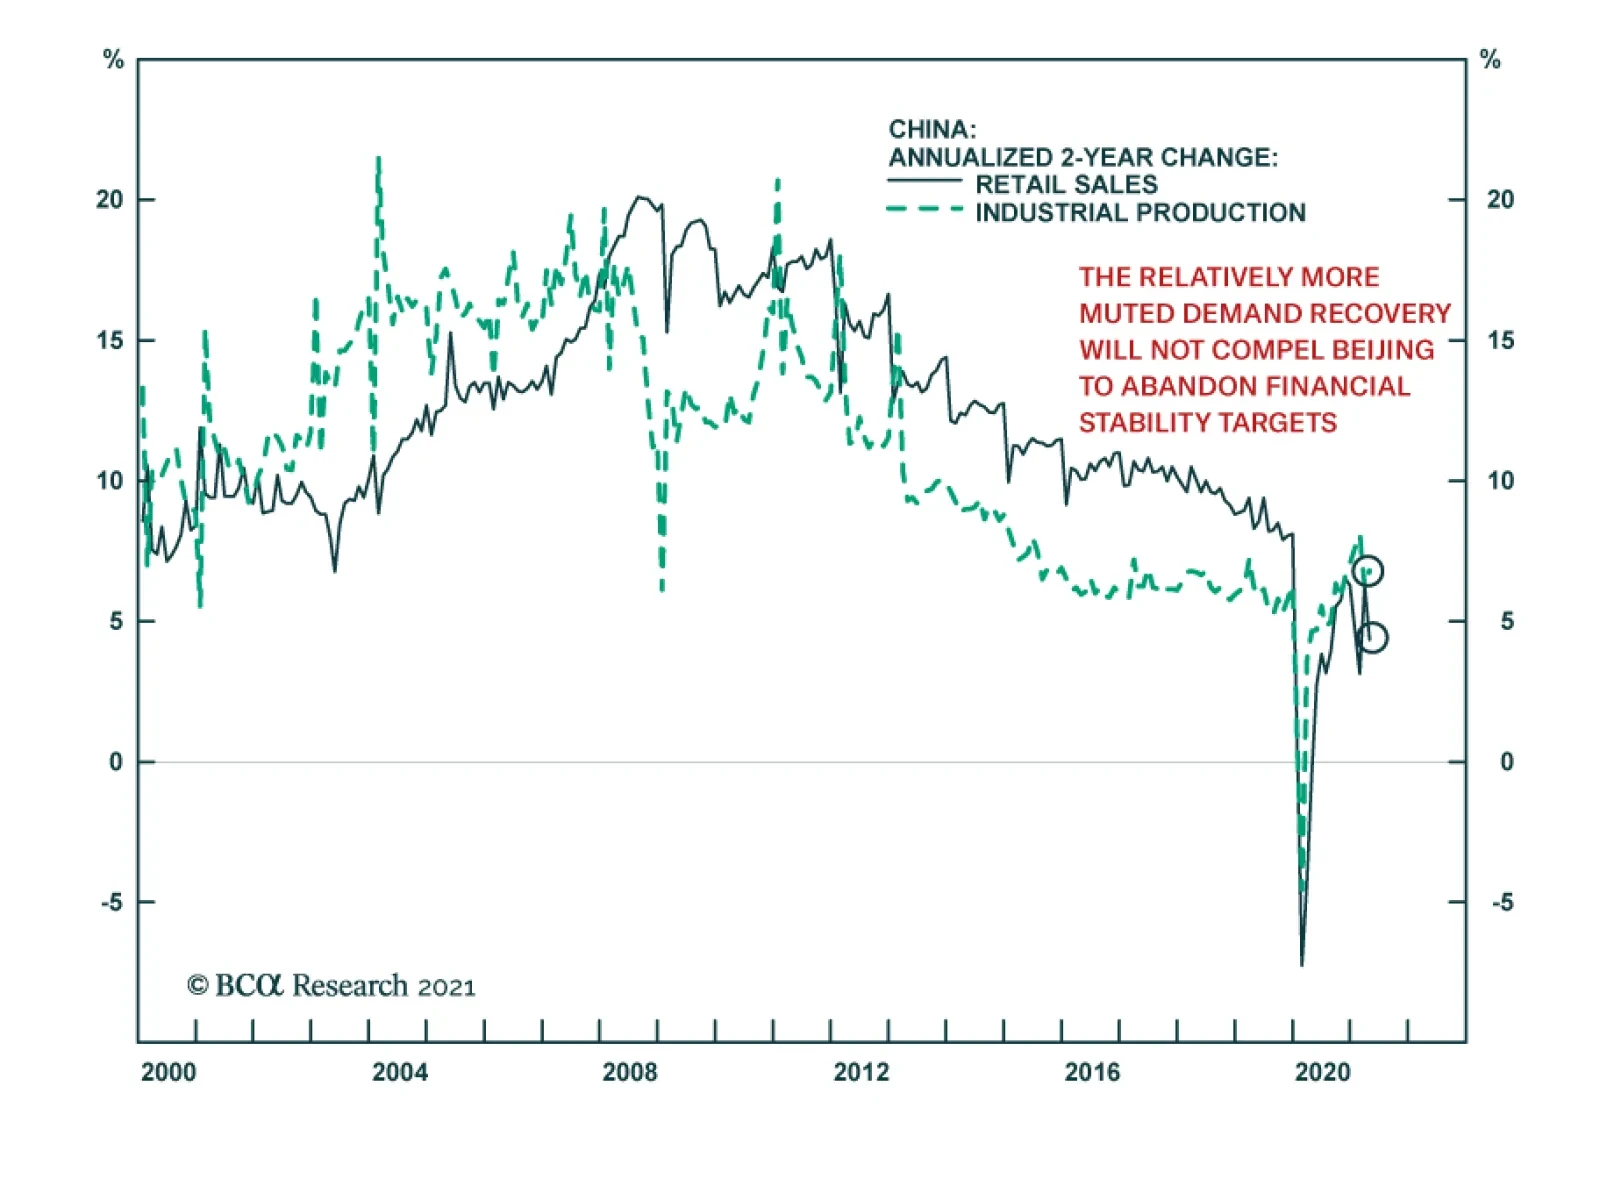
Investment and retail sales data confirm that consumer demand remains the weakest link in China’s economic recovery. While the data generally surprised to the downside, the disappointment was most pronounced in retail sales, which decelerated to 17.7% y/y…

Highlights Global stocks are very vulnerable to a correction. But cyclically the Fed is committed to an inflation overshoot and the global economy is recovering. China’s fiscal-and-credit impulse fell sharply, which leaves global cyclical stocks and commodities exposed to a pullback. Beyond the near term, China’s need for political stability should prevent excessive policy tightening. The risk is frontloaded. China’s population census underscores one of our mega-themes: China’s domestic politics are unstable and can bring negative surprises. India’s state elections, held amid a massive COVID-19 wave, suggest that the ruling party is still favored in 2024. This implies policy continuity. Stick with a bullish cyclical bias but be prepared to shift if China commits a policy mistake. Feature Chart 1Inflation Rears Its Head
Inflation Rears Its Head
Inflation Rears Its Head
Global markets shuddered this week in the face of a strong core inflation print in the US as well as broader fears as inflation rears its head after a long slumber (Chart 1). Cyclically we still expect investors to rotate away from US stocks into international stocks and for the US dollar to fall as the global economy recovers (Chart 2). However, this view also entails that emerging market stocks should start outperforming their developed market peers, which has not panned out so far this year. Emerging markets are not only technology-heavy and vulnerable to rising US bond yields but also further challenged now by China’s stimulus having peaked. Chart 2Equity Market Trembles
Equity Market Trembles
Equity Market Trembles
Chart 3Global Economy And Sentiment Recovering
Global Economy And Sentiment Recovering
Global Economy And Sentiment Recovering
Chart 4Global Cyclicals Versus Defensives Wavering
Global Cyclicals Versus Defensives Wavering
Global Cyclicals Versus Defensives Wavering
The one thing we can rely on is that the COVID-19 vaccine rollout will continue to enable a global growth recovery (Chart 3). The US dollar is signaling as much. The greenback bounced in the first quarter on US relative growth outperformance but it has since fallen back. A falling dollar is positive for cyclical stocks relative to defensives, although cyclicals are flagging that the reflation trade is overdone in the near term (Chart 4). China’s growth now becomes the critical focal point. A policy mistake in China would upset the bullish cyclical view. China’s tightening of monetary and fiscal policy is a major global policy risk that we have highlighted this year and it is now materializing. However, we have also highlighted the constraints to tightening. At present China is standing right on the threshold of overtightening according to our benchmarks. If China tightens further, we will take a fundamentally more defensive view. Also in this report we will review the results of China’s population census and the implications of India’s recent state elections in the face of the latest big wave of COVID-19 infections. We are not making any changes to our bullish view on India yet but we are putting it on watch. China: The Overtightening Risk China’s troubles stem from the ongoing change of its economic model from reliance on foreign trade to reliance on domestic demand. This was a strategic decision that the Communist Party made prior to the rise of President Xi Jinping. Xi also has come to embody it and reinforce it through his strategic vision and confrontation with the United States. Beijing’s goal was to manage a smooth and stable transition. The financial turmoil of 2015 and the trade war of 2018-19 jeopardized that goal but policymakers ultimately prevailed. Then COVID-19 broke out and caused the first real economic contraction since the 1970s. While China contained the virus and bounced back with another massive round of stimulus (13.8% of GDP from the onset of the trade war to the 2021 peak), it now faces an even more difficult transition. Chart 5China's Rising Propensity To Save
China's Rising Propensity To Save
China's Rising Propensity To Save
The need to improve quality of life is more urgent given that potential GDP has slowed. The need to contain systemic financial risk is more urgent given the big new increase in debt. And the need to diversify the economy is more urgent given that the US is now creating a coalition of democracies to confront China over a range of policies. The spike in the “marginal propensity to save” among Chinese people and corporations – as measured by the ratio of long-term cash deposits to short-term deposits – is an indication that the country is beset by troubles and animal spirits are depressed (Chart 5). China’s fiscal-and-credit impulse is turning down after the large expansion in 2018-21. Policymakers have signaled since last year that they would withdraw emergency stimulus and now the impact is apparent in the hard data. China’s money, credit, and combined credit-and-fiscal impulses all correlate with economic growth after a six-to-nine-month lag. This is true regardless of which indicators one uses for China’s money and credit cycles and economic activity (Charts 6A and 6B). China’s economic momentum is peaking and will become a headwind for the global economy later this year and in 2022, even though the world is otherwise enjoying the tailwinds of vaccination and economic reopening. Chart 6AChina’s Fiscal-And-Credit Impulse Falls Sharply …
China's Fiscal-And-Credit Impulse Falls Sharply...
China's Fiscal-And-Credit Impulse Falls Sharply...
Chart 6B… As Do Money-And-Credit Impulses
... As Do Money-And-Credit Impulses
... As Do Money-And-Credit Impulses
The downshift in the fiscal-and-credit impulse portends a slowdown in demand for commodities, materials, and other goods that China imports, especially for domestic consumption. (Chinese imports of parts and inputs that go into its manufacturing exports to the rest of the world look healthier as the rest of the world recovers.) This shift will make it hard for high-flying metals prices and other China plays, such as Swedish stocks, to continue rising without a correction (Chart 7). Speculative positioning is heavily in favor of commodities at the moment. The divergence between China and the metals markets that it dominates looks untenable in the short run (Chart 8). Chart 7China Reflation Trades Near Peaks
China Reflation Trades Near Peaks
China Reflation Trades Near Peaks
Chart 8Money Cycle And Commodity Prices Clash
Money Cycle And Commodity Prices Clash
Money Cycle And Commodity Prices Clash
The global shift to green or renewable energy systems (i.e. de-carbonization) is bullish for metals, especially copper, but will not be able to make up for the fall in Chinese demand in the short run, as our Emerging Markets Strategy has shown. China’s domestic uses of copper for construction and industry make up about 56.5% of global copper demand while the green energy race – namely the production of solar panels, windmills, electric cars – makes up only about 3.5% of global demand. This number somewhat understates the green program since re-gearing and retrofitting existing systems and structures is also projected, such as with electricity grids. But the point is that a drop in China’s copper consumption will work against the big increase in American and European consumption – especially given that the US infrastructure program will not kick in until 2022 at the earliest. Hence global copper demand will slow over the next 12 months in response to China even though the rest of the world’s demand is rising. Chinese policymakers have not yet signaled that they are worried about overtightening policy or that they will ease policy anew. The Politburo meeting at the end of April did not contain a major policy change from the Central Economic Work Conference in December or the Government Work Report in March (Table 1). But if there was a significant difference, it lay in reducing last year’s sense of emergency further while projecting some kind of scheme to hold local government officials accountable for hidden debt. The implication is continued tight policy – and hence the risk of overtightening remains substantial. Table 1China’s Recent Macroeconomic Policy Statements: Removing Stimulus
China Verges On Overtightening
China Verges On Overtightening
Chart 9Benchmarks For China's Policy Tightening
Benchmarks For China's Policy Tightening
Benchmarks For China's Policy Tightening
True, the tea leaves of the April meeting can be read in various ways. The April statement left out phrases about “maintaining necessary policy support” from the overarching macroeconomic policy guidance, which would imply less support for the economy. But it also left out the goal of keeping money supply (M2) and credit growth (total social financing) in line with nominal GDP growth, which could be seen as enabling a new uptick in credit growth. However, the People’s Bank of China did maintain this credit goal in its first quarter monetary policy report, so one cannot be sure. Notice that according to this rubric, China is right on the threshold of “overtightening” policy that we have utilized to measure the risk (Chart 9). Based on Chinese policymaking over the past two decades, we would expect any major inflection point to be announced at the July Politburo meeting, not the April one. We do not consider April a major change from the preceding meetings – nor does our China Investment Strategy. Therefore excessive policy tightening remains a genuine risk for the Chinese and global economy over the next 12 months. Our checklist for excessive tightening underscores this point (Table 2). Table 2Checklist For Chinese Policy Tightening
China Verges On Overtightening
China Verges On Overtightening
China’s fiscal-and-credit downshift is occurring in advance of the twentieth national party congress, which will take place throughout 2022 and culminate with the rotation of the top leadership (the Politburo Standing Committee) in the autumn. The economy is sufficiently stimulated for the Communist Party’s hundredth birthday on July 1 of this year, so policymakers are focused on preventing excesses. Financial risk prevention, anti-monopoly regulation, and tamping down on the property bubble are the orders of the day. The increase in corporate and government bond defaults and bankruptcies underscore the leadership’s willingness to push forward with economic restructuring and reform, which is well-attested in recent years (Chart 10). Chart 10Creative Destruction In China
China Verges On Overtightening
China Verges On Overtightening
Investors cannot assume that the party congress in 2022 is a reason for the leadership to ease policy. The contrary occurred in the lead-up to the 2017 party congress. However, investors also cannot assume that China will overtighten and sink its own economy ahead of such an important event. Stability will be the goal – as was the case in 2017 and previous party congresses – and this means that policy easing will occur at some point if the current round of tightening becomes too painful financially and economically. China-linked assets are vulnerable in the short run until policymakers reach their inflection point. Incidentally, the approach of the twentieth national party congress will be a magnet for political intrigue and shocking events. The top leader normally sacks a prominent rival ahead of a party congress as a show of force in the process of promoting his faction. The government also tightens media controls and cracks down on dissidents, who may speak up or protest around the event. But in 2022 the stakes are higher. President Xi was originally expected to step down in 2022 but now he will not, which will arouse at least some opposition. Moreover, under Xi, China has undertaken three historic policy revolutions: it is adopting a strongman leadership model, to the detriment of the collective leadership model under the two previous presidents; it is emphasizing economic self-sufficiency, at the expense of liberalization and openness; and it is emphasizing great power status, at the expense of cooperation with the United States and its allies. Bottom Line: Global equities, commodities, and “China plays” stand at risk of a substantial correction as a result of China’s policy tightening. Our base case is that China will avoid overtightening but the latest money and credit numbers run up against our threshold for changing that view. Another sharp drop in these indicators will necessitate a change. China’s Disappearing Workforce Ultimately one of the constraints on overtightening policy is the decline in China’s potential GDP growth as a result of its shrinking working-age population. China’s seventh population census came out this week and underscored the deep structural changes affecting the country and its economy. Population growth over the past ten years slowed to 5.4%, the lowest rate since the first census in 1953. The fertility rate fell to 1.3 in 2020, lower than the 2.1 replacement rate and the 1.8 target set when Chinese authorities relaxed the one-child policy in 2016. The fertility rate is also lower than the World Bank’s estimates (1.7 in 2019) and even Japan’s rate. The birthrate (births per 1,000 people) also fell, with the number of newborns in 2020 at the lowest point since 1961, the year of the Great Famine. The birth rate has converged to that of high-income countries, implying that economic development is having the same effect of discouraging childbearing in China, although China is less developed than these countries. Chart 11China’s Working Population Falling Faster Than Japan’s In 1990s
China Verges On Overtightening
China Verges On Overtightening
The youngest cohort rose from 16.6% to 17.95% of the population, the oldest cohort rose 8.9% in 2010 to 13.5% today, while the working-age cohort fell from 75.3% to 68.6%. The working-age population peaked in 2010 and fell by 6.79 percentage points over the past ten years. By contrast, Japan’s working-age population peaked in 1992 and fell 2.18 percentage points in the subsequent decade (Chart 11). In other words China is experiencing the demographic transition that hit Japan in the early 1990s – but China’s working-age population might fall even faster. The country is experiencing this tectonic socioeconomic shift at a lower level of per capita wealth than Japan had attained. The demographic challenge will put pressure on China’s socioeconomic and political system. The China miracle, like other Asian miracles, was premised on the use of export-manufacturing to generate large piles of savings that could be repurposed for national development. The decline in China’s working-age population coincides with economic development and a likely decline in the saving rate over the long run. This is shown in Chart 12, which shows two different pictures of China’s working population alongside the gross national saving rate. As China’s dependency ratio rises the saving rate will fall and fewer funds will be available for repurposing. The cost of capital will rise and economic restructuring will accelerate. In the case of Japan, the demographic shift coincided with the 1990 financial crisis and then a nationwide shift in economic behavior. The saving rate fell as the economy evolved but the savings that were generated still exceeded investment due to the shortfall in private demand and the pressure of large debt burdens. Companies focused on paying down debt rather than expanding investment and production (Chart 13). All of this occurred when the external environment was benign, whereas China faces a similar demographic challenge in the context of rising economic pressure due to geopolitical tensions. Chart 12Chinese Workers Getting Scarcer
Chinese Workers Getting Scarcer
Chinese Workers Getting Scarcer
Chart 13High Savings Enable Debt Splurge Until Debt Overwhelms
High Savings Enable Debt Splurge Until Debt Overwhelms
High Savings Enable Debt Splurge Until Debt Overwhelms
China has so far avoided a debilitating financial crisis and collapse in real estate prices that would saddle the country with a traumatizing liquidity trap. The Chinese authorities are painfully aware of the danger of the property bubble and are therefore eager to prevent financial excesses and curb bubble-like activity. This is what makes the risk of overtightening significant. But a mistake in either direction can lead to a slide into deflation. The Xi administration has stimulated the economy whenever activity slowed too much or financial instability threatened to get out of hand, as noted above, but this is a difficult balancing act, which is why we monitor the risk of excessive tightening so closely. A few other notable takeaways from China’s population census include: The two-child policy is not succeeding so far. COVID-19 might have had a negative effect on fertility but it could not have affected births very much due to the timing. So the trends cannot be distorted too much by the pandemic. Rapid urbanization continues, with the rate hitting 64% of the population, up 14 percentage points from 2010. Policy discussions are emphasizing lifting the retirement age; providing financial incentives for having babies; a range of price controls to make it more affordable to have babies, most notably by suppressing the property bubble; and measures to ensure that property prices do not fall too rapidly in smaller cities as migration from the country continues. China’s ethnic minority population, which consists of 9% of the total population, grew much faster (10% rate) over the past decade than the Han majority, which makes up 91% of the population (growing at a 5% rate). Minorities are exempt from the one-child (and two-child) policy. Yet ethnic tensions have arisen, particularly in autonomous regions like Xinjiang, prompting greater international scrutiny of China’s policies toward minorities. China’s demographic challenge is widely known but the latest census reinforces the magnitude of the challenge. China’s potential growth is falling while the rising dependency ratio underscores social changes that will make greater demands of government. Greater fiscal and social spending needs will require difficult economic tradeoffs and unpopular political decisions. Economic change and the movement of people will also deepen regional and wealth disparities. All of these points underscore one of our consistent Geopolitical Strategy mega-themes: China’s domestic political risks are underrated. Bottom Line: China’s 2020 census reinforces the demographic decline that lies at the root of China’s rising socioeconomic and political challenges. While China has a strong central government with power consolidated under a single ruling party, and a track record of managing its various challenges successfully in recent decades, nevertheless the magnitude of the changes happening are overwhelming and will bring negative economic and political surprises. India: State Elections Not A Turning Point Against Modi At the height of the second COVID-19 wave in India, elections were held in five Indian states. Results for the state of West Bengal were most important. West Bengal is a large state, accounting for nearly a-tenth of legislators at India’s national assembly, and the ruling Bharatiya Janata Party (BJP) of Prime Minister Narendra Modi had declared that it would win nearly 70% of the 294 seats there. In the event West Bengal delivered a landslide victory for the All India Trinamool Congress (AITMC), a regional party. Despite the fact that the AITMC was facing a two term anti-incumbency, the AITMC seat count hit an all-time high. Few had seen this coming as evinced by the fact that AITMC’s performance exceeded forecasts made by most pollsters. What should investors make of the BJP’s loss in this key state? Was it a backlash against Modi’s handling of the pandemic? Does it portend a change of government and national policy in the general elections in 2024? Not really. Here we highlight three key takeaways: Takeaway #1: The BJP’s performance was noteworthy Chart 14India: BJP Gets Foot In Door In West Bengal
China Verges On Overtightening
China Verges On Overtightening
Whilst the BJP fell short of its goals in West Bengal, the state is not a BJP stronghold. The BJP is known to have natural traction in Hindi-speaking regions of India and West Bengal is a non-Hindi speaking state where the BJP was traditionally seen as an outsider. Also, this state is known to be unusually unwilling to accept change. For instance, before AITMC, the Left was in power for a record spell of 34 years in this state. In such a setting, the BJP’s performance in 2021 in West Bengal is noteworthy: the party increased its seat count to 77 seats, compared to only 3 seats in 2016 (Chart 14). This performance now catapults the BJP into becoming the key opposition party in West Bengal. It also indicates that the BJP may take time but has what it takes to build traction in states that are not traditional strongholds. Given that it achieved this feat in a state where it has little historic strength, its performance is noteworthy as a sign that the BJP remains a force to be reckoned with. Takeaway #2: The BJP’s popularity slipped but it is still favored to retain power in 2024 Whilst discontent against the BJP is rising on account of its poor handling of COVID-19 and the accompanying economic distress, there remains no viable alternative to the BJP at the national level. The recent state elections, not only in West Bengal, confirm that the opposition Indian National Congress (INC) is yet to get its act in order. The Congress party collapsed from 44 seats in Bengal to 0 seats. More importantly, the Congress is yet to resolve two critical issues, i.e. the need to appoint or elect an internal leader with mass appeal, and the need to develop an identifiable policy agenda. The weakness of the Congress means that while the BJP’s seat count could diminish as against its 2019 peak performance, nevertheless our base-case scenario for 2024 remains that of a BJP-led government maintaining power in India. Policy continuity and the chance of some structural reform are still the base case. Takeaway #3: The rise and rise of India’s regional parties The rise of the BJP over the last decade has coincided with losses in seats by both the Congress party and India’s regional parties. However, the most recent round of state elections signals that the BJP cannot compress regional parties’ seat share drastically. For instance, in West Bengal, it managed to win 77 seats by itself but this was not at the expense of the AITMC, which is the dominant player in this state. In another large state where elections were held earlier this month, i.e. Tamil Nadu, control continues to fluctuate between two well-entrenched regional parties. Chart 15India: BJP Peaked In 2019 But Still Favored 2024
China Verges On Overtightening
China Verges On Overtightening
The 2019 general elections saw the share of regional parties (defined as all parties excluding the BJP and Congress) fall to 35% from the near 40% levels seen at the general elections of 2014 (Chart 15). The 2024 elections could in fact see regional parties’ seat share move up a notch as the BJP’s peak seat count could diminish from the highs of 2019. The coming rise of India’s regional parties is a trend rooted in a simple dynamic. With the BJP as a two-term incumbent in the 2024 elections, voters could choose to gratify regional parties at the margin, in the absence of any alternative to the BJP at the national level. The BJP remains in a position to be the single largest party in India in 2024 with a seat count in excess of the half-way mark. But could a situation arise where the ruling party pulls in a regional party to stay ahead of the half-way mark with a large buffer? Absolutely. But of course 2024 is a long way away. Managing COVID-19 and its economic fallout will make it harder than otherwise for the BJP to beat its 2019 performance. The next bout of key state elections in India are due in February 2022 and India’s largest state, Uttar Pradesh, will see elections. With the BJP currently in power in this Hindi-speaking state, the February 2022 elections will shed more light on BJP’s ability to mitigate the anti-incumbency effect of the pandemic and economic shock. Bottom-Line: BJP’s popularity in India has been shaken but not dramatically so. The BJP remains firmly in a position to be the single largest party in India with a seat count that should cross the half-way mark in 2024. So government stability is not a concern in this emerging market for now. In light of China’s domestic political risks, and India’s political continuity, we will maintain our India trades for the time being (Charts 16A and 16B). However, we are undertaking a review of India as a whole and will update clients with our conclusions in a forthcoming special report. Chart 16AStay Long Indian Bonds Versus EM
Stay Long Indian Bonds Versus EM
Stay Long Indian Bonds Versus EM
Chart 16BStick To Long India / Short China
Stick To Long India / Short China
Stick To Long India / Short China
Investment Takeaways Maintain near-term safe-haven trades. Close long natural gas futures for a 19.8% gain. Maintain cyclical (12-month) bullish positioning with a preference for value over growth stocks. Maintain long positions in commodities, including rare earth metals, and emerging markets. But be prepared to cut these trades if China overtightens policy according to our benchmarks. For now, continue to overweight Indian local currency bonds relative to emerging market peers and Indian stocks relative to Chinese stocks. But we are reviewing our bullish stance on India. Chart 17Cyber Security Stocks Perk Up Amid Tech Rout
Cyber Security Stocks Perk Up Amid Tech Rout
Cyber Security Stocks Perk Up Amid Tech Rout
Stay long cyber security stocks – though continue to prefer aerospace and defense over cyber security as a geopolitical “back to work” trade. Cyber security stocks perked up relative to the tech sector during the general tech selloff over the past week. The large-scale Colonial Pipeline ransomware cyber attack in the US temporarily shuttered a major network that supplies about 45% of the East Coast’s fuel (Chart 17). Nevertheless the attack on critical infrastructure highlights that cyber security is a secular theme and investors should maintain exposure. Cyber stocks have outperformed tech in general since the vaccine discovery (Chart 18). Chart 18Cyber Security Is A Secular Theme
Cyber Security Is A Secular Theme
Cyber Security Is A Secular Theme
Matt Gertken Vice President Geopolitical Strategy mattg@bcaresearch.com Yushu Ma Research Associate yushu.ma@bcaresearch.com Ritika Mankar, CFA Editor/Strategist Ritika.Mankar@bcaresearch.com
Highlights Over the 2021-22 period, renewable capacity will account for 90% of global electricity-generation additions, per the IEA's latest forecast. This will follow the 45% surge (y/y) in renewable generation capacity added last year, which occurred despite the COVID-19 pandemic (Chart of the Week). Continued investment in renewables and EVs – along with a global economic rebound – are pushing forecasts at banks and trading companies to a $13k - $20k/MT range for copper, vs. ~ $10.6k/Mt (~ $4.80/lb) at present. Should these stronger metals forecasts prove out, investments that extend low-carbon use of fossil fuels via carbon-capture and circular-use technologies will become more attractive. Investment in these technologies has been limited because there is no explicit global reference price to assess investments against. A carbon market or tax would provide such a bogey and accelerate investment. It could be monitored via a Carbon Market Club, which would limit trade to states posting and collecting the tax.1 Feature At almost 280GW, renewable energy capacity additions last year increased 45% y/y, the most since 1999, according to the IEA's most recent update on renewable energy.2 For this year and next, renewables are expected to account for 90% of capacity additions, led by solar PV investment increasing ~ 50% to 162GW. Wind capacity grew 90% last year, increasing to 114GW, and is expected to increase ~ 50% to end-2022. As renewables generation – and EV investment – continues to grow, demand for bulks (steel and iron ore) and base metals, led by copper, will pull prices higher. This is occurring against a backdrop of flat supply growth and physical deficits over the four years ended 2020 (Chart 2). According to the IEA, a 40% increase in steel and copper prices over the September 2020 to March 2021 period played a role in higher solar PV module prices. Chart of the WeekRenewables Capacity Surges
Surging Metals Prices And The Case For Carbon-Capture
Surging Metals Prices And The Case For Carbon-Capture
The supply side of the copper market will remain in deficit this year and next, in our assessment, and may continue on that trajectory if, as Wood Mackenzie expects, demand grows at a 2% p.a. rate over the next 20 years and miners remain reluctant to commit to the capex required to keep up with demand.3 Chart 2Physical Deficits Will Draw Copper Stocks...
Physical Deficits Will Draw Copper Stocks...
Physical Deficits Will Draw Copper Stocks...
ESG risk for copper – and other metals required to build the generation and infrastructure required in the renewables buildout – will increase as prices rise, which also will add to cost.4 Cost increases coupled with increasing ESG risks in this buildout will increase the attractiveness of carbon-capture and circular-economy technology investment, in our view. This would extend the use of low-carbon fossil fuels if the technology can move the world closer to a net-zero carbon future. However, unless and until policy catalyzes this investment, – e.g., via a global carbon trading price or tax – investment in these technologies likely will continue to languish. Carbon-Capture Tech's Unfulfilled Promise The history of Carbon Capture, Utilization and Storage (CCUS) has been one of high hopes and unmet expectations. It is generally recognized as a route to mitigate climate change; however, its deployment has been slower than expected. Low-carbon technology requires more critical metals than its fossil-fuel counterpart (Chart 3). Apart from the issue of cost, the ESG risks of mining metals for the renewable energy transition will increase as more metals are demanded, which we discussed in previous research.5 According to Wood Mackenzie, mining companies will need to invest nearly $1.7 trillion in the next 15 years to help supply enough metals to transition to a low carbon world.6 Chart 3Low-Carbon Tech Is Metals Intensive
Surging Metals Prices And The Case For Carbon-Capture
Surging Metals Prices And The Case For Carbon-Capture
Given these looming physical requirements for metals, fossil fuels most likely will need to be used for longer than markets currently anticipate, as a bridge to the low-carbon future, or as part of that future, depending on how successfully carbon is removed from the hydrocarbons used to power modern society. If so, using fossil fuels while mitigating their environmental impact will require highly focused technology to lower CO2 and other green-house gas (GHG) emissions during the transition to a low-carbon future. Enter CCUS technology: This technology traps CO2 from sources that use fossil fuels or biomass to make the energy required to run modern societies. In the current iterations of this technology, CO2 can either be compressed and transported, or stored in geological or oceanic reservoirs. This can then be used for Enhanced Oil Recovery (EOR) to extract harder-to-reach oil by injecting CO2 into the reservoirs holding the hydrocarbons.7 The Scope For CCUS Investment CCUS investment spending is increasing, as are the number of planned facilities using or demonstrating this technology. In the 2020 edition of its Energy Technology Perspectives, the IEA noted 30 new integrated CCUS facilities have been announced since 2017, mostly in advanced economies such as US and Europe, but also in some EM nations. As of 2020, projects at advanced stages of planning represented a total of $27 billion, more than double the investment planned in 2017 (Chart 4). Among its many goals, the Paris Agreement seeks a balance between emissions by man-made sources and removal by greenhouse gas (GHGs) sinks (absorption of the gases) in the second half of the 21st century. Practically, many countries – especially EM economies – will still need to use fossil fuels to develop during this period (Chart 5).8 Chart 4Carbon-Capture Projects To Date
Surging Metals Prices And The Case For Carbon-Capture
Surging Metals Prices And The Case For Carbon-Capture
Chart 5EM Development Will Require Fossil-Fuel Energy
Surging Metals Prices And The Case For Carbon-Capture
Surging Metals Prices And The Case For Carbon-Capture
CCUS In The Energy Sector As a fuel that emits fewer GHGs than coal – i.e., half the CO2 of coal – natural gas can be used effectively as a bridge to green-power generation (Chart 6). Chart 6Natural Gas Will Remain Attractive As A Bridge Fuel
Surging Metals Prices And The Case For Carbon-Capture
Surging Metals Prices And The Case For Carbon-Capture
The CO2 in natgas needs to be removed before dry gas is sold as pipeline-quality gas or LNG. This CO2 is normally vented to the atmosphere; however, by using CCUS technology, it can be reinjected into geological formations and used for EOR. For this reason, LNG companies in the US, the world’s largest LNG exporter, have been looking into investing in CCUS technology in a bid to become greener.9 CCUS can also be used to produce low-cost hydrogen – so-called blue hydrogen – using natural gas and coal, as opposed to the more expensive electrolysis process, which uses renewables-based electricity to produce "green" hydrogen. The lower blue-hydrogen costs will make clean hydrogen more accessible to emerging nations, opening new avenues for the world to use the energy carrier in its decarbonization effort. The Value Of Ccus In Other Industries CCUS technology can be retrofitted to existing power and industrial plants, which, according to the IEA, could otherwise still emit 8 billion tons of CO2 in 2050, around one-quarter of annual energy-sector emissions in 2020. Of the fossil fuel generators, coal-fired power generation presents the biggest CO2 challenge, with most of the emissions coming from China and other EM Asia nations, where the average plant age is less than 20 years. Since the average age of a coal fired power plant is 40 years, according to the US National Association of Regulatory Commissioners, this implies that these plants have a long remaining life and could still be operating until 2050. CCUS is the only alternative to retiring or repurposing existing power and industrial plants. The IEA believes that CCUS is imperative to reach net-zero carbon emissions. In its Sustainable Development Scenario - in which global CO2 emissions from the energy sector decline to net-zero by 2070 – CCUS accounts for 15% of the cumulative reduction in emissions. If the world needs to reach net-zero by 2050 instead, it will need almost 50% more CCUS deployment.10 Properly implemented and scaled, CCUS can allow industries to continue using oil, gas and coal and to attain net-zero carbon emission targets, boosting demand for fossil fuels in the medium term. This is especially important to EM development. Why Aren’t We Further Along In CCUS? What Can Be Done? The main reason CCUS isn’t used more widely is because of its cost. Currently, the cost of capturing carbon varies, based on the amount of CO2 concentration, with Direct Air Capture being most expensive (Chart 7). Given the prohibitive costs, CCUS has not been commercially viable. However, the same argument could have been used against implementing renewable sources of energy. While at one point the Levelized Cost of Energy from renewable sources was high, as these sources have been scaled up – aided in no small part by government subsidies – costs have fallen, following something akin to a Moore’s Law cost-decay curve. A Levelized Cost of Energy for solar generation reported by Lazard Ltd., which allows for comparisons across technologies (e.g., fossil-fuel vs renewable), shows generation costs fell by 89% to $40/MWh from $359/MWh from 2009-2019 (Chart 8). This learning curve was able to take place because of government subsidies, which promoted the deployment of solar technology. Chart 7CCUS Can Be Expensive
Surging Metals Prices And The Case For Carbon-Capture
Surging Metals Prices And The Case For Carbon-Capture
Chart 8Subsides Could Support CCUS, Just As Was Done For Solar
Subsides Could Support CCUS, Just As Was Done For Solar
Subsides Could Support CCUS, Just As Was Done For Solar
The cost of CCUS technology is falling. For example, in 2019 the Global CCS Institute reported it cost $100/ton to capture carbon from the Canada-based Boundary Dam using a CCS unit built in 2014. The cost of carbon captured at the US-based Petra Nova plant – built three years later – using improved technology was $65/ton. Both are coal-powered electricity plants. The report also noted coal-fired power plants planning to commence operations in 2024-28 using the same CCS technology as those at Boundary Dam and Petra Nova expect carbon costs to be ~ $43/ton, due to steeper learning curves, research, lower capital costs due to economies of scale, and digitalization. One commonality amongst these sources of cost reductions is that companies need to invest more into CCUS and familiarize themselves with this technology. As was the case with renewables, government subsidies would reduce the prohibitive costs of operating CCUS technology, and draw more participation to refining this technology. Early, first-of-its-kind CCUS will be expensive, however subsidies in the form of capital support or tax credits will increase CCUS implementation and research. Boundary Dam and Petra Nova are examples of facilities that benefitted from government subsidies. The facilities received $170 million and $200 million respectively from Canadian and US Government agencies at the time of the CCS units’ construction. The US has also implemented a 45Q tax credit system which pays facilities $50/ton of CO2 stored and $35/ton of CO2 if it is used in applications like Enhanced Oil Recovery. According to the Global CCS Institute, in late-2019, of the eight new CCUS projects that were added in the US, four cited the presence of 45Q as the key driver. Putting Carbon Markets And Taxes To Work The EU’s Emissions Trading System (ETS) market, which was implemented in 2005, is an example of innovative policy which incentivizes companies to curb emissions, using market forces. The price of carbon measured in these markets puts a tangible value on a negative externality, which before this went unrecorded. The downside of this ETS is its reliance on the EU's environmental policy implementation, which is subject to policy changes that complicate supply-demand analysis for longer-term planning – e.g., the recent increase in its emissions target to a minimum of 55% net reduction in GHG emissions by 2030. An alternative to policy-driven trading of emissions rights is a per-ton tax on emissions, which governments would impose and collect. This would raise costs of technologies using fossil fuels – including those used in the mining industry to increase supply of critical bulks and base metals needed for the renewables transition. At the same time, such a tax would give firms supplying and using technologies that raise CO2 levels an incentive to lower CO2 output using CCUS technologies. ETS markets and governments imposing CO2 taxes could form Carbon Market Clubs – a technology developed by William Nordhaus, the 2018 Nobel Laureate in Economics – that restrict trading to states that can demonstrate their participation and support of actual carbon-reduction detailed in the Paris Agreement via trading or tax schemes.11 As the green energy transition gains traction and governments implement more net-zero emissions policies, the price of carbon will rise. As the price of carbon rises, the price tag associated with companies’ carbon emissions will increase with it. With market participants expecting the price of carbon to continue to rise after hitting record values, the incentive for companies operating in the EU to use CCUS technology will rise, as would the incentive for firms facing a carbon tax.12 Bottom Line: Given the meteoric price rise of green metals, underfunded capex, and the ESG risks associated with mining metals for the low carbon future, we expect fossil fuels to play a larger role in the transition to a low-carbon society than markets are currently expecting. For countries to be able to use fossil fuels while ensuring they achieve their climate goals, the use of CCUS technology is important. To increase CCUS uptake, governments will need to subsidize this technology until demand for it gains traction, just like in the case of renewables. Encouraging ETS and carbon-tax schemes also will be required to catalyze action. Robert P. Ryan Chief Commodity & Energy Strategist rryan@bcaresearch.com Ashwin Shyam Research Associate Commodity & Energy Strategy ashwin.shyam@bcaresearch.com Commodities Round-Up Energy: Bullish Brent prices were knocking against the $70/bbl door going to press, following the IEA's assessment of a robust demand recovery in 2H21 (Chart 9). The IEA took its 1H21 demand growth down 270k b/d, owing to COVID-19-induced demand destruction in India, OECD Americas and Europe, but left its 2H21 estimate intact, making overall demand growth for this year 5.4mm b/d. The EIA also expects 5.4mm b/d demand growth for this year, and growth of 3.7mm b/d next year. OPEC left its full-year 2021 demand growth estimate at 6mm b/d. OPEC 2.0 meets again on June 1 and will look to return more of its sidelined production to the market, in our estimation. We will be updating our supply-demand balances and price forecasts in next week's report. Base Metals: Bullish Spot copper prices traded on either side of $4.80/lb on the CME/COMEX market this week as we went to press. Threats of a tax increase in Chile, where a bill calling for such a measure is making its way through Congress; a potential strike by mine workers; and a shortage of sulfuric acid used in the extraction of ore brought about, according to Bloomberg, by reduced global sulfur supplies due to lower refinery runs during the pandemic all are keeping copper well bid. Our target for Dec21 COMEX copper remains $5/lb (~ $11k/ton on the LME). We remain long calendar 2022 COMEX copper vs short 2023 COMEX copper expecting physical supply deficits to continue to force storage draws, which will backwardate the metal's forward curve. Precious Metals: Bullish US CPI data on Wednesday showed that headline inflation rose by 4.2% for the month of April compared to the previous year. While this increase is the highest since 2008, this jump could also be fueled by a low base effect – Inflation levels were falling this time last year as the pandemic picked up. While rising prices increases demand for gold as an inflation hedge, if the Federal Reserve increases interest rates on the back of this data, the US dollar will rise, negatively affecting gold prices (Chart 10). However, we do not expect the Fed to abruptly change its guidance on this report, and therefore expect the central bank will treat this blip as transitory. As of yesterday’s close, COMEX gold was trading at $1,835.9/oz. Ags/Softs: Neutral Going to press, the Chicago soybean market was surging ahead of the scheduled World Agriculture Supply and Demand Estimates (WASDE) report due out later Wednesday. Front-month beans were trading ~ $16.70/bu, up 2% on the day. This month's WASDE will contain the USDA's first estimate for demand in ag markets for the 2021/22 crop year. Markets are expecting supplies to tighten as demand strengthens. Chart 9
Brent Prices Going Up
Brent Prices Going Up
Chart 10
Covid Uncertainty Could Push Up Gold Demand
Covid Uncertainty Could Push Up Gold Demand
Footnotes 1 Please see Carbon Market Clubs and the New Paris Regime published by the World Bank in July 2016. The intellectual and computational framework for such technology was developed by William Nordhaus, the 2018 Nobel Laureate in Economics. 2 Please see Renewable Energy Market Update, Outlook for 2021 and 2022.pdf, published by the IEA this week. 3 WoodMac notes, "without additional substantial investment, production will decline from 2024 onwards. Coupled with demand growth, this decline in output will lead to a theoretical shortfall of around 16 Mt by 2040." The consultancy estimates an additional $325 - $500+ billion will be needed to meet copper demand over this period. Please see Will a lack of supply growth come back to bite the copper industry? Published 23 March 2021 by woodmac.com. 4 Please see Renewables ESG Risks Grow With Demand, which we published 29 April 2021. It is available at ces.bcaresearch.com. 5 Refer to footnote 4. 6 Please see Low carbon world needs $1.7 trillion in mining investment, published by Reuters. 7 This method is used to increase oil production. It changes the properties of the hydrocarbons, restores formation pressure and enhances oil displacement in the reservoir. Using EOR, oil companies can recover 30% to 60% of the original oil level in the reservoir. Please see Enhanced Oil Recovery published by the US Department of Energy. 8 Please see the Reuter’s column CO2 emission limits and economic development. 9 Please see World Oil’s U.S. LNG players tout carbon capture in bid to boost green image. 10 Please see IEA’s Special Report on Carbon Capture Utilisation and Storage, published as a part of the Energy Technology Perspective 2020. 11 See footnote 1 above. 12 Please see Cost of polluting in EU soars as carbon price hits record €50 by the Financial Times. Investment Views and Themes Strategic Recommendations Tactical Trades Commodity Prices and Plays Reference Table Trades Closed in 2021 Summary of Closed Trades
Higher Inflation On The Way
Higher Inflation On The Way
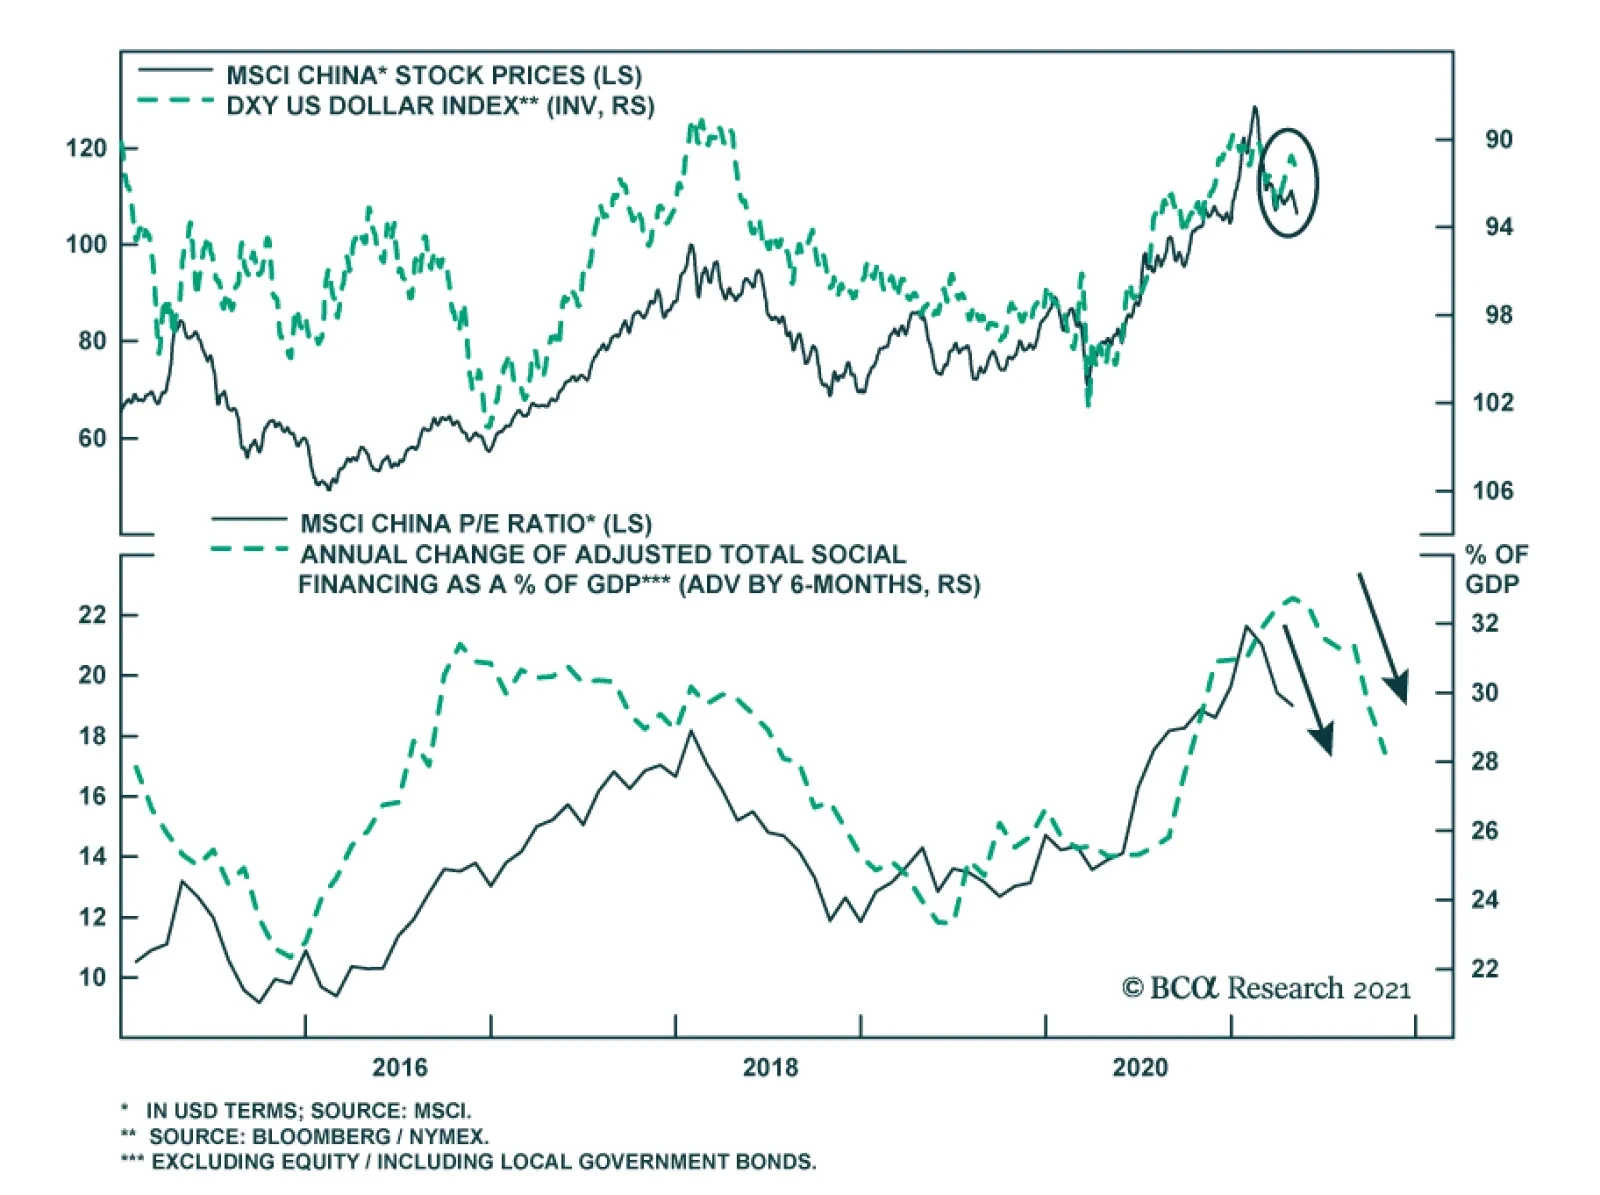
EM stocks, including Chinese equities, tend to perform well during periods of stronger global growth, rising commodity prices and a weaker US dollar. However, a falling dollar index since April has failed to boost Chinese investable stock prices. …
China’s credit data surprised to the downside in April and continues to point to a winding down of last year’s massive stimulus. Aggregate financing declined sharply to CNY 1.85 trillion from CNY 3.34 trillion, lower than the anticipated CNY 2.29 trillion.…
Feature Chinese stocks remain in limbo despite robust economic data in April and early May (Chart 1). Onshore equities are pricing in policy tightening risks and a peak in the domestic economic cycle. Meanwhile, a regulatory clampdown on the tech sector continues to curb global investors’ enthusiasm towards Chinese investable stocks. The PBoC has not changed its course of policy normalization. The falling 3-month SHIBOR since March likely reflects softening demand for interbank liquidity rather than monetary easing (Chart 2). Chart 1Stay Underweight Chinese Stocks
Stay Underweight Chinese Stocks
Stay Underweight Chinese Stocks
Chart 2No Easing In Monetary Policy
No Easing In Monetary Policy
No Easing In Monetary Policy
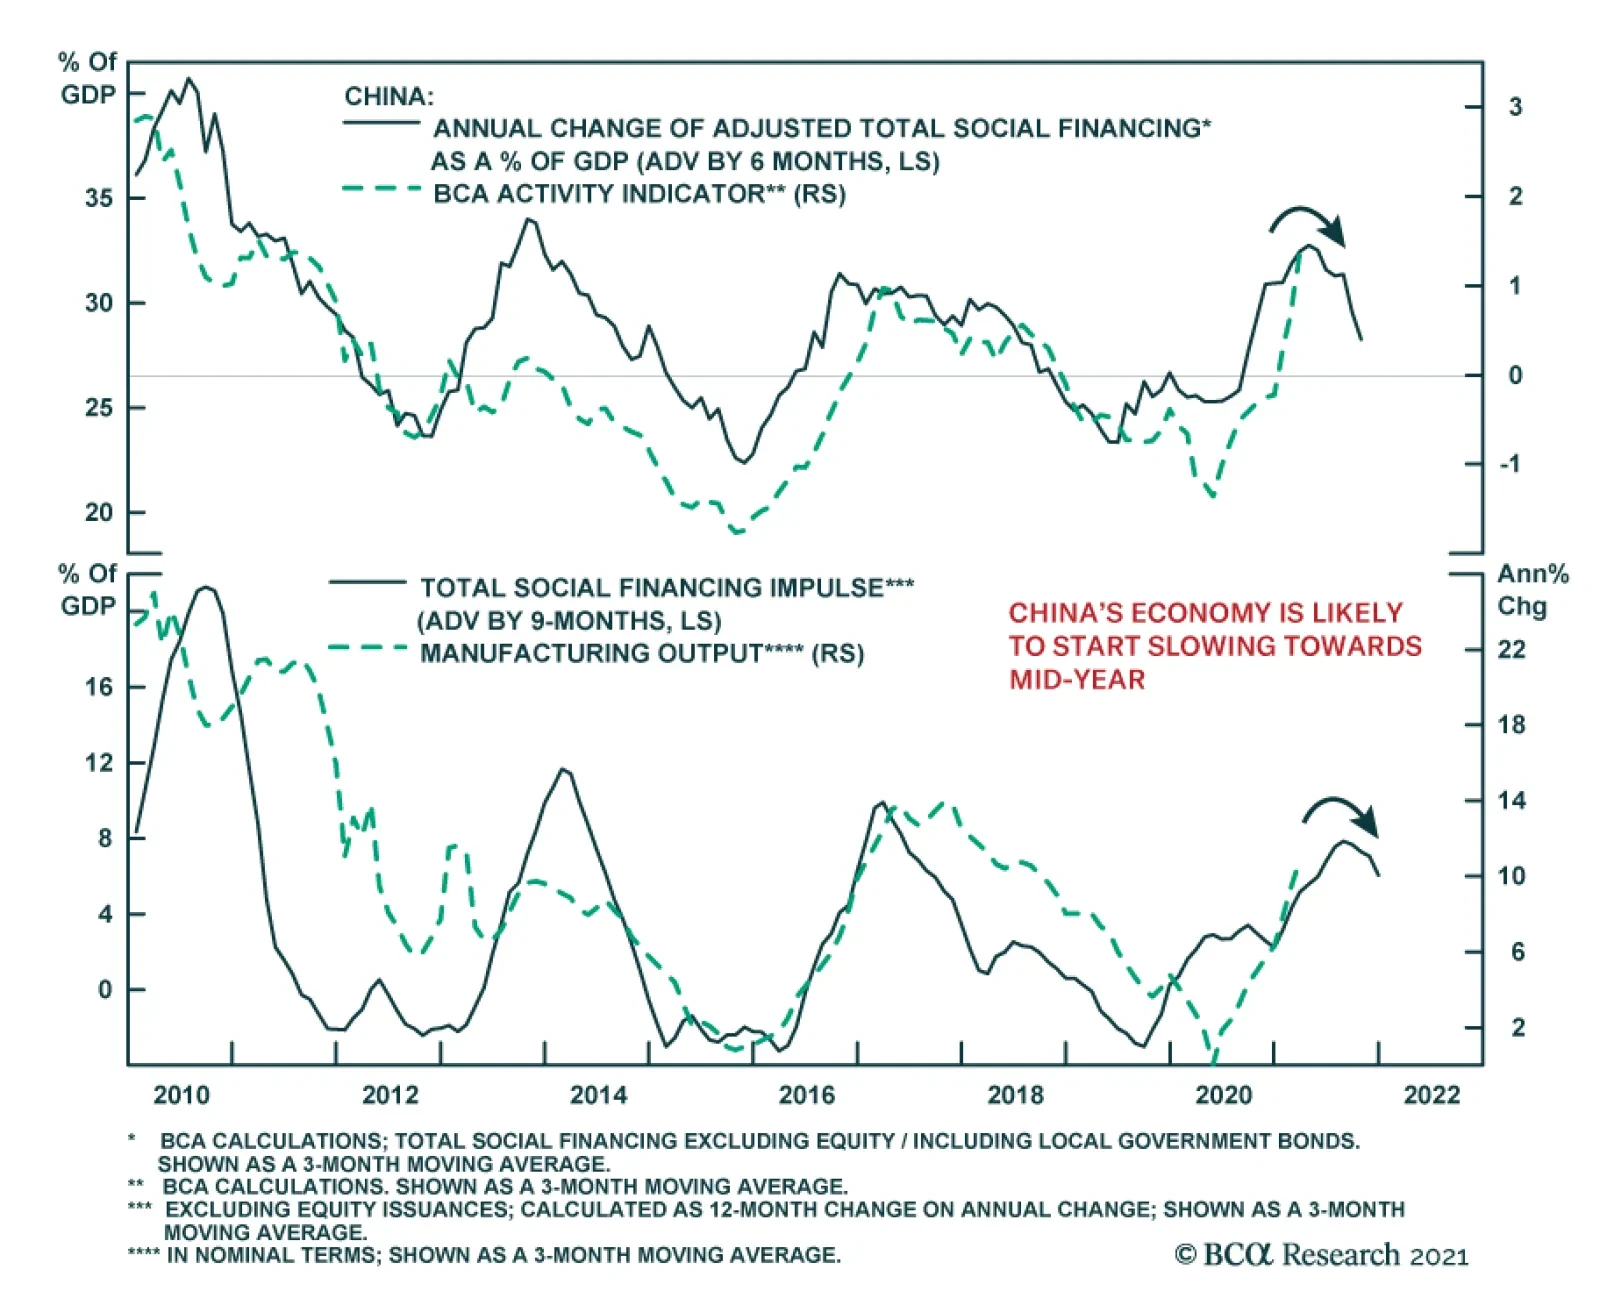
Fiscal policy has also been consolidating with a renewed focus on reducing local government debt load and financial risks. A delay in local government bond issuance in Q1 could potentially boost bond sales in the second half of the year. However, as we noted late last month, without a synchronized policy push for more bank loans and loosened regulations on provincial government spending, an increase in special-purpose bond issuance alone will not make a significant difference in infrastructure investment nor economic growth. We still expect China's economy, which lags the credit cycle by six to nine months, to start weakening by mid-2021 (Chart 3A & 3B). Chart 3ADomestic Economic Growth Set To Slow
Domestic Economic Growth Set To Slow
Domestic Economic Growth Set To Slow
Chart 3BPolicy Tightening Will Weigh On Earnings Growth In 2H21
Policy Tightening Will Weigh On Earnings Growth In 2H21
Policy Tightening Will Weigh On Earnings Growth In 2H21
Qingyun Xu, CFA Associate Editor qingyunx@bcaresearch.com Our BCA Li Keqiang Leading Indicator continues to fall despite a marginal improvement in the Monetary Conditions Index (MCI) component. The deceleration in both money supply and credit growth has more than offset a small uptick in the MCI (Chart 4). Furthermore, a rising RMB in trade-weighted and real terms will not help the profit outlook for China’s exporters (Chart 5). Overall, monetary conditions remain unfavorable for risk assets. This is consistent with the poor performance of Chinese stocks Chart 4Falling Credit And Money Growth More Than Offset A Minor Improvement In The MCI
Falling Credit And Money Growth More Than Offset A Minor Improvement In The MCI
Falling Credit And Money Growth More Than Offset A Minor Improvement In The MCI
Chart 5Strengthening RMB Will Not Help The Profit Outlook For Chinese Exporters
Strengthening RMB Will Not Help The Profit Outlook For Chinese Exporters
Strengthening RMB Will Not Help The Profit Outlook For Chinese Exporters
A sharp jump in state-owned enterprise (SOE) defaults since late last year is due to deteriorating corporate balance sheets. The defaults have exposed the weakened fiscal positions of local governments (Chart 6 & 7). SOE bond defaults have surpassed the number of private bond defaults this year. The more restrictive policy on local government financing, together with an acceleration in SOE defaults, will weigh on spending by local governments, local government financing vehicles (LGFVs) and SOEs. Chart 6Returns On SOE Assets Remain In Deep Contraction
Returns On SOE Assets Remain In Deep Contraction
Returns On SOE Assets Remain In Deep Contraction
Chart 7SOE Bond Defaults Have Surpassed Private Bond Defaults
China Macro And Market Review
China Macro And Market Review
The Politburo meeting on April 30 established new guidelines to reduce local government leverage, both on- and off-balance sheet debt. According to the new rules, local governments are strictly prohibited from obtaining “hidden debts” for new investment projects directly or through their affiliated SOEs, which include LGFVs. The directives also state that the assets of LGFVs with defaulted loans should be restructured or liquidated if companies are unable to repay their debts. In addition, financial institutions should not accept government guarantees when making decisions on lending to LGFVs or government related entities. Moreover, stricter measures in the property market have further dampened local governments’ fiscal situations since land sales account for 53% of local government fiscal revenues. Growth in government expenditures decelerated in recent months along with slowing land auctions (Chart 8). Scaled down fiscal supports will lead to subdued infrastructure investment growth this year (Chart 9). Chart 8Fiscal Stance Has Tightened
Fiscal Stance Has Tightened
Fiscal Stance Has Tightened
Chart 9Subdued Growth In Infrastructure Investments
Subdued Growth In Infrastructure Investments
Subdued Growth In Infrastructure Investments
In addition to policy tightening in the domestic economy, Chinese offshore stocks continue to face regulatory headwinds to root out monopolies in technology, media, and telecom (TMT) companies. The antitrust investigations and fines extending from Alibaba and Tencent to Meituan highlight China’s aim to curb platform oligopolies and monopolies. Meanwhile, Chinese tech firms listed on US exchanges are facing another regulatory threat on their accounting reporting standards, which could potentially result in their delisting from the US bourses. Moreover, elevated valuations and a weakening in the earnings outlook will generate more downside risks for TMT stocks (Chart 10). Given that TMT stocks account for around 50% of the MSCI China Index’s market capitalization, Chinese investable stocks are disproportionally vulnerable to a selloff in TMT stocks (Chart 11). Chart 10ATMT Stocks: From Tailwind To Headwind
TMT Stocks: From Tailwind To Headwind
TMT Stocks: From Tailwind To Headwind
Chart 10BTMT Stocks: From Tailwind To Headwind
TMT Stocks: From Tailwind To Headwind
TMT Stocks: From Tailwind To Headwind
Chart 11MSCI China Is Highly Concentrated In TMT Stocks
MSCI China Is Highly Concentrated In TMT Stocks
MSCI China Is Highly Concentrated In TMT Stocks
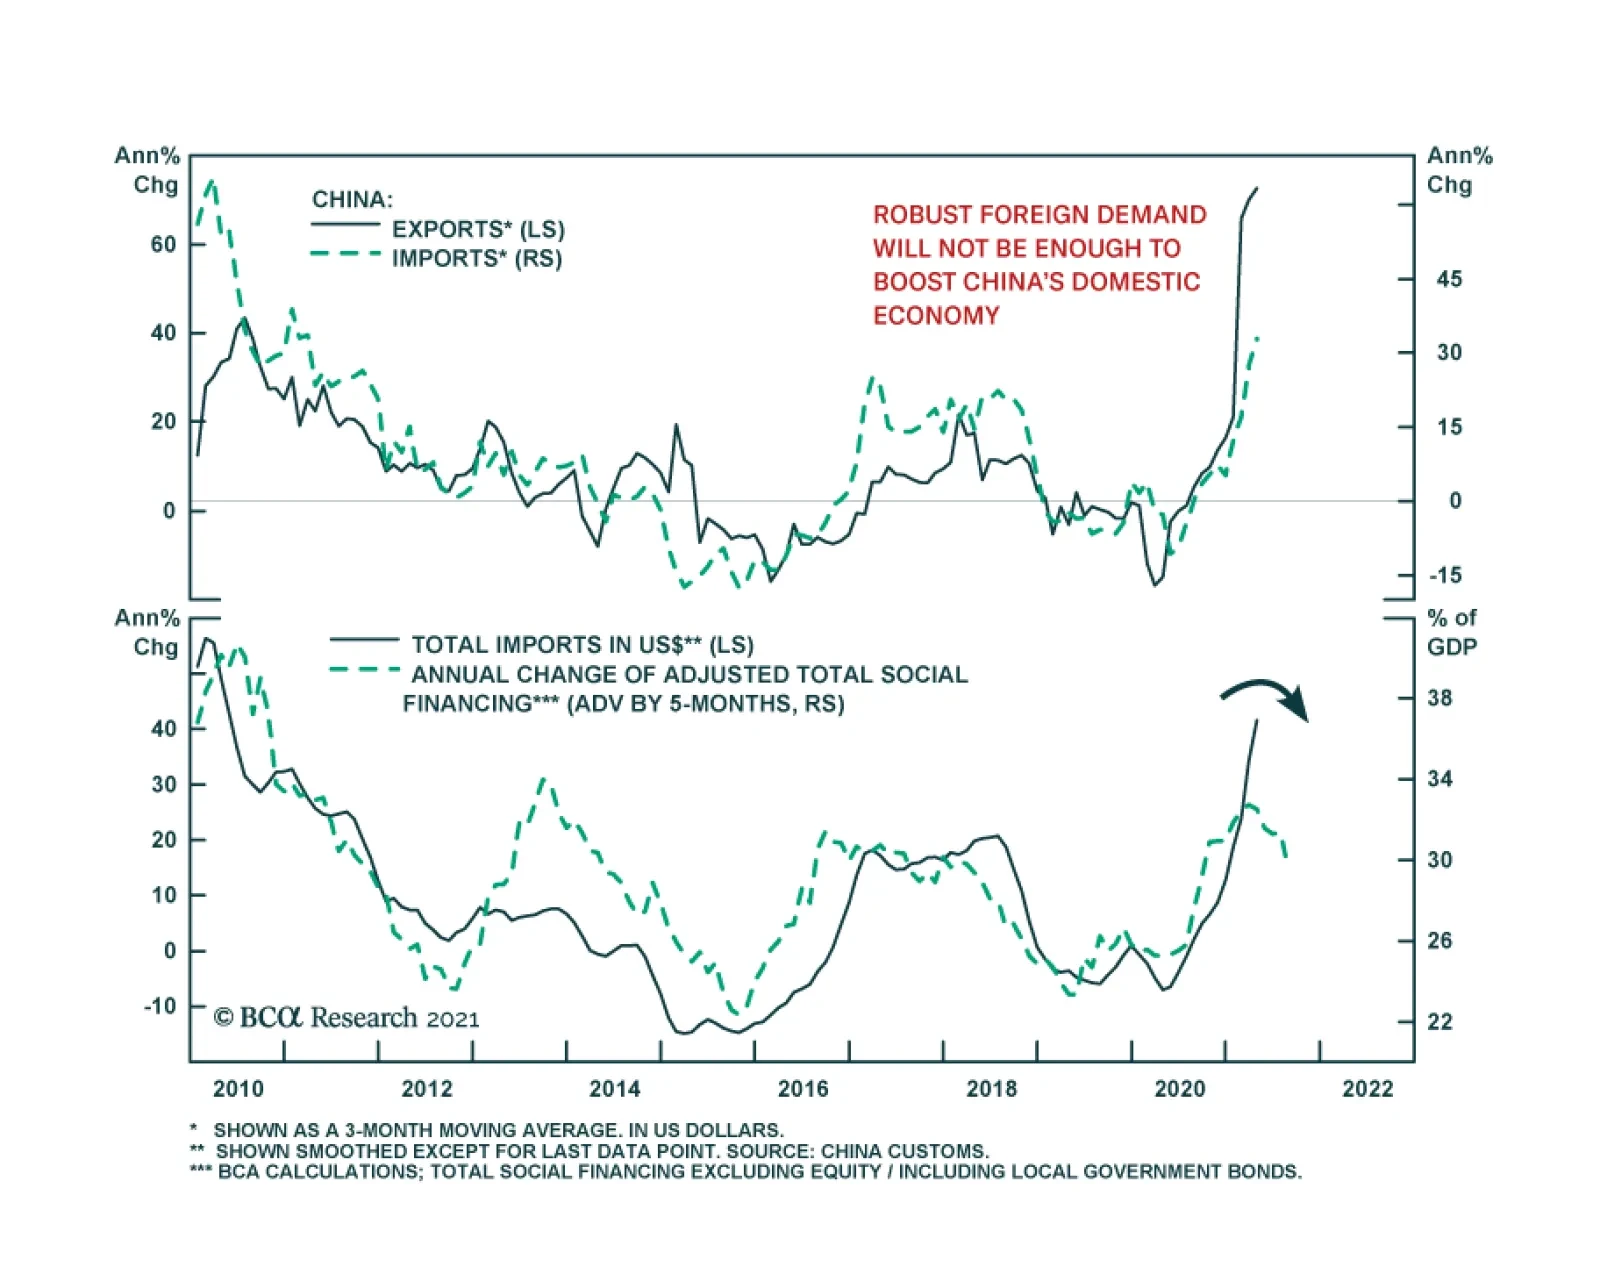
China’s official PMI and the Caixin China PMI moved in opposite directions in April due to the nature of the two surveys. The Caixin PMI covers smaller, more export-oriented businesses while the NBS Manufacturing PMI includes larger, more domestically exposed companies. The divergence highlights that the domestic economy is losing speed while external demand remains robust (Chart 12). Given the dominance of domestic demand in China’s economy (investment expenditures, household spending and government spending), strong external demand will not fully offset the deceleration in domestic growth. New orders and production subcomponents in the official PMI moderated in April from March, which indicates a slowing momentum in economic activity (Chart 13). Moreover, construction PMI fell to 57.4 from 62.3 in March, corresponding with weaker infrastructure spending and more policy tightening in the real estate sector (Chart 13, bottom panel). Chart 12Conflicting Messages From The NBS And Caixin PMIs
Conflicting Messages From The NBS And Caixin PMIs
Conflicting Messages From The NBS And Caixin PMIs
Chart 13Slowing Momentum In China's Economic Activity
Slowing Momentum In China's Economic Activity
Slowing Momentum In China's Economic Activity
The moderating momentum in China’s economy is also reflected in April’s trade data, which showed a strengthening external sector and a slowing domestic demand. A few observations support our view: First, strong imports since early this year were partly due to robust re-exports. Solid external demand boosted processing imports, which in turn contributed to China’s overall import growth (Chart 14). Secondly, Chinese imports of commodities in volume, such as copper and steel products, have plunged recently. Chinese domestic demand for commodities will likely peak in the coming months, therefore, inventory destocking pressures and weakness in underlying consumption will threaten commodities prices (Chart 15). Finally, the strengthening of coal imports in volume terms may be related to China’s increasingly stringent environmental policies. A temporary cutback in domestic coal supply boosted the demand for imports. However, in the long run, China’s push for green energy will be bearish for Chinese coal imports (Chart 16). Chart 14Solid External Demand Boosted Processing Imports
Solid External Demand Boosted Processing Imports
Solid External Demand Boosted Processing Imports
Chart 15Demand Of Commodities May Be Approaching A Cyclical Peak
Demand Of Commodities May Be Approaching A Cyclical Peak
Demand Of Commodities May Be Approaching A Cyclical Peak
Chart 16China's Coal Imports Likely To Decline In The Long Run
China's Coal Imports Likely To Decline In The Long Run
China's Coal Imports Likely To Decline In The Long Run
Housing prices in tier-one cities continue to post major gains despite a slew of tightening regulations in the property sector introduced since the second half of last year (Chart 17). The Politburo meeting last month reiterated authorities’ concerns over a bubble in housing. We expect authorities to impose additional regulations to constrain both financing supply and demand in the property sector. In the meantime, the existing policies have successfully started to cool the real estate market. Chart 17Skyrocketing Housing Prices In First-Tier Cities
Skyrocketing Housing Prices In First-Tier Cities
Skyrocketing Housing Prices In First-Tier Cities
Chart 18Real Estate And Mortgage Loans Tumbled Under More Restrictive Borrowing Regulations
Real Estate And Mortgage Loans Tumbled Under More Restrictive Borrowing Regulations
Real Estate And Mortgage Loans Tumbled Under More Restrictive Borrowing Regulations
Both mortgage loans and loans to real estate developers tumbled under more restrictive borrowing policies (Chart 18). Growth in home sales has also started to roll over (Chart 19). Housing completed has dropped significantly, which confirms that construction activity is decelerating. Looking forward, the reduced expansion rate of new projects due to shrinking land transfers and stricter borrowing regulations will further dampen construction activities in the second half of this year (Chart 20). Chart 19Home Sales Growth Started To Ease
Home Sales Growth Started To Ease
Home Sales Growth Started To Ease
Chart 20Real Estate Investments Are Set To Slow Further
Real Estate Investments Are Set To Slow Further
Real Estate Investments Are Set To Slow Further
Table 1China Macro Data Summary
China Macro And Market Review
China Macro And Market Review
Table 2China Financial Market Performance Summary
China Macro And Market Review
China Macro And Market Review
Footnotes Cyclical Investment Stance Equity Sector Recommendations
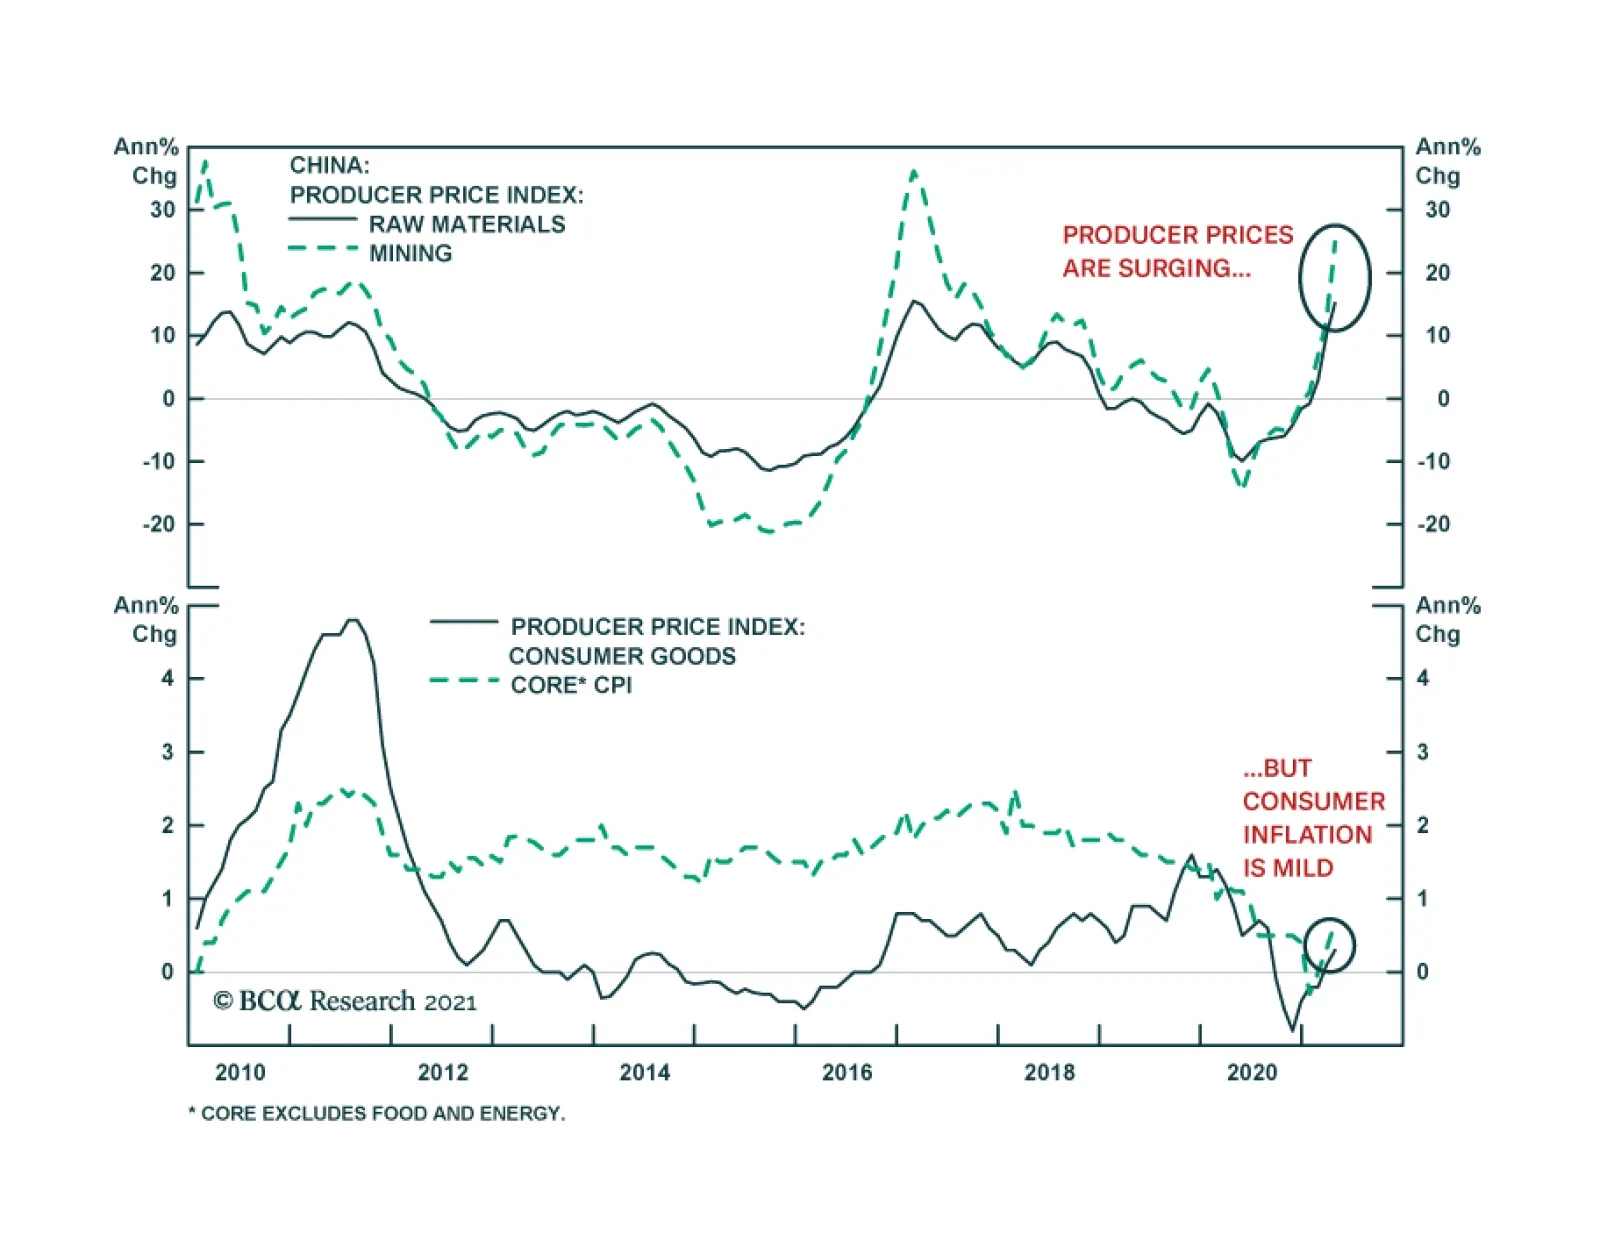
China’s Producer Price Index jumped from 4.4% y/y to 6.8% y/y in April, surpassing expectations of 6.5% y/y and suggesting that inflationary pressures are intensifying in the mainland. The speed of the rise is eye-catching: PPI troughed at -3.7% y/y last May…
China’s trade surplus widened significantly in April, rising to $42.9 billion from $13.8 billion. Exports accelerated by 32.3% y/y from 30.6% y/y in March, marking a positive surprise to the anticipated 24.1% y/y growth rate. Similarly, the pace of imports…
Highlights US natural gas prices will remain well supported over the April-October injection season, as the global economic expansion gains traction, particularly in Europe, which also is refilling depleted storage levels. China's natgas demand is expected to rise more than 8% yoy, and EM Asia consumption also will be robust, which will revive US liquified natural gas (LNG) exports. Exports of US light-sweet crude into the North Sea Brent pricing pool – currently accounting for close to half the physical supply underpinning the global oil-price benchmark – also will increase over the course of the year, particularly in the summer, when maintenance will markedly reduce the physical supply of crudes making up the Brent index. At the margin, coal demand will increase in the US, as industrial natgas demand and LNG exports incentivize electric generators to favor coal. Higher-than-expected summer temperatures in the US also would boost coal demand. This will be tempered somewhat in Europe, where carbon-emissions rights traded through €50/MT for the first time this week on the EU's Emission Trading System (ETA). We expect US LNG and oil exports to revive this year (Chart of the Week) and remain long natgas in 1Q22. Feature The importance of US LNG and crude oil exports out of the US Gulf to the global economy is only now becoming apparent. As demand for these fossil fuels grows and the supply side continues to confront a highly uncertain risk-reward tradeoff, their importance will only grow. In natgas markets, US LNG cargoes out of the US Gulf balanced demand coming from Asia and Europe this past winter, which was sharply colder than expected and stretched supply chains globally. As a widening economic recovery from the COVID-19 pandemic spurs industrial, residential and commercial demand, and inventories in Europe and Asia are re-built in preparation for next winter, US LNG exports will be called upon to meet increasing demand, particularly since they are priced attractively vs regional importing benchmarks, with differentials vs the US presently $4+/MMBtu vs Europe and $5+/MMBtu vs Asia (Chart 2).1 Chart of the WeekUS LNG, Oil Export Growth Will Rebound
US LNG, Oil Export Growth Will Rebound
US LNG, Oil Export Growth Will Rebound
Chart 2Lower US Natgas Prices Encourage LNG Exports
Importance Of US Gas, Oil Exports Increases Daily
Importance Of US Gas, Oil Exports Increases Daily
In oil markets, an ongoing kerfuffle in the pricing of Brent Blend brought about by falling North Sea crude oil production makes American light-sweet crude oil exports from the Gulf (i.e., WTI produced mostly in the Permian Basin) account for almost half of the physical supplies in this critical benchmark-pricing market.2 US LNG Exports Will Increase US natural gas prices will remain well supported as the global economic expansion gains traction, and the US and Europe open the April-October injection season well bid (Chart 3). US inventories are expected to end the Apr-Oct injection season at just over 3.7 TCF according to the EIA, very close to where they ended the 2020 injection season. Chart 3US, Europe Rebuild Storage
Importance Of US Gas, Oil Exports Increases Daily
Importance Of US Gas, Oil Exports Increases Daily
Higher US LNG exports, industrial, commercial and residential demand will be offset by lower consumption from electric generators this year, netting to a slight decline in overall demand. The EIA expects generators to take advantage of lower generating costs to be had burning coal to produce electricity, a view we share given the current differentials in the forward curves for each fuel (Chart 4).3 On the supply side, the EIA's expecting output to remain unchanged from last year at just under 91.5 BCF/d in 2021. Higher LNG exports, even as generator demand is falling, pushes prices higher this year – averaging $3.04/MMBtu this year – which leads to a slight increase in output in 2022. For our part, we continue to expect higher prices during the November-March heating season than currently are clearing the market and remain long 1Q22 $3.50/MMBtu calls vs. short $3.75/MMbtu calls. As of Tuesday night, when we mark to market, this position was up 20.8% since inception on 8 April 2021. Chart 4Lower Prices Will Favour Increased Coal Demand
Lower Prices Will Favour Increased Coal Demand
Lower Prices Will Favour Increased Coal Demand
Natgas demand could surprise on the upside during the injection season if air-conditioning demand comes in stronger than expected and production remains essentially unchanged this year. This could reduce LNG exports and slow the rate of inventory refill in the US, which could further advantage coal as a burner fuel for generators in the US. The US National Weather Service's Climate Prediction Center expects above-average temperatures for most of the US population centers this summer (Chart 5). This could become a semi-permanent feature of the market if current temperature trends persist (Chart 6). Based on analyses’ run by the NOAA's National Centers for Environmental Information, 2021 "is very likely to rank among the ten warmest years on record," with lower (6%) odds of ranking in the top five hottest years on record.4 Chart 5Odds Of Hotter Summer Rising
Importance Of US Gas, Oil Exports Increases Daily
Importance Of US Gas, Oil Exports Increases Daily
Chart 6Higher Global Temperatures Could Become A Recurring Phenomenon
Importance Of US Gas, Oil Exports Increases Daily
Importance Of US Gas, Oil Exports Increases Daily
The Crude Kerfuffle As the Chart of the Week shows, US exports of light-sweet crude oil peaked at ~ 3.7mm b/d in February 2020, just before the COVID-19 pandemic hit the world full force. Exports out of the US Gulf – i.e., WTI priced against the Midland, TX, gathering hub – accounted for ~ 95% of these volumes. With exports currently running ~ 2.5mm b/d, more than 1mm b/d of readily available export capacity remains in place. Additional volumes will be developed as dredging of the Corpus Christi, TX, progresses. While the surge in US crude oil production has subsided in the wake of the pandemic, it most likely will revive as the markets return to normal operating procedure, additional dredging operations are completed, and storage facilities are built out.5 Existing and additional export capacity of the US's light-sweet crude could not arrive at a more opportune time for the Brent market, which remains in a state of uncertainty as to whether markets will have to adjust to CIF contracts or a work-around to the existing FOB pricing regime, which can be augmented to accommodate increasing WTI volumes.6 This will have to be sorted, as this is the future of the market's most important pricing index (Chart 7). The buildout in crude-oil exporting capacity – and natgas LNG exporting capacity, for that matter – ideally accommodates shale-oil- and -gas assets, which can be ramped up quickly to meet demand, and ramped down quickly as demand falters. The quick payback – 2 to 3 years – on these investments allow the producers to expand and contract output without the massive risks longer-lived conventional assets impose. As OPEC 2.0's spare capacity is returned to the market, this will be a welcome feature of a market that most likely will require oil and gas supplies for decades, despite the uncertainty attending oil-and-gas capex during the transition to a low-carbon energy future. Chart 7Permian Replaces North Sea Losses
Permian Replaces North Sea Losses
Permian Replaces North Sea Losses
Bottom Line: As the future of hydrocarbons evolves, the LNG and crude oil exported from the US Gulf will occupy an increasingly important role in these markets. Oil and gas producers are making capex decisions under increasingly uncertain conditions, which favor exactly the type of resources that have propelled the US to the position of the world's largest producer of these fuels – i.e., shale-oil and -gas. Production from these resources can be ramped up and down quickly as prices dictate, and have quick paybacks (2-3 years), which means capital is not tied up for decades as a return is earned.7 Robert P. Ryan Chief Commodity & Energy Strategist rryan@bcaresearch.com Ashwin Shyam Research Associate Commodity & Energy Strategy ashwin.shyam@bcaresearch.com Commodities Round-Up Energy: Bullish OPEC 2.0 begins returning 2mm b/d to the market this month, expecting to be done by July. Half of these volumes are accounted for by Saudi Arabia, which voluntarily cut output by 1mm b/d earlier in the year to help balance the market. In line with our maintained hypothesis that OPEC 2.0 prefers prices inside the $60-$70/bbl price band, we expect the return of curtailed production to be front-loaded so as to bring prices down from current levels approaching $70/bbl for Brent (Chart 8). If, as we expect, demand recovers sooner than expected as Europe leans into its vaccination program, additional barrels will be returned to the market to get prices closer to a $60-$65/bbl range. Base Metals: Bullish The International Copper Study Group (ICSG) forecast copper mine production will increase by ~ 3.5% in 2021 and 3.7% in 2022, after adjusting for historical disruption factors. This forecasted increase – after three years of flat mined production growth – is due to a ramp-up of recently commissioned and new copper mines becoming operational in 2021. An improvement in the pandemic situation by 2022 will also boost mined copper production, according to the ICSG. 2020 production remained flat as recoveries in production in some countries due to constrained output in 2019 balanced the negative impacts of the pandemic in others. In Chile, the largest copper producer, state-owned Codelco and Collahuasi reported strong results in March. However, this was countered by a continued downturn at BHP’s Escondida. The world’s largest copper mine saw a drop in production for the eighth consecutive month. This mixed output resulted in a decline in total production of 1.2% year-on-year in March. Precious Metals: Bullish COMEX palladium touched a record high during intraday trading on Tuesday, reaching $3,019/oz due to continued tight market conditions (Chart 9). On the supply side, Nornickel is recovering from flooded mines, which occurred in February. By mid-April, one of the two affected mines was operating at 60% capacity; however, the company's other mine is only expected to come back online by early June. On the demand side, strength in US vehicle sales and a global economic recovery from the pandemic buoyed the metal used in catalytic converters. Palladium prices closed at $2,981.60/oz on Tuesday. Ags/Softs: Neutral Corn again traded above $7/bu earlier in the week on the back of drought-like dry weather conditions in Brazil's principal growing regions and surging US exports, according to Farm Futures. Chart 8
Brent Prices Going Up
Brent Prices Going Up
Chart 9
Palladium Prices Going Up
Palladium Prices Going Up
Footnotes 1 Stronger demand from China – where consumption is expected to rise more than 8% yoy – and EM Asia will continue to support LNG demand through the year. S&P Global Platts Analytics expects Chinese natural gas demand to reach 12,713 Bcf in 2021, up 8.4% from the previous year. Chinese national oil company Sinopec is slightly more conservative in its outlook, expecting gas demand of ~ 12,006-12,184 Bcf in 2021, up 6-8% from 2020. China’s average annual increase in natural gas demand is expected to exceed 716 Bcf in the 14th FYP and reach 15,185 Bcf in 2025. 2 Please see CIF Brent Benchmark? published 3 March 2021 by the Oxford Institute for Energy Studies for a discussion. 3 In Chart 3, we plot a rough measure of coal- vs natgas-fired generation economics for these fuels based on their average operating heat rates published by the EIA. We would note that a carbon tax would erase much of the benefit accruing to coal at this point in time. 4 Please see NOAA's Global Climate Report - March 2021. 5 Please see Low Rider - Corpus Christi's Ship Channel Dredging Will Streamline Crude Oil Exports published by RBN Energy 3 May 2021. 6 The OIES analysis cited above concludes, "… the volumes of the FOB deliverable crudes are diminishing and some change, bolstering the contract is certainly needed. The most likely compromise is to retain the existing FOB Brent with an inclusion of CIF WTI Midland assessment, netted back to an FOB equivalent North Sea value." We agree with this assessment. Please see CIF Brent Benchmark? published 3 March 2021 by the Oxford Institute for Energy Studies, p. 8. 7 Please see Is shale activity actually profitable? Size matters, says Rystad published 7 February 2019. Investment Views and Themes Strategic Recommendations Tactical Trades Commodity Prices and Plays Reference Table Trades Closed in 2021 Summary of Closed Trades
Higher Inflation On The Way
Higher Inflation On The Way
Highlights A slower money and credit growth in China will eventually generate disinflationary pressures by weighing on demand for commodities. The PBoC has shifted its inflation anchor and policy framework to target core CPI and the PPI rather than headline CPI. Beijing is scaling back its fiscal supports and cooling the property sector to tackle local government and housing sector debt issues. In the next six to nine months we favor companies and sectors that will benefit from global economic recovery rather than China’s domestic demand. We are long CSI500 relative to China’s A shares. The CSI500 has a larger exposure to the global economy and lower valuation relative to China’s broad onshore market. Feature As a follow up to last week’s report, we look at another topic raised in recent client meetings: whether rapidly rising producer prices in China will morph into a broad-based inflationary risk and how macroeconomic policies will evolve to counter such a risk. Clients who believe that the ongoing producer price inflation is transitory cited China’s low consumer price inflation, and slowing money and credit growth, as leading indicators of budding disinflationary pressures. Advocates of sustained inflation pointed to robust recoveries and demand among advanced economies, extremely accommodative monetary conditions worldwide, massive fiscal stimulus in the US, a weak US dollar, and supply constraints. It remains to be seen what the worldwide pandemic’s impact will be on the balance between global production capacity and aggregate demand. In this report we analyze the PBoC’s inflation target and policy framework, and conclude that while China’s monetary policy has not become more hawkish, policy tightening seems to be taking place on the fiscal front. Is Inflation In China A Risk? It is debatable whether the strong rebound in GDP growth in Q4 last year and in Q1 this year has closed China’s output gap and will lead to widespread inflation. Given data distortions due to low-base effects from the previous year and uncertainty about China’s productivity and labor force growth, any calculation of the output gap will be unreliable. In addition, China’s employment statistics lack cyclicality and cannot be used to gauge inflationary pressure stemming from wage growth and unit labor costs. Chart 1A Rollover In Credit Growth Will Weigh On Chinese Demand For Commodities
A Rollover In Credit Growth Will Weigh On Chinese Demand For Commodities
A Rollover In Credit Growth Will Weigh On Chinese Demand For Commodities
Our cyclical view of inflation is therefore based on the framework that the ongoing moderation in China's money and credit growth will eventually generate disinflationary pressures by weighing on the country’s demand for and price of commodities (Chart 1). Furthermore, behind a resilient PPI, there are suggestions that the strength in China’s economy is still bifurcated. A narrow-based uptrend in the PPI lacks the ground for sustained inflation, and is unlikely to trigger a general tightening in monetary policy. While mounting global prices for raw materials propelled strong upstream PPI, producer prices for consumer goods and core consumer price inflation remain very subdued (Chart 2). The inconsistency in producer prices among various industries highlight the unevenness of the economic recovery and, importantly, persistently muted household consumption (Chart 3). Chart 2A Bifurcated Economic Recovery
A Bifurcated Economic Recovery
A Bifurcated Economic Recovery
Chart 3A Muted Recovery In Household Consumption
A Muted Recovery In Household Consumption
A Muted Recovery In Household Consumption
Chart 4Weak Price Transmission From Upstream To Downstream Industries
Weak Price Transmission From Upstream To Downstream Industries
Weak Price Transmission From Upstream To Downstream Industries
The transmission from upstream industrial PPI to the middle and downstream sectors has also been weak (Chart 4). It is evidenced in the faster growth of manufacturing output volume compared with price increases (Chart 5). This contrasts with the previous inflationary cycles, as well as mining and ferrous metals where surging prices for raw materials have way surpassed recovery in output volume (Chart 6). Given that price changes are more important to corporate profits than volume changes, Chinese middle-to-downstream industries face downward pressure on their profit margins and will likely deliver disappointing profits, despite a strong rebound in production. Chart 5China's Manufacturing Recovery: Stronger Volume Than Prices
China's Manufacturing Recovery: Stronger Volume Than Prices
China's Manufacturing Recovery: Stronger Volume Than Prices
Chart 6China's Upstream Industries: Prices Surged Faster Than Production
China's Upstream Industries: Prices Surged Faster Than Production
China's Upstream Industries: Prices Surged Faster Than Production
Furthermore, PMI input prices, which lead core CPI by about nine months, rolled over in April (Chart 7). While it is too soon to conclude that input prices have peaked, it is implied that upward pressure on core CPI from input prices may start to ease in 2H21. Bottom Line: So far there is no sign that elevated upstream producer prices will create sustainable inflationary pressure on consumer prices. Hence our view is that the PBoC will not respond to a rising PPI by further tightening monetary policy. Chart 7PMI Input Prices Have Rolled Over
PMI Input Prices Have Rolled Over
PMI Input Prices Have Rolled Over
Chart 8Core CPI And PPI Have Been The PBoC's Inflation Targets Since 2015
Core CPI And PPI Have Been The PBoC's Inflation Targets Since 2015
Core CPI And PPI Have Been The PBoC's Inflation Targets Since 2015
The PBoC’s Inflation Target Since 2015, China’s monetary tightening cycles have closely correlated with a combination of the core CPI and PPI instead of headline CPI (Chart 8). The shift to targeting core CPI and PPI occurred despite the central bank’s frequent mention of headline CPI as its inflation target. The reasons for the shift are twofold. First, swings in food and fuel prices have become much larger since 2014, often dominating fluctuations in headline CPI (Chart 9). Secondly, the price swings were often driven by supply-side factors and did not reflect changes in demand. Therefore, monetary policies could do little to mitigate inflationary or deflationary pressures. Furthermore, the PPI seems to play a greater role in the PBoC’s monetary policymaking than the headline and core CPI (Chart 10). The tighter relationship between the de facto policy rate and the PPI is not surprising, given that China’s ex-factory price inflation reflects changes in corporate pricing, profit, and inventory cycles – all are driven by the country’s money supply and credit cycles. Chart 9Large Swings In Food And Energy Prices Distorted Headline CPI In Recent Years
Large Swings In Food And Energy Prices Distorted Headline CPI In Recent Years
Large Swings In Food And Energy Prices Distorted Headline CPI In Recent Years
Chart 10PPI Plays A Greater Role In The PBoC's Monetary Policymaking
PPI Plays A Greater Role In The PBoC's Monetary Policymaking
PPI Plays A Greater Role In The PBoC's Monetary Policymaking
The relationship between the 7-day repo rate - the de jure policy rate - and the PPI has broken down since 2015 (Chart 11). Meanwhile, the 3-month repo rate has maintained a close relationship with the PPI (Chart 10, bottom panel). The change in the relationship is because the PBoC shifted its policy to target interest rates instead of the quantity of money supply since 2015 (Chart 12). Moreover, since 2016 the PBoC has generated monetary policy tightening measures through changes in its Macro Prudential Assessment Framework (MPA) rather than directly through interest rate hikes. Chart 11Relationship Between The 7-Day Repo Rate And The PPI Has Broken Down Since 2015...
Relationship Between The 7-Day Repo Rate And The PPI Has Broken Down Since 2015...
Relationship Between The 7-Day Repo Rate And The PPI Has Broken Down Since 2015...
Chart 12...Due To Monetary Policy Regime Shifted
...Due To Monetary Policy Regime Shifted
...Due To Monetary Policy Regime Shifted
Bottom Line: The PBoC has shifted its inflation anchor and policy framework since 2015. Core CPI and the PPI are now the main inflation targets. A Quiet Fiscal Tightening? Despite a jump in the PPI, the 3-month repo rate fell sharply in the past two months (Chart 10 on page 6, bottom panel). It is possible that the PBoC considers escalating producer prices as transitory and, therefore, intends to keep its overall policy stance unchanged. However, the PBoC’s relaxed policy response towards inflation risk may be explained by Beijing’s quiet tightening on the fiscal front. Chart 13The Central Bank Has Made Little Interbank Liquidity Injections Lately
The Central Bank Has Made Little Interbank Liquidity Injections Lately
The Central Bank Has Made Little Interbank Liquidity Injections Lately
The PBoC can hold its policy rates steady by supplying adequate liquidity to the interbank system through open market operations or by reducing the demand for liquidity. On a net basis, the PBoC has recently injected very little liquidity into the interbank system, implying that banks’ liquidity demand has likely softened (Chart 13). This might be a sign of weakening credit origination. In a previous report we discussed how fiscal stimulus has become a more relevant driver of China’s credit origination since the onset of the 2014/15 economic downcycle. A rising 3-month SHIBOR can be the result of rapid fiscal and quasi-fiscal expansions, which occurred in Q3 last year. A flood of local government bond issuance drained liquidity from commercial banks, which boosted the banks’ needs to borrow money from the interbank system and pushed up interbank rates. Despite higher interest rates, credit growth soared in Q3 as fiscal multiplier provided an imminent and powerful reflationary force to the economy. In contrast, local government bond issuance was down sharply in the first four months of this year, compared with 2019 and 2020. Local governments sold 222.7 billion yuan of special-purpose bonds (SPBs) from January to April, a plunge from 730 billion yuan of debt sold in the same period in 2019 and 1.15 trillion yuan in 2020. The total local government bond issuance in Q1 this year has also been 36% and 44% lower than in Q1 2019 and 2020, respectively. A lack of local governments’ appetite to borrow coupled with a shortage in profitable infrastructure projects might have contributed to the sharp drop in bond issuance this year. Local government financing and spending have been under increased scrutiny this year. Following the State Council Executive Meeting in late March, in which Premier Li Keqiang pledged to reduce government leverage ratio and raise regulatory standards on infrastructure investment, Beijing suspended two high-speed rail projects that were initiated by provincial governments. Messages from Politburo’s meeting last week reinforced our view that policymakers may be scaling back fiscal support while further tightening regulations in the property sector. Both aspects have the potential to cool China’s demand for industrial metals and global industrial material prices (Chart 14 and Chart 15). Chart 14A Slowdown In Chinese Manufacturing Demand Will Have A Greater Impact On Global Industrial Material Prices
A Slowdown In Chinese Manufacturing Demand Will Have A Greater Impact On Global Industrial Material Prices
A Slowdown In Chinese Manufacturing Demand Will Have A Greater Impact On Global Industrial Material Prices
Chart 15Lower Housing Demand In China Will Help To Cool Industrial Metal Prices
Lower Housing Demand In China Will Help To Cool Industrial Metal Prices
Lower Housing Demand In China Will Help To Cool Industrial Metal Prices
We expect the intensity of policy tightening to reach its peak between mid-year to third-quarter 2021. It is unclear at this point whether policymakers are willing to allow local governments to significantly undershoot their SPB quota for this year. Local governments reportedly experienced a shortage in profitable investment projects towards the end of last year, and thus, parked more than 10% of proceeds from 2020 SPB issuance at the central bank. The central government may be taking a wait-and-see attitude this year, and saving more fiscal dry powder for later this year when the economic slowdown becomes more meaningful. Bottom Line: Beijing is pulling back its fiscal supports and cooling the property sector to tackle local government and housing sector debt issues. The deleveraging efforts will curb China’s demand for commodities, and may work to ease inflationary pressure on prices for raw materials. Investment Conclusions The outlook for China’s risk asset prices remains bearish, at least in the next six months. If the credit and fiscal impulse slow enough to depress corporate pricing power, inflation will not be a problem because disinflationary pressures will resurface. However, the growth of corporate profits will disappoint (Chart 16). Beijing may be saving more fiscal dry powder for later this year. Still, SPBs are only a small part of local governments’ financing source for infrastructure projects. Given the central government’s renewed focus on reducing public debt, policymakers are unlikely to unleash fiscal power to significantly boost infrastructure spending or economic growth. In the next six to nine months, we favor companies and sectors that will benefit from global economic recovery rather than China’s domestic demand. With this week's report, we initiate a long position on the CSI500 index, which has a larger exposure to the global market and lower valuation relative to China’s broad onshore market (Chart 17). Chart 16Aggregate Corporate Profit Growth Will Slow Even Though Inflation Is No Longer An Issue
Aggregate Corporate Profit Growth Will Slow Even Though Inflation Is No Longer An Issue
Aggregate Corporate Profit Growth Will Slow Even Though Inflation Is No Longer An Issue
Chart 17Long CSI500/Broad Market
Long CSI500/Broad Market
Long CSI500/Broad Market
Jing Sima China Strategist jings@bcaresearch.com Cyclical Investment Stance Equity Sector Recommendations