China

Dear client, Next week, in lieu of our weekly report, I will be hosting a webcast on Tuesday, March 30 at 9:00 am HKT and Tuesday, March 30 at 10:00 am EDT. In the webcast, I will share our outlook on China’s post-pandemic economic and policy dynamics. Best regards, Jing Sima, China Strategist Highlights China is aiming for a massive adoption of new energy vehicles (NEVs) to help achieve its 2030 peak carbon dioxide emissions target. The country’s NEV share of total vehicle sales will likely rise significantly to 40% in 2030, from only 5.4% in 2020. This will translate into a compound annual growth rate (CAGR) of 24%-25% in Chinese NEV sales in this decade. China will become increasingly competitive and important in the global NEV supply chain. The country will maintain its leading position in global electric vehicle battery production while reducing its dependence on imported auto chips. The Chinese NEV production/sales boom will likely reduce the country’s crude oil consumption while increasing the country’s copper demand during 2021-2030. It will also impact more positively on nickel and lithium demand than on cobalt demand. The Chinese NEV stocks could be a good long-term investment, but we recommend waiting for a better entry point. Feature China's production and sales of new energy vehicles (NEVs) have ranked first in the world for six consecutive years. The country’s NEV sales quadrupled during 2015-2020, propelled by supporting policies such as significant amounts of subsidies to buyers. We believe China will continue to be the leader in both global NEV sales and production this decade. The country’s NEV production and sales will get supercharged by continuing favorable polices and increasing consumers’ interest in NEVs. Many market-driven factors, including falling NEV prices, longer driving range per charge, rapid expansion in the NEV charging/battery-swapping network, as well as new functions including autonomous driving and more software applications-based services, will accelerate NEV adoption in China during 2021-2030. According to the country’s NEV development roadmap, the NEV share of total vehicle sales in China aims to rise to at least 40% in 2030, from only 5.4% in 2020. This will likely translate to a compound annual growth rate (CAGR) of 24%-25% in Chinese NEV sales in this decade. In 2030, the NEV sales in units could be eight to nine times its 2020 level, rising from 1.37 million units to 12-13 million units (Chart 1). Benefiting from the massive scale of the domestic NEV market, China will become increasingly competitive and important in the global NEV supply chain. The country will maintain its leading position in global electric vehicle battery production while reducing its dependence on imported auto chips. The Chinese NEV production/sales boom will help reduce transportation fuel consumption, leading to less carbon dioxide emissions (Chart 2). Chart 1Chinese NEV Sales: A Supercharged Decade Ahead
Chinese NEV Sales: A Supercharged Decade Ahead
Chinese NEV Sales: A Supercharged Decade Ahead
Chart 2China: Booming NEV Sales Reduce Oil Demand, Leading To Less CO2 Emissions
China: Booming NEV Sales Reduce Oil Demand, Leading To Less CO2 Emissions
China: Booming NEV Sales Reduce Oil Demand, Leading To Less CO2 Emissions
In addition, the country’s copper demand will likely be increase due to booming NEV production during 2021-2030. Meanwhile, the impact will be more positive on nickel and lithium demand than on cobalt demand. Given such significant growth ahead for the Chinese NEV market, we believe Chinese NEV-related stocks are a potential good buy, but we recommend waiting for a better entry point. China’s NEV Market: A Supercharged Decade Chinese NEV market is entering a supercharged decade (Box 1). Box 1 Our Forecast Of China’s NEV Sales In 2030 Our estimates of China’s NEV sales in 2030 were derived from two assumptions. First, we assume the NEV share of total Chinese automobile sales in 2030 to be 40%. Based on last October’s report, “Technology Roadmap 2.0 for Energy-Saving and New Energy Vehicles,” published by the China Society of Automotive Engineers (China-SAE), the China-SAE projects that NEVs will account for at least 40% of total automobile sales in China in 2030. The China-SAE is under the supervision of the Ministry of Industry and Information Technology (MIIT). Second, as car ownership – the share of households owning one car – has already risen to over 50% in China, we assume the CAGR of the country’s automobile sales will slow to 1.5%-2.5% in the next decade from 3.4% in the past decade. Based on this assumption, China’s automobile annual sales will likely increase to 29-32 million units in 2030. What Are The Underlying Drivers For Such Significant Growth? First, the interest in buying a NEV is rapidly growing in China. In a September 2020 survey done by Roland Berger, 80% of surveyed potential car buyers in China were considering buying an electric vehicle as their next car, the highest among major economies (Chart 3). Last year, this surveyed number for China was only 60%. We believe this shift in buying intention will continue and will consequently translate into a boom in NEV sales during 2021-2030. NEV battery costs have decreased by nearly 90% since 2010 and will continue to fall (Chart 4). This will drive down average NEV selling prices as the battery in general accounts 40-45% of the total production cost of NEVs, thereby making them more appealing to buyers. Chart 3China: Rising Interest In NEV Purchases
Implications Of China’s 2030 CO2 Peak Emission Target (Part II: New Energy Vehicles)
Implications Of China’s 2030 CO2 Peak Emission Target (Part II: New Energy Vehicles)
Chart 4NEV Battery Costs Will Continue To Fall
NEV Battery Costs Will Continue To Fall
NEV Battery Costs Will Continue To Fall
The average driving range per charge for NEVs will continue to rise. The average driving mileage per charge in China has nearly doubled, from 190km in 2016 to 360km in 2019.1 Currently, a growing proportion of NEV vehicles on the market can even achieve a mileage of 600km and above with a single charge. This is already comparable to traditional gasoline-powered vehicles, which can also cover approximately 600km per fuel tank. More models with a wide range of selling prices will soon be on the market. Last June, the cheapest electric car with a selling price of only RMB 28,800 (about US$4,000) was released into the Chinese market. Since then the sales of this model have quickly surpassed the Tesla Model 3 to become the hottest seller in China. This shows consumer enthusiasm for affordable NEVs. In the meantime, the success of Tesla electric cars in China demonstrated Chinese consumers’ strong interest in high-quality and expensive NEVs. Chart 5China Has The Most NEV Models In The World
Implications Of China’s 2030 CO2 Peak Emission Target (Part II: New Energy Vehicles)
Implications Of China’s 2030 CO2 Peak Emission Target (Part II: New Energy Vehicles)
Chart 5 shows that China is the country with most electric vehicle models in the world. The number of available electric vehicle models was 227 in China in 2019, significantly higher than all other individual countries. According to McKinsey, more than 250 new battery electric vehicle (BEV) and plug-in hybrid electric vehicle (PHEV) models will be introduced in the next two years alone. Most of these models will likely be sold in China, adding more purchase options for Chinese consumers. Faster charging time for EV batteries as well as expanding charging/battery-swapping networks are in the making. This will greatly reduce recharge waiting time for NEV drivers. Chart 6Chinese NEV Charging Infrastructure: The Rapid Expansion Will Continue
Implications Of China’s 2030 CO2 Peak Emission Target (Part II: New Energy Vehicles)
Implications Of China’s 2030 CO2 Peak Emission Target (Part II: New Energy Vehicles)
Based on the data from the China Electric Vehicle Charging Infrastructure Promotion Alliance (EVCIPA), the number of both public and private charging poles has increased significantly from 2015 to 2020. In addition, the number of private ones has already exceeded the number of public ones each year since 2017 (Chart 6). The rapid expansion in the country’s charging station network will continue. The number of total charging poles will likely rise from 1.7 million units to the government’s target of 5 million units in 2025. In addition, Wood Mackenzie last May forecasted this number could reach 9.8 million units in 2030. Roland Berger last September reported that the number of charging locations per 100 km of roadway was about 6.1 in China, significantly higher than 2.2 in Germany and 0.5 in the US (Chart 7). In terms of the number of charging stations per 1000 NEVs, China has also significantly exceeded other major automobile producing countries (Chart 8). Chart 7The Number Of Charging Locations Per 100 km Of Roadway Is Higher In China Than In Many Other Countries…
Implications Of China’s 2030 CO2 Peak Emission Target (Part II: New Energy Vehicles)
Implications Of China’s 2030 CO2 Peak Emission Target (Part II: New Energy Vehicles)
Chart 8…The Same Is True Of The Number Of Charging Stations Per 1,000 NEVs
Implications Of China’s 2030 CO2 Peak Emission Target (Part II: New Energy Vehicles)
Implications Of China’s 2030 CO2 Peak Emission Target (Part II: New Energy Vehicles)
Meanwhile, the Chinese government is also promoting an expansion of battery-swapping networks. The Chinese auto manufacturer Nio has been the leader in this area. The company currently has a network of 178 battery-swapping stations located in and between major cities such as Beijing and Shenzhen; by the end of the year, it plans to have 500 stations. The battery-swapping time for the Nio EV now can be as fast as 90 seconds, even faster than fueling up with gasoline. EVs will become increasingly equipped with functions such as autonomous driving and more software applications-based services. EVs will also become more integrated with intelligent and interactive networks. All these features will make EVs more attractive to automobile buyers. Second, with the 2030 target for peak emissions, the Chinese authorities will likely continue to develop favorable polices for the domestic NEV sector. China’s key policy support tools for NEVs include tax reductions, direct subsidies to manufacturers, consumer subsidies, and mandated government procurements. In the past, China has provided immense support for NEVs by spending billions of dollars on direct subsidies to manufacturers2 and on consumer subsidy programs.3 In the future, the country’s policy focus will be on NEV charging/battery-swapping network development as well as on NEV-related technology research and investment. For example, since 2019, auto manufacturers have received credits for each NEV produced. The credits take into consideration factors such as the type of vehicle, as well as its maximum speed, energy consumption, weight, and range. This measure will encourage NEV automakers to put more emphasis on technological change. These government supports of technology and network development, coupled with strong interest in NEV purchases by domestic consumers, should offset the impact of the government’s reduced direct subsidies for NEV production and sales. China has reduced overall direct subsidies to both NEV manufacturers and consumers, and vehicles must meet minimum technical and performance criteria to qualify. In 2021, subsidies will be reduced by 20% on NEVs for personal use, and by 10% on NEVs for public transport, including buses and taxis, from their respective 2020 level. In addition, NEV subsidies and tax exemptions will expire at the end of 2022 and subsidies will be limited to 2 million NEVs per year from 2020 to 2022. A vehicle price limit for passenger cars of CNY300,000 has also been introduced. The NEV subsidy level is currently less in China than in European countries as well as in the US, showing the Chinese NEV market’s diminishing dependence on subsidies. Bottom Line: The country’s NEV production and sales will get supercharged by continuing favorable polices and by increasing consumer interest in NEVs during 2021-2030. We expect China’s NEV sales to reach 12 to 13 million units in 2030, eight to nine times its 2020 level of 1.37 million units. Growing China’s Competitiveness In The Global NEV Supply Chain The global NEV market has two main subsectors – plug-in hybrid electric vehicles (PHEV) and battery electric vehicles (BEV). The former can be operated in either the electric-powered mode or internal-combustion engines (ICE) mode. The BEVs can only run in electric mode and are also called pure electric vehicles. Traditional ICE vehicle manufacturers from Europe, US, Japan, and South Korea have more competitive advantages in the global PHEV subsector supply chain due to their long-term dominance in the global traditional ICE vehicle market. Chart 9BEVs Account For Over 80% Of Chinese NEV Sales
BEVs Account For Over 80% Of Chinese NEV Sales
BEVs Account For Over 80% Of Chinese NEV Sales
China has been putting more focus on the new BEV market as it has enabled a level playing field with traditional ICE vehicle players. Hence, China has stronger competitiveness in the global BEV subsector. BEVs account for approximately 82% of Chinese NEV sales (Chart 9). According to China-SAE, this ratio could reach 95% by 2035 as China will increase its development of the BEV market and the adoption of BEV vehicle options. We expect China’s competitiveness will continue to grow along the global NEV supply chain, especially in the BEV subsector. Having the largest domestic NEV market in the world gives China the advantage of attracting NEV manufacturers and building a more integrated global supply chain. During 2017-2020, accumulated world NEV sales were about 8.8 million units, with the largest share of 49% coming from China, higher than 31% for Europe and 14% for the US (Chart 10). China is the largest NEV battery producer in the global NEV supply chain. The battery is the most important component of a NEV, and its technological progress holds the key to transitioning away from fossil fuel dependence. Data shows that six out of the world’s top ten NEV battery producers are Chinese companies, together accounting for 41% of global battery sales in kwh last year (Chart 11). Chinese company CATL has been the largest NEV battery producer for the past four years. Chart 10China Has The Largest NEV Market In The World
Implications Of China’s 2030 CO2 Peak Emission Target (Part II: New Energy Vehicles)
Implications Of China’s 2030 CO2 Peak Emission Target (Part II: New Energy Vehicles)
Chart 11Chinese Companies: Major Players In The Global NEV Battery Market
Implications Of China’s 2030 CO2 Peak Emission Target (Part II: New Energy Vehicles)
Implications Of China’s 2030 CO2 Peak Emission Target (Part II: New Energy Vehicles)
The development of charging/battery-swapping infrastructure will continue to be faster in China than in other countries/regions due to the country’s much larger scale of EV users and related policy support. This allows China to collect more NEV charging-related data, which may be used to improve the country’s NEV manufacturing process, charging pole production, and the country’s charging infrastructure development. The development of the 5G network is much more advanced in China than in any other countries. This allows NEV makers to work closely with IT/internet companies such as Huawei, Baidu, Tencent and Alibaba to test integrated applications such as the autonomous driving and AI functions of NEVs. This will help promote the technology advancement related to NEVs in all aspects in China. Chart 12Chinas NEV Net Exports Are Set To Go Up
Chinas NEV Net Exports Are Set To Go Up
Chinas NEV Net Exports Are Set To Go Up
Due to its competitive advantages, China has become a net exporter of electric vehicles (Chart 12). In 2019, Chinese NEV sales abroad accounted for only 1.7% of the world total in US dollar terms, far below the US (31%), Germany (15%), and South Korea (9%). We expect growing competitiveness will allow China to gain share in global NEV exports. The area China needs to work on the most along the NEV supply chain is the design/manufacturing of automotive chips. There is still no Chinese company among the top ten global auto chip semiconductor companies based on sales revenue (Chart 13). Chart 13China’s Greatest Weaknesses Lie In Automotive Chip Design/Manufacturing
Implications Of China’s 2030 CO2 Peak Emission Target (Part II: New Energy Vehicles)
Implications Of China’s 2030 CO2 Peak Emission Target (Part II: New Energy Vehicles)
Non-Chinese companies account for about 90% of the global auto chip supply while China contributes no more than 5%. The current automotive chip shortage has done much more severe damage to automakers in China than in any other country. Bloomberg recently reported the global auto industry might lose US$61 billion of 2021 sales from chip shortages, with 42% of the losses from China. In the recent National People’s Congress, the Chinese government reiterated the importance of addressing this weak link, with an urgency on reducing the country’s dependence on foreign auto chips. Bottom Line: China will become globally more competitive in the NEV supply chain. Impact On Commodity Markets The evolution in China’s NEV markets in this decade will have various impacts on commodities such as crude oil, copper, nickel, cobalt, and lithium. During 2021-2030, massive NEV adoption will only modestly reduce Chinese crude oil consumption for the transportation sector, while significant growth in NEV/charging pole/battery production will increase the country’s copper demand. Meanwhile, as NEV battery production requires raw materials including nickel, cobalt and lithium, rapid growth in NEV battery production will also have different impacts on these commodity markets. Crude oil: In 2019, the total number of vehicles in China was 252.6 million units and the country’s total gasoline and diesel consumption was about 6,800 thousand barrels per day (kbpd) of crude oil equivalent. This equals 26.7 kbpd per 1000 vehicles. Annual NEV sales in China will rise from 1.37 million units in 2020 to about 12 million units in 2030. Assuming all these NEVs are only using their electric battery, this will cut oil consumption/imports by an increasing amount every year, ranging from 50 kbpd in 2021 to 320 kbpd in 2030. The reduction from increased NEV sales will have a relatively minuscule impact on China’s total crude oil imports. A 50-kbpd reduction in 2021 would account for less than half a percent of China’s 2020 crude oil imports. By 2030, this number could potentially rise to 1-3%, but is still insignificant. Copper: An average gasoline powered car uses only about 20kg of copper, while a hybrid car uses about 40 kg and a fully electric car uses roughly 80kg. In addition, NEV batteries and charging station chargers also require copper. Table 1 shows our rough calculation of the copper demand from the expansion of Chinese NEV market. Chinese copper demand may increase by 210 thousand tons in 2021 and by about 1,500 thousand tons in 2030. To put this into perspective, China consumed about 15 million tons of copper in 2020 based on World Bureau of Metal Statistics (WBMS) data. The increase in copper demand in 2021 is only 1.4% of 2020 copper consumption in China. However, when it increases to 1,500 thousand tons in 2030, it will account for 10% of China’s current copper consumption. Table 1China's Copper Demand Due To EV Adoption In 2021 And 2030
Implications Of China’s 2030 CO2 Peak Emission Target (Part II: New Energy Vehicles)
Implications Of China’s 2030 CO2 Peak Emission Target (Part II: New Energy Vehicles)
Chart 14Chinas NEV Boom Will Have A More Positive Impact On Nickel And Lithium Demand Than On Cobalt Demand
Chinas NEV Boom Will Have A More Positive Impact On Nickel And Lithium Demand Than On Cobalt Demand
Chinas NEV Boom Will Have A More Positive Impact On Nickel And Lithium Demand Than On Cobalt Demand
Nickel: The NEV battery technology is on a trend to reduce the use of cobalt given its high price and limited supply, while increasing the use of nickel. This will be a long-term positive factor for nickel prices (Chart 14, top panel). Cobalt: EV battery makers are trying to reduce or even avoid the use of cobalt. In the next couple of years, the demand for cobalt will likely remain strong as the technology of non-cobalt batteries is still in the developing stage. Non-cobalt batteries in development include solid-state , lithium-sulphur, sodium-ion and lithium-air batteries. However, cobalt prices may face increasing headwinds in the longer term (Chart 14, middle panel). Lithium: Lithium is a very abundant mineral produced from either brines or hard rock sources, with products from clays also in the pipeline. There is no structural constraint on global lithium production. Lithium prices may remain elevated in the near term but as the supply catches up over a longer run, we expect lithium prices to go down (Chart 14, bottom panel). Bottom Line: The massive growth in the Chinese NEV market in this decade will have a small negative impact on crude oil demand and a more positive impact on commodity demand such as copper, nickel, cobalt, and lithium. However, cobalt may face a substitution risk due to its elevated prices while lithium may face the risk of increasing supply. Investment Implications On NEV-related Stocks Chart 15The Chinese NEV stocks: A Good Long-term Investment, But We Recommend Waiting For A Better Entry Point
The Chinese NEV stocks: A Good Long-term Investment, But We Recommend Waiting For A Better Entry Point
The Chinese NEV stocks: A Good Long-term Investment, But We Recommend Waiting For A Better Entry Point
We believe share prices of the Chinese NEV makers and NEV battery producers will deliver considerable positive long-term returns. The basis for this assumption is that many of them will experience strong revenue growth over this decade. While NEV maker stock prices have recently fallen considerably, we think they are still overpriced and recommend waiting for a better entry point (Chart 15). Ellen JingYuan He Associate Vice President ellenj@bcaresearch.com Footnotes 1Source: “Technology Roadmap 2.0 for Energy-Saving and New Energy Vehicles,” released on October 27, 2020 by the China Society of Automotive Engineers (China-SAE). 2For example, as part of China’s 2012 “Energy-Saving and New Energy Vehicle Industry Development Plan (2012–2020),” the central government allocated over $15 billion to support the development of energy-efficient vehicles and NEVs, pilot car projects, and electric vehicle infrastructure. Source: "Chinese Government Support for New Energy Vehicles as a Trade Battleground", published by The National Bureau of Asian Research" on September 27, 2017. 3For example, the central government had provided 60,000 yuan (approximately $8,700) and 50,000 yuan (approximately $7,250) per car in subsidies for electric vehicles and plug-in hybrid vehicles, respectively, covering 40%–60% of the cost of the vehicle. Local governments also created their own subsidy programs that provided additional discounts for NEV purchases through cash subsidies, free parking, or free license plates. Source: "Chinese Government Support for New Energy Vehicles as a Trade Battleground", published by The National Bureau of Asian Research" on September 27, 2017. Cyclical Investment Stance Equity Sector Recommendations
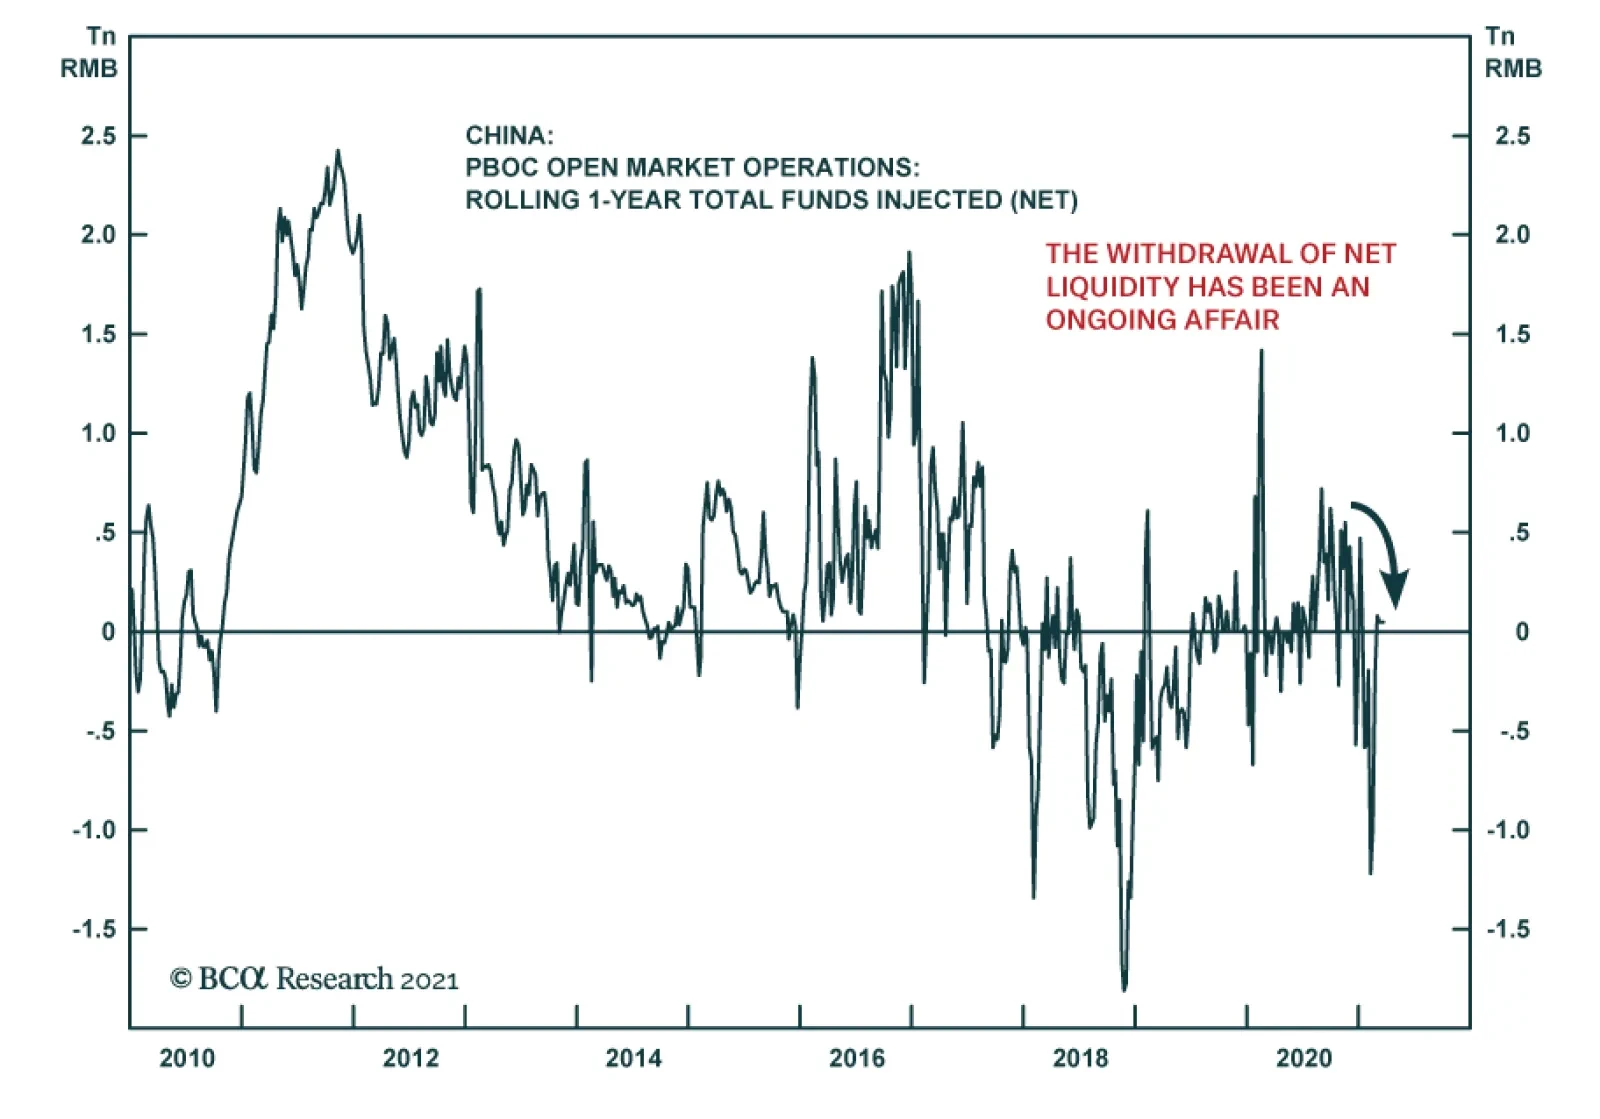
PBoC liquidity injections have been extremely weak recently, with the latest injection among the weakest in the past year. While we expect Beijing to continue tightening policy, this does not signal a further nudge up in hawkishness. For one, the PBoC’s…
Asian equities fell on Friday in part on negative headlines about US-China talks in Anchorage, Alaska. The two sides exchanged barbs, raising fears that a US-China diplomatic reset may not occur. However, there were also rumors that behind closed doors, the…
Highlights The Federal Reserve’s ultra-dovish stance is not the only reason for markets to cheer. The US is booming, China is unlikely to overtighten monetary and fiscal policy, and Europe remains a source of positive political surprises. Still, the cornerstone of this cycle’s wall of worry has been laid: Biden faces a series of foreign policy challenges, the US is raising taxes, China is tightening policy, and Europe’s stimulus is not large enough to qualify as a game changer for potential GDP growth. Stay the course by maintaining strategic pro-cyclical trades yet building up tactical hedges and safe-haven plays. Feature Chart 1US Stimulus, Chinese Tightening, German Vaccine Hiccups
US Stimulus, Chinese Tightening, German Vaccine Hiccups
US Stimulus, Chinese Tightening, German Vaccine Hiccups
The US is turning to tax hikes, China is returning to structural reforms, and Europe is bungling its vaccine rollout. Yet synchronized global debt monetization is nothing to underrate. Especially not in the context of a Great Power struggle that features a green energy race as well as a high-tech race. Governments are generating a cyclical growth boom and it is conceivably that their simultaneous pump-priming combined with a new capex cycle and private innovation could generate a productivity breakthrough. This upside risk is keeping global equity markets bullish even as it becomes apparent that construction has begun on this cycle’s wall of worry. The US dollar bounce should be watched closely in this context (Chart 1). After passing the $1.9 trillion American Rescue Plan Act, which consists largely but not entirely of short-term cash handouts (Chart 2), President Joe Biden’s policy agenda will now turn to tax hikes. Thus far the tax hike proposals are in line with Biden’s campaign literature (Table 1). It remains to be seen whether the market will “sell the news” that Biden is pivoting to tax hikes. After all, Biden was the most moderate of the Democratic candidates and his tax proposals only partially reverse President Trump’s tax cuts. Chart 2American Rescue Plan Act
Building Back … The Wall Of Worry
Building Back … The Wall Of Worry
Table 1Biden’s Tax Hike Proposals On The Campaign Trail
Building Back … The Wall Of Worry
Building Back … The Wall Of Worry
Nevertheless higher taxes symbolize a regime change in the US – it is very unlikely tax rates will go down anytime soon but they could go easily higher than expected in the coming decade – and the drafting process will bring negative surprises, as Treasury Secretary Janet Yellen highlighted by courting Europe to cooperate on a 12% minimum corporate tax and halt the global race to the bottom in taxes on multinational corporations. At the same time Biden’s foreign policy challenges are rising across the board: China is demanding a rollback of Trump’s policies: If Biden says yes, he will sacrifice hard-won American leverage on matters of national interest. If he says no, the Phase One trade deal will be null and void, as will sanctions on Iran and North Korea, and the new economic sanctions on Taiwan will expand beyond mere pineapples.1 Russia is recalling its US ambassador: Biden vowed to make Russia pay for alleged interference in the 2020 US election and sanctions are forthcoming.2 The real way to make Russia pay is to halt the construction of the Nordstream II natural gas pipeline, which reduces the leverage of eastern European democracies while increasing Germany’s energy dependence on Russia. But Germany is dead-set on that pipeline. If Biden levies sanctions the centerpiece of his diplomatic outreach to Europe will be further encouraged to chart an independent course from Washington (though the rest of Europe might cheer). North Korea is threatening to restart missile tests: North Korea is pouring scorn on the Biden administration for trying to restart negotiations.3 The North wants sanctions relief and it knows that Biden is willing to offer it but it may need to create an atmosphere of crisis first. China would be happy were that to happen as it could offer the US its good services on North Korea instead of concrete trade concessions. Iran is refusing to rejoin negotiations over the 2015 nuclear deal: Biden has about five months to arrange for the US and Iran to rejoin the 2015 nuclear deal. Beyond that he will enter into another long negotiation with the master negotiators, the Persians. But unlike President Obama from 2009-15, he will not have support from Russia and China … unless he sacrifices his doctrine of “extreme competition” from the get-go. It is not clear which of these challenges will be relevant to financial markets, or when. However, with US and global equities skyrocketing, it must be said that the geopolitical backdrop is not nearly as reassuring as the Federal Reserve, which announced on Saint Patrick’s Day that it will not hike interest rates until 2024 even in the face of a 6.5% growth rate and the prospect of an additional, yet-to-be passed $2 trillion in US deficit spending. Herein lies Biden’s first victory. He has stressed that boosting the American economy and middle class is critical to his foreign policy. He envisions the US regaining its global standing by defeating the virus, super-charging the economy, and then orchestrating a grand alliance of European and Asian democracies to write new global rules that will put pressure on China to reform its economy. “I say it to foreign leaders and domestic alike. It's never, ever a good bet to bet against the American people. America is coming back. The development, manufacturing, and distribution of vaccines in record time is a true miracle of science.”4 The pandemic and economic part of this agenda are effectively done and now comes the hard part: creating a grand alliance while China and Russia demonstrate to their neighbors the hard consequences of joining any new US crusade. The contradiction of Biden’s foreign policy is his desire to act multilaterally and yet also get a great deal done. The Europeans are averse to conflict with China and Russia. The Russians and Chinese are not inclined to do any great favors on Iran or North Korea. Nobody is opening up their economy – Biden himself is coopting Trump’s protectionism, if less brashly. Cooperation with Presidents Xi Jinping and Vladimir Putin on nuclear proliferation is possible – as long as Biden aborts his democracy agenda and his trade agenda. We continue with our pro-cyclical investment stance but have started building up hedges as we are convinced that geopolitical risk will deliver a rude awakening. This awakening will be a buying opportunity given the ultra-stimulating backdrop … unless it portends war in continental Europe or the Taiwan Strait. In the remainder of this report we highlight the takeaways from China’s National People’s Congress as well as recent developments in Germany. Our key views remain the same: China will not overtighten monetary/fiscal policy; Biden will be hawkish on China; Germany’s election may see an upset but that would be market-positive. China: No Overtightening So Far China concluded its National People’s Congress – the “Two Sessions” of legislation every year – and issued its 2021 Government Work Report. It also officially released the fourteenth five-year plan covering economic development for 2021-25. Table 2 shows the new plan’s targets as compared to the just expired thirteenth five-year plan that covered 2016-20. Table 2China’s Fourteenth Five Year Plan (2021-25)
Building Back … The Wall Of Worry
Building Back … The Wall Of Worry
For a full run-down of the National People’s Congress we recommend clients peruse BCA’s latest China Investment Strategy report. From a geopolitical point of view we would highlight the following takeaways: The Tech Race: China added a new target for strategic emerging industry value added as percent of GDP – it wants this number to reach 17% by 2025 but there is nothing solid to benchmark this against. The point is that by including such a target China is putting more emphasis on emerging industries, including: information technology, robotics, green energy, electric vehicles, 5G networks, new materials, power equipment, aerospace and aviation equipment, and others. China’s technological “Great Leap Forward” continues, with a focus on domestic production and upgrading the manufacturing sector that is bound to stiffen the competition with the United States. China’s removal of a target for service industry growth suggests that Beijing does not want de-industrialization to occur any faster – another reason for global trade tensions to stay high. Research and Development: For R&D spending, previous five-year plans set targets for the desired level. For example, over the last five years China vowed to increase annual R&D spending to 2.5% of GDP. A reasonable expectation for the coming five years would have been a 3% target of GDP. However, this time the government set a target of an annual growth rate of no less than 7% during 2021-2025. The point is that China is continuing to ascend the ranks in R&D spending relative to the US and West in coordination with the overarching goal of forging an innovative and high-tech economy. Unemployment: China has restored an unemployment rate target. In its twelfth five-year plan Beijing aimed to keep the urban surveyed unemployment rate below 5% but over the past five years this target vanished. Now China restored the target and bumped it up slightly to 5.5%. This target should not be hard to meet given the reported sharp decline in urban unemployment to 5.2% already. However, China’s unemployment statistics are notoriously unreliable. The real takeaway is that unemployment will be higher as trend growth slows, while social stability remains the Communist Party’s ultimate prize – and any reform or deleveraging process will occur within that context. The Green Energy Race: China re-emphasized its pledge to tackle climate change, aiming for peak carbon emissions by 2030 and carbon neutrality by 2060. However, no detailed action plans were mentioned. Presumably China will not loosen its enforcement of existing environmental targets. Most of these were kept the same as over the past five years, except for pollution (PM2.5 concentration). Previously the government sought to reduce PM2.5 concentration by 18%. Now the target is set at 10% aggregate reduction, which is lower, though further reduction will be difficult after a 43% drop since 2014. Overall, China has not loosened up its environmental targets – if anything, enforcement will strengthen, resulting in an ongoing regulatory headwind to “Old China” industries. Military Power: Last week we noted that the government’s goals for the military have changed in a way that reinforces themes of persistently high geopolitical tensions. The info-tech upgrades to the People’s Liberation Army were supposed to be met by 2020, with full “modernization” achieved by 2035. However, last October the government created a new deadline, the one-hundredth anniversary of the PLA in 2027 (“military centenary goal”). No specific measures or targets are given but the point is that there is a new deadline of serious importance – an importance that matches the party’s much-ballyhooed centennial on July 1 of 2021 and the People’s Republic’s centennial in 2049. The fact that this deadline is only six years away suggests that a rapid program of military reform and upgrade is beginning. The official defense spending growth target of 6.8% is only slightly bigger than last year’s 6.6% but these targets mask the significance of the announcement. The takeaway is that the Chinese military is preparing for an earlier-than-expected contingency with the United States and its allies. What about China’s all-important monetary, fiscal, and quasi-fiscal credit targets? There is no doubt that China is tightening policy, as we highlight in our updated China Policy Tightening Checklist (Table 3). But will China overtighten? Probably not, at least not judging by the Two Sessions, but the risk is not negligible. Table 3A Checklist For Chinese Policy Tightening
Building Back … The Wall Of Worry
Building Back … The Wall Of Worry
The government reiterated that money and credit growth should remain in a reasonable range in 2021, with “reasonable range” referring to nominal economic growth. Chinese economists estimate that the nominal growth rate will be around 8%-9% in 2021. The IMF projection is 8.1%, while latest OECD forecast is at 7.8%.5 Because China’s total private credit (total social financing) growth is inherently higher than M2 growth, we would use pre-pandemic levels as our benchmark for whether the government will tighten policy excessively: If total social financing growth plunges below 12%, then our view is disproved and Beijing is over-tightening (Chart 3). If M2 growth plunges below 8%, we can call it over-tightening. Anything above these benchmarks should be seen as reasonable and expected tightening, anything below as excessive. However, the Chinese and global financial markets could grow jittery at any time over the perennial risk of a policy mistake whenever governments try to prevent excessive leverage and bubbles. As for fiscal policy, the new quotas for local government net new bond issuance point to expected rather than excessive tightening. New bonds can be used to finance capital investment projects. The quota for total new bond issuance is 4.47 trillion CNY, down by 5.5% from last year. Though local governments may not use up all of the quota, the reduction is small. In fact, total local government bond issuance will be a whisker higher in 2021 than in 2020. The quota for net new bonds is only slightly below the 2020 level and much higher than the 2019 level. Therefore the chance of fiscal overtightening is small – and smaller than monetary overtightening. Chart 3China Policy Overtightening Benchmark
China Policy Overtightening Benchmark
China Policy Overtightening Benchmark
Chart 4China’s Real Budget Deficit Is Huge
Building Back … The Wall Of Worry
Building Back … The Wall Of Worry
China’s official budget balance is a fiction so we look at the IMF’s augmented net lending and borrowing, which reached a whopping -18.2 % of GDP in 2020. It is expected to decrease gradually to -13.8% by 2025. That level will be slightly higher than the pre-pandemic level from 2017-2019 (Chart 4).6 By contrast, China’s total augmented debt is expected to keep rising in the coming years and reach double the 2015 level by 2025. Efforts to constrain debt could lead to a larger debt-to-GDP ratio if growth suffers as a consequence, as our Global Investment Strategy points out. So China will tighten cautiously – especially given falling productivity, higher unemployment, and the threat of sustained pressure from the US and its allies. US-China: Biden As Trump-Lite Chinese and US officials will convene in Alaska on March 18-19. This is the first major US-China meeting under the Biden administration and global investors will watch closely to see whether tensions will drop. So far tensions have not fallen, highlighting a persistent and once again underrated risk to the global equity rally. Biden’s foreign policy team has not completed its review of China policy and Presidents Biden and Xi Jinping are trying to schedule a bilateral summit in April – so nothing concrete will be decided before then. Chart 5US-China: Beijing's Standing Offer
US-China: Beijing's Standing Offer
US-China: Beijing's Standing Offer
The Biden administration is setting up a pragmatic policy, offering areas to engage with China while warning that it will not compromise on democratic values or national interests. China would welcome the opportunity to work with the Americans on nuclear non-proliferation, namely North Korea and Iran, as this would expend US leverage on an area of shared interest while leaving China a free hand over its economic and technological policies. China at least partially enforced sanctions on these countries in response to President Trump’s demands during the trade war and official statistics suggest it continues to do so. Oil imports from Iran remain extremely low while Chinese business with North Korea is, on paper, nil (Chart 5). If this data is accurate then North Korea’s economy has not benefited from China’s stimulus and snapback. If true, then Pyongyang will offer partial concessions on its nuclear program in exchange for sanctions relief. At the moment, instead of staging any major provocations to object to US-Korean military drills, the North is using fiery language and threatening to restart missile tests. This suggests a diplomatic opening. But investors should be prepared for Pyongyang to stage much bigger provocations than missile tests. In March 2010, while the world focused on the financial crisis, the North Koreans torpedoed a South Korean corvette, the Chonan, and shelled some islands, at the risk of a war. The problem under the Trump administration was that Trump wanted a verifiable and durable deal of economic opening for denuclearization whereas the North Koreans wanted to play for time, reduce sanctions, study the data from their flurry of missile tests during the Obama and early Trump years, and see if Trump would get reelected before offering any concrete concessions. Trump’s stance was not really different from Bill Clinton’s but he tried to accelerate the timeline and go for a big win. By Trump’s losing the election North Korea bought four more years on the clock. Chart 6US-China: Biden Lukewarm On China
Building Back … The Wall Of Worry
Building Back … The Wall Of Worry
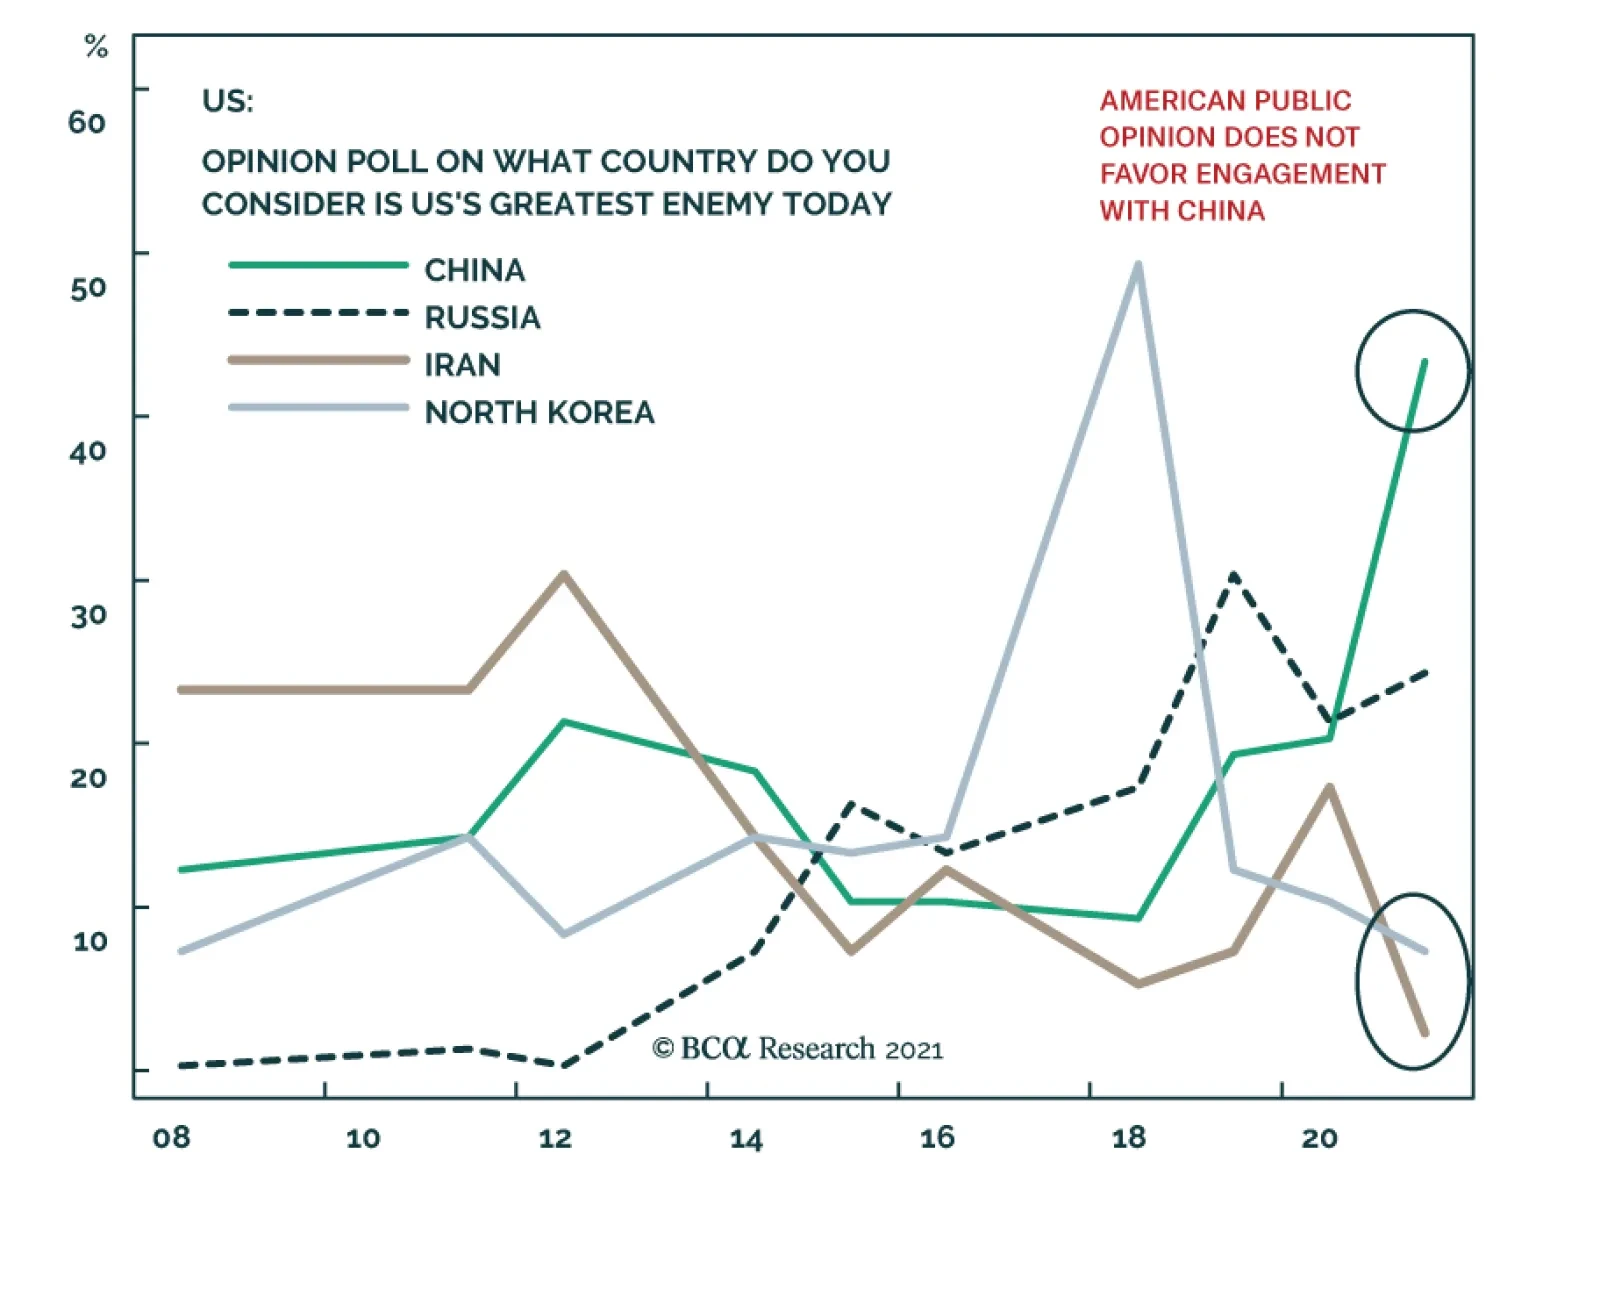
The Biden administration is willing to play for time if it gets concrete results in phases. This would keep North Korea at bay and retain a line of pragmatic engagement with Beijing. But if North Korea stages a giant provocation Biden will not hesitate to use threats of destruction like Clinton and Trump did. The American public is not much concerned about North Korea (or Iran) but is increasingly concerned about China, with a recent Gallup opinion poll showing that nearly 50% view China as America’s greatest enemy and Americans consistently overrate China’s economic power (Chart 6). Biden will not let grassroots nationalism run his policy. But it is true that he has little to gain politically from appearing to appease China. With progress at hand on the pandemic and economic recovery, Biden will devote more attention to courting the allies and attempting to construct his alliance of democracies to meet global challenges and to “stand up” to China and Russia. The allies, however, are risk-averse when it comes to confronting China. This is as true for the Europeans as it is for China’s Asian neighbors, who stand directly in its firing line. In fact, Europe’s total trade with China is equivalent to that of the US (Chart 7). The Europeans have said that they will pursue tougher trade enforcement through the World Trade Organization, which would tie the Biden administration’s hands. Biden and his cabinet officials insist that they will use the “full array” of tools at their disposal (e.g. tariffs and sanctions) to punish China for mercantilist trade policies. Chinese negotiators are said to be asking explicitly for Biden to roll back Trump’s policies. Some of these policies relate to trade and tech acquisition, others to strategic disputes. We doubt that Biden will compromise on the trade issues to get cooperation on North Korea and Iran. But he will have to offer major concessions if he wants durable denuclearization agreements on these rogue states. Otherwise it will be clear that his administration is mostly focused on competition with China itself and willing to sideline the minor nuclear aspirants. Our expectation is that Americans care about the China threat and the smaller threats will be used as pretexts with which to increase pressure and sanctions on China. Asian equities have corrected after going vertical, as expected. But contrary to our expectations geopolitics was not the cause (Chart 8). This selloff could eventually create a buying opportunity if the Biden administration is revealed to take a more dovish line on China, trade, and tech in exchange for progress on strategic disputes like North Korea. Any discount due to North Korean provocations in particular would be a buy. On Taiwan, however, China’s new 2027 military target underscores our oft-recited red flag. Chart 7EU Risk Averse On China
EU Risk Averse On China
EU Risk Averse On China
Chart 8Asian Equity Correction And GeoRisk Indicators
Asian Equity Correction And GeoRisk Indicators
Asian Equity Correction And GeoRisk Indicators
Bottom Line: Investors should stay focused on the US-China relationship. What matters is Biden’s first actions on tariffs and high-tech exports. So far Biden is hawkish as we anticipated. Investors should fade rumors of big new US-China cooperation prior to the first Biden-Xi summit. Any major North Korean aggression will create a buy-on-the-dips opportunity. Unless it triggers a war, that is – and the threshold for war is high given the Chonan incident in 2010. Germany: Markets Wake Up To Election Risk – And Smile This week’s election in the Netherlands delivered a fully expected victory to Prime Minister Mark Rutte’s liberal coalition. The German leadership ranks next to the Dutch in terms of governments that received an increase in popular support as a result of the COVID-19 crisis (Chart 9). However, in Germany’s case the election outcome is not a foregone conclusion. Chart 9German Leadership Saw Popularity Bounce
Building Back … The Wall Of Worry
Building Back … The Wall Of Worry
As we highlighted in our annual forecast, an upset in which a left-wing bloc forms the government for the first time since 2005 is likelier than the market expects. This scenario presents an upside risk for equities and bund yields since Germany would become even more pro-Europe, pro-integration, and proactive in its fiscal spending. In the current context that would be greeted warmly by financial markets as it would reinforce the cyclical rotation into the euro, industrials, and European peripheral debt. Incidentally, it would also reduce tensions with Russia and China – even as the Biden administration is courting Germany. Recent state elections confirm that the electorate is moving to the left rather than the right. In Baden-Wurttemberg, the third largest state by population and economic output, and a southern state, the Christian Democrats slipped from the last election (-2.9%), the Social Democrats slipped by less (-1.7%), the Free Democrats gained (2.2%), the Greens gained (2.3%), and the far-right Alternative for Germany saw a big drop (-5.4%). In the smaller state of Rhineland-Palatinate the results were largely the same although the Greens did even better (Tables 4A & 4B).7 In both cases the Christian Democrats saw the worst result since prior to the financial crisis while the Greens tripled their support in Baden and doubled their support in the Palatinate over the same time frame. Table 4AGerman State Elections Show Voters’ Leftward Drift Continues
Building Back … The Wall Of Worry
Building Back … The Wall Of Worry
Table 4BGerman State Elections Show Voters’ Leftward Drift Continues
Building Back … The Wall Of Worry
Building Back … The Wall Of Worry
To put this into perspective: Outgoing Chancellor Angela Merkel and her coalition have seen a net 6% increase in popular support since COVID-19. The coalition, led by the Christian Democratic Union and its Bavarian sister party, the Christian Social Union, still leads national opinion polling. What we are highlighting are chinks in the armor. The gap with the combined left-leaning bloc is less than 10% points (Chart 10). Chart 10German Party Polling
German Party Polling
German Party Polling
Merkel is a lame duck whose party has been in power for 17 years. She is struggling to find an adequate successor. Her current frontrunner for chancellor-candidate, Armin Laschet, is suffering in public opinion, especially after the state election defeats, while her previous successor was ousted last year. Other chancellor-candidates, like Friedrich Merz, Markus Söder, and Norbert Röttgen may find themselves to the right of the median voter, which has been shifting to the left. Merkel’s party’s handling of COVID-19 first received praise and now, in the year of the vote, is falling under pressure due to difficulties rolling out the vaccine. Even as conditions improve over the course of the year her party may struggle to recover from the damage, since the underlying reality is that Germany has suffered a recession and is beset by global challenges. While the Christian Democrats performed relatively well in the 2009 election, in the teeth of the global financial crisis, times have changed. Today the Social Democrats are no longer in free fall – ever since their Finance Minister Olaf Scholz led the charge for fiscal stimulus in 2019 – while third parties like the Free Democrats, Greens, and Die Linke all gained in 2009 and look to gain this year (Table 5). In today’s context it is even more likely that other parties will rise at the ruling party’s expense. Still, the Christian Democrats have stout support in polls and do not have to split votes with the far-right, which is in collapse. Table 5German Federal Election Results Show 2021 Could Throw Curveball For Ruling Party
Building Back … The Wall Of Worry
Building Back … The Wall Of Worry
Therein lies the real market takeaway: right-wing populism has flopped in Germany. The risk to the consensus view that Merkel will hand off the baton seamlessly to a successor and secure her party another term in leadership is that the establishment left will take power (the Greens in Germany are essentially an establishment party). Chart 11German Bunds Respond To Macro Shifts, State Elections
German Bunds Respond To Macro Shifts, State Elections
German Bunds Respond To Macro Shifts, State Elections
Near-term pandemic and economic problems have caused bund yields to fall and the yield curve to flatten so far this year (Chart 11). But that trend is unlikely to continue given the global and national outlook. Election uncertainty should work against this trend since the only possible uncertainty gives more upside to the fiscal outlook and bond yields. If the consensus view indeed comes to pass and the Christian Democrats remain in power, the election holds out policy continuity – at least on economic policy. Fiscal tightening would happen sooner under the Christian Democrats but it would not be aggressive or premature, at least not in the 2021-22 period. It is the current coalition that first loosened Germany’s belt – and it did so in 2019, prior to COVID-19. Germany’s and the EU’s proactive fiscal turn will have a major positive impact on growth prospects, at least cyclically, though it is probably too small thus far to create a structural improvement in potential growth. Fiscal thrust is negative over next two years even with the EU’s Next Generation Recovery Fund being distributed. A structural increase in growth is possible given that all of the major countries are simultaneously pursuing monetary and fiscal stimulus as well as big investments in technology and renewable energy that will help engender a new private capex cycle. But productivity has been on a long, multi-decade decline so it remains to be seen if this can be reversed. Geopolitically speaking, Germany’s and the EU’s policy shift arrived in the nick of time to deepen European integration before divisions revive. Integration is broadly driven by European states’ need to compete on a grand scale with the US, Russia, and China. But Putin, Brexit, and Mario Draghi demonstrate the more tactical pressures: Brexit discourages states from exiting, especially with ongoing trade disputes and the risk of a new Scottish independence referendum; Putin’s aggressive foreign policy drives eastern Europeans into the arms of the West; and the formation of a unity government in Italy encourages European solidarity and improves Italian growth prospects. The outlook for structural reforms is not hopeless. Prime Minister Draghi’s government has a good chance of succeeding at some structural reforms where his predecessors have failed. Meanwhile French President Emmanuel Macron is still favored to win the French election in 2022, which is good for French structural reform. The fact that the EU tied its recovery fund to reform is positive. Most importantly the green energy agenda is replacing budget cutting for the time being, which, again, is positive for capex and could create positive long-term productivity surprises. Of course, structural reform intensity slowed just prior to COVID, in Spain, France, and Italy. Once the recovery funds are spent the desire to persist with reform will wane. This is clear in Spain, which has rolled back some reforms and has a weak government that could dissolve any time, and Italy, where the Draghi coalition may not last long after funds are spent. If the global upswing persists and Chinese/EM growth improves, then Europe will benefit from a macro backdrop that enables it to persist with some structural reforms and crawl out of its liquidity trap. But if China/EM growth relapses then Europe will fall back into a slump. Thus it is a very good thing for Europe, the euro, and European equities that the US is engaged in an epic fiscal blowout and that China’s Two Sessions dampened the risk of overtightening. Incidentally, if the German government does shift, relations with Russia would improve on the margin. While US-Russia tensions will remain hot, German mediation could reduce Russia’s insecurity and lower geopolitical risks for both Russia and emerging Europe, which are very cheaply valued at present in part because they face a persistent geopolitical risk premium. Bottom Line: German politics will drive further EU integration whether the Christian Democrats stay in power or whether the left-wing parties manage a surprise victory. Europe will have to provide more fiscal stimulus but otherwise the global context is favorable for Europe. Investors should not be too pessimistic about short-term hiccups with the vaccine rollout. Investment Takeaways The US is stimulating, China is not overtightening, and German’s election risk is actually an upside risk for European and global risk assets. These points reaffirm a bullish cyclical outlook on global stocks and commodities and a bearish outlook on government bonds. It is especially positive for global beneficiaries of US stimulus excluding China, such as Canada and Mexico. It is also beneficial for industrial metals and emerging markets exposed to China over the medium term, after frenzied buying suffers a healthy correction. Any premium in European equities should be snapped up. However, the cornerstone has been laid for the wall of worry in this global economic cycle: the US is raising taxes, China is tightening policy, and Europe’s fiscal stimulus will probably fall short. Moreover a consensus outcome from the German election would be a harbinger of earlier-than-expected fiscal normalization. There is not yet a clear green light in US-China relations – on the contrary, our view that Biden would be hawkish is coming to pass. Biden faces foreign policy tests across the board and now is a good time to hedge against the inevitable return of downside risks given the remorseless increase in tensions between the Great Powers. Housekeeping A number of clients have written to ask follow-up questions about our contrarian report last week taking a positive view on cybersecurity stocks despite the tech selloff and a positive view on global defense stocks, especially in relation to cybersecurity. The main request is, Which companies offer the best value? So we teamed up with BCA’s new Equity Analyzer to highlight the companies that receive the best BCA scores utilizing a range of factors including value, safety, payout, quality, technicals, sentiment, and macro context – all relative to a universe of global stocks with a minimum market cap of $1 billion. The results are shown in the Appendix, which we hope will come in handy. Separately our tactical hedge, long US health care equipment versus the broad market, has stopped out at -5%. This makes sense in light of the pro-cyclical rotation. Health care equipment is still likely to outperform the rest of the US health care sector amid a policy onslaught of higher taxes, government-provided insurance, and pharmaceutical price caps. Matt Gertken Vice President Geopolitical Strategy mattg@bcaresearch.com Yushu Ma Research Associate yushu.ma@bcaresearch.com Appendix Appendix Table ABCA Research Equity Analyzer Casts Light On Best Defense And Cybersecurity Stocks
Building Back … The Wall Of Worry
Building Back … The Wall Of Worry
Appendix Table BBCA Research Equity Analyzer Casts Light On Best Defense And Cybersecurity Stocks
Building Back … The Wall Of Worry
Building Back … The Wall Of Worry
Appendix Table CBCA Research Equity Analyzer Casts Light On Best Defense And Cybersecurity Stocks
Building Back … The Wall Of Worry
Building Back … The Wall Of Worry
Footnotes 1 China is asking for export controls that have hamstrung Huawei and SMIC to be removed as well as for sanctions and travel bans on Communist Party members and students to be lifted. See Lingling Wei and Bob Davis, "China Plans To Ask U.S. To Roll Back Trump Policies In Alaska Meeting," Wall Street Journal, March 17, 2021, wsj.com; Helen Davidson, "Taiwanese urged to eat ‘freedom pineapples’ after China import ban," The Guardian, March 2, 2021, theguardian.com. 2 "Putin on Biden: Russian President Reacts To US Leader’s Criticism," BBC, March 18, 2021, bbc.com. 3 Pyongyang is likely to test a new, longer range intercontinental ballistic missile for the first time since its self-imposed missile test moratorium began in 2018 after President Trump’s summit with leader Kim Jong Un. See Lara Seligman and Natasha Bertrand, "U.S. ‘On Watch’ For New North Korean Missile Tests," Politico, March 16, 2021, politico.com. 4 See ABC News, "Transcript: Joe Biden delivers remarks on 1-year anniversary of pandemic", ABC News, Mar. 11, 2021, abcnews.com. 5 Please see IMF Staff, "World Economic Outlook Reports", IMF, Jan. 2021, imf.org and OECD Staff, "OECD Economic Outlook, Interim Report March 2021", OECD, March 9, 2021, oecd.org. 6 Please see IMF Asia and Pacific Dept, "People’s Republic of China : 2020 Article IV Consultation-Press Release; Staff Report; and Statement by the Executive Director for the People's Republic of China", IMF, Jan. 8, 2021, imf.org. 7 The other state elections coming up this year will coincide with the federal election on September 26, with one minor exception (Saxony-Anhalt). Opinion polls show the Christian Democrats slipping below the Greens in Berlin and the Social Democrats in Mecklenburg-Vorpommern. The Alternative for Germany is falling in all regions.
Monitoring China Closely
Monitoring China Closely
Deterioration in Chinese data pushed us to downgrade the cyclical/defensive portfolio bent from overweight to neutral last month (third panel), and today we highlight yet another warning shot originating across the Pacific Ocean. Bloomberg’s compiled China High-Frequency Economic Activity Index (CHFEAI) has downshifted since peaking last December, warning that investors should keep their “China” guard up. The CSI 300 is following down the path of the CHFEAI (second panel), and the risk is that the S&P 500 may be next in line (top panel), as it has closely tracked China, albeit with a slight lag, since COVID-19 hit, as we first showed in our December 21, 2020 Special Report. Tack on the absence of an SPX valuation cushion, and there are rising odds that select deep cyclical/highly levered/China exposed sectors will start to sniff out some China trouble. Bottom Line: The S&P 500 is nearly perfectly priced and at a spitting distance from our 4,000 end-2021 target. China’s slowdown, especially post the 100 year Communist Party anniversary this summer, remains a key macro risk to monitor and can serve as a catalyst for an SPX correction.
Highlights The report from last week’s National People’s Congress (NPC) indicates a gradual pullback in policy support this year. Fiscal thrust will be neutral in 2021, whereas the rate of credit expansion will be slightly lower compared with last year. China’s economy should run on its own momentum in the first half, before slowing to a benign and managed rate. Nonetheless, the risk of policy overtightening is nontrivial and could threaten the cyclical outlook on China’s economy and corporate profits. The recent price correction in Chinese stocks has not yet run its course. Moreover, equity prices in both onshore and offshore markets are breaching their technical resistance. We are downgrading our tactical (0 to 3 months) and cyclical (6 to 12 months) positions on Chinese stocks to underweight relative to global benchmarks. Feature China’s budget and key economic initiatives unveiled at last week’s NPC indicate that policy tightening will be gradual this year. Overall, maintaining stability, both socially and economically, remains the focal point of Premier Li Keqiang’s work plan presented at the NPC’s annual plenary session in Beijing. However, investors have centered on the government’s plan to have a smaller policy push on growth in its budget compared with last year, fearing that economic and corporate profit rebound will disappoint. The Shanghai Composite Index dropped by 6% during the week when the NPC took place. In our view, the risks of a policy over-tightening in the next six months are high. As such, with this report we are downgrading our cyclical call on Chinese stocks to underweight within a global equity portfolio. Reading Policy Tea Leaves China's growth trajectory since the middle of 2020 has given the government comfort in staying the course on policy normalization. The question is how much Chinese policymakers are willing to pull back support for the economy this year. Overall, the central government plans a smaller policy push in this year's budget and intends to let the economy run on its own steam. Further policy reflation is not in the cards unless a relapse in the economy threatens job creation. The NPC outlined a growth target “above 6%” for 2021 and did not set a numerical goal for the 14th Five-Year Plan from 2021 to 2025. However, de-emphasizing growth does not mean China has abandoned its GDP targets (Table 1). Indeed, in most years in the past two decades, China’s expansion in GDP has overshot objectives set at the NPC (Chart 1). Our baseline estimate is that real GDP will increase by 8% in 2021. Table 12021 Economic And Policy Targets
National People’s Congress Sets Tone For 2021 Growth
National People’s Congress Sets Tone For 2021 Growth
Chart 1Actual Econ Growth Rates Have Overshot Targets In Most Years
Actual Econ Growth Rates Have Overshot Targets In Most Years
Actual Econ Growth Rates Have Overshot Targets In Most Years
We also maintain our view that the rate of credit expansion will be reduced by 2 to 3 percentage points this year to about 11% annually, which is in line with nominal GDP growth (Chart 2). On the fiscal front, the target for a budget deficit was cut by less than half percentage point compared with last year. When taking into account both the government’s budgetary and fund expenditures, the broad-measure fiscal deficit will probably be around 8% of GDP (about the same as last year), which implies there will not be any fresh fiscal thrust in 2021 (Chart 3) Chart 2Credit Growth Will Decelerate From Last Year
Credit Growth Will Decelerate From Last Year
Credit Growth Will Decelerate From Last Year
Chart 3Neutral Fiscal Thrust
Neutral Fiscal Thrust
Neutral Fiscal Thrust
The pullback in fiscal impulse is larger than in 2010, 2014, and 2017, following the previous three fiscal expansionary cycles. However, the government's eased budget deficit target this year does not mean government expenditure growth will slow. Government revenues climbed sharply by the end of 2020 and will continue to improve this year (Chart 4). Higher revenues will allow more government spending while keeping the fiscal deficit within its objectives. Chart 4Gov Revenue Is On The mend But Spending Has Yet To Pick Up
Gov Revenue Is On The mend But Spending Has Yet To Pick Up
Gov Revenue Is On The mend But Spending Has Yet To Pick Up
Chart 5A Small Reduction In ##br##LG Bond Quota
National People’s Congress Sets Tone For 2021 Growth
National People’s Congress Sets Tone For 2021 Growth
Furthermore, the quota for local government special purpose bonds was reduced by only 2% from last year. It should help to support a steady growth in China’s infrastructure investment (Chart 5). The data from January and February total social financing shows a noticeable improvement in corporate demand for bank loans, as well as the composition of bank loans. Corporate demand for medium- and long-term loans remains on a strong uptrend, which reflects an ongoing recovery in corporate profits and supports an optimistic view on capital investment in the months ahead (Chart 6). Chart 6More Demand For Longer-Term Loans Reflects Better Investment Propensity
More Demand For Longer-Term Loans Reflects Better Investment Propensity
More Demand For Longer-Term Loans Reflects Better Investment Propensity
Bottom Line: The growth and budget targets set at this year’s NPC suggest only a modest pullback in policy support. Downside Risks To The Economy Chart 7Econ Growth Usually Peaks Six To Nine Months After Credit Expansion Rate Slows
Econ Growth Usually Peaks Six To Nine Months After Credit Expansion Rate Slows
Econ Growth Usually Peaks Six To Nine Months After Credit Expansion Rate Slows
Despite a relatively dovish tone from the NPC, investors should not be complacent about the risk of a policy-tightening overshoot, which could lead to disappointing economic and profit growth this year. In most of the previous policy tightening cycles, China’s economic activities remained resilient in the first 6 to 9 months (Chart 7). One exception was 2014, when nominal GDP growth dropped sharply as soon as credit growth slowed. The reason is that Chinese authorities kept a very disciplined fiscal stance and aggressively tightened monetary policy, while allowing the RMB to soft peg to a rising USD. In other words, macroeconomic policies were too restrictive during the 2013/14 cycle. Although messages from the NPC do not suggest that Chinese authorities are on such an aggressive tightening path this year, investors should watch the following signs that could threaten China's cyclical economic health: Policymakers may keep monetary conditions too tight, by allowing the RMB to rise too fast while lifting bank lending and policy rates. Currently rates are maintained at historically low levels, much lower than in previous policy tightening cycles (Chart 8). However, the trade-weighted RMB has appreciated by 6% since its trough in July last year and has returned to its pre US-China trade war level (Chart 9). The Chairman of China’s Banking and Insurance Regulatory Commission recently signaled that bank lending rates would climb. Although we do not expect the rate to return to its 2014 or 2017 level, China is much more indebted than in previous cycles. Even a small bump in interest rates will place a burden on corporates and local governments’ debt servicing cost, dampening their propensity to invest (Chart 10). Chart 8Aggressive Rate Hikes Are ##br##Unlikely This Year
Aggressive Rate Hikes Are Unlikely This Year
Aggressive Rate Hikes Are Unlikely This Year
Chart 9Rising RMB Should Refrain Chinese Policymakers From Further Tightening Monetary Stance
Rising RMB Should Refrain Chinese Policymakers From Further Tightening Monetary Stance
Rising RMB Should Refrain Chinese Policymakers From Further Tightening Monetary Stance
Chart 10Chinese Private Sector Has Become Much More Sensitive To Rising Interest Rates
Chinese Private Sector Has Become Much More Sensitive To Rising Interest Rates
Chinese Private Sector Has Become Much More Sensitive To Rising Interest Rates
Chart 11Bank Lending To Property Sector Has Become Increasingly Restrictive
Bank Lending To Property Sector Has Become Increasingly Restrictive
Bank Lending To Property Sector Has Become Increasingly Restrictive
Policies could become too restrictive in key old-economy industries. Chinese authorities have reiterated their determination to contain price bubbles in the property sector. For the first time since 2017, bank lending to real estate developers grew at a pace far below overall bank loans and continued to trend downward in February this year (Chart 11). Moreover, household mortgage loans have reached their slowest expansion rate since 2013. At 22% of China’s total bank lending, a sharp setback in the property sector’s loan growth will be a significant drag on total credit and the economy. A worsened imbalance in supply and demand could lead to too much buildup in industrial inventory. Manufacturing inventories recovered sharply following last year’s massive stimulus and many sectors have surpassed their pre-pandemic levels (Chart 12). Strong external demand helped to boost China’s production and propensity to restock on raw materials. However, both China’s core CPI and producer prices for consumer goods remain in the doldrums, which indicates that domestic final demand has yet to fully recover (Chart 13). As discussed in last week’s report, reopening the world economy in 2H21 should benefit the service sector more than tradeable goods. China’s inventory buildup, particularly in the upstream industries, could turn excessive when export growth slows and domestic demand fails to pick up the slack. Chart 12How Far Can Chinas Inventory Restocking Cycle Go?
How Far Can Chinas Inventory Restocking Cycle Go?
How Far Can Chinas Inventory Restocking Cycle Go?
Chart 13Final Demand Remains ##br##Weak
Final Demand Remains Weak
Final Demand Remains Weak
The service sector could take longer than expected to recuperate, even though China’s domestic COVID-19 situation is under control. China’s services sector has flourished in recent years and accounted for 54% of the nation’s pre-pandemic economic output. However, about half of the service sector output is tied to real estate and financial services. Increasing pressures from tighter policy regulations targeting both the property and online financial service sectors could dampen their support to the economy more than policymakers anticipated. At the same time, wage and household income growth could remain tame by China’s standards (Chart 14). The NPC’s targeted 7% annual increase in spending for national research and development – far below the 12% annual average reached during the past five years – will not be enough to offset the slowdowns in real estate and financial services (Chart 15). Chart 14Household Income Growth Has Yet To Recover
Household Income Growth Has Yet To Recover
Household Income Growth Has Yet To Recover
Chart 15Chinas Pace Of R&D Investment Has Slowed Along With Econ Growth
Chinas Pace Of R&D Investment Has Slowed Along With Econ Growth
Chinas Pace Of R&D Investment Has Slowed Along With Econ Growth
Bottom Line: The downside risks to China’s cyclical growth trajectory are nontrivial. A tug-of-war between policy tightening and growth support will likely persist throughout this year. Investment Implications We recommend investors to underweight Chinese stocks within a global equity portfolio, in the next 0 to 9 months (Chart 16A and 16B). Chart 16AChinese Stocks Are At Their Technical Resistance
Chinese Stocks Are At Their Technical Resistance
Chinese Stocks Are At Their Technical Resistance
Chart 16BChinese Stocks Are At Their Technical Resistance
Chinese Stocks Are At Their Technical Resistance
Chinese Stocks Are At Their Technical Resistance
On January 13, we tactically downgraded Chinese stocks from overweight to neutral, anticipating that China’s equity markets are sensitive to rising expectations of policy tightening, due to higher corporate debt-servicing costs and lofty valuations. Chinese stock prices peaked in mid-February, but in our view the correction has not yet run its course. In terms of the economy, we maintain our baseline view that China's overall policy environment this year will be more accommodative than in 2017/18. The growth momentum carried over from last year's stimulus should prevent China's economy and corporate profits from slumping by too much this year. However, as policy supports are scaled back, investors will increasingly focus on the intensity of China’s domestic policy tightening and the uncertainties surrounding it. Downside risks are nontrivial and will continue to weigh on investors' sentiment. For investors that are mainly exposed to the Chinese domestic equity market, the near-term setbacks in the A-share market are taking some air out of Chinese equities' frothy valuations, and may pave the way for a more optimistic cyclical outlook beyond the next 9 to 12 months. We recommend domestic investors to stay on the sidelines for now, but will start recommending sector rotations in the next few months when opportunities arise. Jing Sima China Strategist jings@bcaresearch.com Cyclical Investment Stance Equity Sector Recommendations
Chinese data releases for February continue to show strong momentum versus last year. Industrial production was up 35.1% y/y in January and February, while retail sales firmed by 33.8% y/y, with both beating consensus expectations. Last year’s lockdowns…
Highlights The Biden administration’s early actions suggest it will be hawkish on China as expected – and the giant Microsoft hack merely confirms the difficulty of reducing strategic tensions. US-China talks are set to resume and piecemeal engagement is possible. However, most of the areas of engagement touted in the media are overrated. Competition will prevail over cooperation. Cybersecurity stocks have corrected, creating an entry point for investors seeking exposure to a secular theme of Great Power conflict in the cyber realm and beyond. Global defense stocks are even more attractive than cyberstocks as a “back to work” trade in the geopolitical context. Continue to build up safe-haven hedges as geopolitical risk remains structurally elevated and underrated by financial markets. Feature The Biden administration passed its first major law, the $1.9 trillion American Rescue Plan, on March 10. This gargantuan infusion of fiscal stimulus accounts for about 2% of global GDP and 9% of US GDP, a tailwind for risky assets when taken with a receding pandemic and normalizing global economy. The US dollar has perked up so far this year on the back of this extraordinary pump-priming and the rapid rollout of COVID-19 vaccines, which have lifted relative growth expectations with the rest of the world. Hence the dollar is rising for fundamentally positive reasons that will benefit global growth rather than choke it off. Our Foreign Exchange Strategist Chester Ntonifor argues that the dollar has 2-3% of additional upside before relapsing under the weight of rising global growth, inflation expectations, commodity prices, and relative equity flows into international markets. We agree with the dollar bear market thesis. But there are two geopolitical risks that investors must monitor: Cyclically, China’s combined monetary and fiscal stimulus is peaking, growth will decelerate, and the central government runs a non-negligible risk of overtightening policy. However, China’s National People’s Congress so far confirms our view that Beijing will not overtighten. Structurally, the US-China cold war is continuing apace under President Biden, as expected. The two sides are engaging in normal diplomacy as appropriate to a new US administration but the Microsoft Exchange hack (see below) underscores the trend of confrontation over cooperation. Chart 1Long JPY / Short KRW As Geopolitical Risk Is Underrated
Long JPY / Short KRW As Geopolitical Risk Is Underrated
Long JPY / Short KRW As Geopolitical Risk Is Underrated
The second point reinforces the first since persistent US pressure on China will discourage it from excessive deleveraging at home. In a world where China is struggling to cap excessive leverage, the US is pursuing “extreme competition” with China (Biden’s words), and yet the US rule of law is intact, global investors will not abandon the US dollar in a general panic and loss of confidence. They will, however, continue to diversify away from the dollar on a cyclical basis given that global growth will accelerate while US policy will remain extremely accommodative. Reinforcing the point, geopolitical frictions are rising even outside the US-China conflict. A temporary drop in risk occurred in the New Year as a result of the rollout of vaccines, the defeat of President Trump, and the resolution of Brexit. But going forward, geopolitical risk will reaccelerate, with various implications that we highlight in this report. While we would not call an early end to the dollar bounce, we will keep in place our tactical long JPY-USD and long CHF-USD hedges. These currencies offer a good hedge in the context of a dollar bear market and structurally high geopolitical risk. If the dollar weakens anew on good news for global growth then the yen and franc will benefit on a relative basis as they are cheap, whereas if geopolitical risk explodes they will benefit as safe havens. We also recommend going long the Japanese yen relative to the South Korean won given the disparity in valuations highlighted by our Emerging Markets team, and the fact that geopolitical tensions center on the US and China (Chart 1). “Our Most Serious Competitor, China” Why are we so sure that geopolitical risk will remain structurally elevated and deliver negative surprises to ebullient equity markets? Our Geopolitical Power Index shows that China’s rise and Russia’s resurgence are disruptive to the US-led global order (Chart 2). If anything this process has accelerated over the COVID-19 crisis. China and Russia have authoritarian control over their societies and are implementing mercantilist and autarkic economic policies. They are carving out spheres of influence in their regions and using asymmetric warfare against the US and its allies. They have also created a de facto alliance in their shared interest in undermining the unity of the West. The US is meanwhile attempting to build an alliance of democracies against them, heightening their insecurities about America’s power and unpredictability (Chart 3). Chart 2Great Power Struggle Continues
Great Power Struggle Continues
Great Power Struggle Continues
Massive fiscal and monetary stimulus is positive for economic growth and corporate earnings but it reduces the barriers to geopolitical conflict. Nations can pursue foreign and trade policies in their self-interest with less concern about the blowback from rivals if they are fueled up with artificially stimulated domestic demand. Chart 3Biden: ‘Our Most Serious Competitor, China’
More Reasons To Buy Cybersecurity And Defense Stocks
More Reasons To Buy Cybersecurity And Defense Stocks
Total trade between the US and China, at 3.2% and 4.7% of GDP respectively in 2018, was not enough to prevent trade war from erupting. Today the cost of trade frictions is even lower. The US has passed 25.4% of GDP in fiscal stimulus so far since January 1, 2020. China’s total fiscal-and-credit impulse has risen by 8.4% of GDP over the same time period. The Biden administration is co-opting Trump’s hawkish foreign and trade policy toward China, judging by its initial statements and actions (Appendix Table 1). Specifically, Biden has issued an executive order on securing domestic supply chains that demonstrates his commitment to the Trumpian goal of diversifying away from China and on-shoring production, or at least offshoring to allied nations. The Democratic Party is also unveiling bipartisan legislation in Congress that attempts to reduce reliance on China.1 These executive decrees are partly spurred on by the global shortage of semiconductors. China, the US, and the US’s allies are all attempting to build alternative semiconductor supply chains that bypass Taiwan, a critical bottleneck in the production of the most advanced computer chips. The Taiwanese say they will coordinate with “like-minded economies” to alleviate shortages, by which they mean fellow democracies. But this exposes Taiwan to greater geopolitical risk insofar as it excludes mainland China from supplies, either due to rationing or American export controls. The surge in semiconductor sales and share prices of semi companies (especially materials and equipment makers) will continue as countries will need a constant supply of ever more advanced chips to feed into the new innovation and technology race, the renewable energy race, and the buildout of 5G networks and beyond (Chart 4). It takes huge investments of time and capital to build alternative fabrication plants and supply lines yet governments are only beginning to put their muscle into it via stimulus packages and industrial policy. Chart 4Semiconductor Supply Shortage
Semiconductor Supply Shortage
Semiconductor Supply Shortage
Supply shocks have geopolitical consequences. The oil shocks of the 1970s and early 1990s motivated the US to escalate its interventions and involvement in the Middle East. They also motivated the US to invest in stockpiles of critical goods and alternative sources of production so as to reduce dependency (Chart 5). Although semiconductors are not fungible like commodities, and the US has tremendous advantages in semiconductor design and production, nevertheless the bottleneck in Taiwan will take years to alleviate. Hence the US will become more active in supply security at home and more active in alliance-building in Asia Pacific to deter China from taking Taiwan by force or denying regional access to the US and its allies. China faces the same bottleneck, which threatens its technological advance, economic productivity, and ultimately its political stability and international defense. Chart 5ASupply Shortages Motivate Strategic Investments
Supply Shortages Motivate Strategic Investments
Supply Shortages Motivate Strategic Investments
Chart 5BSupply Shortages Motivate Strategic Investments
Supply Shortages Motivate Strategic Investments
Supply Shortages Motivate Strategic Investments
Semiconductor and semi equipment stock prices have gone vertical as highlighted above but one way to envision the surge in global growth and capex for chip makers is to compare these stocks relative to the shares of Big Tech companies in the communication service sector, i.e. those involved in social networking and entertainment, such as Twitter, Facebook, and Netflix. On a relative basis the semi stocks can outperform these interactive media firms which face a combination of negative shocks from rising interest rates, regulation, economic normalization, and ideologically fueled competition (Chart 6). Chart 6Long Chips Versus Big Tech
Long Chips Versus Big Tech
Long Chips Versus Big Tech
What about the potential for the US and China to enhance cooperation in areas of shared interest? Generally the opportunity for re-engagement is overrated. The Biden administration says there will be engagement where possible. The first high-level talks will occur in Alaska on March 18-19 between Secretary of State Antony Blinken, National Security Adviser Jake Sullivan, Central Foreign Affairs Commissioner Yang Jiechi, and Foreign Minister Wang Yi. Presidents Biden and Xi Jinping may hold a bilateral summit sometime soon and the old strategic and economic dialogue may resume, enabling cabinet-level officials to explore a range of areas for cooperation independently of high-stakes strategic negotiations. However, a close look at the policy areas targeted for engagement reveals important limitations: Health: There is little room for concrete cooperation on the COVID-19 pandemic given that the pandemic is already receding, the Chinese have not satisfied American demands for data transparency, Chinese officials have fanned theories that the virus originated in the US, and the US is taking measures to move pharmaceutical and health equipment supply chains out of China. Trade: Trade is an area of potential cooperation given that the two countries will continue trading while their economies rebound. The Phase One trade deal remains in place. However, China only made structural concessions on agriculture in this deal so any additional structural changes will have to be the subject of extensive negotiations. Secretary of Treasury Janet Yellen says the US will use the “full array of tools” to ensure compliance and will punish China for abuses of the global trade system. Cybersecurity: On cybersecurity, China greeted the Biden administration by hacking the Microsoft Exchange email system, an even larger event than Russia’s SolarWinds hack last year. Both hacks highlight how cyberspace is a major arena of modern Great Power struggle, making it unlikely that there will be effective cooperation. The hack suggests Beijing remains more concerned about accessing technology while it can than reducing tensions. The Americans will make demands of China at the Alaska meetings. Environment: As for the environment, the US is a net oil exporter while China imports 73% of its oil, 42% of its natural gas and 7.8% of its coal consumption, with 40% and 10% of its oil and gas coming from the Middle East. The US wants to be at the cutting edge of renewable energy technology but it has nowhere near the impetus of China (or Europe), which are diversifying away from fossil fuels for the sake of national security. Moreover China will want its own companies, not American, to meet its renewable needs. This is true even if there is success in reducing barriers for green trade, since the whole point of diversifying from Middle Eastern oil supplies is strategic self-sufficiency. The Americans would have to accept less energy self-sufficiency and greater renewable dependence on China. Nuclear Proliferation: Cooperation can occur here as the Biden administration will seek to return to a deal with the Iranians restraining their nuclear ambitions while maintaining a diplomatic limiting North Korea’s nuclear weapons stockpile and ballistic missile development. China and Russia will accept the US rejoining the 2015 Iranian nuclear deal but they will require significant concessions if they are to join the US in forcing anything more substantial on the Iranians. China may enforce sanctions on North Korea but then it will expect concessions on trade and technology that the Biden administration will not want to give merely for the sake of North Korea. Bottom Line: The Biden administration’s China strategy is taking shape and it is hawkish as expected. It is not ultra-hawkish, however, as the key characteristic is that it is a defensive posture in the wake of the perceived failures of Trump’s strategy of “attack, attack, attack.” This means largely maintaining the leverage that Trump built for the US while shifting the focus to actions that the US can take to improve its domestic production, supply chain resilience, and coordination with allied producers. Punitive measures are an option, however, and if relations deteriorate over time, as expected, they will be increasingly relied on. Buy The Dip In Cybersecurity Stocks A linchpin of the above analysis is the Microsoft Exchange hack, which some have called the largest hack in US history, since it confirms the view that the Biden administration will not be able to de-escalate strategic tensions with China much. China has been particularly frantic to acquire technology through hacking and cyber-espionage over the past decade as it attempts to achieve a Great Leap Forward in productivity in light of slowing potential growth that threatens single-party rule over the long run. The breakdown in ties between Presidents Barack Obama and Xi Jinping occurred not only because of Xi’s perceived violation of a personal pledge not to militarize the South China Sea but also because of the failure of a cybersecurity cooperation deal between the two. When the Trump administration arrived on the scene it sought to increase pressure on China and cybersecurity was immediately identified as an area where pushback was long overdue. Cyber conflict is highly likely to persist, not only with Russia but also with China. Cyber operations are a way for states to engage in Great Power struggle while still managing the level of tensions and avoiding a military conflict in the real world. The cyber realm is a realm of anarchy in which states are insecure about their capabilities and are constantly testing opponents’ defenses and their own offensive capabilities. They can also act to undermine each other with plausible deniability in the cyber realm, since multiple state and quasi-state actors and a vast criminal underworld make it difficult to identify culprits with confidence. Revisionist states like China, North Korea, Russia, and Iran have an advantage in asymmetric warfare, including cyber, since it enables them to undermine the US and West without putting their weaker conventional forces in jeopardy. Cybersecurity stocks have corrected but the general up-trend is well established and fully justified (Chart 7). It is not clear, however, that investors should favor cybersecurity stocks over the general NASDAQ index (Chart 8). The trend has been sideways in recent years and is trying to form a bottom. Cybersecurity stocks are volatile, as can be seen compared to tech stocks as a whole, and in both cases the general trend is for rising volatility as the macro backdrop shifts in favor of higher interest rates and inflation expectations (Chart 9). Chart 7Cyber Security Stocks Corrected
Cyber Security Stocks Corrected
Cyber Security Stocks Corrected
Chart 8Major Hacks Failed To Boost Cyber Vs NASDAQ
Major Hacks Failed To Boost Cyber Vs NASDAQ
Major Hacks Failed To Boost Cyber Vs NASDAQ
Chart 9Volatility Of Cyber & Tech Stocks Rising
Volatility Of Cyber & Tech Stocks Rising
Volatility Of Cyber & Tech Stocks Rising
Great Power struggle will not remain limited to the cyber realm. There is a fundamental problem of military insecurity plaguing the world’s major powers. Furthermore the global economic upturn and new energy and industrial innovation race will drive up commodity prices, which will in turn reactivate territorial and maritime disputes. Turf battles will re-escalate in the South and East China Seas, the Persian Gulf and Indian Ocean basin, the Mediterranean, and even the Baltic Sea and Arctic. One way to play this shift is as a geopolitical “back to work” trade – long defense stocks relative to cybersecurity stocks (Chart 10). The global defense sector saw a run-up in demand, capital expenditures, and profits late in the last business cycle. That all came crashing down with the pandemic, which supercharged cybersecurity as a necessary corollary to the swarm of online activity as households hunkered down to avoid the virus and obey government social restrictions. Cybersecurity stocks have higher EV/EBITDA ratios and lower profit margins and return on equity compared to defense stocks or the broad market. Chart 10Long Defense / Short Cyber Security: 'Back To Work' For Geopolitics
Long Defense / Short Cyber Security: 'Back To Work' For Geopolitics
Long Defense / Short Cyber Security: 'Back To Work' For Geopolitics
The trade does not mean cybersecurity stocks will fall in absolute terms – we maintain our bullish case for cybersecurity stocks – but merely that defense stocks will make relative gains as economic normalization continues in the context of Great Power struggle. Bottom Line: Structurally elevated geopolitical risks will continue to drive demand for cybersecurity in absolute terms. However, we would favor global defense stocks on a relative basis. The US Is Not As War-Weary As People Think America is consumed with domestic divisions and distractions. Since 2008 Washington has repeatedly demonstrated an unwillingness to confront foreign rivals over small territorial conquests. This risk aversion has created power vacuums, inviting ambitious regional powers like China, Russia, Iran, and Turkey to act assertively in their immediate neighborhoods. However, the US is not embracing isolationism. Public opinion polling shows Americans are still committed to an active role in global affairs (Chart 11). The 2020 election confirms that verdict. Nor are Americans demanding big cuts in defense spending. Only 31% of Americans think defense spending is “too much” and only 12% think the national defense is stronger than it needs to be (Chart 12). Chart 11No Isolationism Here
No Isolationism Here
No Isolationism Here
True, the Democratic Party is much more inclined to cut defense spending than the Republicans. About 43% of Democrats demand cuts, while 32% are complacent about the current level of spending (compared to 8% and 44% for Republicans). But it is primarily the progressive wing of the party that seeks outright cuts and the progressives are not the ones who took power. Chart 12Americans Against ‘Forever Wars’ But Not Truly Dovish
More Reasons To Buy Cybersecurity And Defense Stocks
More Reasons To Buy Cybersecurity And Defense Stocks
Biden and his cabinet represent the Washington establishment, including the military-industrial complex. Even if Vice President Kamala Harris should become president she would, if anything, need to prove her hawkish credentials. Defense spending cuts might be projected nominally in Biden’s presidential budgets but they will not muster majorities in the two narrowly divided chambers of Congress. Biden has co-opted Trump’s (and Obama’s) message of strategic withdrawal and military drawdown. He is targeting a date of withdrawal from Afghanistan on May 1, notwithstanding the leverage that a military presence there could yield in its priority negotiations with Iran. Yet he is not jeopardizing the American troop presence in Germany and South Korea, much more geopolitically consequential spheres of action in a long competition with Russia and China. While it is true (and widely known) that Americans have turned against “forever wars,” this really means Middle Eastern quagmires like Iraq and Afghanistan and does not mean that the American public or political establishment have truly become anti-war “doves.” The US public recognizes the need to counter China and Russia and Congress will continue appropriating funds for defense as well as for industrial policy. The Biden administration will increase awareness about the risks of a lack of deterrence and alliance-building. This is especially apparent given the military buildup in China. The annual legislative session has revealed an important increase in military focus in Beijing in the context of the US rivalry. Previously, in the thirteenth five-year plan and the nineteenth National Party Congress, the People’s Liberation Army aimed to achieve “informatization and mechanization” reforms by 2020 and total modernization by 2035. However, at the fifth plenum of the central committee in October, the central government introduced a new military goal for the PLA’s 100th anniversary in 2027 – a “military centennial goal” to match with the 2021 centennial of the Communist Party and the 2049 centennial goal of the founding of the People’s Republic. While details about this new military centenary are lacking, the obvious implication is that the Communist Party and PLA are continuing to shift the focus to “fighting and winning wars,” particularly in the context of the need to deter the United States. The official defense budget is supposed to grow 6.8% in 2021, only slightly higher than the 6.6% goal in 2020, but observers have long known that China’s military budget could be as much as twice as high as official statistics indicate. The point is that defense spending is going up, as one would expect, in the context of persistent US-China tensions. Bottom Line: Just as US-China cooperation will be hindered by mutual efforts to reduce supply chain dependency and support domestic demand, so too it will be hindered by mutual efforts to increase defense readiness and capability in the event of military conflict. The beneficiary of continued high levels of US defense spending and Chinese spending increases – in the context of a more general global arms buildup – will be global arms makers. Investment Takeaways Geopolitical risk remains structurally elevated despite the temporary drop in tensions in late 2020 and early 2021. The China-backed Microsoft Exchange hack reinforces the Biden administration’s initial foreign policy comments and actions suggesting that US policy will remain hawkish on China. While Biden will adopt a more defensive rather than offensive strategy relative to Trump, there is no chance that he will return to the status quo ante. The Obama administration itself grew more hawkish on China in 2015-16 in the face of cyber threats and strategic tensions in the South China Sea. Cybersecurity stocks will continue to benefit from secular demand in an era of Great Power competition where nations use cyberattacks as a form of asymmetric warfare and a means of minimizing the risks of conflict. The recent correction in cybersecurity stocks creates a good entry point. We closed our earlier trade in January for a gain of 31% but have remained thematically bullish and recommend going long in absolute terms. We would favor defense over cybersecurity stocks as a geopolitical version of the “back to work” trade in which conventional economic activity revives, including geopolitical competition for territory, resources, and strategic security. Defense stocks are undervalued and relative share prices are unlikely to fall to 2010-era lows given the structural increase in geopolitical risk (Chart 13). Chart 13Global Defense Stocks Oversold
Global Defense Stocks Oversold
Global Defense Stocks Oversold
Chart 14Global Defense Stocks Profitable, Less Indebted
Global Defense Stocks Profitable, Less Indebted
Global Defense Stocks Profitable, Less Indebted
Defense stocks have seen profit margins hold up and are not too heavily burdened by debt relative to the broad market (Chart 14). Defense stocks have a higher return on equity than the average for non-financial corporations and cash flow will improve as a new capex cycle begins in which nations seek to improve their security and gain access to territory and resources (Chart 15). Chart 15Defense Stocks: High RoE, Capex Will Revive
Defense Stocks: High RoE, Capex Will Revive
Defense Stocks: High RoE, Capex Will Revive
Chart 16Discount On Global Defense Stocks
Discount On Global Defense Stocks
Discount On Global Defense Stocks
Valuation metrics show that global defense stocks are trading at a discount (Chart 16). Matt Gertken Vice President Geopolitical Strategy mattg@bcaresearch.com Appendix Table 1 Appendix Table 1Biden Administration's First 100 Days: Key Statements And Actions On China
More Reasons To Buy Cybersecurity And Defense Stocks
More Reasons To Buy Cybersecurity And Defense Stocks
Footnotes 1 See Federal Register, "America’s Supply Chains", Mar. 1, 2021, federalregister.gov and Richard Cowan and Alexandra Alper, "Top U.S. Senate Democrat directs lawmakers to craft bill to counter China", Feb. 23, 2021, reuters.com.

China’s all-important credit data surprised to the upside in February, declining by less than anticipated. Aggregate financing was nearly double consensus expectations, coming in at CNY 1.71 trillion from CNY 5.17 trillion in January. Meanwhile, Chinese banks…
Highlights China’s economic recovery is in a later stage than the US. A rebound in US Treasury yields is unlikely to trigger upward pressure on government bond yields in China. Imported inflation through mounting commodity and oil prices should be transitory and does not pose enough risk for Chinese authorities to further tighten policies. Historically, Chinese stocks have little correlation with changes in US Treasury yields; Chinese equity prices are primarily driven by the country’s domestic credit growth and economic conditions. We maintain our tactical (0 to 3 months) neutral position on Chinese stocks, in both absolute and relative terms. However, the near-term pullbacks are taking some air out of Chinese equities' frothy valuations, providing room for a cyclical upswing. Chinese offshore stocks, which are highly concentrated in the tech sector, are facing multiple challenges. We are closing our long investable consumer discretionary/short investable consumer staples trade and we recommend long A-shares/short MSCI China Index. Feature Chinese stocks extended their February losses into the first week of March. Market participants fear that escalating real government bond yields in the US and elsewhere will have a sustained negative impact on Chinese risk assets, reinforced by ongoing policy normalization in China. Global equity prices have been buffeted by crosscurrents. An acceleration in the deployment of vaccines and increased economic reopenings provide a positive backdrop to the recovery of corporate profits. At the same time, optimism about global growth and broadening fiscal stimulus in the US has prompted investors to expect higher policy rates sooner. The US 10-year Treasury yield is up by 68bps so far this year, depressing US equity valuations and sending ripple effects across global bourses. In this report, we examine how rising US and global bond yields would affect China’s domestic monetary policy and risk-asset prices. Will Climbing US Treasury Yields Push Up Chinese Rates? Chart 1Chinese Gov Bond Yields Have Led The US Counterpart Since 2015
Chinese Gov Bond Yields Have Led The US Counterpart Since 2015
Chinese Gov Bond Yields Have Led The US Counterpart Since 2015
Increasing bond yields in the US will not necessarily lead to higher bond yields in China. Chart 1 shows that the direction of China’s 10-year government bond yield has a tight correlation with its US counterpart. It is not surprising because business cycles in these giant economies have become more synchronized. Interestingly, China’s 10-year Treasury bond yield has led the US one since 2015. This may be due to China’s growing importance in the world economy. China’s credit and domestic demand growth leads the prices of many industrial metals and in turn, business cycles in many economies. China’s rising long-duration government bond yields reflect expectations of an improving domestic economy, and these expectations often spill over to the rest of the world, including the US. Although the recent sharp rebound in the US Treasury yield is mainly driven by domestic factors, the rebound is unlikely to spill over to their Chinese peers, because the countries are in different stages of their business and policy cycles. America is still at its early stage of economic recovery and fresh stimulus measures are still being rolled out, whereas China has already normalized its policy rates back to pre-pandemic levels and its credit growth peaked in Q4 last year. Chinese fixed-income markets will soon start pricing in moderating growth momentum in the second half of this year, suppressing the long-end of China’s Treasury yield curve (Chart 2). Importantly, none of the optimism that has lifted US Treasury yields - a vaccine-led global growth recovery and a massive US fiscal stimulus – would warrant a better outlook for China. Reopening worldwide economies will likely unleash pent-up demand for services, such as travel and catering, rather than merchandise trade. Chart 3 shows that since the pandemic US spending on goods, which benefited Chinese exports, has soared relative to spending on services. The trend will probably reverse when the US and world economy fully opens, limiting the upside for China’s exports and its contribution to growth this year. Chart 2China And The US Are In Different Stages Of Their Economic Recoveries
China And The US Are In Different Stages Of Their Economic Recoveries
China And The US Are In Different Stages Of Their Economic Recoveries
Chart 3US Consumers Have Been Spending Much More On Goods Than Services During The Pandemic
US Consumers Have Been Spending Much More On Goods Than Services During The Pandemic
US Consumers Have Been Spending Much More On Goods Than Services During The Pandemic
Bottom Line: China’s waning growth momentum will insulate Chinese bond yields from higher US Treasury yields. Do Rising Inflation Expectations In The US Pose Risks Of Policy Tightening In China? Chart 4Imported Inflation Shouldnt Constrain The PBoC
Imported Inflation Shouldnt Constrain The PBoC
Imported Inflation Shouldnt Constrain The PBoC
While China’s monetary policymaking is not entirely insulated from exogenous shocks, it is primarily driven by domestic economic conditions and inflation dynamics. We are not complacent about the risk of a meaningful uptick in global inflation, but we do not consider imported inflation a major policy constraint for the PBoC this year (Chart 4). Furthermore, at last week’s National People’s Congress (NPC), China set the inflation target in 2021 at 3%, which is a high bar to breach. Mounting commodity prices, particularly crude oil prices, may put upward pressures on China’s producer prices, but their impact on China’s overall inflation will be limited for the following reasons: China accounts for a large portion of the world’s commodity demand. Given that the country’s credit impulse has already peaked, domestic demand in capital-intensive sectors (such as construction and infrastructure spending) will slow this year. Reinforced policy restrictions on the property sector will also restrain the upside price potential in industrial raw materials such as steel and cement (Chart 5). For producers, the main and sustained risk for imported inflation will be concentrated in crude oil. The PPI may spike in Q2 and Q3 this year due to advancing oil prices and the extremely low base factor from the same period last year. The PBoC will likely view a spike in the PPI as transitory. Moreover, the recent improvement in producer pricing power appears to be narrow. The output price for consumer goods, which accounts for 25% of the PPI price basket, remains subdued (Chart 6). Chart 5Chinas Demand For Raw Materials Will Slow
Chinas Demand For Raw Materials Will Slow
Chinas Demand For Raw Materials Will Slow
Chart 6Output Price For Consumer Goods Remains In Contraction
Output Price For Consumer Goods Remains In Contraction
Output Price For Consumer Goods Remains In Contraction
Importantly, when oil prices plummeted in the first half of 2020, China’s crude oil inventories showed the fastest upturn on record (Chart 7). It suggests that China’s inventory restocking from last year may help to partially offset the impact from elevated oil prices this year. For consumers, oil prices account for a much smaller percentage of China’s CPI basket than in the US (Chart 8). Food prices, particularly pork, drive China’s headline CPI and can be idiosyncratic. We expect food price increases to be well contained this year due to improved supplies and the high base effect from last year. Chart 7Massive Buildup in Chinas Crude Oil Inventory In 2020
Massive Buildup in Chinas Crude Oil Inventory In 2020
Massive Buildup in Chinas Crude Oil Inventory In 2020
Chart 8Oil Prices Account For A Small Portion In China's Consumer Spending
Oil Prices Account For A Small Portion In Chinas Consumer Spending
Oil Prices Account For A Small Portion In Chinas Consumer Spending
Importantly, China’s inflation expectations have not recovered to their pre-pandemic levels and consumer confidence on future income growth also remains below its end-2019 figure (Chart 9). If this trend holds, then it will be difficult for producers to pass through escalating input costs to end users. Although China’s economy has strengthened, it is far from overheating (Chart 10). Without a sustained above-trend growth rebound, it is difficult to expect genuine inflationary pressures. The pandemic has distorted the balance of global supply and demand, propping up demand and price tags attached to it. In China’s case, however, production capacity and capital expenditures rebounded faster than demand and consumer spending, constraining the upsides in inflation (Chart 11). Chart 9Consumer Inflation Expectations Have Not Fully Recovered
Consumer Inflation Expectations Have Not Fully Recovered
Consumer Inflation Expectations Have Not Fully Recovered
Chart 10Chinese Economy Is Not Yet Overheating
Chinese Economy Is Not Yet Overheating
Chinese Economy Is Not Yet Overheating
China’s CPI is at its lowest point since 2009, making China’s real yields much greater than in the US. Rising real US government bond yields could be mildly positive for China because they help to narrow the Sino-US interest rate differential and temper the pace of the RMB’s appreciation (Chart 12). A breather in the RMB’s gains would be a welcome reflationary force for Chinese exporters and we doubt that Chinese policymakers will spoil it with a rush to hike domestic rates. Chart 11And Production Has Recovered Faster Than Demand
And Production Has Recovered Faster Than Demand
And Production Has Recovered Faster Than Demand
Chart 12Narrowing Real Rate Differentials Helps To Tamper The RMB Appreciation
Narrowing Real Rate Differentials Helps To Tamper The RMB Appreciation
Narrowing Real Rate Differentials Helps To Tamper The RMB Appreciation
Bottom Line: It is premature to worry about an inflation overshoot in China. The current environment is characterized as easing deflation rather than rising inflation. Our base case remains that inflationary pressures will stay at bay this year. Are Higher US Treasury Yields Headwinds For Chinese Stocks? Historically, Chinese stocks have exhibited a loose cyclical correlation with US government bond yields, particularly in the onshore market (Chart 13). Equity prices in China are more closely correlated with domestic long-duration government bond yields, but the relationship is inconsistent (Chart 14). Chart 13Chinese Stocks Have Little Correlation With US Treasury Yields
Chinese Stocks Have Little Correlation With US Treasury Yields
Chinese Stocks Have Little Correlation With US Treasury Yields
Chart 14Correlations Between Chinese Stocks And Domestic Gov Bond Yields Are Inconsistent
Correlations Between Chinese Stocks And Domestic Gov Bond Yields Are Inconsistent
Correlations Between Chinese Stocks And Domestic Gov Bond Yields Are Inconsistent
Chinese stocks are much more sensitive to changes in the quantity of domestic money supply than the price of money. A sharp rebound in China’s 10-year government bond yield in the second half of last year did not stop Chinese stocks from rallying. The insensitivity of Chinese stocks to changes in the price of money is particularly prevalent during the early stage of an economic recovery. As we pointed out in a previous report, since 2015 the PBoC has shifted its policy to target interest rates instead of the quantity of money supply. Thus, credit growth, which propels China’s business cycle and corporate profits, can still trend higher even as bond yields pick up. This explains why domestic credit growth, rather than China’s real government bond yields, has been the primary driver of the forward P/E of Chinese stocks (Chart 15A and 15B). This contrasts with the S&P, in which the forward P/E ratio moves in lockstep with the inverted real yield in US Treasuries (Chart 16). Chart 15ACredit Growth Has Been Driving Up Chinese Stock Valuations
Credit Growth Has Been Driving Up Chinese Stock Valuations
Credit Growth Has Been Driving Up Chinese Stock Valuations
Chart 15BCredit Growth Has Been Driving Up Chinese Stock Valuations
Credit Growth Has Been Driving Up Chinese Stock Valuations
Credit Growth Has Been Driving Up Chinese Stock Valuations
Credit growth in China peaked in Q4 last year and the intensity of the economic recovery has started to moderate. Hence, regardless of the changes in bond yields, Chinese stocks will need to rely on profit growth in order to sustain an upward trend (Chart 17). Chart 16Falling Real Rates Were Propping Up US Equity Valuations
Falling Real Rates Were Propping Up US Equity Valuations
Falling Real Rates Were Propping Up US Equity Valuations
Chart 17Earnings Growth Needs To Accelerate To Support Chinese Stock Performance
Earnings Growth Needs To Accelerate To Support Chinese Stock Performance
Earnings Growth Needs To Accelerate To Support Chinese Stock Performance
The good news is that recent gyrations in the US equity market, coupled with concerns about further tightening in China’s domestic economic policy have triggered shakeouts in China’s equity markets. The pullback in stock prices has helped to shed some excesses in frothy Chinese valuations and has opened a door for more upsides in Chinese stock on a cyclical basis. Bottom Line: Rising Treasury yields in the US or China will not have a direct negative impact on Chinese equities. Last year’s massive credit expansion has lifted both earnings and multiples in Chinese stocks and an acceleration in earnings growth is now needed to support stock performance. Investment Implications The key message from last week’s NPC meetings suggests that policy tightening will be gradual this year. While the 6% growth target was lower than expected, it represents a floor rather than a suggested range and it will likely be exceeded. Bond yields and policy rates are already at their pre-pandemic levels, indicating that there is not much room for further monetary policy tightening this year. The announced objectives for the fiscal deficit and local government bond quotas are only modestly smaller than last year. The economic and policy-support targets support our view that policymakers will be cautious and not overdo tightening. We will elaborate on our takeaways from this year’s NPC in next week’s report. Chart 18Chinese Cyclicals Can Still Benefit From An Improving Global Economic Backdrop
Chinese Cyclicals Can Still Benefit From An Improving Global Economic Backdrop
Chinese Cyclicals Can Still Benefit From An Improving Global Economic Backdrop
Meanwhile, there is still some room for Chinese cyclical stocks to run higher relative to defensives, given the current Goldilocks backdrop of global economic recovery and accommodative monetary policy (Chart 18). We maintain a tactical (0 to 3 months) neutral position on Chinese stocks, in both absolute and relative terms. The market correction has not fully run its course. However, the near-term pullbacks are taking some air out of Chinese equities' frothy valuations, providing room for a cyclical upswing. We are closing our long investable consumer discretionary/short investable consumer staples trade. Instead, we recommend the following trade: long A-share stocks/short MSCI China Index. Investable consumer discretionary sector stocks, which are concentrated in China’s technology giants, face a confluence of challenges ranging from the ripple effects of falling stock prices in the US tech sector and tightened antitrust regulations in China (Chart 19). In contrast, the A-share index is heavily weighted in value stocks while the MSCI China investable index has a large proportion of expensive new economy stocks (Chart 20). The trade is in line with our view that the investment backdrop has shifted in favor of global value versus growth stocks due to a strong US expansion, rising US bond yields and a weaker US dollar. Chart 19Chinese Investable Tech Sector Is Facing Strong Headwinds
Chinese Investable Tech Sector Is Facing Strong Headwinds
Chinese Investable Tech Sector Is Facing Strong Headwinds
Chart 20Overweight A Shares Versus Chinese Investable Stocks
Overweight A Shares Versus Chinese Investable Stocks
Overweight A Shares Versus Chinese Investable Stocks
Jing Sima China Strategist jings@bcaresearch.com Cyclical Investment Stance Equity Sector Recommendations