China

China’s current account surplus jumped to $130.2 billion in Q4 2020 from $92.2 billion in the prior quarter. This corroborates the thesis that thus far, the supply-side has been doing the bulk of the heavy lifting in China’s recovery. It also raises the…
News that China is once more considering export restrictions on rare earth minerals in an effort to harm US defense contractors, is just another instance of US-China tensions. China’s outsized influence on the global supply of rare earths (controlling 80% of…

Highlights Copper prices will continue to rally, following a surge this week to highs not seen since early 2013 on the back of falling inventories, particularly in China, where physical demand has taken stocks to their lowest levels in almost 10 years (Chart of the Week). Physical premiums for the copper cathodes delivered to off-exchange bonded warehouses in China this week are up almost 60% since November – to $73/MT – providing further evidence of market tightness. Mine output in Peru, the second largest producer behind Chile, was down 12.5% to 2.15mm MT last year in the wake of COVID-19 containment measures. Given this large decline in output, the multi-year flattening of supply growth will continue. Upside demand pressure is building, as COVID-19 vaccination rates rise. Funding for the build-out of renewable energy generation is ramping up, and now includes expected US fiscal stimulus focused on renewables. Recovering global GDP, and China’s metals-intensive Five-Year Plan also will contribute to demand growth. We continue to expect COMEX copper to trade above $4/lb this year, but the likelihood this occurs in 1H21 (vs 2H21 as we earlier forecast) is increasing. Forward curves will become more backwardated, as markets continue to tighten. Feature Copper prices will continue to surge on the back of unexpected strength in Chinese demand, which has taken inventory levels to near-decade lows. This is something of an anomaly going into a Lunar New Year – the year of the Metal Ox – when activity typically slows. The big draw from global stocks that went into China’s inventories last year means global stocks will remain tight as the rest of the world continues its recovery from the COVID-19 pandemic (Chart 2). Particularly noteworthy are the huge drops in copper inventories held in the Shanghai Futures Exchange (SHFE, panel 3), and the London Metal Exchange (LME, panel 5), which are driving global drawdowns. Away from the commodity-exchange inventories, premiums for delivery of copper cathodes from bonded warehouses into China surged close to 60% from November levels to $73/MT earlier this week, as demand for physical material surges, according to reuters.com. Cathodes are used to make wire, tubes, for melting stock and in copper alloys. Demand for cathodes is rising outside China, which indicates they will retain a physical premium, even with exports from Chile restored to normal following weather-related disruptions. Chart of the WeekCopper Prices Surge As Global Storage Draws
Copper Prices Surge As Global Storage Draws
Copper Prices Surge As Global Storage Draws
Chart 2Falling Global Inventories Support Copper Prices
Falling Global Inventories Support Copper Prices
Falling Global Inventories Support Copper Prices
Chart 3Sources of Copper Demand Strength
Sources of Copper Demand Strength
Sources of Copper Demand Strength
This year’s departure from a seasonal demand downturn in Chinese copper demand likely is due to government efforts to limit travel to contain COVID-19 contagion, which means workers remain available to meet stronger demand for manufactured goods domestically and abroad. In addition, domestic demand – from electrification and infrastructure to housing – is particularly robust, which has kept pressure on inventories (Chart 3). Longer-Term Copper Demand Strength Baseline industrial, construction and infrastructure demand for copper – what’s already in place and continues to grow in line with the expansion of global GDP – will be augmented by the global build-out of renewables-based electricity generation, as the world moves toward a low-carbon future (Chart 4). Chart 4Incremental Renewables Demand Requires Significant Capex
Copper Surge Welcomes Metal Ox Year
Copper Surge Welcomes Metal Ox Year
While this will not tax existing resources to the extent other materials will – e.g., copper demand from renewables will require less than 20% of existing identified reserves to meet cumulative demand to 2050 vs. the more than 100% of reserves required to meet cobalt demand by 2050 – this is still significant in a market requiring large capex increases to battle declining ore quality (Chart 5).1 Chart 5Higher Prices Needed To Spur Mining CAPEX
Higher Prices Needed To Spur Mining CAPEX
Higher Prices Needed To Spur Mining CAPEX
Copper Supply Side Remains Challenged Short- and long-term challenges to global copper supply abound. Peru’s mine output was down 12.5% last year – to 2.15mm MT – in the wake of COVID-19 containment measures (Chart 6). Given Peru’s unexpectedly large decline in output, the multi-year flattening of supply growth we highlighted last month will continue.2 Indeed, we expect mined and refined output to show little or no growth this year, as was the case last year. This can partly be blamed on a lethargic recovery in mining capex, which hit a 10-year low in 2017. Longer term, as the continued global inventory drawdowns illustrate, the rate of growth in mined and refined production is far below the rate of growth in consumption globally. This is occurring as the pace of China’s recovery from COVID-19 aggregate demand destruction can be expected to start winding down later this year and growth ex-China ramps up (Chart 7). Chart 6Peru Posts Sharply Lower Output
Peru Posts Sharply Lower Output
Peru Posts Sharply Lower Output
Prices for ore and refined copper will have to move higher to incentivize new production over the near term just to meet existing demand, to say nothing of new demand coming on from the global buildout in renewable-energy generation.3 Chart 7Supply Growth Lags Demand Growth
Supply Growth Lags Demand Growth
Supply Growth Lags Demand Growth
Investment Implications As the rates of COVID-19 infection, hospitalization and deaths continue to fall globally, markets will begin to see evidence of an organic recovery in aggregate demand globally taking hold (Chart 8). We also expect this will remove a significant amount of the embedded risk premium in the broad trade-weighted USD, which will be bullish for commodities generally. The combination of organic growth and a weaker USD will boost the level of copper demand globally, even if China is slowing in 2H21, as our China Investment Strategy expects. This will put the weak y/y production growth in mined and refined copper in sharp perspective vis-à-vis copper demand, and will push copper prices higher. These fundamentals also will deepen the backwardation in CME COMEX copper futures for high-grade refined metal, as inventories continue to draw, and markets continue to tighten. We remain long the PICK ETF, and December 2021 COMEX copper futures, which are up 8.42% and 21.7% respectively since their inception dates on December 10, 2020 and September 10, 2020. Chart 8As COVID-19 Receeds Copper Demand Will Increase
As COVID-19 Receeds Copper Demand Will Increase
As COVID-19 Receeds Copper Demand Will Increase
Robert P. Ryan Chief Commodity & Energy Strategist rryan@bcaresearch.com Commodities Round-Up Energy: Bullish The US EIA estimates December and January LNG exports will hover close to 10 BCF/d, continuing a trend noted at the end of last year (Chart 9). November and December LNG exports last year were at record levels – 9.4 BCF/d and 9.8 BCF/d. In January, LNG exports were 9.8 BCF/d, another record for that month. Below-normal temperatures in Asia have spurred demand for US LNG at a time when spot outages at other exporting states reduced global supplies. The EIA expects US LNG exports to average 8.5 BCF/d and 9.2 BCF/d this year and next. Working natural gas stocks at the end of January were 2.7 BCF, up 2% y/y and 8% over the rolling five-year average inventory level. Base Metals: Bullish The European Commission estimates EV nickel demand will be the “single-largest growth sector for nickel demand over the next twenty years.” In a study released by the Commission, global nickel demand is expected to increase by 2.6mm tons by 2040, versus 92k tons in 2020. Internal supply will be sufficient to meet demand for the 27 EU states to 2024/25, according to the study, and thereafter physical deficits will follow. The study notes that without an end-of-life recycling buildout, this deficit will persist, as mining.com noted in its report on the study. Precious Metals: Bullish After sustaining a triple bottom in at ~ $840/oz, platinum prices have rallied almost $400/oz since November (Chart 10). Lower supplies and investor demand drove the rally. Going forward, we expect increasing auto demand – first in China, and then, later, in the rest of the world as organic growth revives – will support demand for platinum-group metals, particularly for platinum and palladium. Platinum posted a 390k-ounce deficit in 2020, while palladium demand exceeded supply by just over 600k oz, according to Johnson Matthey, the PGM refiner. The world consumes ~ 10mm ounces of palladium and ~ 7mm ounces of platinum p.a. Ags/Softs: Neutral Corn, wheat and soybeans were trading 2 – 3% lower, following the USDA’s February 2021 World Agricultural Supply and Demand Estimates (WASDE) released on Tuesday. Markets drastically overestimated the amount by which the USDA would cut ending stocks for the 2020/21 crop year, with the Department trimming corn stocks to 1.5mm bushels (vs a 1.4mm bushel estimate of analysts), according to farmprogress.com. Chart 9
Copper Surge Welcomes Metal Ox Year
Copper Surge Welcomes Metal Ox Year
Chart 10
Platinum Price Rally USD 400 Since November
Platinum Price Rally USD 400 Since November
Footnotes 1 Please see Table 13, p. 27 in Dominish, E., Florin, N. and Teske, S., 2019, Responsible Minerals Sourcing for Renewable Energy. Report prepared for Earthworks by the Institute for Sustainable Futures, University of Technology Sydney. 2 Please see Pandemic Uncertainty Will Fall, Weakening USD, Boosting Metals, published 28 January 2021. It is available at ces.bcaresearch.com. 3 Please see Renewables, China's FYP Underpin Metals Demand, published 26 November 2020. It is available at ces.bcaresearch.com. Investment Views and Themes Recommendations Strategic Recommendations Commodity Prices and Plays Reference Table Summary of Closed Trades
Higher Inflation On The Way
Higher Inflation On The Way
Chinese price indices were mixed in January. Consumer prices surprised to the downside with a 0.3% y/y decline in the CPI. Similarly, core CPI continued its descent, declining to -0.3% y/y, the lowest since late-2009. Meanwhile, as economists expected,…
Dear client, On behalf of the China Investment Strategy team, I would like to wish you a very happy, healthy, and prosperous Chinese New Year of the Ox (Bull)! Gong Xi Fa Chai, Jing Sima, China Strategist Highlights A projected 8% increase in China’s real GDP for 2021 will not be an acceleration from the V-shaped economic recovery from the second half of last year. Excluding an exceptionally strong year-over-year economic expansion in Q1, the average growth in the rest of this year will be slower than in 2H20, which implies China’s economic growth momentum has already passed its peak. On a quarter-over-quarter basis, an expected 18% annual growth in Q1 would mean that China’s economic growth momentum has moderated from Q4 last year. Chinese policymakers are not in a hurry to press the stimulus accelerator again, with good reason. Commodity and risk-asset prices will be the most vulnerable to a weakened demand growth. Feature China’s real GDP is expected to grow by more than 8% this year, which would be a significant improvement over last year’s 2.3%.1 However, it is misleading to compare this year’s growth with that of 2020 as a whole. The first three months of this year will undergo an exceptionally high year-on-year growth (YoY) rate due to the deep contraction experienced in Q1 last year. An 8% annual growth for 2021 would imply that the rate of economic expansion in the rest of this year will be slower than the sharp recovery in 2H20. From a policy perspective, an 8% real GDP growth in 2021 implies an average rate of 5% over the 2020-2021 period, within the long-term growth range targeted in China’s 14th Five-Year Plan - this removes policymakers’ incentives to further stimulate the economy. The annual National People's Congress (NPC) in early March should provide clues about the government's growth priorities and policy directions. If policymakers set 2021’s real GDP growth target at around 8%, our interpretation is that Chinese leaders are not looking to accelerate growth beyond where it ended in 2020. Major equity indexes are already richly valued. A moderating growth momentum from China will weigh on commodity and risk asset prices, both in China and globally. We reiterate our view that downside risks are high in the near term; the market could take the easing demand growth from China as a reason for a long overdue correction. A Perspective On Growth In 2021 Investors should put this year’s GDP growth projections into perspective given last year’s distortions in China’s economic conditions and data. On a YoY basis, data in the first quarter this year will be artificially boosted due to the deep contraction in Q1 last year. The market consensus is that Q1 2021 will register an 18% YoY rate of real GDP expansion. If we assume the economy can expand by 8% this year over 2020, then the YoY GDP growth rates in the rest of this year will average less than 6%. This would be below the 6.5% YoY rate in the fourth quarter of 2020 – meaning that on a YoY basis, China’s growth momentum has peaked (Chart 1). Importantly, sequential growth, such as month-over-month (MoM) and quarter-over-quarter (QoQ), drives the financial markets. On a QoQ basis, Q1 business activities are typically weaker due to the Chinese New Year. However, when we compare the rate of QoQ slowdown in Q1 this year with previous years, an 18% YoY increase would mean China’s output in the first three months of 2021 would be one of the worst in the past 20 years (Chart 2). Chart 1Q1 GDP Growth Will Be Artificially Boosted, On A YoY Basis
Q1 GDP Growth Will Be Artificially Boosted, On A YoY Basis
Q1 GDP Growth Will Be Artificially Boosted, On A YoY Basis
Chart 2…But Will Be On The Weaker Side, On A QoQ Basis
Understanding China’s Growth Arithmetic For 2021
Understanding China’s Growth Arithmetic For 2021
The moderating growth momentum in Q1 this year was already reflected in high-frequency data in January. Most major components in last week’s PMI surveys in both the manufacturing and service sectors had larger setbacks than in January of previous years. Prices in major commodities as well as the Baltic Dry Index softened (Chart 3). Cyclical sector stocks in China’s onshore market, which is highly sensitive to domestic economic policies, have halted their outperformance relative to defensive stocks (Chart 4). Chart 3Chinese Economic Growth May Be Showing Signs Of Moderation
Chinese Economic Growth May Be Showing Signs Of Moderation
Chinese Economic Growth May Be Showing Signs Of Moderation
Chart 4Outperformance In Onshore Cyclical Stocks Is Rolling Over
Outperformance In Onshore Cyclical Stocks Is Rolling Over
Outperformance In Onshore Cyclical Stocks Is Rolling Over
Furthermore, it is useful to look past the growth outliers in the previous four quarters to gain insight into the status of China’s business cycle. On a two-year smoothed term, an 8% annual output growth in 2021 would represent a continuation of China’s downward economic growth trend (Chart 5). Chart 5This Years Rebound In Headline GDP Growth Does Not Alter Chinas Structural Downtrend
This Years Rebound In Headline GDP Growth Does Not Alter Chinas Structural Downtrend
This Years Rebound In Headline GDP Growth Does Not Alter Chinas Structural Downtrend
Bottom Line: It is misleading to consider an 8% YoY real GDP growth rate in 2021 as an acceleration in China’s economic recovery. On a quarterly basis, Q1 will undergo a moderation in growth momentum. The economy in the rest of the year will remain on a downward growth trend. No Rush To Stimulate Anew If Q1 growth turns out to be weaker than the market anticipates, then will Beijing continue to dial back stimulus? Or, will it become concerned about the underlying fragility in the economy and provide more support? So far, all signs point to a continuation of a stimulus pullback. Chart 6Tighter Monetary Conditions are Starting To Bite the Economy
Tighter Monetary Conditions are Starting To Bite the Economy
Tighter Monetary Conditions are Starting To Bite the Economy
The resurgence of domestic COVID-19 cases contributed significantly to January’s shaky demand. However, tighter monetary conditions in 2H20 are likely another reason for the growth moderation (Chart 6). Here are some factors that may have prompted Chinese authorities to stay on track to scale back stimulus: Policymakers appear to consider the massive fiscal stimulus last year overdone. In contrast with the previous two years, local governments are not issuing special-purpose bonds (SPBs) before the NPC sets its quota in early March. China’s broader fiscal budgetary deficit widened to 11% of GDP in 2020 from 6% in 2019. Local governments issued nearly 70% more SPBs in 2020 than in the previous year (Chart 7). SPBs are mostly used for investing in infrastructure projects and last year’s fiscal support along with substantial credit expansion helped to speed up infrastructure investment. However, towards the end of last year local governments reportedly experienced a shortage in profitable investment projects and thus, parked more than 400 billion yuan of proceeds from last year’s SPB issuance at the central bank (Chart 8). This will likely convince the central government to reduce the SPB quota by a large margin this year. Chart 7Fiscal Stimulus Last Year May Be Overdone
Fiscal Stimulus Last Year May Be Overdone
Fiscal Stimulus Last Year May Be Overdone
Chart 8Local Governments Reportedly Ran Out Of Profitable Infrastructure Projects To Invest Last Year
Local Governments Reportedly Ran Out Of Profitable Infrastructure Projects To Invest Last Year
Local Governments Reportedly Ran Out Of Profitable Infrastructure Projects To Invest Last Year
In addition, government revenues in 2020 were surprisingly strong and spending was well below budgeted annual expenditures, resulting in 2.5 trillion yuan in idle funds (Chart 9). Based on China’s fiscal budget laws, any unspent funds from the previous year will be carried over to the next year. In other words, the 2.5 trillion yuan will contribute to fiscal deficit reduction this year and are not extra savings that can be distributed. In addition, asset price bubbles are a perennial concern. Land sales and housing demand for top-tier cities roared back last year due to cheap loans and a relaxed policy environment (Chart 10). In our opinion, Chinese leaders allowed the real estate market to temporarily heat up last year to avoid a deep economic recession. As the economy recovered to its pre-pandemic level by late 2020, policymakers have sharply reduced their tolerance for the booming housing market and substantially tightened restrictions in the real estate sector. Chart 9Unspent Fiscal Stimulus Checks Do Not Lead To Higher Government Spending Next Year
Unspent Fiscal Stimulus Checks Do Not Lead To Higher Government Spending Next Year
Unspent Fiscal Stimulus Checks Do Not Lead To Higher Government Spending Next Year
Chart 10Housing Market Heats Up Again
Housing Market Heats Up Again
Housing Market Heats Up Again
The domestic labor market has been surprisingly resilient, removing the leadership’s political constraints and incentives to further stimulate the economy. Labor market conditions and household income are improving. The gap between household disposable income and spending growth has narrowed, the unemployment rate is back to its pre-pandemic level and consumer confidence has rebounded (Chart 11). More importantly, China’s labor market in urban areas is tightening again, with migrant workers receiving higher pay than prior to the pandemic (Chart 12). Chart 11Labor Market Is On The Mend
Labor Market Is On The Mend
Labor Market Is On The Mend
Chart 12China’s Urban Labor Market Is Tightening Again
Understanding China’s Growth Arithmetic For 2021
Understanding China’s Growth Arithmetic For 2021
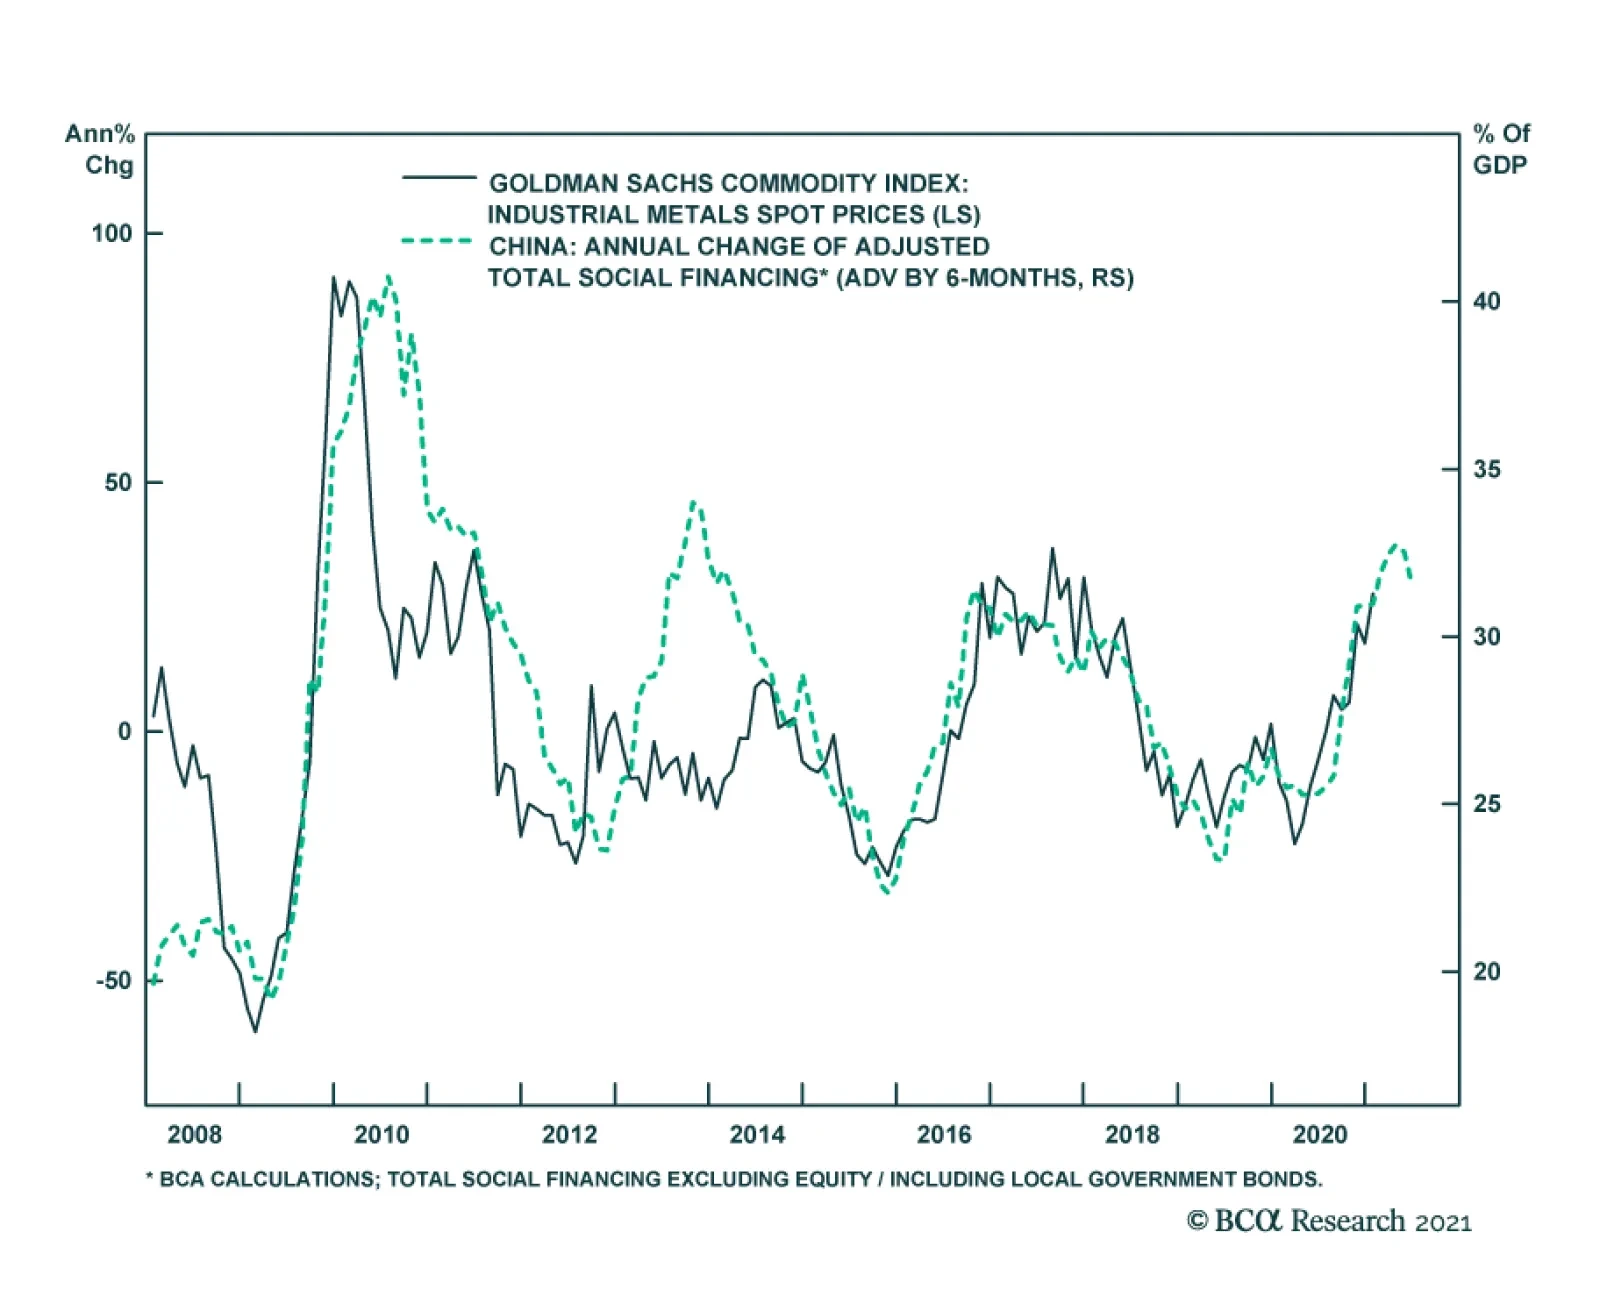
Bottom Line: Growth rates will moderate, but policymakers will wait for more evidence of a pronounced slowdown in economic conditions before they ease policies. Concerns about financial risks and excesses in the property market entail authorities to allow stimulus of 2020 to relapse. It will take a much deeper slowdown in the business cycle before easing is re-introduced. Investment Implications Our baseline view indicates that credit growth will decelerate by two to three percentage points in 2021 from 2020, and the local government SPB quota will drop by 10%. The projected pullbacks on stimulus are small and more measured than the last policy tightening cycle in 2017/18. Nevertheless, a smaller stimulus and tighter policy environment will consequently lead to moderating growth momentum in China’s domestic economy and demand, particularly in the second half of this year. Chart 13How Far Can Chinas Inventory Restocking Cycle Go Without More Policy Tailwinds
How Far Can Chinas Inventory Restocking Cycle Go Without More Policy Tailwinds
How Far Can Chinas Inventory Restocking Cycle Go Without More Policy Tailwinds
Commodity prices may be at high risk of easing demand. The strong rebound in China’s commodity imports in 2H20 was not only due to a recovery in domestic consumption, but also inventory restocking from an extremely low level. Chart 13 shows that the change in China’s industrial inventories relative to exports has risen substantially from a two-year contraction. Going forward, the pace of inventory accumulation will slow following a weaker policy tailwind and growth momentum, which will weigh on the demand for and prices of key industrial raw materials. Corporate profits should continue to recover, albeit at a slower rate than in 2H20. At the same time, risks are tilted to the downside, and policy initiatives should be closely monitored going forward. As such, we maintain a cautious view on Chinese stocks. Jing Sima China Strategist jings@bcaresearch.com Footnote: 1 IMF World Economic Outlook and World Bank Global Outlook, January 2021 Footnotes Cyclical Investment Stance Equity Sector Recommendations
On the surface, China’s credit numbers were surprisingly strong in January. Aggregate financing was CNY 5.17 trillion from a revised CNY 1.72 trillion in December, significantly above expectations of CNY 4.60 trillion. New loans were a record CNY 3.58…
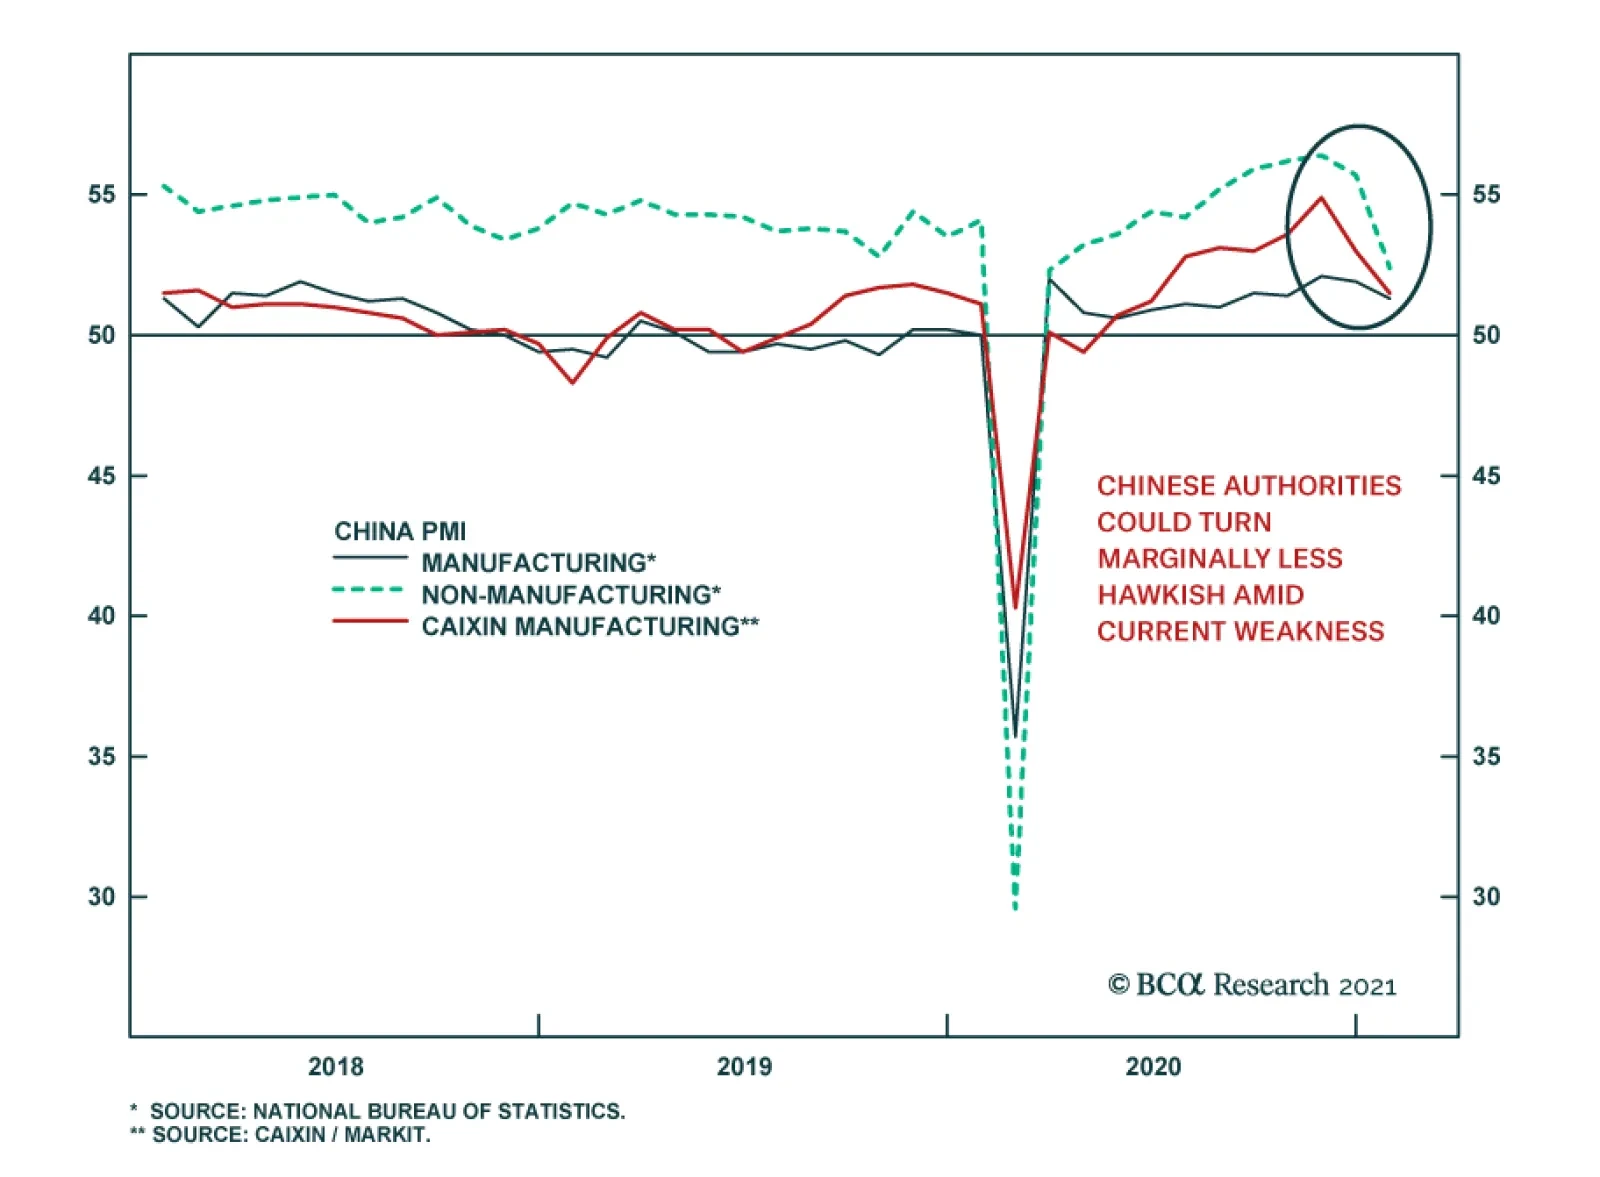
Highlights Chart 1China's PMIs Dropped In January
China Macro And Market Review
China Macro And Market Review
January’s official PMI suggests that China’s economic recovery started the year on a weaker note. While both manufacturing and non-manufacturing PMIs remain in expansionary territory, the moderation was larger than in previous Januarys, which implies that more than seasonal factors were at play (Chart 1). The lockdowns in January due to a resurgence of COVID-19 cases in China are distorting business activities. Moreover, travel restrictions imposed for the upcoming Lunar New Year (LNY) will profoundly affect household consumption and the service sector in February and perhaps into March. Chinese stock prices, on the other hand, registered gains in January in both onshore and offshore markets. As noted in last week’s report, Chinese stocks face downside risks in the near term and we recommend that investors turn cautious. Economic and profit growth may disappoint in the first quarter, against a tightening policy backdrop. Feature Monetary Policy Normalization Remains On Track In the past three weeks, the PBoC drained short-term liquidity on a net basis from the interbank system. This action reversed market expectations in earlier January that the central bank would start to loosen monetary stance. Chart 2Chinas Monetary Policy Unlikely To Change Course When The Economy Strengthens
Chinas Monetary Policy Unlikely To Change Course When The Economy Strengthens
Chinas Monetary Policy Unlikely To Change Course When The Economy Strengthens
The soft patch in China’s first-quarter economic recovery may prompt the PBoC to temporarily slow the pace of interest rate tightening, but it is unlikely that policymakers will reverse their policy normalization over the next 6 to 12 months (Chart 2). The authorities have been increasingly concerned about asset price inflation. In our view, near-term policy shifts will be tied to asset prices rather than consumer prices. The PBoC stated that its policymaking will be data dependent, but it may not succumb to a marginally slower recovery, particularly if the weakness proves to be transitory. Moreover, the unprecedented growth contraction from Q1 last year will boost economic data in the first three months of this year due to a low base effect. This year’s monetary policy could be reminiscent of 2019 when the PBoC frequently adjusted the short-term interbank rate (i.e. 1- to 7-days) while keeping the longer rate (3-month repo rate) mostly trendless throughout the year (Chart 3). In this scenario, China's 10-year government bond yield will not rise by as much as in 2017-2018 (Chart 4). Without a substantial improvement in profit growth, however, a slower rise in bond yields will be only marginally positive for Chinese stocks (Chart 4, bottom panel). Chart 3Policy Normalization Remains On Track
Policy Normalization Remains On Track
Policy Normalization Remains On Track
Chart 4Smaller Bond Yield Hikes Are Marginally Positive For Chinese Stocks
Smaller Bond Yield Hikes Are Marginally Positive For Chinese Stocks
Smaller Bond Yield Hikes Are Marginally Positive For Chinese Stocks
Corporations May Not Deliver Strong Profit Growth In 2021 Chart 5An Impressive Profit Recovery Supported The Stock Rally In 2H20
An Impressive Profit Recovery Supported The Stock Rally In 2H20
An Impressive Profit Recovery Supported The Stock Rally In 2H20
The newly released industrial profits data showed a sharp rebound in growth this past December, with the annual profit up by 4.1% over 2019. An impressive recovery in profit growth in the second half of last year helped to drive up Chinese stock prices (Chart 5). However, the magnitude of the rally in stock prices has been much more substantial than implied by the underlying profit growth. Industrial profits have barely recovered to their 2018 levels, while A shares have jumped by 40% in the past two years (Chart 5, bottom panel). Moreover, the strong recovery in profit growth may not be sustainable in 2021. While sales revenues may pick up even more this year, operating costs will likely increase, which would compress corporate profit margins (Chart 6). Lower operating costs from last year’s cheaper financing and growth-support policies, such as tax cuts and loan payment deferrals, helped to widen corporate profit margins. China’s social security contribution exemption and reduction policy reduced the cost burden of enterprises by 1.5 trillion yuan in 2020. Moreover, cheaper global commodity and oil prices in earlier 2020 also lowered China’s industrial input prices (Chart 7). Chart 6Increasing Operation Costs May Weigh On Industrial Profit Margins
Increasing Operation Costs May Weigh On Industrial Profit Margins
Increasing Operation Costs May Weigh On Industrial Profit Margins
Chart 7Input Prices Have Risen Faster Than Output Prices
Input Prices Have Risen Faster Than Output Prices
Input Prices Have Risen Faster Than Output Prices
Chart 8Product Inventories And Account Receivables Have Not Fully Recovered
Product Inventories And Account Receivables Have Not Fully Recovered
Product Inventories And Account Receivables Have Not Fully Recovered
The normalization of policy rates and bond yields along with the rebound in commodity prices will weigh on industrial profit margins and profit growth this year. Furthermore, some cost-reduction benefits will be rolled back: policymakers have announced an end to the social security contribution waiver for corporations in 2021. However, they will extend the reduction of unemployment insurance from the end of April 2021 to April 2022. It is still unclear whether China will grant the same scale of corporate tax relief this year as it did in 2020. We note that industrial inventory turnover has not recovered to its pre-pandemic level, finished product inventories remain high, and accounts receivable payments are taking longer to reach businesses compared with 2019. All these factors highlight a lack of vigor in the industrial sector’s recovery (Chart 8). Travel Restrictions Will Dampen Q1 Economic Growth Chart 9A New Wave Of COVID-19 Cases In China
A New Wave Of COVID-19 Cases In China
A New Wave Of COVID-19 Cases In China
New travel restrictions may cause some short-term distortion in China’s aggregate economy in the first quarter. China announced inter-provincial travel constraints for the LNY, effective between January 28 and March 8, due to a resurgence of COVID-19 cases in Beijing and the northern provinces (Chart 9). Local authorities urged migrant workers to stay in their work places and not return to their hometowns. According to the Ministry of Transport, it is estimated that around 50% of migrant workers will remain in place during the LNY. Manufacturing production (secondary industry) may increase slightly because workers will take fewer vacation days during the LNY. Nevertheless, the positive effect will be more than offset by large losses from consumption and tourism (tertiary industry). Reduced consumption from holiday travel, restaurant dining, offline shopping and services will overwhelm online retail sales of goods and services. All these factors will negatively impact Q1 GDP because tertiary industry accounts for around 55% of China’s GDP, a much larger slice than secondary industry1 (Chart 10). January’s PMI shows that after narrowing in the past six months, the gap between production (supply) and new orders (demand) sub-indexes widened again in January (Chart 11). We expect the travel restrictions to exacerbate the goods oversupply in February and perhaps even into March. Chart 10New Travel Restrictions Will Have A Negative Impact On Q1 GDP
New Travel Restrictions Will Have A Negative Impact On Q1 GDP
New Travel Restrictions Will Have A Negative Impact On Q1 GDP
Chart 11Goods Oversupply May Last Through Q1
Goods Oversupply May Last Through Q1
Goods Oversupply May Last Through Q1
Lingering Deflationary Pressures While headline CPI moved back into inflationary territory in December, mainly driven by food price increases, core CPI has fallen to its lowest level since late 2010 (Chart 12). Prices for some key consumer goods and services remain firmly in deflation and they may deteriorate further in Q1 due to a high price base during last year’s LNY. Chart 12Lingering Deflationary Pressures On Consumer Prices
Lingering Deflationary Pressures On Consumer Prices
Lingering Deflationary Pressures On Consumer Prices
Chart 13PPI Will Likely Turn Positive In Q1 Due To Low Base Effect
PPI Will Likely Turn Positive In Q1 Due To Low Base Effect
PPI Will Likely Turn Positive In Q1 Due To Low Base Effect
Chart 14A Stronger RMB Will Exacerbate Deflationary Pressures
A Stronger RMB Will Exacerbate Deflationary Pressures
A Stronger RMB Will Exacerbate Deflationary Pressures
PPI deflation has eased and will probably turn positive in Q1 this year, supported by an expansionary business cycle and a low base (Chart 13). However, the risk of deflation may resurface in the second half of the year as stimulus effects subside. As such, China’s corporate profit growth will again face downward pressure, which would be exacerbated by a stronger RMB and rising real interest rate (Chart 14). Shipping Disruptions Should Be Transitory China’s export sector remains strong, benefiting from improving global demand and strength in China’s manufacturing supply chains. The drop in January’s PMI export new orders sub-index was mainly seasonal and could be due to the recent pandemic-related logistical disruptions and bottlenecks at ports (Chart 15). The recent massive jump in freight costs reflects these one-off factors and bouts of inflation this year due to disruptions in logistics, which will likely prove to be transitory (Chart 16). Chart 15Exports Should Remain Robust Through 1H21
Exports Should Remain Robust Through 1H21
Exports Should Remain Robust Through 1H21
Chart 16A Jump In Freight Costs is Probably Transitory
A Jump In Freight Costs is Probably Transitory
A Jump In Freight Costs is Probably Transitory
Real Estate Sector Under Stricter Scrutiny Housing demand and prices in top-tier cities picked up again in December despite rising mortgage rates and more restrictive bank lending to the real estate sector (Chart 17). In our view, the rebound in floor space started will be short-lived, and the gap between floor space started and completed will continue to converge (Chart 18). Real estate developers face stricter borrowing regulations and the rate of expansion of new projects will slow this year due to shrinking land transfers in 2020. Still, real estate developers will continue to finish their existing projects and promote new home sales. Therefore, on a net basis, we expect real estate investment and construction activities to remain stable in the first half of 2021. Chart 17Housing Demand In First Tier Cities Climbed Again In December
Housing Demand In First Tier Cities Climbed Again In December
Housing Demand In First Tier Cities Climbed Again In December
Chart 18A Rebound In Floor Space Started May Be Short lived
A Rebound In Floor Space Started May Be Short lived
A Rebound In Floor Space Started May Be Short lived
Table 1China Macro Data Summary
China Macro And Market Review
China Macro And Market Review
Table 2China Financial Market Performance Summary
China Macro And Market Review
China Macro And Market Review
Qingyun Xu, CFA Senior Analyst qingyunx@bcaresearch.com Jing Sima China Strategist jings@bcaresearch.com Footnotes 1China’s secondary industry is mainly comprised of mining, manufacturing, the production and supply of electricity, gas and water, and construction. The tertiary industry refers to traffic, storage and mail businesses, information transfer, computer services and software, wholesale and retail trade, accommodation and food, finance, and other services. Cyclical Investment Stance Equity Sector Recommendations
China’s economic recovery moderated more than expected in January. The composite PMI released by China’s National Bureau of Statistics fell to 52.8 from 55.1 on the back of both weaker readings for the Manufacturing and Non-Manufacturing components.…
BCA Research’s Global Investment Strategy service concludes that continued Chinese stimulus will support commodities and cyclical equity sectors. It will also allow the RMB to strengthen further, which should be beneficial for other EM assets. The…
Highlights US-China tensions are escalating over the Taiwan Strait as Beijing tests the new Biden administration, yet financial markets are flying high and unprepared for a resumption of structurally elevated geopolitical risk. US restrictions on Chinese tech and arms sales, US internal political divisions, Taiwanese independence activists, China’s power grab in Hong Kong, and aggressive foreign policy from Xi Jinping create what could become a perfect storm. The rattling of sabers can escalate further as a “fourth Taiwan Strait crisis” has been a long time coming – though “gun to head” we do not think China’s civilian leadership is ready to initiate a war over Taiwan. Biden’s shift to a more defensive US strategy on tech offers Beijing the far less risky alternative of continuing its current (very successful) long game. We are closing most of our risk-on, cyclical trades and shifting to a neutral position until we can get a better read on how far the crisis will escalate. Maintain hedges and safe-haven trades: gold, yen, health stocks, an Indian overweight in EM, and defense stocks relative to others. Feature President Joe Biden faces his first crisis as the US and China rattle sabers over the Taiwan Strait. The crisis does not come at a surprise to watchers of geopolitics but it could produce further negative surprises for financial markets that are just starting to take note of it. This premier geopolitical risk combined with vaccine rollout problems, weak economic data releases, and signs of froth sent global equities down 2% over the past five days. The US 10-year Treasury yield fell to 1%, the USD-CNY rose by 0.03%, gold fell by 0.6%, and copper fell by 2%. As things stand today, we are prepared to buy on the dip but we are closing most of our long bets and positioning for a big dip now that our premier geopolitical risk in the Taiwan Strait shows signs of materializing. A series of Chinese air force drills have cut across the far southwestern corner of Taiwan’s Air Defense Identification Zone (ADIZ) over the past week, giving alarm to the Taiwanese military (Map 1). Beijing is sending a clear warning to the Biden administration that Taiwan is its “red line” – namely Taiwanese independence but also Beijing’s access to Taiwanese-made semiconductors. There is not yet a clear signal that China is about to attack or invade Taiwan but an attack is possible. Investors should not underrate the significance of a show of force over Taiwan at this juncture. Map 1Flight Paths Of People’s Liberation Army Aircraft, January 24, 2021
Is The Taiwan Strait Crisis Here? – A GeoRisk Update
Is The Taiwan Strait Crisis Here? – A GeoRisk Update
Chart 1Global Trade Troubles
Global Trade Troubles
Global Trade Troubles
We are also taking this opportunity to book a 37% gain on our long US energy trade. Global politics are fundamentally anarchic in the context of the US’s relative geopolitical decline, and internal divisions and distractions, and the simultaneous economic shocks that have knocked global trade off course (Chart 1), jeopardizing the newfound success and stability of the ambitious emerging market challengers to the United States. Geopolitical Risk Is Back (Already) Chart 2US And China Lead Global Growth Recovery
US And China Lead Global Growth Recovery
US And China Lead Global Growth Recovery
The US and China have snapped back more rapidly than other economies from the COVID-19 pandemic despite their entirely different experiences (Chart 2). The virus erupted in China but its draconian lockdowns halted the outbreak while it unleashed a wave of monetary and fiscal stimulus to reboot the economy. The US showed itself unwilling and unable to maintain strict lockdowns, leaving its economy freer to operate, and yet also unleashed a wave of stimulus. The US stimulus is the biggest in the world yet China’s is underrated in Chart 3 due to its reliance on quasi-fiscal credit expansion, which amounted to 8.5% of GDP. That goes on top of the 5.6% of GDP fiscal expansion shown here. For most of the past year financial markets have priced the positive side of this stimulus – the fact that it prevented larger layoffs, bankruptcies, and defaults and launched a new economic cycle. Going forward they will face the negative side, which includes financial instability and foreign policy assertiveness. Countries that are domestically unstable yet fueled by government spending can take risks that they would not otherwise take if their economy depended on private or foreign sentiment. The checks and balances that prevent conflict during normal times have been reduced. Chart 3US Leads Stimulus Blowout This Time, Though China Stimulus Larger Than Appears
Is The Taiwan Strait Crisis Here? – A GeoRisk Update
Is The Taiwan Strait Crisis Here? – A GeoRisk Update
Global economic policy uncertainty has fallen from recent peaks around the world but it remains elevated in the US, China, and Russia, which are engaged in a great power struggle that will continue in the coming years (Chart 4). This struggle has escalated with each new crisis point, from 2001 to 2008 to 2015 to 2020, and shows no sign of abating in 2021. Chart 4APolicy Uncertainty Still Rising Here ...
Policy Uncertainty Still Rising Here ...
Policy Uncertainty Still Rising Here ...
Chart 4B... And Can Easily Revive Here
... And Can Easily Revive Here
... And Can Easily Revive Here
Chart 5Terrorism Falling In World Ex-US (For Now)
Terrorism Falling In World Ex-US (For Now)
Terrorism Falling In World Ex-US (For Now)
Europe, the UK, Australia, and various emerging markets will suffer spillover effects from this geopolitical struggle as well as from their own domestic turmoil in the wake of the global recession. Immigration and terrorism have dropped off in recent years but will revive in the Middle East and elsewhere when the aftershocks of the global crisis lead to new state failures, weakened governments, and militant extremism (Chart 5). In many countries, domestic political risks appear contained today but the reality is that social unrest and political opposition will mount over time if unemployment is not dealt with and inflation starts to climb. These two factors combine form the “Misery Index,” a useful indicator of socio-political discontent. India, Russia, Brazil, Turkey, South Africa, Mexico, and Indonesia are just a few of the major emerging markets that face high or rising misery indexes and hence persistent forces for political change (Chart 6). Chart 6AMore Social And Political Unrest To Come
More Social And Political Unrest To Come
More Social And Political Unrest To Come
Chart 6BMore Social And Political Unrest To Come
More Social And Political Unrest To Come
More Social And Political Unrest To Come
So far there have not been many changes in government – the US is the major exception. But change will accelerate from here. It is not hard to see that weakening popular support for national leaders and their ruling coalitions will result in more snap elections, election upsets, and surprise events in the coming months and years (Chart 7). Chart 7Changing Of The Guard Under Way In Global Politics
Is The Taiwan Strait Crisis Here? – A GeoRisk Update
Is The Taiwan Strait Crisis Here? – A GeoRisk Update
Chart 8Italian Elections Heighten Sovereign Spread
Italian Elections Heighten Sovereign Spread
Italian Elections Heighten Sovereign Spread
For example, Italian voters likely face an early election even though Prime Minister Giuseppe Conte saw some of the best opinion polling of any first-world leader since COVID emerged. Last year we identified Italy as a leading candidate for an early snap election and we still maintain that an election is the likeliest outcome of the crumbling ruling coalition. The pandemic has created havoc in the country and now the ruling parties want to take advantage of the situation to strengthen their hand in distributing the $254 billion in European recovery funds destined for Italy. A new electoral law was passed in the fall, enabling an election to go forward, and the leading parties all hope to have control of parliament when the next presidential election occurs in early 2022, since the president is a key player in government and cabinet formation. Political risk is therefore set to increase and boost the risk premium in Italian bonds, producing a counter-trend spread widening for the coming 12 months or so (Chart 8). Anti-establishment right-wing parties, which taken together lead in public opinion, threaten to blow out the Italian budget. It is not a foregone conclusion that they will prevail – and these parties have moderated their rhetoric on the euro and monetary union – but it is an understated risk at present and has some staying power, even if moderate by the standards of geopolitical risks in other regions. Russia also faces rising political and geopolitical risk in the aftermath of the pandemic, which has had an outsized effect on a population that is disproportionately old and unhealthy (Chart 9). Moscow is now witnessing the most serious outpouring of government opposition since 2011 despite the fact that its cyclical economic conditions are not the worst among the emerging markets. The economic recovery is likely to be stunted by the new US administration’s efforts to extend and expand sanctions and any geopolitical conflicts that ensue. We remain negative on Russian equities as we have for the past two years and look at other emerging market oil plays as offering the same value without the geopolitical risk (Chart 10). Chart 9Russian Social Unrest Aggravated By Pandemic
Is The Taiwan Strait Crisis Here? – A GeoRisk Update
Is The Taiwan Strait Crisis Here? – A GeoRisk Update
Chart 10Russian Equities Face Persistent Geopolitical Risk
Russian Equities Face Persistent Geopolitical Risk
Russian Equities Face Persistent Geopolitical Risk
Investors do not need to care about social unrest in itself but do need to pay attention when it leads to a change in government or the overall policy setting. This is what we will monitor for the countries highlighted in these charts as being especially at risk. Italy and Spain are the most likely to see government change in the developed world, though we should note that however stable Germany’s ruling Christian Democrats appear as Chancellor Angela Merkel steps down, there could still be an upset this fall (Chart 11). France’s Emmanuel Macron is still positioned for re-election next year but his legislative control is clearly in jeopardy – and it is at least worth noting that the right-wing anti-establishment leader Marine Le Pen has started to move up in the polls for the first time since 2017, even though she has a very low chance of actually taking power (Chart 12). Chart 11German Election Not A Foregone Conclusion
German Election Not A Foregone Conclusion
German Election Not A Foregone Conclusion
Chart 12Signs Of Life For Marine Le Pen?
Signs Of Life For Marine Le Pen?
Signs Of Life For Marine Le Pen?
Chart 13UK Now Turns To Keeping Scotland
UK Now Turns To Keeping Scotland
UK Now Turns To Keeping Scotland
Even the UK, which has found the “middle way” solution to the Brexit imbroglio, in true British form, faces a significant increase in political risk beginning with local elections in May. If these produce a resounding victory for the Scottish National Party then it will interpret the vote as a mandate to pursue a second independence referendum, which will be a narrow affair even if Prime Minister Boris Johnson is tentatively favored to head it off (Chart 13). Bottom Line: Financial markets have been preoccupied with the pandemic and global stimulus. But now political and geopolitical risks are underrated once again. They are starting to rear their heads, not only in the US-China-Russia power struggle but also in the domestic politics of countries that face high policy uncertainty and high or rising misery indexes. Biden And Xi Bound To Collide It is too soon to identify the “Biden Doctrine” in American foreign policy, as the new president has not yet taken significant action, but the all-too-predictable showdown in the Taiwan Strait could provide the occasion. Since the fall of 2019 we have warned that US-China great power competition would intensify despite any “phase one” trade deal. President Trump undertook a flurry of significant punitive measures on China during his lame duck months in office and now Beijing is pressuring the Biden administration to reverse these measures or at least call a halt to them. The fundamental premise of Biden’s campaign against President Trump was that he would restore America’s active role in international affairs against the supposed isolationism of Trump. Of course, the fact that the Democrats gained full control of Congress means that Biden will not be restricted to foreign policy over his four-year term but will be consumed with trying to cut deals on Capitol Hill to pass his domestic agenda. Nevertheless Biden’s foreign policy schedule is already packed as he is rattling sabers with China, issuing warnings to Russian President Vladimir Putin, and cutting off arms sales to Saudi Arabia and the UAE to signal that he intends to reformulate the Iranian nuclear deal. Americans broadly favor an active role in the world, which is clear from opinion polling in the wake of Trump’s challenge to the status quo – they are weary of wars in the Middle East but are not showing appetite for a broader withdrawal from global affairs (Chart 14). Similarly polling on global trade shows that Trump, if anything, roused the public’s support for trade despite French or Japanese levels of skepticism about it. Chart 14Americans Still Favor Global Engagement
Americans Still Favor Global Engagement
Americans Still Favor Global Engagement
The implication is that the US budget deficit will remain larger for longer and that the US trade deficit will balloon amidst a surge in domestic demand. Trump’s attempt to shrink trade deficits without shrinking the budget deficit (or overall demand) proved economically impossible. Chart 15Biden And The US Role In The World
Biden And The US Role In The World
Biden And The US Role In The World
The Biden administration is opting for expanding the twin deficits albeit at a much greater risk to the dollar’s value. Markets have already discounted this shift to the point that the dollar is experiencing a bounce from having reached oversold levels. The bounce will continue but it is against the grain, the fall will resume later, as indicated by these policies. Another implication is that defense spending will not fall much due to the geopolitical pressures facing the Biden administration. Non-defense spending will go up but defense spending will remain at least flat as a share of overall output (Chart 15). With this policy setting in the US, policy developments in China made it inevitable that US-China strategic tensions would resume where Trump left off despite Biden’s campaign platform of de-emphasizing the China threat. In the long run, Biden’s push for renewed engagement with China runs up against the fact that Beijing’s overarching political and economic strategy is focused on import substitution and technological acquisition, as outlined in the fourteenth five-year plan. China’s share of global exports has grown even larger despite the pandemic and yet China is weaning itself off of global imports in pursuit of strategic self-sufficiency. The US will be left with less global export share, less market access in China, and ongoing dependency on trade surplus nations to buy its debt (Chart 16). Unless, that is, the Biden administration engages in very robust diplomacy and is willing to take geopolitical risks not unlike those that Trump took. Chart 16China's Role In The World Motivates Opposition
China's Role In The World Motivates Opposition
China's Role In The World Motivates Opposition
Chart 17China Plays Are Getting Stretched
China Plays Are Getting Stretched
China Plays Are Getting Stretched
One of the clear takeaways from the above is that industrial metals and China plays, like the Australian dollar and Swedish equities, are facing a pullback. Though Chinese policymakers will ultimately accommodate the economy, the combination of a domestic policy tug-of-war and a renewal of US-China tensions will take the air out of these recent outperformers (Chart 17). Bottom Line: The Biden administration faces a resumption in strategic tensions with China. First, the immediate crisis over the Taiwan Strait can escalate from here (see below). Second, the US-China economic conflict is set to escalate over the long run with the US pursuing an unsustainable policy of maximum reflation while China turns away from the liberal “reform and opening” agenda that enabled positive US-China ties since 1979. This combination points to a large increase in the US trade dependency on China even as China grows more independent of the US and technologically capable. This result ensures that tensions will persist over the long run. Is The Fourth Taiwan Strait Crisis Already Here? Biden may be forced into significant foreign policy action right away in the Taiwan Strait, where General Secretary Xi Jinping has put his fledgling administration to the test. Over the past week Beijing has sent a large squadron of nuclear-capable bombers and fighter jets to cut across the far southwest corner of Taiwan’s Air Defense Identification Zone (Map 2). This activity is a continuation of an upgraded tempo of military drills around the island, including a flight across the median line last year, and follows an alleged army build-up across from the island last year.1 The US for its part has upgraded its freedom of navigation operations over the past several years, including in the Taiwan Strait (though not yet putting an aircraft carrier group into the strait as in the 1990s). Map 2Flight Paths Of People’s Liberation Army Aircraft, January 25-28, 2021
Is The Taiwan Strait Crisis Here? – A GeoRisk Update
Is The Taiwan Strait Crisis Here? – A GeoRisk Update
In response to China’s sorties on January 23, the US State Department urged the People’s Republic to stop “attempts to intimidate its neighbors, including Taiwan,” called for mainland dialogue with Taiwan’s “elected representatives” (albeit not naming anyone), declared that the US would deepen ties with Taiwan, and pledged a “rock-solid” commitment to the island. Not coincidentally the USS Roosevelt aircraft carrier arrived in the South China Sea on the same day as China’s largest sortie, January 24. Meanwhile a Chinese government spokesman said the military drills should be seen as a “solemn warning” to the Biden administration that China will reunify the island by force if necessary. China is not only concerned about Taiwanese secession and US-Taiwan defense relations, as always, but is specifically concerned that the Biden administration will persist with the technological “blockade” that the Trump administration imposed on Huawei, Semiconductor Manufacturing International Corporation (SMIC), their suppliers, and a range of other Chinese state-owned enterprises and tech firms. Neither the US nor Chinese statements have yet made a definitive break with the longstanding policy framework on Taiwan that first enabled US-China détente and engagement. The US State Department reiterated its commitment to the diplomatic documents that frame the relationship with the People’s Republic and the Republic of China, namely the Three Communiques, the Taiwan Relations Act, and the Six Assurances. It did not make explicit mention of the One China Policy although the US version of that policy is incorporated in the first of the three communiques (the 1972 Shanghai Communique). However, China may not be appeased by this statement. Xi Jinping has gradually shifted the language in major Communist Party policy statements over the past several years to indicate a greater willingness to use force against Taiwan, even suggesting that he envisions the reunification of China by 2035.2 The Trump administration’s offensives have accelerated this security dilemma. In addition to export controls on high tech, Trump signed several significant bills on Taiwan into law over the course of his term that aim to upgrade the relationship. These include the Taiwan Assurance Act of 2020 at the end of last year, which calls for deeper US-Taiwan relations, greater Taiwanese involvement in international institutions, larger US arms sales to support Taiwan’s defense strategy, and more diplomatic exchanges.3 Separately, the US and Taiwan also signed a science-and-technology cooperation agreement on December 15 and the Biden administration is interested in negotiating a free trade agreement.4 A few additional points: The struggle over access to Taiwan’s state-of-the-art semiconductor production continues to escalate. The Trump administration concluded its tenure by cutting off American exports of chips, parts, designs, and knowhow to Chinese telecom giant Huawei, thus putting Taiwan Semiconductor Manufacturing Company (TSMC) into the position of having to halt sales of certain goods to the mainland. TSMC accounts for one-fifth of global semiconductor capacity and produces the smallest, fastest, and most efficient chips. China’s SMIC has been hamstrung by these controls as well as Huawei and other Chinese tech champions. This issue remains unresolved and is the primary immediate driver of conflict between the US and China since both economies would suffer if semiconductor supplies were severed. The US’s capability of imposing a tech blockade on China threatens its long-term productivity and hence potentially regime survival, while China’s capability of attacking Taiwan threatens the critical supply lines of the US and its northeast Asian allies, including essential computer chips for US military needs (the main reason the US has tried to strong-arm TSMC into building a fabrication plant in Arizona).5 US arms sales en route to Taiwan. While there are rumors that the Biden administration will delay these sales, the Taiwanese government claims they have been assured that the transfers will go forward. This arms package does not include the most provocative weapons systems, such as F-35 fighter jets, but it does contain advanced weapons systems and weapons that can be seen as offensive rather than defensive. These include truck-mounted rocket launchers, precision strike missiles, 66 F-16 fighter jets, Harpoon anti-ship missiles, subsea mines, and advanced drones. So it is possible that Beijing will put its foot down to prevent the transfer, just as it tried to halt the less-sensitive transfer of THAAD missiles to South Korea during the last US presidential transition. If this should be the case then it will cause a major escalation in tensions until the US either halts the arms transfer or completes it – and completing the transfer, if China issues an ultimatum, will lead to conflict. Growth of “secessionist forces” in Taiwan. Chinese media have specifically cited a political “alliance” that formed on January 24 and aims to revise the island’s democratic constitution. The Taiwanese public no longer sees itself primarily as Chinese but as Taiwanese and is increasingly opposed to eventual reunification. What is the end-game? First, as stated, the current escalation in tensions can go much further in the coming weeks and months. We are not prepared to sound the “all clear” as a confrontation has been building for years and could conceivably amount to Cuban Missile Crisis proportions, which would likely trigger a bear market. Second, we do not yet see China staging a full-scale attack or invasion on Taiwan. China’s goal is to continue expanding its economy and technology, its economic heft in Asia and the world, and thus its global influence and military power. It cannot achieve this goal if it is utterly severed from Taiwan, but it also cannot achieve this goal if it precipitates a war with not only Taiwan but also the US, Japan, other US allies, and a devastation of the very semiconductor foundries upon which Taiwan’s critical importance stands. Playing the long game of growing its economy and taking incremental steps of imposing its political supremacy has paid off so far, including in Hong Kong and the South China Sea. Both Russia’s and China’s gradual slices of regional power have demonstrated that the US does not have the appetite, focus, and resolve to fight small wars at present – whereas Washington is untested on its commitment to major wars such as an invasion of Taiwan would precipitate. At very least China needs to determine whether the Biden administration intends to impose a technological blockade, as the Trump administration looked to do. Biden has so far outlined a “defensive game” of securing US networks, preventing US trade in dual-use technologies that strengthen China’s military, on-shoring semiconductor production, and accelerating US research and development. This leaves open the possibility of issuing waivers for trade in US-made or US-designed items that do not have military purposes, albeit with the US retaining the possibility of removing the waivers if China does not reciprocate. This strategy amounts to what Biden’s “Asia Tsar,” Kurt Campbell, has called “stable competition.” Therefore the earliest indications from the Biden administration suggest that it will seek a lowering of temperature while defending the US’s red lines – and this should prevent a full-scale Taiwan war in the short run, though it does not prevent a major diplomatic crisis at any time. If Biden does in fact pursue this more accommodative approach, and seeks to reengage China, then that Beijing has a much lower-cost strategy that is immediately available, as opposed to an all-or-nothing gambit to stage the largest amphibious assault since D-Day, which is by no means assured to succeed and could in the worst case provoke a nuclear war. This strategy includes negotiating waivers on US tech restrictions, accelerating its high-tech import substitution strategy, and continuing to poach the talent from Taiwan and steal the technology needed to circumvent US restrictions. As long as Washington does not make a dash for a total blockade, Beijing should be expected to pursue this alternate strategy. Investment Takeaways The market is not priced for a serious escalation in US-China-Taiwan tensions. If there is a 17% chance of a 30%-40% drawdown in equities on jitters over a major war, then equities should suffer a full 7%+ correction to discount the possibility. While the prospects of full-scale war are much lower, at say 5%, these odds could escalate rapidly if the two sides fail to mitigate a diplomatic or military crisis through red telephone communications. Chart 18China/Taiwan Policy Uncertainty Will Converge To Upside
China/Taiwan Policy Uncertainty Will Converge To Upside
China/Taiwan Policy Uncertainty Will Converge To Upside
While Chinese policy uncertainty remains elevated, it still has plenty of room to rise. It has diverged unsustainably from Taiwanese uncertainty, which only recently showed signs of ticking up in response to manifest strategic dangers. This gap will converge to the upside as US-China tensions persist and the global news media gradually turns its spotlight away from Donald Trump, alerting financial markets to the persistence of the world’s single most important geopolitical risk right under their nose (Chart 18). Inverting our market-based Geopolitical Risk Indicators, so that falling risk is shown as a rising green line, it becomes apparent that Chinese equities and Taiwanese equities have gone vertical, have only started to correct, and are highly exposed to exogenous events stemming from their fundamentally unstable political relationship. Hong Kong stocks, by contrast, have performed in line with the market’s perception of their political risk, so that there is less discrepancy between market sentiment and reality – even though they will also sell off in the event that this week’s events escalate into a larger confrontation (Chart 19). Chart 19Geopolitical Risks Lurking In Asian Equities
Geopolitical Risks Lurking In Asian Equities
Geopolitical Risks Lurking In Asian Equities
Chart 20Stay Long Korea / Short Taiwan Due To Geopolitical Risk
Stay Long Korea / Short Taiwan Due To Geopolitical Risk
Stay Long Korea / Short Taiwan Due To Geopolitical Risk
South Korean stocks were also overstretched and due for correction. We have long advocated a pair trade favoring Korean over Taiwanese stocks to capture the relative geopolitical risk as well as more favorable valuations in Korea (Chart 20). The ingredients for a fourth Taiwan Strait crisis are all present. This week’s showdown could escalate further. Global and East Asian equities are overbought and vulnerable to a larger correction, especially Taiwanese stocks. US equities are also sky-high and vulnerable to a larger correction, although they would be favored relative to the rest of the world in the event of a full-fledged crisis. Chart 21Geopolitical Flare-Up Would Upset This Trend
Geopolitical Flare-Up Would Upset This Trend
Geopolitical Flare-Up Would Upset This Trend
We maintain our various geopolitical longs and hedges, including gold, Japanese yen, an Indian overweight within EM, and health stocks. We remain long global defense stocks as well. Because our base case is that the current crisis will not result in war, but rather high diplomatic tensions, we are inclined to buy on the dips. But we expect a big dip even in the event of a merely diplomatic crisis that involves no jets shot down or ships sunk. Therefore for now we are closing long municipal bonds versus Treasuries, long international stocks versus American, long GBP-EUR, long Trans-Pacific Partnership countries, and long value versus growth stocks. These trades should be reinitiated once we have clarity on the magnitude of the US-China crisis, given the extremely accommodative economic and policy backdrop, which will, if anything, become more accommodative if geopolitical risks materialize yet fall short of total war. Oil and copper would suffer relative to gold in the meantime (Chart 21). Our remaining strategic portfolio still favors stocks that would ultimately benefit from instability in Greater China, such as European industrials relative to global, Indian equities relative to Chinese, and South Korean equities relative to Taiwanese. While the spike in tensions reinforces our conclusion in last week’s report that long-dated Chinese government bonds should rally on Taiwan risk, this recommendation was made in the context of discussing domestic Chinese markets and is primarily intended for mainland investors or those with a mandate to invest in Chinese assets. Foreign investors could conceivably be exposed to sanctions or capital controls in the event of a major crisis – as we have long flagged is also a risk with foreign holders of Russian ruble-denominated bonds. We have made a note in our trade table accordingly. Matt Gertken Vice President Geopolitical Strategy mattg@bcaresearch.com Footnotes 1 Brad Lendon, "Almost 40 Chinese warplanes breach Taiwan Strait median line; Taiwan President calls it a 'threat of force,'" CNN, September 21, 2020, cnn.com. 2 Richard C. Bush, "8 key things to notice from Xi Jinping’s New Year speech on Taiwan," Brookings Institute, January 7, 2019, brookings.com. 3 Trump also signed the Taiwan Travel Act on March 16, 2018 and the Taiwan Allies International Protection and Enhancement Initiative Act on March 26, 2019. For the Taiwan Assurance Act, see Kelvin Chen, "Trump Signs Taiwan Assurance Act Into Law," Taiwan News, December 28, 2020, taiwannews.com. 4 Jason Pan, "Alliance formed to draft Taiwanese constitution," Taipei Times, January 24, 2021, taipeitimes.com; Emerson Lim and Matt Yu, "Taiwan, U.S. sign agreement on scientific cooperation," Focus Taiwan, December 18, 2020, focustaiwan.tw; Ryan Hass, "A case for optimism on US-Taiwan relations," Brookings Institute, November 30, 2020, brookings.com. 5 Thomas J. Shattuck, "Stuck in the Middle: Taiwan’s Semiconductor Industry, the U.S.-China Tech Fight, and Cross-Strait Stability," Foreign Policy Research Institute, Orbis (65:1) 2021, pp. 101-17, www.fpri.org. Section II: GeoRisk Indicators China
China: GeoRisk Indicator
China: GeoRisk Indicator
Russia
Russia: GeoRisk Indicator
Russia: GeoRisk Indicator
UK
UK: GeoRisk Indicator
UK: GeoRisk Indicator
Germany
Germany: GeoRisk Indicator
Germany: GeoRisk Indicator
France
France: GeoRisk Indicator
France: GeoRisk Indicator
Italy
Italy: GeoRisk Indicator
Italy: GeoRisk Indicator
Canada
Canada: GeoRisk Indicator
Canada: GeoRisk Indicator
Spain
Spain: GeoRisk Indicator
Spain: GeoRisk Indicator
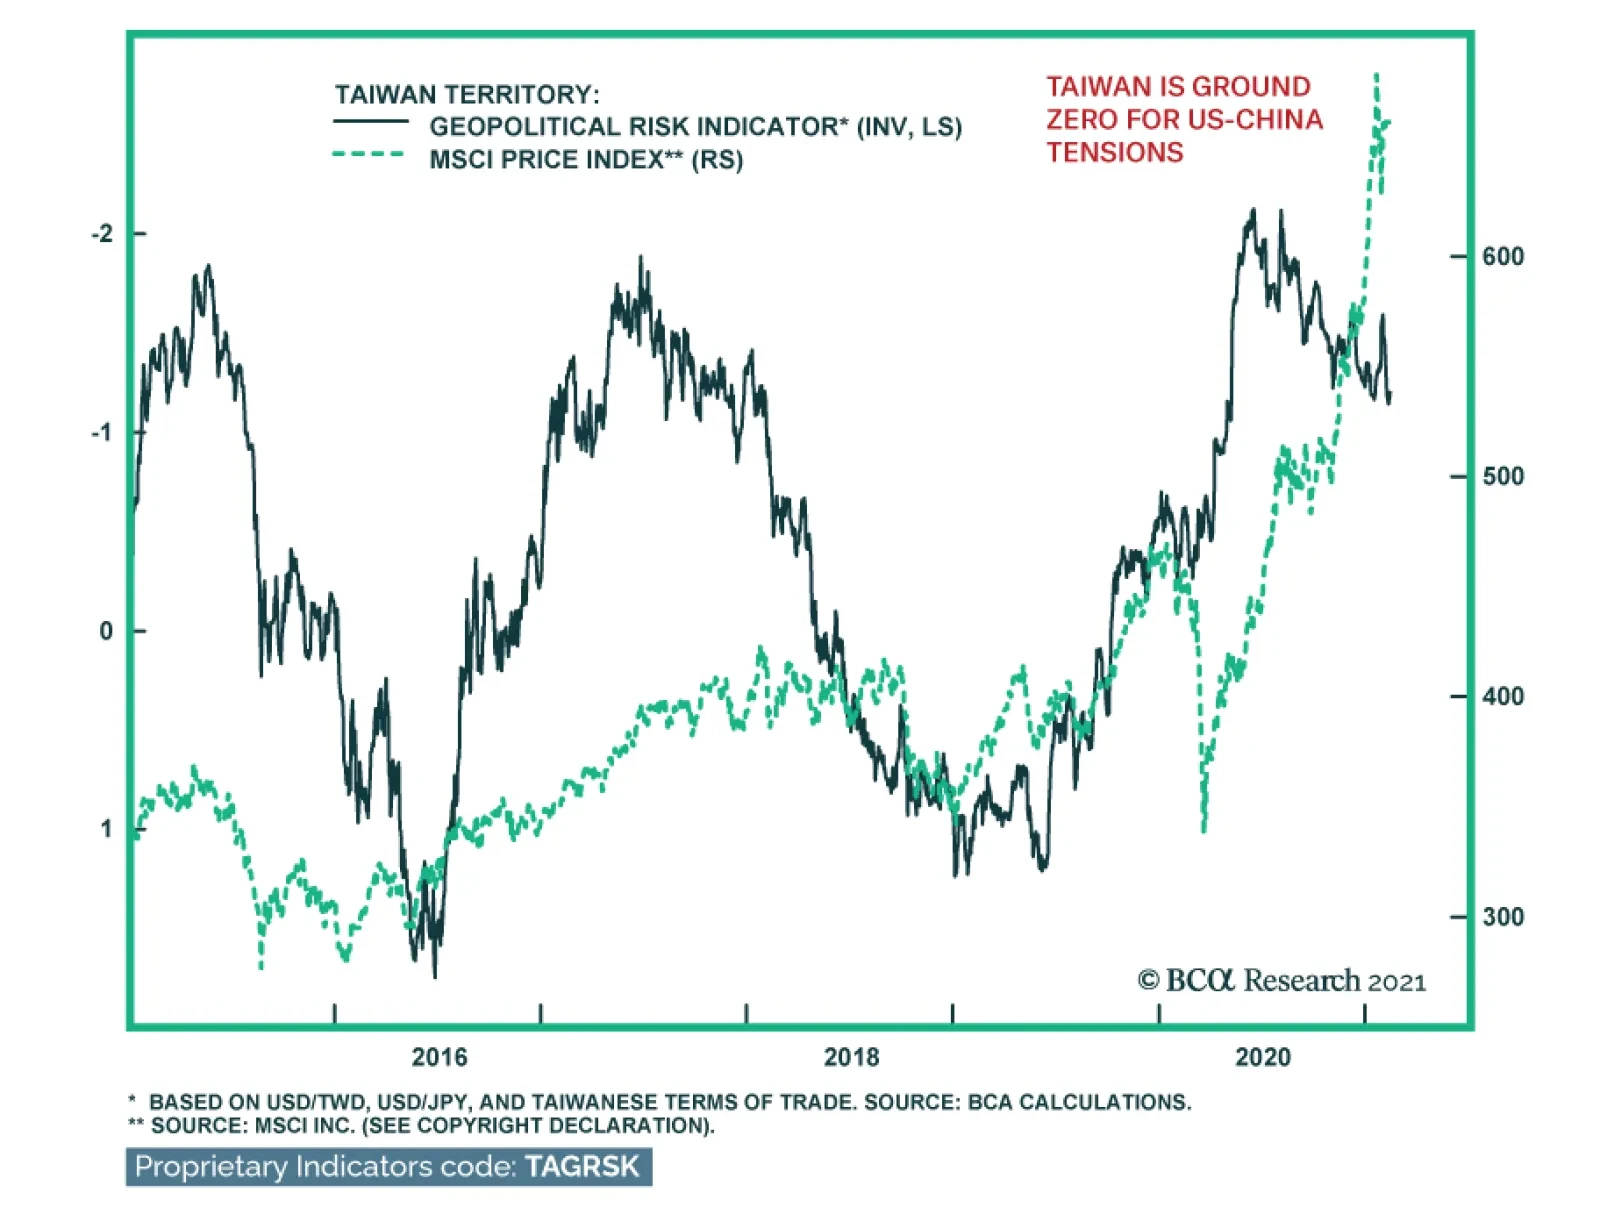
Taiwan
Taiwan: GeoRisk Indicator
Taiwan: GeoRisk Indicator
Korea
Korea: GeoRisk Indicator
Korea: GeoRisk Indicator
Turkey
Turkey: GeoRisk Indicator
Turkey: GeoRisk Indicator
Brazil
Brazil: GeoRisk Indicator
Brazil: GeoRisk Indicator
Section III: Geopolitical Calendar