China

Highlights Pandemic uncertainty is keeping the USD well bid by raising global economic policy uncertainty. When this breaks – i.e., as higher vaccination rates push contagion rates down – the USD will resume its bear market. Renewable-energy output surpassed fossil-fuel generation in Europe for the first time in 2020. With the Biden administration re-committing to renewables, and China and Europe continuing their build-outs, copper demand will rise to meet grid-expansion needs. Copper mine output fell 0.5% in Jan-Oct 2020. Treatment and refining charges – already at 10-year lows – will remain depressed as supplies tighten. Major exchanges’ refined copper inventories were down 17% y/y in December, suggesting weak mine output continued into end-2020. Stocks will continue to fall this year, backwardating the COMEX's copper forward curve (Chart of the Week). Based on the World Bank’s forecast for real global GDP growth of 4% this year, and our expectation for a weaker USD, COMEX copper prices will likely breach $4.00/lb by 2H21. COVID-19 uncertainty drives metals: If infection and hospitalization rates outpace vaccinations, additional lockdowns in the US and Europe will stymie the recovery. Success in expanding vaccinations will push economic activity higher. We expect the latter outcome. Feature Pandemic uncertainty is driving global economic policy uncertainty, which is keeping a safe-haven bid under the USD (Chart 2). Chart of the WeekPhysical Copper Deficit Signals Continued Inventory Draws
Physical Copper Deficit Signals Continued Inventory Draws
Physical Copper Deficit Signals Continued Inventory Draws
This continues to stymie the recovery in industrial commodity prices, particularly oil and base metals.1 The uncertainty caused by the COVID-19 pandemic feeds directly into global economic policy uncertainty, which drives USD safe-haven demand. Chart 2USD Remains In The Thrall Of Pandemic Uncertainty
USD Remains In The Thrall Of Pandemic Uncertainty
USD Remains In The Thrall Of Pandemic Uncertainty
Pandemic uncertainty will not abate until vaccination distribution is sufficient to put infection, hospitalization and death rates on a clear downward trajectory, and remove the threat of widespread lockdowns, which once again are required to deal with rampant contagion rates and the possible spread of vaccine-resistant COVID-19 mutations locally and globally. As markets see empirical evidence of falling COVID-19-related infection, hospitalization and mortality, safe-haven demand for USD will weaken. Massive fiscal and monetary support will continue to support GDP globally, until organic growth takes off after sufficient populations are vaccinated, per the World Bank’s assumptions (Chart 3).2 Fiscal stimulus in the US exceeds 25% of GDP, and will continue to expand as the Biden administration rolls out additional spending measures. With the Fed remaining willing and able to accommodate this massive fiscal profligacy in the US, the USD will face increasing pressure on the downside as normalcy returns. Chart 3Massive Fiscal Support Globally Will Be Replaced By Organic Growth
Pandemic Uncertainty Will Fall, Weakening USD, Boosting Metals
Pandemic Uncertainty Will Fall, Weakening USD, Boosting Metals
A weaker USD and stronger economic growth would boost copper prices this year and the next. A 5% decline in the broad trade-weighted USD this year would push spot COMEX copper prices above $4.30/lb, all else equal, while a 4% boost in world GDP – in line with the World Bank’s forecast for real growth this year – would lift prices to just under $4.05/lb, based on our modeling (Chart 4).3 Chart 4Lower USD, Stronger GDP Bullish For Copper Prices
Lower USD, Stronger GDP Bullish For Copper Prices
Lower USD, Stronger GDP Bullish For Copper Prices
Renewable Generation Will Boost Copper Demand In addition to these stronger fundamentals, base metals demand – particularly for copper – will continue to benefit from the build-out of renewable-energy electricity generation globally, particularly in Europe and China. The return of the US to the Paris Agreement to combat climate change, and a renewed effort by the Biden administration to fund expanded renewable-energy resources will add to the increase in base-metals demand accompanying this global build-out (Chart 5).4 Europe is moving out ahead of the US in its deployment of renewable electricity generation, which, for the first time ever, surpassed fossil-fuel generation in 2020.5 S&P Global Market Intelligence this week reported renewable energy sources accounted for 38% of electricity generation in the EU vs 37% for fossil fuels. Renewables also surpassed fossil-fuel generation in the UK last year. Wind, solar and hydro all saw strong gains. Chart 5Copper Is Indispensible For A Low-Carbon Future
Pandemic Uncertainty Will Fall, Weakening USD, Boosting Metals
Pandemic Uncertainty Will Fall, Weakening USD, Boosting Metals
Copper Supply Continues To Tighten It is important to once again note that all of these, and other renewable technologies, will require higher base metals output, none moreso than copper, which spans all renewable technologies. With copper-mining capex still weak and ore qualities falling in the mines that are producing, the supply side remains challenged (Chart 6). Over the past two years, p.a. supply growth on the mining side has been close to flat. The International Copper Study Group (ICSG) this week reported copper mine output fell 0.5% in the first 10 months of 2020. Refined copper output was up 1.5% over the same interval. Treatment and refining charges – already at 10-year lows – will remain depressed as supplies tighten. We expect full-year mined and refined output to fall on either side of zero growth for 2020, and 2021 (Chart 7).6 Major exchanges’ refined copper inventories were down 17% y/y in December, according to the ICSG, suggesting weak mine output continued into end-2020. An apparent increase in refined copper consumption of 2% noted by the ICSG also contributed to lower inventories. The Group estimates global refined copper balances adjusted for changes in Chinese bonded stocks, which are believed to have increased 105k tons y/y in the Jan-Dec 2020 interval, posted a physical deficit of ~ 380k tons. Chart 6Weak Capex, Lower Copper Ore Quality Remain Chief Supply-Side Challenges
Weak Capex, Lower Copper Ore Quality Remain Chief Supply-Side Challenges
Weak Capex, Lower Copper Ore Quality Remain Chief Supply-Side Challenges
Chart 7Mined, Refined Copper Supply Growth Remains Weak
Mined, Refined Copper Supply Growth Remains Weak
Mined, Refined Copper Supply Growth Remains Weak
We expect inventories will continue to fall this year – as seen in the Chart of the Week – as demand strengthens and supply growth remains weak, which will backwardate the COMEX copper forward curve. Metal Ox Year Brings Short-Term Uncertainties The approach of the Chinese New Year beginning 12 February 2021 normally would herald massive travel and celebration, which, all else equal, would dampen economic growth until festivities ended. This year, however, reports of a re-emergence of COVID-19 infections is casting doubt on this year’s celebrations. In addition, winter industrial curtailments to reduce pollution also should reduce short-term demand for metals generally. These transitory factors should show up in lower levels of economic activity on the industrial side. For this reason, we expect seasonal weakness to show up in 1Q21 activity, to be followed in 2Q21 by higher growth y/y. Bottom Line: Copper fundamentals continue to paint a bullish price picture, particularly on the supply side. Although risks abound on both sides of the market, we expect the massive support being provided by fiscal and monetary policy globally to transition to organic growth in 2H21, in line with the World Bank’s expectations. The enormous fiscal stimulus being unleashed by the US – coupled with an ultra-accommodative Fed – will result in a weakening of the USD that will provide a tailwind to copper prices in 2H21 and next year. We remain long the PICK ETF, expecting copper miners and traders to benefit from this bullish backdrop, which we expect to persist for the next decade. The recommendation is up 6.4% since inception December 10, 2020. We also remain long December 2021 copper, which is up 19.6% since it was recommended on September 10, 2020. Robert P. Ryan Chief Commodity & Energy Strategist rryan@bcaresearch.com Commodities Round-Up Energy: Bullish After falling 11% in 2020 due to COVID-19-induced demand destruction, US energy-related CO2 emissions will rebound this year and next, according to the Energy Information Administration (Chart 8). The EIA forecasts US energy-related CO2 emissions this year and next will be 4.8 and 4.9 billion MT, which would amount to a 4.7% and 3.2% gains, respectively. The EIA tracks emissions from coal, petroleum and natural gas usage in the US in its estimates. Petroleum accounts for ~ 46% of total emissions in 2021 and 2022, while natgas contributes ~ 33% of all energy-related emissions in both years, on average. Reflecting its market-share loss in the power-generation market, coal accounts for ~ 21% of total US energy-related CO2 emissions in 2021 and 2022. Base Metals: Bullish Globally, crude steel production was down 0.9% y/y at 1.864 billion MT, the World Steel Association reported this week. China’s steel production was up 5.2% last year, to 1.053 billion MT, the country a market share of 56.5%, up from 2019’s level of 53.3%. Output in all of Asia totalled 1.375 billion MT, up 1.5% y/y, with India’s production falling close to 11% to 99.6 billion MT. China’s iron-ore imports set a record last year on the back of its strong steel-making performance, reaching 1.2 billion tonnes, a 9.5% increase y/y. Higher infrastructure spending was the primary driver of increased steel demand last year. Iron ore delivered to the Chinese port of Tianjin (62% Fe) closed just above $169/MT on Tuesday, up ~ 9% YTD. Precious Metals: Bullish Gold continues to trade ~ $1,850/oz, down more than $100/oz from its highs earlier this month on the back of persistent USD strength (Chart 9). The pandemic uncertainty feeding into global economic policy uncertainty is the proximate cause of dollar strength. COVID-19 vaccine rates are increasing, and governments remain committed to widespread distribution, which likely will be visible to markets during 1H21. Once this occurs, we expect gold to rally along with other commodities, as the safe-have bid is priced out of the USD. Ags/Softs: Neutral US corn prices rallied on the back of stronger China purchases of the grain on Tuesday. Farm Futures reported a 53.5mm-bushel order out of China on Tuesday was responsible for the gain earlier this week. Farmers continue to expect Chinese buying to remain strong, given falling corn stocks in China. Chart 8
Pandemic Uncertainty Will Fall, Weakening USD, Boosting Metals
Pandemic Uncertainty Will Fall, Weakening USD, Boosting Metals
Chart 9
Gold Trading Lower On The Back of A Strong Dollar
Gold Trading Lower On The Back of A Strong Dollar
Footnotes 1 At the margin, this increases the cost of purchasing commodities and lowers the cost of producing them ex-US in local-currency terms, both of which depress prices. Pandemic uncertainty and global economic policy uncertainty (GEPU) are cointegrated; the USD and GEPU also are cointegrated. We discussed the effects of pandemic uncertainty on the USD and its impact on oil prices in last week’s balances and price forecast update entitled Brent Forecast: $63 This Year, $71 Next Year. This report is available at ces.bcaresearch.com. 2 Please see the Bank's Global Economic Prospects released 5 January 2021 entitled Subdued Global Economic Recovery. The IMF upgraded its global growth outlook to 5.5% this year and 4.2% next year, in its World Economic Outlook Update released this week. We continue to use the more conservative World Bank forecasts. The Israeli economy is providing something of a natural experiment vis-à-vis the rate of COVID-19 vaccination and economic growth. According to reuters.com, the country got an early start on vaccinations, and has one of the highest rates in the world. If maintained, this will result in GDP growth of 6.3% in 2021 and 5.8% next year. Without these early and intensive vaccination rates, 2021 growth likely would be 3.5%. 3 The models in Chart 4 use the broad trade-weighted USD and global copper stocks as common regressors, and estimate copper prices given the World Bank estimates for World, EM ex-China, China and DM real GDPs. In the discussion above, we use elasticities from the World GDP model to highlight the impact of changes in copper prices from the different variables. 4 Please see Renewables, China's FYP Underpin Metals Demand, which we published 26 November 2020. We discuss the implications of essentially rebuilding the global electric-generation grid to accommodate more renewable energy resources vis-à-vis base metals demand. Copper, in particular, spans all technologies that will be deployed to achieve a low-carbon generation pool globally, as Chart 5 illustrates. 5 Please see For 1st time, renewables surpass fossil fuels in EU power mix published by S&P Global Market Intelligence 25 January 2021. 6 Benchmark treatment and refining fees charged by smelters to refine raw ore fell to 5.9 cent/lb this year, down from 6.2 cent/lb last year, according to reuters.com. This 10-year low reflects an abundance of smelting capacity relative to concentrates on the supply side needing to be refined. Investment Views and Themes Recommendations Strategic Recommendations Commodity Prices and Plays Reference Table Summary of Closed Trades
Higher Inflation On The Way
Higher Inflation On The Way
According to BCA Research’s China Investment Strategy service, overstretched stock prices relative to earnings risk a snapback in A-shares. We remain cautious on short-term prospects for China’s onshore equity markets. Market commentators remain sharply…
The recent massive jump in freight costs overstates improvements in global trade. Chinese exports have been accelerating at a healthy clip and freight traffic is recovering, but the surge in China’s containerized freight index eclipses both. Instead, shipping…
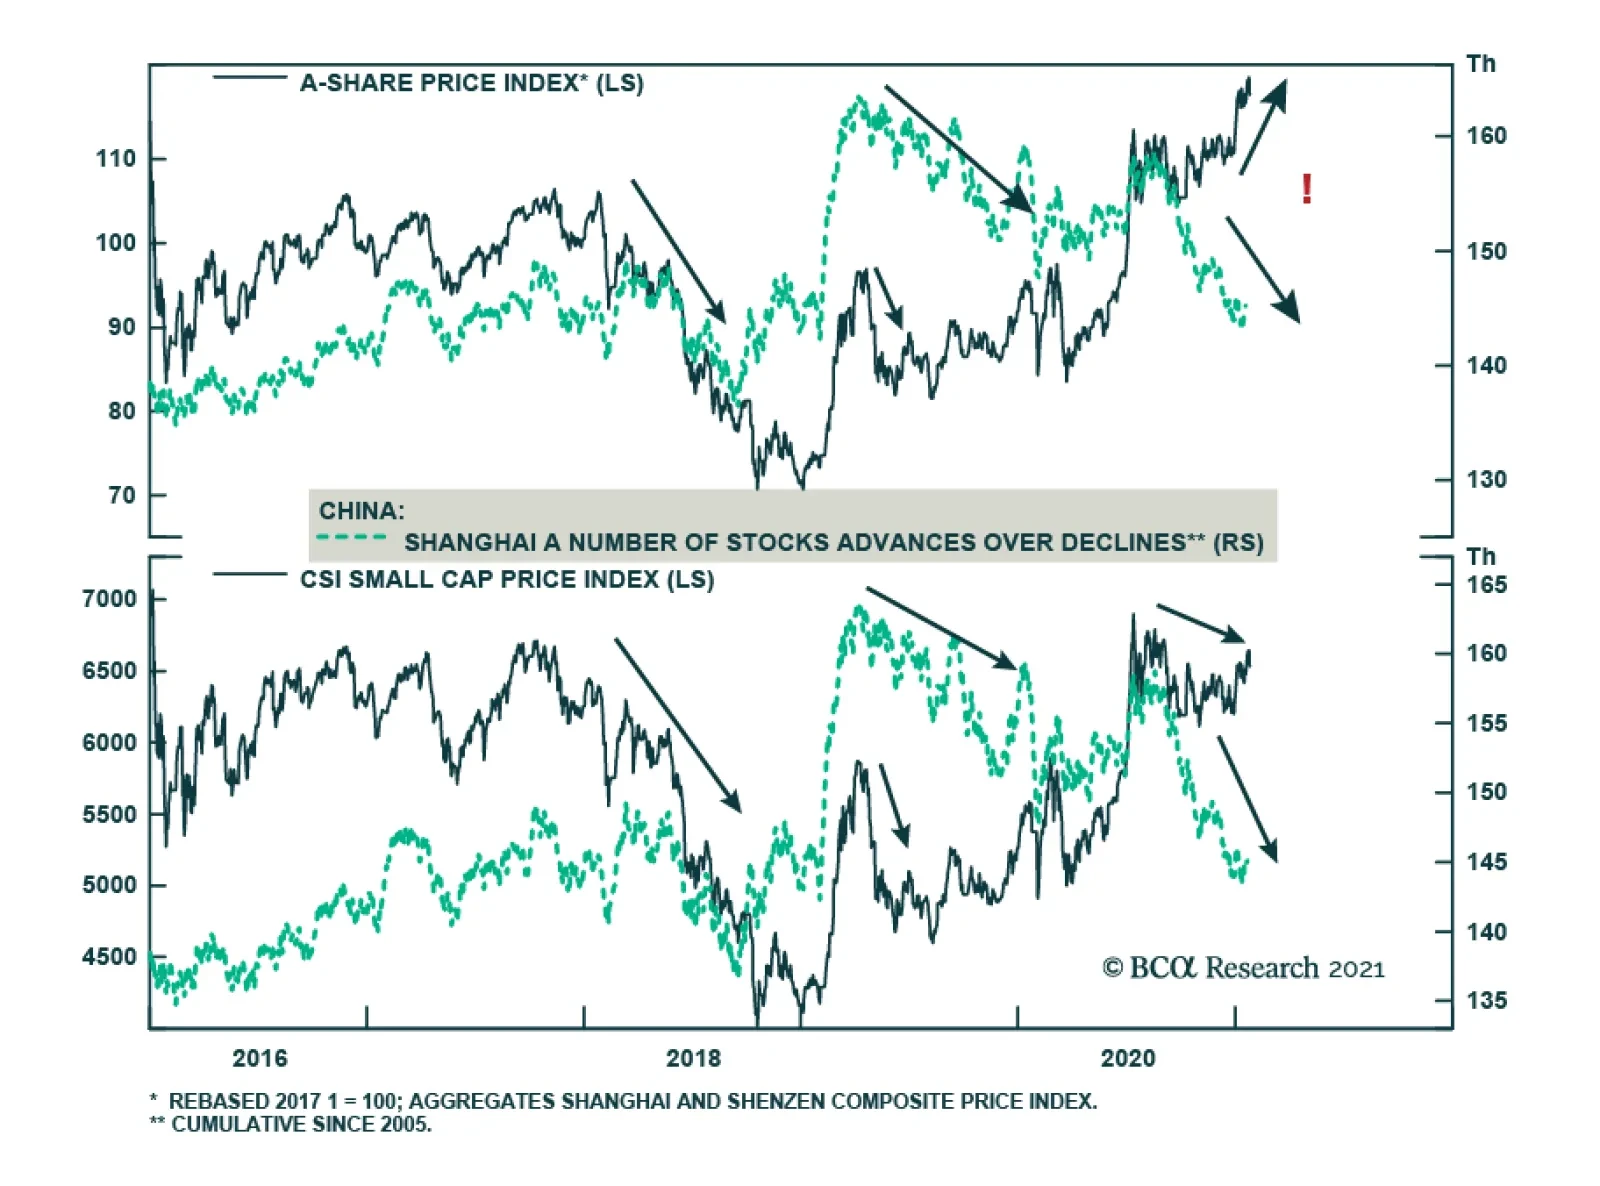
Highlights A positive backdrop still supports a cyclical bull market in Chinese stocks, but the upside in prices could be quickly exhausted. Investors may be overlooking emerging negative signs in China’s onshore equity market. The breadth of the A-share price rally has sharply declined since the beginning of this year; historically, a rapid narrowing in breadth has been a reliable indicator for pullbacks in the onshore market. Recent stock price rallies in some high-flying sectors of the onshore market are due to earnings multiples rather than earnings growth. Overstretched stock prices relative to earnings risk a snapback. We remain cautious on short-term prospects for China’s onshore equity markets. Feature Market commentators remain sharply divided about whether Chinese stocks will continue on their cyclical bull run or are in a speculative frenzy ready to capitulate. Stock prices picked up further in the first three weeks of 2021, extending their rallies in 2020. The positives that support a bull market, such as China’s economic recovery and improving profit growth, are at odds with the negatives. The downside is that the intensity of post-pandemic stimulus in China has likely peaked and monetary conditions have tightened. In addition, China’s stock markets may be showing signs of fatigue. While aggregate indexes have recorded new highs, the breadth of the rally—the percentage of stocks for which prices are rising versus falling—has been rapidly deteriorating. In the past, a sharp narrowing in breadth led to corrections and major setbacks in Chinese stock prices. Timing the eventual correction in stock prices will be tricky in an environment where plentiful cash on the sidelines from stimulus invites risk-taking. For now, there is little near-term benefit for investors to chase the rally in Chinese stocks. While we are not yet negative on Chinese stocks on a cyclical basis, the risks for a near-term price correction are significant. Investors looking to allocate more cash to Chinese stocks should wait until a correction occurs. Positive Backdrop On a cyclical basis, there are still some aspects that could push Chinese stocks even higher. The question is the speed of the rally. The more earnings multiples expand in the near term, the more earnings will have to do the heavy lifting in the rest of the year to pull Chinese stocks higher. The following factors have provided tailwinds to Chinese stocks, but may have already been discounted by investors: Chart 1Chinas Economic Recovery Continues
Chinas Economic Recovery Continues
Chinas Economic Recovery Continues
China’s economic recovery continues. China was the only major world economy to record growth in 2020. The massive stimulus rolled out last year should continue to work its way through the economy and support the ongoing uptrend in the business cycle (Chart 1). China’s relative success containing domestic COVID-19 outbreaks also provides confidence for the country’s consumers, businesses and investors. Chinese consumers have saved money—a lot of it. Although the household sector has been a laggard in China’s aggregate economy, much of the consumption weakness has been due to a slower recovery in service activities, such as tourism and catering (Chart 2). More importantly, Chinese households have accumulated substantial savings in the past two years. Unlike investors in the US, Chinese households have limited investment choices. Historically, sharp increases in household savings growth led to property booms (Chart 3, top panel). Given that Chinese authorities have become more vigilant in preventing further price inflation in the property market, Chinese households have been increasingly investing in the domestic equity market (Chart 3, middle and bottom panels). Reportedly, there has been a sharp jump in demand for investment products from households; mutual funds in China have raised money at a record pace, bringing in over 2 trillion yuan ($308 billion) in 2020, which is more than the total amount for the previous four years. The equity investment penetration remains low in China compared with developed nations such as the US.1 Thus, there is still room for Chinese households to deploy their savings into domestic stock markets. Chart 2Consumption Has Been A Laggard In Chinas Economic Recovery
Consumption Has Been A Laggard In Chinas Economic Recovery
Consumption Has Been A Laggard In Chinas Economic Recovery
Chart 3But Chinese Households Have Saved A Lot Of Dry Powder
But Chinese Households Have Saved A Lot Of Dry Powder
But Chinese Households Have Saved A Lot Of Dry Powder
Global growth and the liquidity backdrop remain positive. The combination of extremely easy monetary policy worldwide and a new round of fiscal support in the US will provide a supportive backdrop for both global economic growth and liquidity conditions. Foreign investment has flocked into China’s financial markets since last year and has picked up speed since the New Year (Chart 4). On a monthly basis, portfolio inflows account for less than 1% of the onshore equity market trading volume, but in recent years foreign portfolio inflows have increasingly influenced China’s onshore equity market sentiment and prices (Chart 5). Chart 4Foreign Investors Are Piling Into The Chinese Equity Market
Foreign Investors Are Piling Into The Chinese Equity Market
Foreign Investors Are Piling Into The Chinese Equity Market
Chart 5And Have Become A More Influential Player In The Chinese Onshore Market
And Have Become A More Influential Player In The Chinese Onshore Market
And Have Become A More Influential Player In The Chinese Onshore Market
Geopolitical risks are abating somewhat. We do not expect that the Biden administration will be quick to unwind Trump’s existing trade policies on China. However, in the near term, the two nations will likely embark on a less confrontational track than in the past two and a half years. Slightly eased Sino-US tensions will provide global investors with more confidence for buying Chinese risk assets. Lastly, localized COVID-19 outbreaks have flared up in several Chinese cities, prompting local authorities to take aggressive measures, including community lockdowns and stepping up travel restrictions. A deterioration in the situation could delay the recovery of household consumption; however, any negative impact on China’s aggregate economy will more than likely be offset by market expectations that policymakers will delay monetary policy normalization. Domestic liquidity conditions could improve, possibly providing a short-term boost to the rally in Chinese stocks. Bottom Line: Much of the positive news may already be priced into Chinese stocks. Non-Negligible Downside Risks There is a consensus that Chinese authorities will dial back their stimulus efforts this year and continue to tighten regulations in sectors such as real estate. Investors may disagree on the pace and magnitude of policy tightening, but the policy direction has been explicit from recent government announcements. However, the market may have ignored the following factors and their implications on stock performance: Deteriorating equity market breadth. In the past three weeks, the rally in Chinese stocks has been supported by a handful of blue-chip companies. The CSI 300 Index, which aggregates the largest 300 companies listed on both the Shanghai and Shenzhen stock exchanges (i.e. the A-share market) outperformed the broader A-share market by a large margin (Chart 6). Crucially, stock market breadth has declined rapidly (Chart 7). In short, the majority of Chinese stocks have relapsed. Chart 6Large Cap Stocks Outperform The Rest By A Sizable Margin
Large Cap Stocks Outperform The Rest By A Sizable Margin
Large Cap Stocks Outperform The Rest By A Sizable Margin
Chart 7The Breadth Of Onshore Stock Price Rally Has Narrowed Sharply
The Breadth Of Onshore Stock Price Rally Has Narrowed Sharply
The Breadth Of Onshore Stock Price Rally Has Narrowed Sharply
Chart 8Narrowing Market Breadth Has Historically Led To Price Pullbacks
Narrowing Market Breadth Has Historically Led To Price Pullbacks
Narrowing Market Breadth Has Historically Led To Price Pullbacks
Previously, Chinese stocks experienced either price corrections or a major setback as the breadth of the rally narrowed (Chart 8). However, the relationship has broken down since October last year; the number of stocks with ascending prices has fallen, while the aggregate A-share prices have risen. In other words, breadth has narrowed and the rally in the benchmark has been due to a handful of large-cap stocks. Top performers do not have enough weight to support the broad market. An overconcentration of returns in itself may not necessarily lead to an imminent price pullback in the aggregate equity index. The five tech titans in the S&P 500 index have been dominating returns since 2015, whereas the rest of the 495 stocks in the index barely made any gains. Yet the overconcentration in just a few stocks has not stopped the S&P 500 from reaching new highs in the past five years. Unlike the tech titans which represent more than 20% of the S&P index, the overconcentration in the Chinese onshore market has been more on the sector leaders rather than on a particular sector. China’s own tech giants such as Alibaba, Tencent, and Meituan, represent 35% of China’s offshore market, but most of the sector leaders in China’s onshore market account for only two to three percent of the total equity market cap (Table 1). Given their relatively small weight in the Shanghai and Shenzhen composite indexes, it is difficult for these stocks to lift the entire A-share market if prices in all the other stocks decline sharply. The CSI 300 Index, which aggregates some of China’s largest blue-chip companies and industry leaders, including Kweichow Moutai, Midea Group, and Ping An Insurance, is not insulated from gyrations in the aggregate A-share market. Historically, when investors crowded into those top performers, the weight from underperforming companies in the broader onshore market would create a domino effect and drag down the CSI 300 Index. In other words, the magnitude of returns on the CSI 300 Index can deviate from the broader onshore market, but not the direction of returns. Table 1Top 10 Constituents And Their Weights In The CSI 300, Shanghai Composite, And Shenzhen Composite Indexes
Chinese Stocks: Which Way Will The Winds Blow?
Chinese Stocks: Which Way Will The Winds Blow?
Chinese “groupthinkers” are pushing the overconcentration. With the explosive growth in mutual fund sales, Chinese institutional investors and asset managers have started to play important roles in the bull market. Unlike their Western counterparts, Chinese fund managers’ performances are ranked on a quarterly or even monthly basis by asset owners, including retail investors. As such, they face intense and constant pressure to outperform the benchmarks and their peers, and have great incentive to chase rallies in well-known companies. In a late-state bull market when uncertainties emerge and assets with higher returns are sparse, fund managers tend to group up in chasing fewer “sector winners,” driving up their share prices. Chart 9Forward Earnings Growth Has Stalled
Forward Earnings Growth Has Stalled
Forward Earnings Growth Has Stalled
Earnings outlook fails to keep up with multiple expansions. Despite the massive stimulus last year and improving industrial profits, forward earnings growth in both the onshore and offshore equity markets rolled over by the end of last year (Chart 9). Earnings from some of China’s high-flying sectors have been mediocre (Chart 10). Even though the ROEs in the food & beverage, healthcare and aerospace sectors remain above the domestic industry benchmarks, the sharp upticks in their share prices are largely due to an expansion of forward earnings multiples rather than earnings growth (Chart 11). The stretched valuation measures suggest that investors have priced in significant earnings growth, which may be more than these industries can deliver in 2021. Chart 10Other Than Healthcare, High-Flying Sectors Have Seen Mediocre Earnings
Other Than Healthcare, High-Flying Sectors Have Seen Mediocre Earnings
Other Than Healthcare, High-Flying Sectors Have Seen Mediocre Earnings
Chart 11Too Much Growth Priced In
Too Much Growth Priced In
Too Much Growth Priced In
Cyclical stocks may be sniffing out a peak in the market. The performance in cyclical stocks relative to defensives in both the onshore and offshore equity markets has started to falter, after outperforming throughout 2020 (Chart 12). Historically, the strength in cyclical stocks relative to defensives corresponds with improving economic activity (and vice versa). Therefore, the recent rollover in the outperformance of cyclical stocks versus defensives indicates that China’s economic recovery and the equity rally could soon peak. An IPO mania. New IPOs in China reached a record high last year, jumping by more than 100% from 2019. IPOs on the Shanghai, Shenzhen and Hong Kong stock exchanges together were more than half of all global IPOs in 2020. The previous rounds of explosive IPOs in China occurred in 2007, 2010/11, and 2014/15, most followed by stock market riots (Chart 13). Chart 12Cyclical Stocks May Be Sniffing Out A Peak In The Market
Cyclical Stocks May Be Sniffing Out A Peak In The Market
Cyclical Stocks May Be Sniffing Out A Peak In The Market
Chart 13IPO Manias In The Past Have Led To Market Riots
IPO Manias In The Past Have Led To Market Riots
IPO Manias In The Past Have Led To Market Riots
Bottom Line: Investors may be neglecting some risks and pitfalls in the Chinese equity markets, which could lead to near-term price corrections. Investment Conclusions We still hold a constructive view on Chinese stocks in the next 6 to 12 months. Yet the equity market rally has been on overdrive for the past several weeks. The higher Chinese stock prices climb in the near term, the more it will eat into upside potentials and thus push down expected returns. The divergence between forward earnings and PE expansions in Chinese stocks is reminiscent of the massive stock market boom-bust cycle in 2014/15 (Chart 14A and 14B). This is in stark contrast with the picture at the beginning of the last policy tightening cycle, which started in late 2016 (Chart 15A and 15B). Valuation is a poor timing indicator and investor sentiment is hard to pin down. Nevertheless, the wide divergence between the earnings outlook and multiples indicates that Chinese stock prices are overstretched and at risk of price setbacks. Chart 14AA Picture Looking Too Familiar
A Picture Looking Too Familiar
A Picture Looking Too Familiar
Chart 14BA Picture Looking Too Familiar
A Picture Looking Too Familiar
A Picture Looking Too Familiar
Chart 15AAnd A Sharp Contrast From The Last Policy Tightening Cycle
And A Sharp Contrast From The Last Policy Tightening Cycle
And A Sharp Contrast From The Last Policy Tightening Cycle
Chart 15BAnd A Sharp Contrast From The Last Policy Tightening Cycle
And A Sharp Contrast From The Last Policy Tightening Cycle
And A Sharp Contrast From The Last Policy Tightening Cycle
We remain cautious on the short-term prospects for the broad equity market. Investors looking to allocate more cash to Chinese stocks should wait until a price correction occurs. Jing Sima China Strategist jings@bcaresearch.com Footnotes 1Only 20.4% of Chinese households’ total net worth is in financial assets versus the US, where the share is 42.5%. PBoC, “2019 Chinese Urban Households Assets And Liabilities Survey.” Cyclical Investment Stance Equity Sector Recommendations
Chinese property had a standout 2020. Property sales broke records and property investments expanded 7% y/y, outpacing total fixed asset investments. But despite this hot performance, property developers’ equities were eclipsed by the overall market last…
Highlights Chinese equities have rallied enthusiastically since the COVID-19 outbreak and are now exposed to underlying political and geopolitical risks. Xi Jinping’s intention is to push forward reform and restructuring, creating a significant risk of policy overtightening over the coming two years. In the first half of 2021, the lingering pandemic and fragile global environment suggest that overtightening will be avoided. But the risk will persist throughout the year. Beijing’s fourteenth five-year plan and new focus on import substitution will exacerbate growing distrust with the US. We still doubt that the Biden administration will reduce tensions substantially or for very long. Chinese equities are vulnerable to a near-term correction. The renminbi is at fair value. Go long Chinese government bonds on the basis that political and geopolitical risks are now underrated again. Feature The financial community tends to view China’s political leadership as nearly infallible, handling each new crisis with aplomb. In 2013-15 Chinese leaders avoided a hard landing amid financial turmoil, in 2018-20 they blocked former President Trump’s trade war, and in 2020 they contained the COVID-19 pandemic faster than other countries. COVID was especially extraordinary because it first emerged in China and yet China recovered faster than others – even expanding its global export market share as the world ordered more medical supplies and electronic gadgets (Chart 1). COVID-19 cases are spiking as we go to press but there is little doubt that China will use drastic measures to curb the virus’s spread. It produced two vaccines, even if less effective than its western counterparts (Chart 2). Monetary and fiscal policy will be utilized to prevent any disruptions to the Chinese New Year from pulling the rug out from under the economic recovery. Chart 1China Grew Global Market Share, Despite COVID
China Grew Global Market Share, Despite COVID
China Grew Global Market Share, Despite COVID
Chart 2China Has A Vaccine, Albeit Less Effective
China Geopolitical Outlook 2021
China Geopolitical Outlook 2021
In short, China is seen as a geopolitical juggernaut that poses no major risk to the global bull market in equities, corporate bonds, and commodities – the sole backstop for global growth during times of crisis (Chart 3). The problem with this view is that it is priced into markets already, the crisis era is fading (despite lingering near-term risks), and Beijing’s various risks are piling up. Chart 3China Backstopped Global Growth Again
China Geopolitical Outlook 2021
China Geopolitical Outlook 2021
First, as potential GDP growth slows, China faces greater difficulty managing the various socioeconomic imbalances and excesses created by its success – namely the tug of war between growth and reform. The crisis shattered China’s attempt to ensure a smooth transition to lower growth rates, leaving it with higher unemployment and industrial restructuring that will produce long-term challenges (Chart 4). Chart 4China's Unemployment Problem
China's Unemployment Problem
China's Unemployment Problem
The shock also forced China to engage in another blowout credit surge, worsening the problem of excessive leverage and reversing the progress that was made on corporate deleveraging in previous years. Second, foreign strategic opposition and trade protectionism are rising. China’s global image suffered across the world in 2020 as a result of COVID, despite the fact that President Trump’s antics largely distracted from China. Going forward there will be recriminations from Beijing’s handling of the pandemic and its power grab in Hong Kong yet Trump will not be there to deflect. By contrast, the Biden administration holds out a much greater prospect of aligning liberal democracies against China in a coalition that could ultimately prove effective in constraining its international behavior. China’s turn inward, toward import substitution and self-sufficiency, will reinforce this conflict. In the current global rebound, in which China will likely be able to secure its economic recovery while the US is supercharging its own, readers should expect global equity markets and China/EM stocks to perform well on a 12-month time frame. We would not deny all the positive news that has occurred. But Chinese equities have largely priced in the positives, meaning that Chinese politics and geopolitics are underrated again and will be a source of negative surprises going forward. The Centennial Of 1921 The Communist Party will hold a general conference to celebrate its 100th birthday on July 1, just as it did in 1981, 1991, 2001, and 2011. These meetings are ceremonial and have no impact on economic policy. We examined nominal growth, bank loans, fixed asset investment, industrial output, and inflation and observed no reliable pattern as an outcome of these once-per-decade celebrations. In 2011, for example, General Secretary Hu Jintao gave a speech about the party’s triumphs since 1921, reiterated the goals of the twelfth five-year plan launched in March 2011, and reminded his audience of the two centennial goals of becoming a “moderately prosperous society” by 2021 and a “modern socialist country” by 2049 (the hundredth anniversary of the People’s Republic). China is now transitioning from the 2021 goals to the 2049 goals and the policy consequences will be determined by the Xi Jinping administration. Xi will give a speech on July 1 recapitulating the fourteenth five-year plan’s goals and his vision for 2035 and 2049, which will be formalized in March at the National People’s Congress, China’s rubber-stamp parliament. As such any truly new announcements relating to the economy should come over the next couple of months, though the broad outlines are already set. There would need to be another major shock to the system, comparable to the US trade war and COVID-19, to produce a significant change in the economic policy outlook from where it stands today. Hence the Communist Party’s 100th birthday is not a driver of policy – and certainly not a reason for authorities to inject another dose of massive monetary and credit stimulus following the country’s massive 12% of GDP credit-and-fiscal impulse from trough to peak since 2018 (Chart 5). The overarching goal is stability around this event, which means policy will largely be held steady. Chart 5China's Big Stimulus Already Occurred
China's Big Stimulus Already Occurred
China's Big Stimulus Already Occurred
Far more important than the centenary of the Communist Party is the political leadership rotation that will begin on the local level in early 2022, culminating in the twentieth National Party Congress in the fall of 2022.1 This was supposed to be the date of Xi’s stepping down, according to the old schedule, but he will instead further consolidate power – and may even name himself Chairman Xi, as the next logical step in his Maoist propaganda campaign. This important political rotation will enable Xi to elevate his followers to higher positions and cement his influence over the so-called seventh generation of Chinese leaders, pushing his policy agenda far into the future. Ahead of these events, Beijing has been mounting a new battle against systemic risks, as it did in late 2016 and throughout 2017 ahead of the nineteenth National Party Congress. The purpose is to prevent the economic and financial excesses of the latest stimulus from destabilizing the country, to make progress on Xi’s policy agenda, and to expose and punish any adversaries. This new effort will face limitations based on the pandemic and fragile economy but it will nevertheless constitute the default setting for the next two years – and it is a drag on growth rather than a boost. The importance of the centenary and the twentieth party congress will not prevent various risks from exploding between now and the fall of 2022. Some political scandals will likely emerge as foreign or domestic opposition attempts to undermine Xi’s power consolidation – and at least one high-level official will inevitably fall from grace as Xi demonstrates his supremacy and puts his followers in place for higher office. But any market reaction to these kinds of events will be fleeting compared to the reaction to Xi’s economic management. The economic risk boils down to the implementation of Xi’s structural reform agenda and his threshold for suffering political pain in pursuit of this agenda. For now the risk is fairly well contained, as the pandemic is still somewhat relevant, but going forward the tension between growth and reform will grow. Bottom Line: The hundredth birthday of the Communist Party is overrated but the twentieth National Party Congress in 2022 is of critical importance to the governance of China over the next ten years. These events will not prompt a major new dose of stimulus and they will not prevent a major reform push or crackdown on financial excesses. But as always in China there will still be an overriding emphasis on economic and social stability above all. For now, this is supportive of the new global business cycle, commodity prices, and emerging market equities. The Fourteenth Five-Year Plan (2021-25) The draft proposal of China’s fourteenth five-year plan (2021-25) will be ratified at the annual “two sessions” in March (Table 1). The key themes are familiar from previous five-year plans, which focused on China’s economic transition from “quantity” to “quality” in economic development. Table 1China’s 14th Five Year Plan
China Geopolitical Outlook 2021
China Geopolitical Outlook 2021
China is seen as having entered the “high quality” phase of development – and the word quality is used 40 times in the draft. As with the past five years, the Xi administration is highlighting “supply-side structural reform” as a means of achieving this economic upgrade and promoting innovation. But Xi has shifted his rhetoric to highlight a new concept, “dual circulation,” which will now take center stage. Dual circulation marks a dramatic shift in Chinese policy: away from the “opening up and reform” of the liberal 1980s-2000s and toward a new era of import substitution and revanchism that will dominate the 2020s. Xi Jinping first brought it up in May 2020 and re-emphasized it at the July Politburo meeting and other meetings thereafter. It is essentially a “China First” policy that describes a development path in which the main economic activity occurs within the domestic market. Foreign trade and investment are there to improve this primary domestic activity. Dual circulation is better understood as a way of promoting import substitution, or self-reliance – themes that emerged after the Great Recession but became more explicit during the trade war with the US from 2018-20. The gist is to strengthen domestic demand and private consumption, improve domestic rather than foreign supply options, attract foreign investment, and build more infrastructure to remove internal bottlenecks and improve cross-regional activity (e.g. the Sichuan-Tibet railway, the national power grid, the navigation satellite system). China has greatly reduced its reliance on global trade already, though it is still fairly reliant when Hong Kong is included (Chart 6). The goals of the fourteenth five-year plan are also consistent with the “Made in China 2025” plan that aroused so much controversy with the Trump administration, leading China to de-emphasize it in official communications. Just like dual circulation, the 2025 plan was supposed to reduce China’s dependency on foreign technology and catapult China into the lead in areas like medical devices, supercomputers, robotics, electric vehicles, semiconductors, new materials, and other emerging technologies. This plan was only one of several state-led initiatives to boost indigenous innovation and domestic high-tech production. The response to American pressure was to drop the name but maintain the focus. Some of the initiatives will fall under new innovation and technology guidelines while others will fall under the category of “new types of infrastructure,” such as 5G networks, electric vehicles, big data centers, artificial intelligence operations, and ultra-high voltage electricity grids. With innovation and technology as the overarching goals, China is highly likely to increase research and development spending and aim for an overall level of above 3% of GDP (Chart 7). In previous five-year plans the government did not set a specific target. Nor did it set targets for the share of basic research spending within research and development, which is around 6% but is believed to need to be around 15%-20% to compete with the most innovative countries. While Beijing is already a leader in producing new patents, it will attempt to double its output while trying to lift the overall contribution of technology advancement to the economy. Chart 6China Seeks To Reduce Foreign Dependency
China Seeks To Reduce Foreign Dependency
China Seeks To Reduce Foreign Dependency
Dual circulation will become a major priority affecting other areas of policy. Reform of state-owned enterprises (SOEs), for example, will take place under this rubric. The Xi administration has dabbled in SOE reform all along, for instance by injecting private capital to create mixed ownership, but progress has been debatable. Chart 7China Will Surge R&D Spending
China Will Surge R&D Spending
China Will Surge R&D Spending
The new five-year plan will incorporate elements of an existing three-year action plan approved last June. The intention is to raise the competitiveness of China’s notoriously bloated SOEs, making them “market entities” that play a role in leading innovation and strengthening domestic supply chains. However, there is no question that SOEs will still be expected to serve an extra-economic function of supporting employment and social stability. So the reform is not really a broad liberalization and SOEs will continue to be a large sector dominated by the state and directed by the state, with difficulties relating to efficiency and competitiveness. Notwithstanding the focus on quality, China still aims to have GDP per capita reach $12,500 by 2025, implying 5%-5.5% annual growth from 2021-25, which is consistent with estimates of the International Monetary Fund (Chart 8). This kind of goal will require policy support at any given time to ensure that there is no major shortfall due to economic shocks like COVID-19. Thus any attempts at reform will be contained within the traditional context of a policy “floor” beneath growth rates – which itself is one of the biggest hindrances to deep reform. Chart 8China's Growth Target Through 2025
China's Growth Target Through 2025
China's Growth Target Through 2025
Chart 9Stimulus Correlates With Carbon Emissions
Stimulus Correlates With Carbon Emissions
Stimulus Correlates With Carbon Emissions
As the economy’s potential growth slows the Communist Party has been shifting its focus to improving the quality of life, as opposed to the previous decades-long priority of meeting the basic material needs of the society. The new five-year plan aims to increase disposable income per capita as part of the transition to a domestic consumption-driven economy. The implied target will be 5%-5.5% growth per year, down from 6.5%+ previously, but the official commitment will be put in vague qualitative terms to allow for disappointments in the slower growing environment. The point is to expand the middle-income population and redistribute wealth more effectively, especially in the face of stark rural disparity. In addition the government aims to increase education levels, expand pension coverage, and, in the midst of the pandemic, increase public health investment and the number of doctors and hospital beds relative to the population. Beijing seems increasingly wary of too rapid of a shift away from manufacturing – which makes sense in light of the steep drop in the manufacturing share of employment amid China’s shift away from export-dependency. In the thirteenth five-year plan, Beijing aimed to increase the service sector share of GDP from 50.5% to 56%. But in the latest draft plan it sets no target for growing services. Any implicit goal of 60% would be soft rather than hard. Given that manufacturing and services combined make up 93% of the economy, there is not much room to grow services further unless policymakers want to allow even faster de-industrialization. But the social and political risks of rapid de-industrialization are well known – both from the liquidation of the SOEs in the late 1990s and from the populist eruptions in the UK and US more recently. Beijing is likely to want to take a pause in shifting away from manufacturing. But this means that China’s exporting of deflation and large market share will persist and hence foreign protectionist sentiment will continue to grow. The fourteenth five-year plan ostensibly maintains the same ambitious targets for environmental improvement as in its predecessor, in terms of water and energy consumption, carbon emissions, pollution levels, renewable energy quotas, and quotas for arable land and forest coverage. But in reality some of these targets are likely to be set higher as Beijing has intensified its green policy agenda and is now aiming to hit peak carbon emissions by 2030. China aims to be a “net zero” carbon country by 2060. Doubling down on the shift away from fossil fuels will require an extraordinary policy push, given that China is still a heavily industrial economy and predominantly reliant on coal power. So environmental policy will be a critical area to watch when the final five-year plan is approved in March, as well as in future plans for the 2026-30 period. As was witnessed in recent years, ambitious environmental goals will be suspended when the economy slumps, which means that achieving carbon emissions goals will not be straightforward (Chart 9), but it is nevertheless a powerful economic policy theme and investment theme. Xi Jinping’s Vision: 2035 On The Way To 2049 At the nineteenth National Party Congress, the critical leadership rotation in 2017, Xi Jinping made it clear that he would stay in power beyond 2022 – eschewing the nascent attempt of his predecessors to set up a ten-year term limit – and establish 2035 as a midway point leading to the 2049 anniversary of the People’s Republic. There are strategic and political goals relevant to this 2035 vision – including speculation that it could be Xi’s target for succession or for reunification with Taiwan – but the most explicit goals are, as usual, economic. Chart 10Xi Jinping’s 2035 Goals
China Geopolitical Outlook 2021
China Geopolitical Outlook 2021
Officially China is committing to descriptive rather than numerical targets. GDP per capita is to reach the level of “moderately developed countries.” However, in a separate explanation statement, Xi Jinping declares, “it is completely possible for China to double its total economy or per capita income by 2035.” In other words, China’s GDP is supposed to reach 200 trillion renminbi, while GDP per capita should surpass $20,000 by 2035, implying an annual growth rate of at least 4.73% (Chart 10). There is little reason to believe that Beijing will succeed as much in meeting future targets as it has in the past. In the past China faced steady final demand from the United States and the West and its task was to bring a known quantity of basic factors of production into operation, after lying underutilized for decades, which made for high growth rates and fairly predictable outcomes. In the future the sources of demand are not as reliable and China’s ability to grow will be more dependent on productivity enhancements and innovation that cannot be as easily created or predicted. The fourteenth five-year plan and Xi’s 2035 vision will attempt to tackle this productivity challenge head on. But restructuring and reform will advance intermittently, as Xi is unquestionably maintaining his predecessors’ commitment to stability above all. Outlook 2021: Back To The Tug Of War Of Stimulus And Reform The tug of war between economic stimulus and reform is on full display already in 2021 and will become by far the most important investment theme this year. If China tightens monetary and fiscal policy excessively in 2021, in the name of reform, it will undermine its own and the global economic recovery, dealing a huge negative surprise to the consensus in global financial markets that 2021 will be a year of strong growth, rebounding trade, a falling US dollar, and ebullient commodity prices. Our view is that Chinese policy tightening is a significant risk this year – it is not overrated – but that the government will ultimately ease policy as necessary and avoid what would be a colossal policy mistake of undercutting the economic recovery. We articulated this view late last year and have already seen it confirmed both in the Politburo’s conclusions at the annual economic meeting in December, and in the reemergence of COVID-19, which will delay further policy tightening for the time being. The pattern of the Xi administration thus far is to push forward domestic reforms until they run up against the limits of economic stability, and then to moderate and ease policy for the sake of recovery, before reinitiating the attack. Two key developments initially encouraged Xi to push forward with a new “assault phase of reform” in 2021: First, a new global business cycle is beginning, fueled by massive monetary and fiscal stimulus across the world (not only in China), which enables Xi to take actions that would drag on growth. Second, Xi Jinping has emerged from the US trade war stronger than ever at home. President Trump lost the election, giving warning to any future US president who would confront China with a frontal assault. The Biden administration’s priority is economic recovery, for the sake of the Democratic Party’s future as well as for the nation, and this limits Biden’s ability to escalate the confrontation with China, even though he will not revoke most of Trump’s actions. Biden’s predicament gives Beijing a window to pursue difficult domestic initiatives before the Biden administration is capable of turning its full attention to the strategic confrontation with China. The fact that Biden seeks to build a coalition of states first, and thus must spend a great deal of time on diplomacy with Europe and other allies, is another advantageous circumstance. China is courting and strengthening relations with Europe and those very allies so as to delay the formation of any effective coalition (Chart 11). Chart 11China Courts EU As Substitute For US
China Geopolitical Outlook 2021
China Geopolitical Outlook 2021
Thus, prior to the latest COVID-19 spike, Beijing was clearly moving to tighten monetary and fiscal policy and avoid a longer stimulus overshoot that would heighten the country’s long-term financial risks and debt woes. This policy preference will continue to be a risk in 2021: Central government spending down: Emergency fiscal spending to deal with the pandemic will be reduced from 2020 levels and the budget deficit will be reined in. The Politburo’s chief economic planning event, the Central Economic Work Conference in December, resulted in a decision to maintain fiscal support but to a lesser degree. Fiscal policy will be “effective and sustainable,” i.e. still proactive but lower in magnitude (Chart 12). Local government spending down: The central government will try to tighten control of local government bond issuance. The issuance of new bonds will fall closer to 2019 levels after a 55% increase in 2020. New bonds provide funds for infrastructure and investment projects meant to soak up idle labor and boost aggregate demand. A cut back in these projects and new bonds will drag on the economy relative to last year (Chart 13). Chart 12China Pares Government Spending On The Margin
China Geopolitical Outlook 2021
China Geopolitical Outlook 2021
Chart 13China Pares Local Government Spending Too
China Geopolitical Outlook 2021
China Geopolitical Outlook 2021
Monetary policy tightening up: The People’s Bank of China aims to maintain a “prudent monetary policy” that is stable and targeted in 2021. The intention is to avoid any sharp change in policy. However, PBoC Governor Yi Gang admits that there will be some “reasonable adjustments” to monetary policy so that the growth of broad money (M2) and total social financing (total private credit) do not wildly exceed nominal GDP growth (which should be around 8%-10% in 2021). The risk is that excessive easiness in the current context will create asset bubbles. The implication is that credit growth will slow to 11%-12%. This is not slamming on the brakes but it is a tightening of credit policy. Macro-prudential regulation up: The People’s Bank is reasserting its intention to implement the new Macro-Prudential Assessment (MPA) framework designed to tackle systemic financial risk. The rollout of this reform paused last year due to the pandemic. A detailed plan of how the country’s various major financial institutions will adopt this new mechanism is expected in March. The implication is that Beijing is turning its attention back to mitigating systemic financial risks. This includes closer supervision of bank capital adequacy ratios and cross-border financing flows. New macro-prudential tools are also targeting real estate investment and potentially other areas. Larger established banks will have a greater allowance for property loans than smaller, riskier banks. At the same time, it is equally clear that Beijing will try to avoid over-tightening policy: The COVID outbreak discourages tightening: This outbreak has already been mentioned and will pressure leaders to pause further policy tightening at least until they have greater confidence in containment. The vaccine rollout process also discourages economic activity at first since nobody wants to go out and contract the disease when a cure is in sight. Local government financial support is still robust: Local governments will still need to issue refinancing bonds to deal with the mountain of debt coming into maturity and reduce the risk of widespread insolvency. In 2020, they issued more than 1.8 trillion yuan of refinancing bonds to cover about 88% of the 2 trillion in bonds coming due. In 2021, they will have to issue about 2.2 trillion of refinancing bonds to maintain the same refinancing rate for a larger 2.6 trillion yuan in bonds coming due (Table 2). Thus while Beijing is paring back its issuance of new bonds to fund new investment projects, it will maintain a high level of refinancing bonds to prevent insolvency from cascading and undermining the recovery. Table 2Local Government Debt Maturity Schedule
China Geopolitical Outlook 2021
China Geopolitical Outlook 2021
Monetary policy will not be too tight: The People’s Bank’s open market operations in January so far suggest that it is starting to fine-tune its policies but that it is doing so in an exceedingly measured way so as not to create a liquidity squeeze around the traditionally tight-money period of Chinese New Year. The seven-day repo rate, the de facto policy interest rate, has already rolled over from last year’s peak. The takeaway is that while Beijing clearly intended to cut back on emergency monetary and fiscal support this year – and while Xi Jinping is clearly willing to impose greater discipline on the economy and financial system prior to the big political events of 2021-22 – nevertheless the lingering pandemic and fragile global environment will ensure a relatively accommodative policy for the first half of 2021 in order to secure the economic recovery. The underlying risk of policy tightening is still significant, especially in the second half of 2021 and in 2022, due to the underlying policy setting. Investment Takeaways The CNY-USD has experienced a tremendous rally in the wake of the US-China phase one trade deal last year and Beijing’s rapid bounce-back from the pandemic. The trade weighted renminbi is now trading just about at fair value (Chart 14). We closed our CNY-USD short recommendation and would stand aside for now. China’s current account surplus is still robust, real reform requires a fairly strong yuan, and the Biden administration will also expect China not to depreciate the currency competitively. Thus while we anticipate the CNY-USD to suffer a surprise setback when the market realizes that the US and China will continue to clash despite the end of the Trump administration, nevertheless we are no longer outright short the currency. Chinese investable stocks have rallied furiously on the stimulus last year as well as robust foreign portfolio inflows. The rally is likely overstretched at the moment as the COVID outbreak and policy uncertainties come to the fore. This is also true for Chinese stocks other than the high-flying technology, media, and telecom stocks (Chart 15). Domestic A-shares have rallied on the back of Alibaba executive Jack Ma’s reappearance even though the clear implication is that in the new era, the Communist Party will crack down on entrepreneurs – and companies like fintech firm Ant Group – that accumulate too much power (Chart 16). Chart 14Renminbi Fairly Valued
Renminbi Fairly Valued
Renminbi Fairly Valued
Chart 15China: Investable Stocks Overbought
China: Investable Stocks Overbought
China: Investable Stocks Overbought
Chart 16Communist Party, Jack Ma's Boss
Communist Party, Jack Ma's Boss
Communist Party, Jack Ma's Boss
Chart 17Go Long Chinese Government Bonds
Go Long Chinese Government Bonds
Go Long Chinese Government Bonds
Chinese government bond yields are back near their pre-COVID highs (though not their pre-trade war highs). Given the negative near-term backdrop – and the longer term challenges of restructuring and geopolitical risks over Taiwan and other issues that we expect to revive – these bonds present an attractive investment (Chart 17). Housekeeping: In addition to going long Chinese 10-year government bonds on a strategic time frame, we are closing our long Mexican industrials versus EM trade for a loss of 9.1%. We are still bullish on the Mexican peso and macro/policy backdrop but this trade was premature. We are also closing our long S&P health care tactical hedge for a loss of 1.8%. Matt Gertken Vice President Geopolitical Strategy mattg@bcaresearch.com Yushu Ma Research Associate yushu.ma@bcaresearch.com Footnotes 1 Indeed the 2022 political reshuffle has already begun with several recent appointments of provincial Communist Party secretaries.
Highlights Both the massive inventory accumulation and robust underlying consumption have been driving Chinese crude imports in recent years. Chinese crude oil import growth will decelerate in 2021 due to a slower pace in the country’s oil inventory accumulation. The country’s underlying crude oil consumption growth will remain robust this year, which will support a still positive growth in Chinese crude oil imports this year. Strong Chinese crude oil imports are positive to global oil prices this year. Feature The gap between China’s total crude oil supply and its domestic crude oil consumption has been widening in recent years, due to a massive buildup in Chinese crude oil inventory (Chart 1A and 1B). In fact, China’s crude oil inventories have quadrupled in the past five years, exceeding two billion barrels as of November 2020 and are equal to about 70% of OECD total inventory (Chart 2). Chart 1AA Massive Buildup In Chinese Crude Oil Inventory
A Massive Buildup In Chinese Crude Oil Inventory
A Massive Buildup In Chinese Crude Oil Inventory
Chart 1BChina: Total Crude Oil Supply Growth Has Exceeded Its Domestic Consumption Growth
China: Total Crude Oil Supply Growth Has Exceeded Its Domestic Consumption Growth
China: Total Crude Oil Supply Growth Has Exceeded Its Domestic Consumption Growth
In addition, China’s crude oil import growth has been outpacing domestic oil consumption growth, while domestic production remains stagnant (Chart 3). Chart 2Crude Oil Inventories In China Have Quadrupled In The Past Five Years
Crude Oil Inventories In China Have Quadrupled In The Past Five Years
Crude Oil Inventories In China Have Quadrupled In The Past Five Years
Chart 3China: Crude Oil Import Growth Has Been Stronger Than Its Domestic Consumption Growth
China: Crude Oil Import Growth Has Been Stronger Than Its Domestic Consumption Growth
China: Crude Oil Import Growth Has Been Stronger Than Its Domestic Consumption Growth
Will China maintain its strong crude oil import growth this year? How will the interplay between domestic consumption and imports evolve in 2021? We expect China’s crude oil consumption growth to remain solid in 2021, growing at an annual rate of about 6-7% and up from the 4.5% growth rate reached in 2020. However, China’s crude oil imports are likely to increase by 4-6% in 2021 from the previous year, slower than the 7.2% growth seen in 2020. The moderation in Chinese oil imports in 2021 will mainly be due to a slower pace of crude oil inventory buildup. Understanding The Surge In Crude Oil Inventory Chart 4China's Crude Oil Inventory Buildup: One Major Driver Behind Its Strong Imports Since 2016
China's Crude Oil Inventory Buildup: One Major Driver Behind Its Strong Imports Since 2016
China's Crude Oil Inventory Buildup: One Major Driver Behind Its Strong Imports Since 2016
The massive buildup in domestic crude oil inventory has been one major driving force behind the strong growth in China's crude oil imports since 2016 (Chart 4). As oil prices continue to rebound, and given China’s existing large oil inventories, we think the pace of inventory accumulation in China will slow in 2021. Therefore, growth in Chinese oil imports this year will likely moderate. China’s crude oil imports currently account for about 75% of the country’s total crude oil supply. Since China’s domestic crude oil production has been stagnant in the last decade, the fluctuations in Chinese crude oil imports are largely driven by the change in the country’s total demand, which includes both domestic consumption and changes in inventories. China’s crude oil import growth has significantly outpaced domestic consumption growth in the past five years, leading to a buildup in inventory. China’s crude oil inventory includes Commercial Petroleum Reserves (CPR), which are held by refiners and traders; and Strategic Petroleum Reserves (SPR), which are held by the government. Our Chinese crude oil inventory proxy1 was constructed based on the crude oil flow diagram shown in Chart 5. Chart 5How Did We Derive Our Chinese Crude Oil Inventory Proxy?
Chinese Commodities Demand: An Unsustainable Boom? Part III: Crude Oil
Chinese Commodities Demand: An Unsustainable Boom? Part III: Crude Oil
Our research has suggested that since 2016, most of the buildup has occurred in CPR. This is due to the following: The government in 2015 required refiners to keep their inventory level at no less than their 15-days requirement for operation use. Chinese refinery capacity had been expanded at a compound annual growth rate (CAGR) of 2.8% during 2016-2019. These existing and new refineries have been building their inventories to meet government regulations in the past several years. In addition, the government started to allow independent refineries to import crude oil by setting a quota in mid-2015, and the import quotas have been increased every year. In 2020, the quota reached 184.6 million tons, equaling to about 3,700 kbpd, nearly five times the quota in 2015. The total increase in imports of these independent refiners over the past five years was about 2,950 kbpd, accounting for 70% of the increase in the country’s total crude oil imports during the same period. Chart 6China: Rising Run Rates For Its Independent Refineries
China: Rising Run Rates For Its Independent Refineries
China: Rising Run Rates For Its Independent Refineries
Independent refiners import crude oil for both refinery purposes and to meet the new inventory requirement. Over the last several years, the increased amount of quota has improved Chinese independent refiners’ profitability and refinery capacity run rate, as the import quota allows these private sector refiners to save operating costs by cutting out the “middleman” and by actively managing their own feedstocks. For example, Shandong has the largest number of independent refineries among all provinces. Chart 6 shows that the run rate of the region’s independent refineries has surged since 2016, from about 40% in that year to 75% this year. In addition, since 2016, the fluctuations in their run rates have become much more closely correlated with global oil prices. Commercial crude oil users have much larger physical reserve space than the SPR. Notably, they tend to sharply increase their imports when crude oil prices are low. In addition, inventory accumulation often occurs when credit/financing is available with low costs and refiners expect higher prices ahead. Meanwhile, our research shows the SPR development has been slowing considerably in recent years, resulting in little inventory buildup in SPR. The last time the National Bureau of Statistics (NBS) reported the SPR data was December 29, 2017. It showed the SPR was about 37.73 million tons by mid-2017, not far from the country’s target of 40 million tons for the first two phases2 of SPR. This suggests that the country was at least close to finishing its second phase of the SPR in 2017. Since then, there has been little information about the third phase of the SPR progress. We have only been able to find two pieces of news on that subject, and both suggest the construction of the third phase of SPR has been stagnant, and the planning of two sites only started in 2019. As the average construction time for projects in the second phase of SPR was about four years, we do not think these sites were completed in 2020. The NBS data shows that even during the period of mid-2015 and mid-2017, the SPR had only increased by 234 kbpd, about 117 kbpd per year. In comparison, the Chinese total crude oil inventory increased by 600-700 kbpd per year in 2016 and 2017. Clearly, SPR only accounted for a small share of the Chinese total crude oil inventory. Looking forward, we expect a much slower pace of crude oil inventory buildup in China in 2021. Our forecast is based on the following factors: Current Chinese crude oil inventories (CPR and SPR combined) are already in the upper range when comparing the OECD countries (Chart 7). Although the IEA data shows that Japan and Korea have oil stocks of 200 days and 193 days of their respective crude oil net imports, Chinese oil inventories are currently equivalent to 195 days of crude oil net imports and much higher than the 90 days the IEA requires OECD countries to hold. With Brent oil prices having risen by a lot from the April 2020 trough and elevated domestic crude oil inventories, both government and commercial users will likely slow their purchases of overseas oil for inventory accumulation. In comparison, Chinese crude oil inventory accumulation growth slowed sharply in 2018 when Brent oil prices rose by 95% from their trough in mid-2017 (Chart 8), A significant portion of Chinese oil inventory buildup was accumulated over the past five years. At 1,170 kbpd, the largest annual accumulation was in 2020, higher than the 700-900 kbpd fill per year during 2017-2019. Chart 7China's Crude Oil Inventory: No Longer Low
China's Crude Oil Inventory: No Longer Low
China's Crude Oil Inventory: No Longer Low
Chart 8China: Rising Oil Prices Will Likely Slow Down Its Pace Of Crude Oil Inventory Accumulation
China: Rising Oil Prices Will Likely Slow Down Its Pace Of Crude Oil Inventory Accumulation
China: Rising Oil Prices Will Likely Slow Down Its Pace Of Crude Oil Inventory Accumulation
We do not expect the fast inventory accumulation of 2020 to repeat in 2021. Instead, a mean-reversal in the inventory accumulation pace will likely occur. Table 1Our Estimates Of The Scale Of Chinese Crude Oil Inventory In 2021
Chinese Commodities Demand: An Unsustainable Boom? Part III: Crude Oil
Chinese Commodities Demand: An Unsustainable Boom? Part III: Crude Oil
Our baseline estimate based on China’s 2021 import quota and refinery capacity3 is that Chinese crude oil inventory will increase to 207-210 days of Chinese crude oil imports by this year-end, up from 192 days at last year-end (Table 1). With already-elevated crude oil inventory, the pace of the inventory accumulation in China will be slower than last year. Bottom Line: After a massive buildup over recent years, the pace of inventory accumulation in China will slow in 2021 and probably onwards as well. As a result, Chinese oil import growth will converge with the pace of domestic consumption growth. China’s Robust Crude Oil Consumption Growth In 2021 Chart 9China: Resilient Domestic Crude Oil Consumption Growth In 2020
China: Resilient Domestic Crude Oil Consumption Growth In 2020
China: Resilient Domestic Crude Oil Consumption Growth In 2020
Despite the pandemic outbreak, last year’s underlying consumption of crude oil in China was resilient at a year-on-year growth of 4.5%, even though the rate was smaller than the average growth of 6-7% in 2018-2019 (Chart 9). The growth in oil consumption last year was mainly from the non-transportation sector. The output of non-transportation fuels, including fuel oil, naphtha, petroleum coke, and petroleum pitch, are mostly having impressive growth, suggesting strong consumption in sectors like chemical products, steel sector and infrastructure (Chart 10). For example, naphtha is the primary feedstock for ethylene production. Ethylene is the building block for a vast range of chemicals from plastics to antifreeze solutions and solvents. Transportation fuel consumption was weak in 2020, with the output of major transportation fuels including gasoline, diesel oil and kerosene in contraction (Chart 11). Chart 10Strong Consumption In Non-Transportation Sectors in 2020 Last Year
Strong Consumption In Non-Transportation Sectors in 2020 Last Year
Strong Consumption In Non-Transportation Sectors in 2020 Last Year
Chart 11Transportation Fuel Consumption Was Weak In 2020
Transportation Fuel Consumption Was Weak In 2020
Transportation Fuel Consumption Was Weak In 2020
In 2021, we expect the underlying consumption growth of crude oil in China to increase to 6-7% from last year’s 4.5%. This will be in line with its growth in both 2018 and 2019 (Chart 9 on page 7). First, the consumption of transportation fuels will likely recover this year. Transportation fuels are the largest consuming sector for Chinese petroleum products. Based on British Petroleum data, gasoline, diesel and kerosene accounted for 55% of total Chinese oil consumption in 2019. We expect the transportation fuel consumption growth to be stronger (i.e., 6-7%) than its five-year compounded annual growth rate (CAGR) of 4.1% during 2015-2019. Chart 12China's Automobile Sales Correlated Well With Its Crude Oil Imports
China s Automobile Sales Correlated Well With Its Crude Oil Imports
China s Automobile Sales Correlated Well With Its Crude Oil Imports
Automobile sales in China correlated well with the country’s crude oil imports (Chart 12, top panel). Despite a year-on-year contraction of 2% for the whole year of 2020, automobile sales had been strong with a double-digit growth nearly every month since May. Only 5% of these automobiles are new energy vehicles (NEV). About 80% of them are gasoline cars and 15% are diesel automobiles. Annual total car sales still account for about 9% of total existing automobiles (Chart 12, bottom panel). This means a 6-7% growth in the transportation consumption of passenger cars and commercial cars is very possible in 2021. The number of airports and airplanes are still on the uptrend in China. The CAGR of Chinese kerosene consumption rose from 10.1% during 2010-2014 to 10.6% during 2015-2019. This suggests that the kerosene consumption growth in China could reach 11% in 2021. Domestic gasoline and diesel prices are near decade lows (Chart 13). This will encourage consumption of these fuels. Second, the oil consumption growth in the industry sector will likely be larger than the 5% in the recent years (Chart 14). Based on the NBS data, the industry sector accounts for about 36% of China’s petroleum product consumption. Chart 13Low Domestic Gasoline And Diesel Prices Encourage Fuel Consumption This Year
Low Domestic Gasoline And Diesel Prices Encourage Fuel Consumption This Year
Low Domestic Gasoline And Diesel Prices Encourage Fuel Consumption This Year
Chart 14Robust Oil Consumption Growth In The Industry Sector In 2021
Robust Oil Consumption Growth In The Industry Sector In 2021
Robust Oil Consumption Growth In The Industry Sector In 2021
Third, infrastructure spending and property market construction will slow in 2H2021 given the credit, fiscal, and regulatory tightening that has been taking place. However, construction only accounts for about 6% of Chinese petroleum product consumption. Given all of this, achieving a 6-7% underlying consumption growth of crude oil in China this year is possible. Taking into consideration the slower pace of inventory buildup, we expect China’s crude oil imports to increase by 4-6% in 2021 over the previous year, slower than last year’s 7.2% growth. Bottom Line: The underlying consumption growth of crude oil in China is likely to increase to 6-7% in 2021 from last year’s 4.5%, providing solid support to China’s crude oil imports. What About Other Factors Affecting Chinese Crude Oil Imports? Currently, both domestic crude oil production and net exports of Chinese petroleum products exports are small contributors to the growth of Chinese crude oil imports. However, as the Chinese petroleum export sector becomes more competitive in the global market, it will likely take a bigger share of China’s crude oil imports going forward. Chart 15Net Exports Of Chinese Petroleum Products Are On The Uptrend
Net Exports Of Chinese Petroleum Products Are On The Uptrend
Net Exports Of Chinese Petroleum Products Are On The Uptrend
We expect domestic crude oil output to be stagnant in 2021. The breakeven prices for most domestic oil fields are US$50-60 per barrel. Without a considerable rally in oil prices, the total domestic crude oil output is unlikely to pick up. Moreover, due to the massive crude oil inventory buildup in recent years, Chinese oil producers may constrain their output. In this scenario, a reduction in domestic crude oil output by 1-2% in 2021 from 2020 is possible. Nonetheless, this will only increase China’s oil imports by a small amount of about 40-80 kbpd. The net exports of Chinese petroleum products are on the uptrend (Chart 15). Currently net exports of Chinese petroleum products account for only about 6% of Chinese crude oil imports. However, Chinese refineries are increasingly competitive in global gasoline and diesel markets, since most of the new refineries in the country are high technology equipped and highly efficient. In addition, last July, China started issuing export licenses to private refiners, and we expect the trend to continue. According to Bloomberg, China is set to surpass the US to become the world’s largest oil refiner in 2021. As such, in the coming years we expect rising Chinese exports of petroleum products will demand more imports of crude oil. We expect Chinese petroleum products net exports to rise by 100-150 kbpd in 2021 15-20% growth from last year), which may increase our estimate of China’s year-on-year crude oil import growth from 4-6% to 5-7% in 2021. However, increasing Chinese petroleum product exports does not increase global final demand for oil. It cannot be viewed as a fundamentally bullish factor for oil prices. Bottom Line: Stagnant domestic crude oil output and rising net exports of Chinese petroleum products will also lead to an increase of China’s crude oil imports. Investment Implications Chart 16China: An Increasingly Important Factor For Global Oil Demand
China: An Increasingly Important Factor For Global Oil Demand
China: An Increasingly Important Factor For Global Oil Demand
Strong crude oil imports by China have supported global oil prices in recent years. China has become an increasingly important driving force of global oil demand. Its oil imports currently make up about 12% of global oil demand, more than doubled from a decade ago (Chart 16). The country’s crude oil imports will continue expanding this year. Even at a slower rate, the robust oil consumption and imports from China will remain a positive factor for global oil prices in 2021. Beyond 2021, however, the country’s crude oil import growth outlook is facing increasing downside risks. Demand that is due to inventory accumulation is ultimately finite and non-recurring. Moreover, more oil accumulations in 2021 on top of China’s already elevated oil inventories may weigh on Chinese oil imports beyond 2021. In the meantime, US crude oil producers may benefit from continuing strong purchases from China. In 2020, China significantly ramped up its crude oil imports from the US, as the country has pledged to boost purchases of US energy products under the phase one trade deal signed with President Trump in January 2020. Chart 17Chinese Imports Of US Crude Oil May Continue To Rise In 2021
Chinese Imports of US Crude Oil May Continue To Rise In 2021
Chinese Imports of US Crude Oil May Continue To Rise In 2021
In 2020, Chinese imports of US crude oil in volume terms were 155% higher from a year before (Chart 17, top panel). Its share of total Chinese crude oil imports also spiked from 1-2% in late 2019 to 7-8% in the past several months (Chart 17, bottom panel). In the meantime, China’s share of US crude oil export also jumped from 4.6% in 2019 to 14.7% last year. In 2021, our baseline view is that China will want to show goodwill to the newly elected Biden administration by continuing to boost its crude oil purchase from the US. This will benefit US crude oil producers. However, if China buys more from the US, it may buy less from other countries. Ellen JingYuan He Associate Vice President ellenj@bcaresearch.com Footnotes 1By deducting crude oil used in refineries and in direct final consumption from the total supply, we derived the flow of inventory and the level of changes in inventory. By using the cumulative value of the flow inventory data, we were able to derive the stock of inventory. We assume the initial inventory in 2006 was zero. This assumption is reasonable as the first fill of the SPR was in 2007 and the stock of CPR was extremely low at that time as well. In addition, based on the data from the National Bureau of Statistics, we found out that the direct final consumption of crude oil without any transformation only accounted for about 1-2% of total supply. 2 In 2004, the government planned three phases of SPR construction, targeting 10-12 million tons of crude oil SPR for the first phase, 28 million tons for the second phase, and another 28 million tons for the third phase. 3The import quota for independent refiners in 2021 has been increased by 20% (about 823 kbpd), and the country’s refinery capacity will expand at about 500 kbpd per year over 2021-2025. Cyclical Investment Stance Equity Sector Recommendations
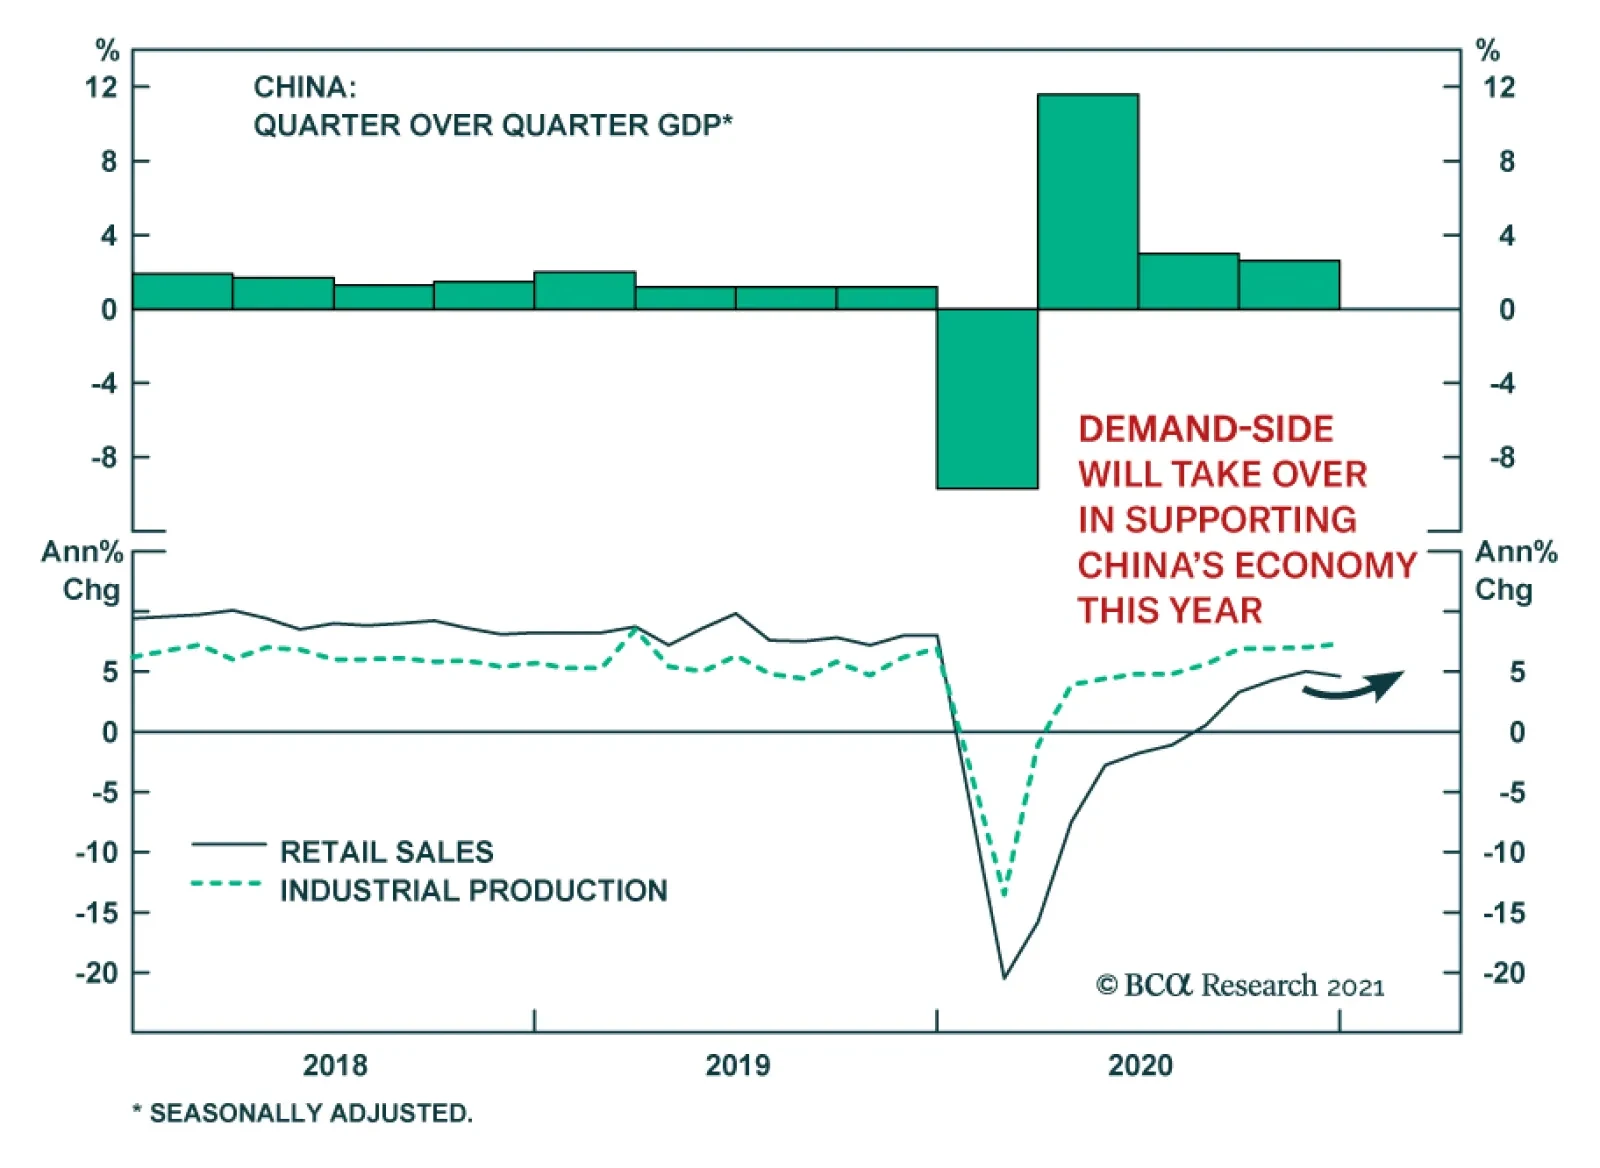
China’s December macro data and Q4 GDP are further evidence that thus far, the supply-side has been doing the heavy lifting in supporting the economic recovery. Industrial production surprised to the upside in December, accelerating to 7.3% y/y from 7.0% y/y.…
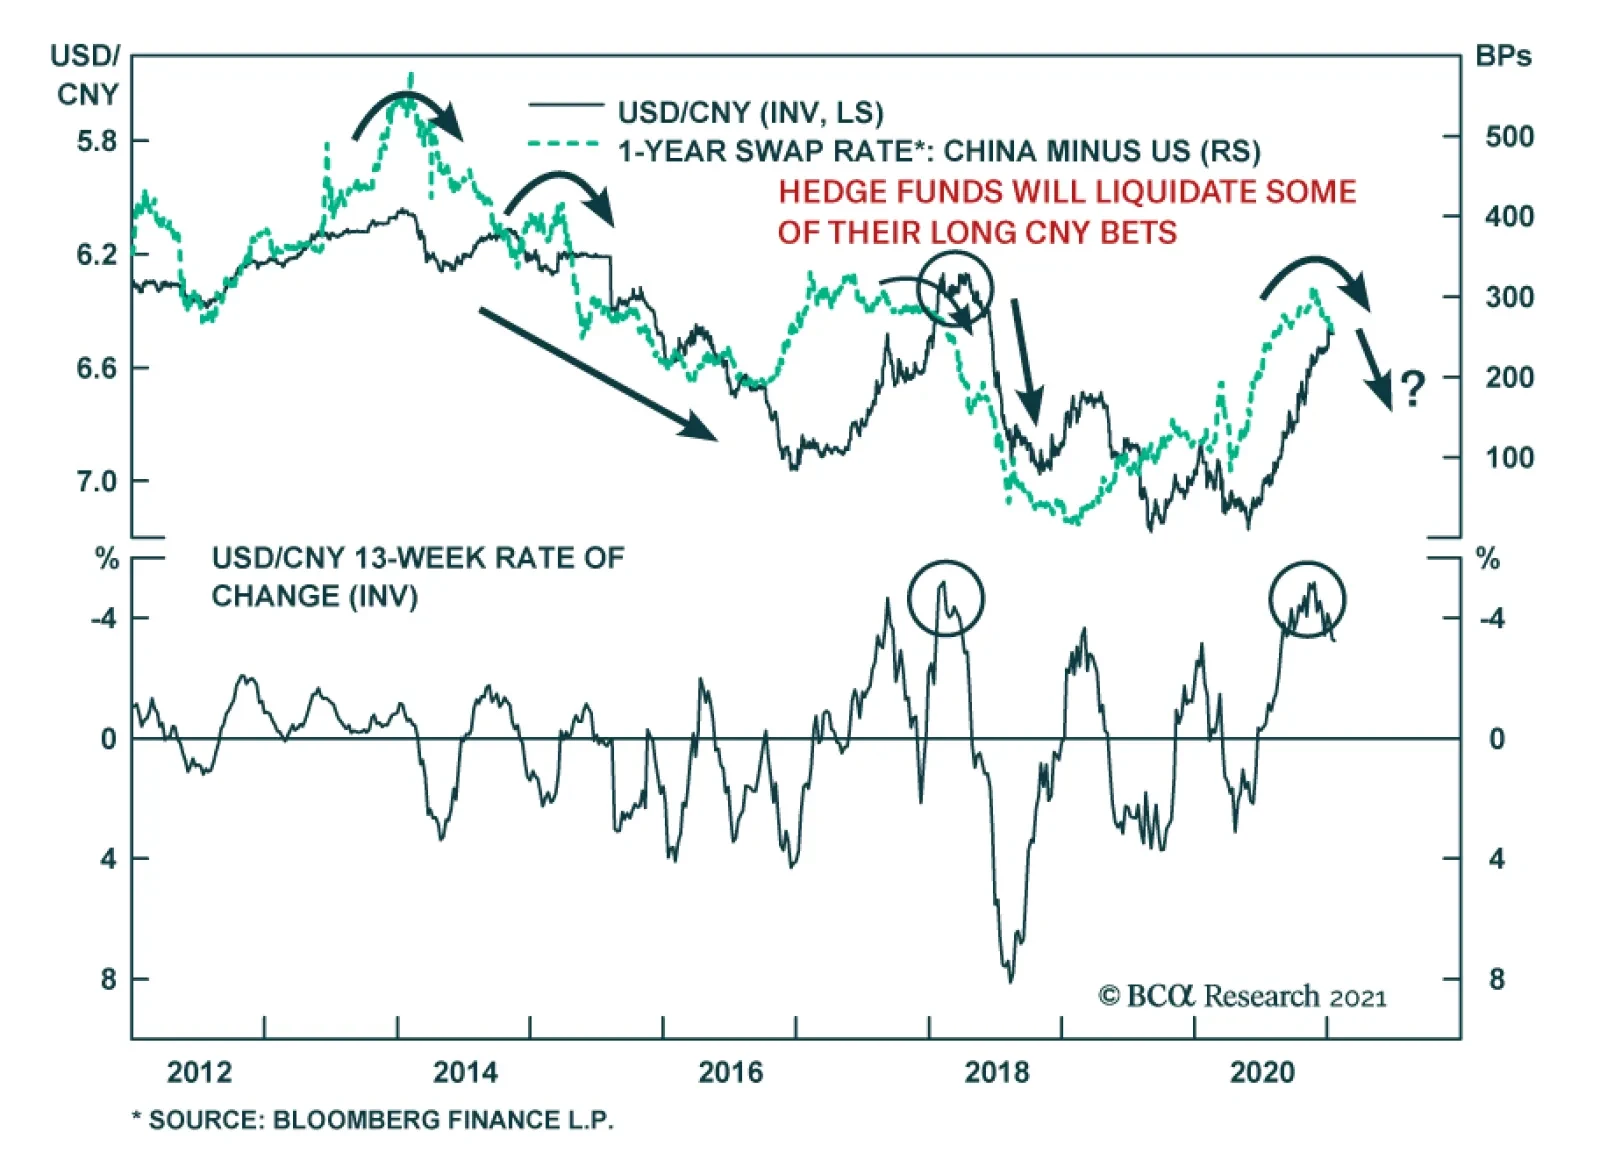
Over the past nine months, the strength in the CNY versus the USD has been a very important factor that has dampened global deflationary forces. The global economic recovery, the weakness in the dollar and widening interest rate differentials between China…
Highlights In the wake of COVID-19, the low-probability, high-impact “Black Swan” event is as relevant as ever. Investors should already expect US terrorist incidents, a fourth Taiwan Strait crisis, and crises involving Turkey – these are no longer black swans. What if Russia had a color revolution, Japan confronted China, or Saudi Arabia collapsed? What if the US and China brokered a North Korean deal? Or a major terrorist attack caused government change in Germany? Ultimately this exercise illustrates what the market is not prepared for – a new rally in the US dollar – though some scenarios would fuel the rise of the euro and renminbi. Feature The COVID-19 pandemic reminded us all of the power of the “Black Swan” – the random, unpredictable event with massive ramifications. As historian Niall Ferguson pointed out at the BCA Conference last fall, COVID-19 was not really a black swan, as epidemiologists had predicted that a pandemic would occur and the world was not ready. Astrophysicist Martin Rees made a bet with psychologist and linguist Steven Pinker that “bioterror or bioerror will lead to one million casualties in a single event within a six month period starting no later than 31 December 2020.”1 Tellingly, countries neighboring China were the best prepared for the outbreak, having dealt with SARS and bird flu. COVID accelerated major trends building up throughout the past decade – notably the shift toward pro-active fiscal policy, which had been gaining traction in policy circles ever since the austerity debates of the early 2010s. In that sense forecasting is still necessary. If solid trends can be identified, then random shocks may simply reinforce them (Chart 1). Chart 1US Fiscal Stimulus About To Get Even Bigger
Five Black Swans For 2021
Five Black Swans For 2021
In this year’s “Five Black Swans” report, we focus on geopolitical risks that are highly unlikely, not at all being discussed, and yet would have a major impact on financial markets. Domestic terrorist events in the United States in 2021 would not qualify as a black swan by this definition. A crisis in the Taiwan Strait, which we have warned about for several years, is now widely (and rightly) expected. Black Swan #1: A Color Revolution In Russia Russia is one of the losers of the US election. Not because Trump was a Russian agent – the Trump administration ended up authorizing a fairly hawkish posture toward Russia in eastern Europe – but rather because the Democratic Party threatens Russia with a strengthening of the trans-Atlantic alliance and a recovery of liberal democratic ideology. Geopolitical risk surrounding Russia is therefore elevated, as we argued last year. Both President Vladimir Putin and his government have seen their approval rating drop, a development that has often led Russia to lash out abroad (Chart 2). But our expectation of rising political risk within Russia’s sphere has been reinforced by Russia’s alleged poisoning of opposition politician Alexei Navalny and the eruption of pro-democracy protests in Belarus. Vladimir Putin is increasingly focusing on home affairs due to domestic instability worsened by the pandemic and recession. Fiscal and monetary austerity have weighed on the public. The largest protests since 2011 occurred in mid-2019 in opposition to the fixing of the Moscow municipal elections. This could be a harbinger of larger unrest around the Russian legislative elections on September 19, 2021. Nominal wage growth has collapsed and is scraping its 2015-16 lows (Chart 3). Chart 2Black Swan #1: A Color Revolution In Russia
Black Swan #1: A Color Revolution In Russia
Black Swan #1: A Color Revolution In Russia
Chart 3Russia's Fiscal Austerity
Russia's Fiscal Austerity
Russia's Fiscal Austerity
Meanwhile US policy toward Russia will become more confrontational. New US presidents always start with outreach to Russia, but the Democratic Party blames Russia for betraying the good faith of the Obama administration’s “diplomatic reset” from 2009-11. Russia invaded Ukraine and took Crimea in exchange for cooperating on the 2015 Iran nuclear deal. Adding in the Snowden affair, the 2016 election interference, and now the monumental SolarWinds cyberattack, the Democratic Party will want to strike back and reestablish deterrence against Russia’s asymmetrical warfare. While Biden will seek to negotiate an extension of the New START missile treaty from February 5, 2021 until 2026, he will gear up for confrontation in other areas. The US could seek to go on offense with Russia’s wonted tools: psychological warfare and cyberattacks. The Americans are not willing or able to attempt regime change in Moscow. That would be taken as an act of war among nuclear powers. But if Russia is less stable internally than it appears, then US meddling could hit a weak spot and set off a chain reaction. Even if the US is incapable of anything of the sort, Russia is still ripe for social unrest. Should the authorities mishandle it, it could metastasize. Russia has a long tradition of peasant uprisings – a descent into anarchy is not out of the question. The regime would not be devoting so much attention to suppressing domestic dissent if the conditions for it were not ripe.2 Putin’s constitutional reforms in mid-2020, which could extend his term until 2036, also speak to concerns about regime stability. A successful Russian uprising would threaten to raise serious instability in Europe and the world. When great but decadent empires are destabilized, political struggle can intensify rapidly and spill out to affect the neighbors. Bottom Line: Russian domestic political instability could produce a black swan. The ruble would tank and the US dollar would catch a bid against European currencies. Black Swan #2: A Major Terror Attack In Germany 2020 was a banner year for European solidarity. Brexit went forward but none of the European states have followed – nor would any want to follow given the political turmoil it aroused. Brussels initiated a recovery fund to combat the global pandemic that consisted of a mutual debt scheme – in what has been hailed somewhat excessively as a “Hamiltonian moment,” a move toward federalism. Germany stood at the center of this process. After opening the doors to a flood of migrants from Syria in 2015, Chancellor Angela Merkel suffered a blow to her popularity and was eventually forced to make plans for her exit. But she stuck to her core liberal policies and her fortunes have recovered (Chart 4). She is stepping down in 2021 as the longest-serving chancellor since Helmut Kohl and an influential European stateswoman. The EU member states are more integrated than ever while Germany has taken another step toward improving its international image. The public has rewarded the ruling coalition for its relatively competent handling of the global pandemic (Chart 5). Chart 4Black Swan #2: A Major Terror Attack In Germany
Black Swan #2: A Major Terror Attack In Germany
Black Swan #2: A Major Terror Attack In Germany
Chart 5German People Happy With Their Government
Five Black Swans For 2021
Five Black Swans For 2021
Merkel’s approval coincides with a recovery of the liberal democratic consensus in Europe after a series of challenges from anti-establishment and populist parties. Only in Italy did populists take power, and they were forced to back down from their extravagant fiscal policy demands while modifying their policy platform with regard to membership in the monetary union. Even today, as Italy’s ruling coalition comes apart at the seams, the risk of a populist backlash is lower than it was in most of the past decade. One of the main ways the European establishment neutralized the populist challenge was by tightening control over immigration and cracking down on terrorism (Charts 6 and 7). These two forces have played a large role in generating support for right wing parties, and these parties have declined in popularity as these two forces have abated. Chart 6Terrorist Attacks Have Fallen In Europe
Terrorist Attacks Have Fallen In Europe
Terrorist Attacks Have Fallen In Europe
Chart 7Europeans Softening Toward Immigrants?
Europeans Softening Toward Immigrants?
Europeans Softening Toward Immigrants?
Still, the risk posed by terrorist groups has not disappeared – and it is always possible that disaffected individuals could evade detection. French President Emmanuel Macron faced seven terrorist attacks over the past year, which partly stemmed over the commemoration of the Charlie Hebdo massacre but also points to the persistence of underground extremist networks (Chart 8).3 Chart 8French Fear Of Terrorism Has Increased
Five Black Swans For 2021
Five Black Swans For 2021
Chart 9European Breakup Risk At Testing Point
European Breakup Risk At Testing Point
European Breakup Risk At Testing Point
What would happen if a major attack occurred in Germany in 2021? Would it upset the country’s liberal consensus and fuel another surge in popular support for far-right parties like the Alternative for Germany? Only a major attack would have a lasting impact. A systemically important attack in the pivotal year of Merkel’s retirement could create more uncertainty in domestic German politics than has been seen since the 1990s and early 2000s. It is possible that an attack could strengthen the ruling coalition and the public’s desire to continue with the leadership of the Christian Democrats after Merkel. More likely, however, it would divide the conservative and right-wing parties among themselves. Merkel’s chosen successor, Defense Minister Annagret Kramp-Karrenbauer, was forced to abandon her bid for the chancellorship last year after members of her Christian Democratic Union in the state of Thuringia voted along with the anti-establishment Alternative for Germany to remove the state’s left-wing leader. The cooperation was minimal but it set off a firestorm by suggesting that Kramp-Karrenbauer was willing to work together with the far right.4 She bowed out and now the party is about to pick a new leader. The point is that if any event strengthens the far right, it would suck away votes from the Christian Democrats. The latter could also see divisions emerge with their Bavarian sister party, the Christian Social Union, which has differed on immigration in the past. Or the conservatives could alienate the median German voter by tacking too far to the right to preempt the anti-establishment vote (e.g. overreacting to the attack). Either way, German politics would be rocked. Ironically, if the coalition was seen as mishandling the response, a left-wing coalition of the Greens and the Social Democrats could be the beneficiaries. The risk of a government change – in the wake of Merkel and the pandemic – is greatly underrated, entirely aside from black swans. Nevertheless a major shock that strengthens the far right would be a black swan by forcing the question of whether the center-right is willing to cooperate with its fringe. If that occurred, then Europe would be stunned. If it did not, then the conservatives could lose the election and plunge into intra-party turmoil. The takeaway of a rightward shift on the back of any shock would be a renewed risk of fiscal hawkishness – a partial relapse from the past two years’ fiscal expansion to the more traditionally austere German posture. The takeaway of a leftward shift would be the opposite – a doubling down on that fiscal expansion. German hawkishness would increase the European breakup risk premium, while a confirmation of the new German dovishness would further suppress it (Chart 9). Bottom Line: The fiscal dovish turn is the more likely response to such a black swan in today’s climate, but a major terrorist attack could have unpredictable consequences. Black Swan #3: A US-China Deal On North Korea Critics misunderstood President Trump’s policy on North Korea. Trump’s policy – even his belligerent rhetoric – echoed that of Bill Clinton in the 1990s. The intention of the US show of force was to create an overwhelming threat that would force Pyongyang into serious negotiations toward a nuclear deal. That in turn would pave the way to economic cooperation. Trump’s efforts failed – Kim Jong Un stonewalled him in the final year and a half. Kim’s bet paid off since he avoided making major concessions and now Biden must start from scratch. Pyongyang has ramped up its threats and Kim has elevated his sister, Kim Yo Jong, to a higher standing in the party – apparently to lob attacks at South Korea full-time. Biden will put the technocrats and Korea experts in charge. Pyongyang may test nuclear weapons or launch intercontinental ballistic missiles to attract Biden’s attention. But Kim could also go straight to negotiations. Optimistically, a few years of talks could result in a phased reduction of sanctions in exchange for nuclear inspections. Kim has the incentive and the dictatorial powers to open up the economy and engage in market reforms while managing any backlash among the army. He has already prepared the ground by elevating economic policy to the level of military policy in the national program. For years he has allowed some market activity to little effect. The North must have suffered from the pandemic, as Kim publicly confessed to the failure of economic management at the latest party meeting. His country needs a vaccine for COVID. And if he intends to go the way of Vietnam, then he needs to open up the doors while a new global business cycle is beginning (Chart 10). The black swan would emerge if the Biden administration’s attempt to reboot relations with China produced a unified effort to force a resolution onto Kim. It is undeniable that Trump broke diplomatic ice by meeting with Kim directly, giving Biden the option of doing so quickly and with minimal controversy if he should so desire. Most importantly, China has enforced sanctions, if official statistics can be trusted (Chart 11). Beijing made no secret that it saw North Korea as an area of compromise to appease US anger. After all, success on the peninsula would remove the reason for the US to keep troops there. Chart 10Black Swan #3: A US-China Deal On North Korea
Five Black Swans For 2021
Five Black Swans For 2021
Chart 11An Area Of US-China Cooperation Under Biden?
An Area Of US-China Cooperation Under Biden?
An Area Of US-China Cooperation Under Biden?
The last point is the material point. If the North sought to open up, it would likely have to do so through talks with the US, China, South Korea, and Japan. Success would mean that US-China engagement is still effective. Bottom Line: A breakthrough on the Korean peninsula would mean that investors could begin imagining a future in which the US and China are not “destined for war” but rather capable of reviving their old cooperative approach. This has far-reaching positive implications, but most concretely the Korean won and Chinese renminbi would rally against the US dollar and Japanese yen on the historic reduction of war risk. Black Swan #4: Saudi Arabia (And Oil Prices) Collapse Saudi Arabia is an even greater loser from the US election than Russia. The Saudis came face to face with their geopolitical nightmare of US abandonment under the Obama administration, as the US gained energy independence while reaching out to Iran. The 2015 nuclear deal gave Iran a strategic boost and enabled it to resume pumping oil (Chart 12). The Saudis, like the Israelis, lobbied hard to stop the deal but failed. They threw their full support behind President Trump, who reciprocated, and now face the restoration of the Obama policy under Joe Biden. Chart 12Black Swan #4: Saudi Arabia (And Oil Prices) Collapse
Black Swan #4: Saudi Arabia (And Oil Prices) Collapse
Black Swan #4: Saudi Arabia (And Oil Prices) Collapse
Chart 13Fiscal Pressure On Saudis
Fiscal Pressure On Saudis
Fiscal Pressure On Saudis
Global investors should expect Biden to return to the nuclear deal with Iran as quickly as possible, notwithstanding Iran’s latest nuclear provocations, since the latter are designed to increase negotiating leverage. The Joint Comprehensive Plan of Action was an executive agreement that Biden could restore with the flick of his wrist, as long as Iranian President Hassan Rouhani returned to compliance. Rouhani can do so before a new president is inaugurated in August – he could secure his legacy at the cost of taking the blame for “dealing with the devil.” This would save the regime from further economic and social instability as it prepares for the all-important succession of the supreme leader in the coming years. A black swan would occur if this diplomatic situation led to a breakdown in support for Crown Prince Mohammed bin Salman (MBS). MBS, whose nickname is “reckless,” in part because his foreign policies have backfired, could attempt to derail or sabotage the US-Iran détente. If he tried and failed, the US could effectively abandon Saudi Arabia – energy self-sufficiency, public war-weariness, and Iranian détente would pave the way for the US to downgrade its commitment. This would create an existential risk for the kingdom, which depends on the US for national security. It could also be the final straw for MBS, who already faces opposition from elites who have been shoved aside and do not wish to see him ascend the throne in a few years’ time. A different trigger for the same black swan would be a collapse of the OPEC 2.0 oil cartel. The Saudis and Russians have fought two market-share wars over the past seven years. They could relapse into conflict in the face of shifting global dynamics, such as the green energy revolution, that disfavor oil. Arthur Budaghyan and Andrija Vesic, of BCA’s Emerging Markets Strategy, have argued that financial markets will start pricing in a higher probability of Saudi currency depreciation versus the US dollar in coming years. Lower-for-longer oil prices (say $40 per barrel average over next few years) would pose a dilemma to the authorities: either (1) cut fiscal spending further and tighten liquidity or (2) resort to local banks financing (money creation “out of thin air”) to sustain economic activity. The first scenario would impose severe fiscal austerity on the population (Chart 13), which is politically difficult to endure in the long run. The second scenario will lead to depleting the country’s FX reserves, robust money growth and some inflation culminating in downward pressure on the currency. The main reason for believing the devaluation will not happen is that it would topple the regime. Currency devaluation would result in unbearable inflation in a country that lacks domestic production and domestically sourced staples. But that is precisely why it is a black swan risk. After all, prolonged fiscal austerity may not be feasible either. Bottom Line: MBS controls the security forces and has consolidated power for years but that may not save him if his foreign policies led to American abandonment or a breakdown of the peg. Black Swan #5: A Sino-Japanese Crisis For the first time since 2016, we are not including US-China tensions over Taiwan in our list of black swans. A crisis in the strait is only a matter of time and the global news media is increasingly aware of it (Chart 14). It would not necessarily have to be a war or even a show of military force, though either are possible. A mere Chinese boycott or embargo of Taiwan would violate the US’s Taiwan Relations Act and trigger a US-China crisis from the get-go of the Biden administration. What is less widely recognized is that peaceful resolution of the China-Taiwan predicament is not just a concern for the United States. It is a concern for Japan and South Korea as well – whose vital supplies must travel around the island one way or another. These two nations would face constriction if mainland China reunified Taiwan by force – and therefore Beijing’s signals of increasing willingness to contemplate armed action are already reverberating among the neighbors. Japan sounded an uncharacteristically stark warning just last month. The hawkish statement from State Minister of Defense Yasuhide Nakayama is worth quoting at length: We are concerned China will expand its aggressive stance into areas other than Hong Kong. I think one of the next targets, or what everyone is worried about, is Taiwan … There’s a red line in Asia – China and Taiwan. How will Joe Biden in the White House react in any case if China crosses this red line? The United States is the leader of the democratic countries. I have a strong feeling to say: America, be strong!5 China and Japan have improved trade relations through the RCEP agreement, as Beijing looks to diversify from the United States. But China’s rise is of enormous strategic concern for Japanese policymakers. COVID-19 and the rollback of Hong Kong’s freedoms have made matters worse. The belt of sea and land around China – the “first island chain” – is the critical area from which Beijing seeks to expel American and foreign military presence. With China already having shown a willingness to clash with India and Australia simultaneously in 2020 – as it carves a sphere of influence in the absence of American pushback – it should be no surprise to see conflicts erupt in the East or South China Sea (Chart 15). Chart 14Differences In The Taiwan Strait
Differences In The Taiwan Strait
Differences In The Taiwan Strait
Chart 15Black Swan #5: A Sino-Japanese Crisis
Black Swan #5: A Sino-Japanese Crisis
Black Swan #5: A Sino-Japanese Crisis
In the aftermath of the last global crisis, in 2010, China and Japan clashed mightily over maritime-territorial disputes in the East China Sea. China imposed a brief embargo on exports of rare earth elements to Japan. The two clashed again the following year and tensions escalated dramatically when China rolled out an Air Defense Identification Zone (ADIZ) in 2013. Tense periods come and go and are often attended by mass anti-Japanese protests, as in 2005 and 2012. Usually these events are of passing importance, though they have the potential to escalate. What would truly be a black swan would be if Japan took the initiative to challenge China and test the Biden administration’s commitment to Japanese security. With the US internally divided and distracted, and China ascendant, Japan could grow increasingly insecure and seek to take precautions. China could see these as offensive. A new Sino-Japanese crisis could ensue that would catch investors by surprise. It is highly unlikely that Tokyo would provoke China – hence the black swan designation – but the effective absence of the Americans is a strategic liability that Tokyo may wish to resolve sooner rather than later. In this case the market reaction would be predictable – the yen would appreciate while the renminbi and Taiwanese dollar would fall. The risk-off period could be extended if the US failed to reinforce the Japanese alliance for fear of China, with the whole world watching. Bottom Line: Global investors would be blindsided if a sudden explosion of Sino-Japanese tensions prevented any US-China thaw and confirmed their worst fears about China’s economic decoupling from the West. Investment Takeaways This exercise in identifying black swans may be useful in at least one way: it exposes the vulnerability of financial markets to a sudden reversal of the US dollar’s weakening trend (Chart 16). The dollar would surge on broad Russian instability, Sino-Japanese conflict, or another exogenous geopolitical shock. This kind of dollar surprise would be much greater than a temporary counter-trend bounce, which our Foreign Exchange Strategist Chester Ntonifor fully expects. It would upset the financial community’s dollar-bearish consensus, with far-reaching ramifications for the global economy and financial markets. A rising dollar against the backdrop of a recovering global economy represents a de facto tightening of global financial conditions. Equity markets, for example, have only started to rotate away from the US and this trend would be reversed (Chart 17). Whereas further appreciation of the euro and the renminbi is not only expected but would support global reflation. Chart 16The USD Over Trump's Four Years
The USD Over Trump's Four Years
The USD Over Trump's Four Years
Chart 17Global Market Cap Over Trump's Four Years
Global Market Cap Over Trump's Four Years
Global Market Cap Over Trump's Four Years
There is a much plainer and straighter way to an upset of the dollar-bearish consensus. Rather than a black swan it is a “gray rhino,” the term that Michele Wucker uses for risks that are common, expected, and staring you right in the face.6 This would be the peak of China’s stimulus, which holds out the risk of a major reversal to the pro-cyclical global financial market rally in late 2021 (Chart 18). Chart 18China Impulse Will Linger In 2021, But EM Stocks Tactically Stretched
China Impulse Will Linger In 2021, But EM Stocks Tactically Stretched
China Impulse Will Linger In 2021, But EM Stocks Tactically Stretched
It would be a colossal error if Beijing over-tightened monetary and fiscal policy in 2021 in the context of high debt, deflation, and unemployment (Chart 19). Chart 19Three Reasons China Will Avoid Over-Tightening (If It Can)
Three Reasons China Will Avoid Over-Tightening (If It Can)
Three Reasons China Will Avoid Over-Tightening (If It Can)
Nevertheless the government’s renewed efforts to contain asset bubbles and credit excesses clearly increase the risk. Financial policy tightening is always a risky endeavor, as global policymakers routinely discover. Chart 20Book Profits But Stay Cyclically Positive On Reflation Trades
Book Profits But Stay Cyclically Positive On Reflation Trades
Book Profits But Stay Cyclically Positive On Reflation Trades
We maintain that China’s major stimulus will have a lingering positive effects for the economy for most of this year and that the authorities will relax policy and regulation as needed to secure the recovery. The Central Economic Work Conference in December suggested that the Politburo still views downside economic risks as the most important. But this is a clear and present risk that will have to be monitored closely. Clearly the global reflation trend has extended to dangerous technical extremes over the past month on the realization that US fiscal stimulus will surprise to the upside. Therefore we are doing some housekeeping. We will book 31.1% profit on long cyber security, 16.7% on long US infrastructure, and 24.3% on long US materials. We will also book 9.5% gains on our long EM-ex-China equity trade, which has gone vertical (Chart 20). Matt Gertken Vice President Geopolitical Strategy mattg@bcaresearch.com Footnotes 1 Such epidemiologists include Michael Osterholm and Lawrence Brilliant. For Pinker and Rees, see George Eaton, "Steven Pinker interview: How does a liberal optimist handle a pandemic?" The New Statesman, July 22, 2020, newstatesman.com. 2 Thomas Grove, "New Russian Security Force Will Answer To Vladimir Putin," Wall Street Journal, April 24, 2016, wsj.com. 3 Elaine Ganley, "Grisly beheading of teacher in terror attack rattles France," Associated Press, October 16, 2020, apnews.com. 4 Philip Oltermann, "German politician elected with help from far right to step down," The Guardian, February 6, 2020, theguardian.com. 5 Ju-min Park, "Japan official, calling Taiwan ‘red line,’ urges Biden to ‘be strong,’" Reuters, December 25, 2020, reuters.com. 6 See www.wucker.com.