China
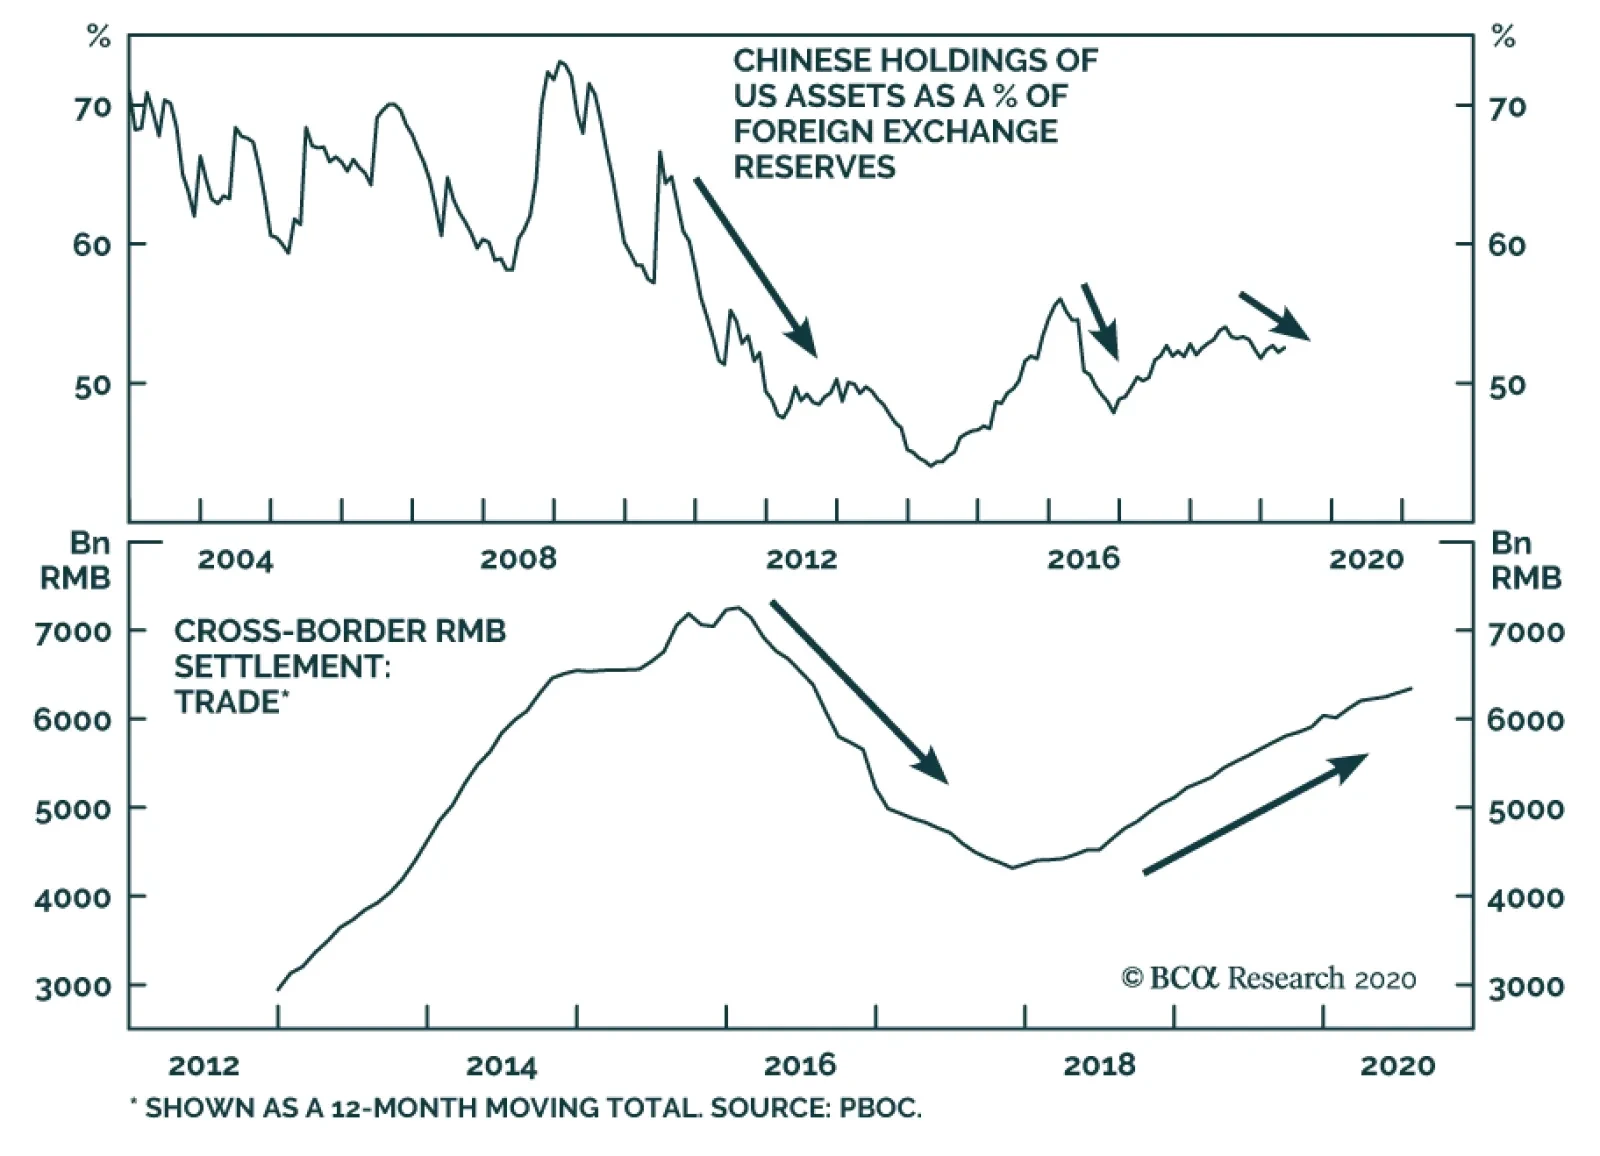
Since 2018, China has been promoting its own domestic cross-border interbank settlement system (CIPS). It is not BCA Research's baseline view that the US will cut off Chinese banks entirely from access to the US Clearing House Interbank Payments System…
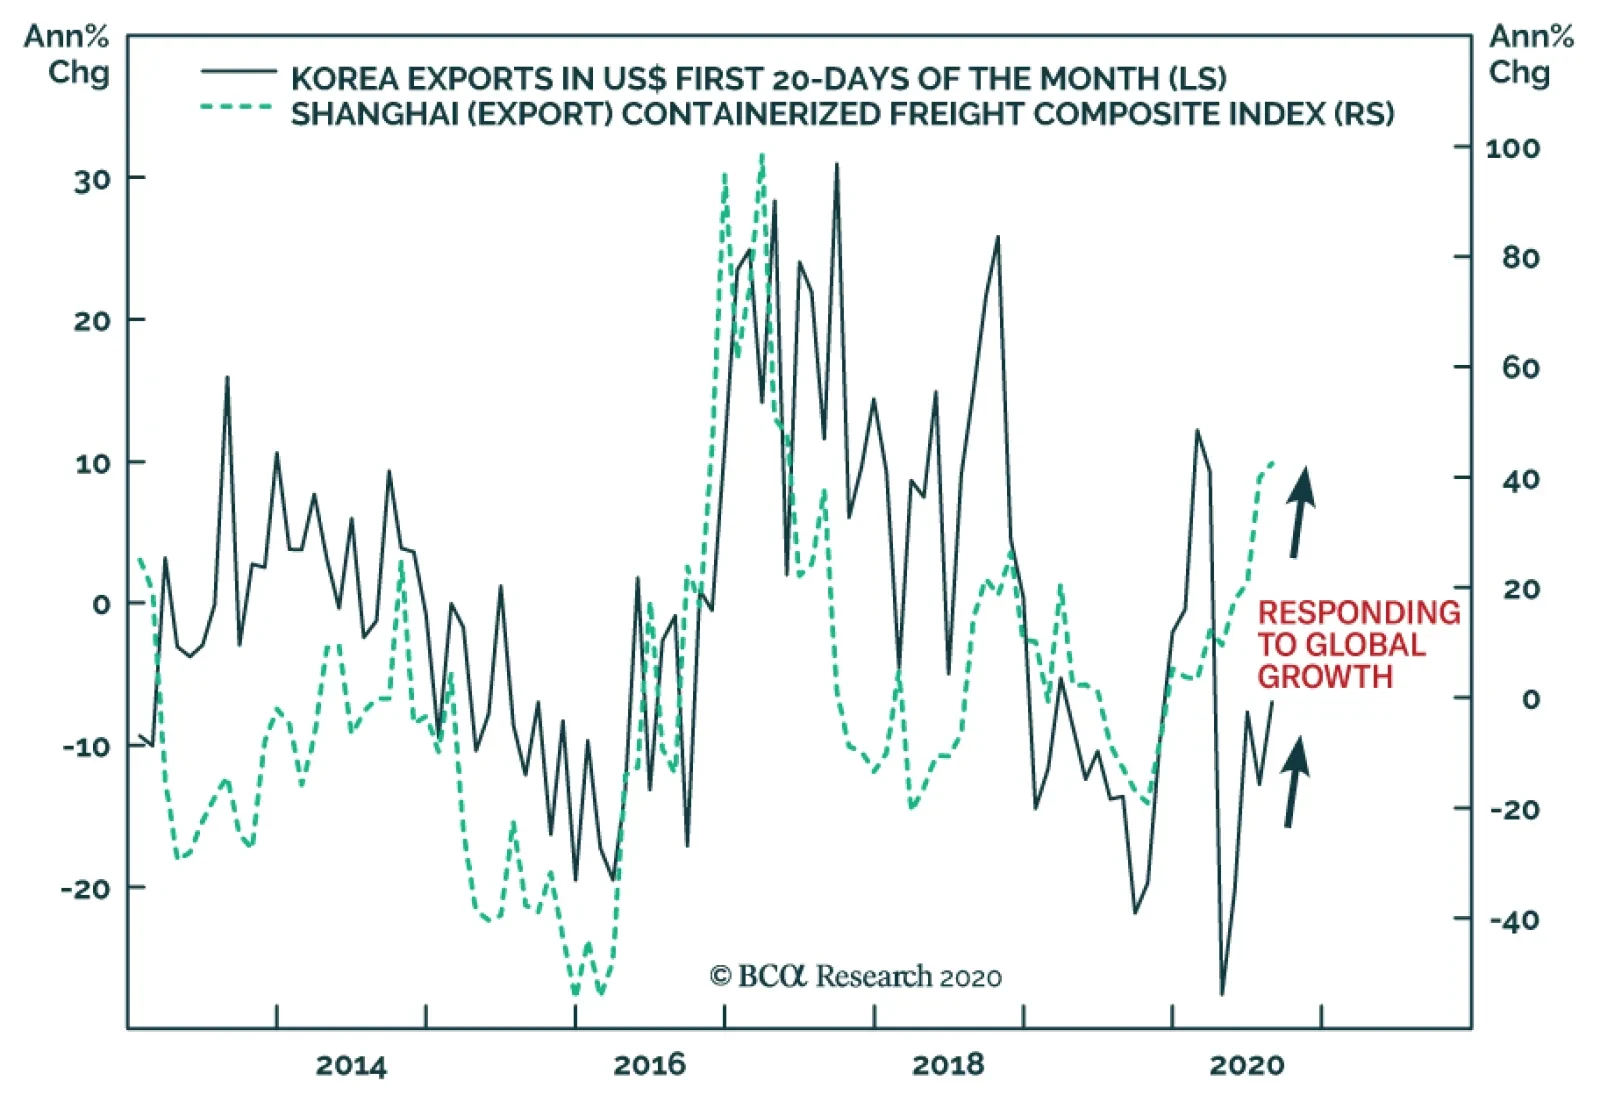
The Shanghai Container Freight Index reached its highest level in 6 years. Some of the strength in China’s container trade can be assigned to idiosyncratic factors. For example, household goods demand in the US and EU is strong, and retailers in those markets…

Highlights The stock market can apparently ignore the intensifying US-China conflict as long as massive monetary and fiscal stimulus continues. Hence the ongoing “stimulus hiccup” is a big problem. Ultimately a stimulus bill will pass, but risks are rising that it will come too late or fall short in size. The longer the negotiations drag on, the more likely that the absence of fiscal support, the spiraling US-China conflict, US political instability, and other risks will take center stage and upset the equity rally. Assuming a new stimulus package will ultimately pass, it will fuel Trump’s tentative comeback in opinion polls, increasing the risk that the revolution in the global trading system gets a new lease on life. Thus volatility is likely to rise from here until the US succession is settled. Stay long JPY-USD and health stocks in the near term and bullion in the long term. Feature Two of the key views we have hammered since May are coming to fruition: Stimulus Hiccup: The White House and Congress are struggling to get a new relief bill passed. We have argued that the next round of fiscal stimulus would face execution risks that would cause equity volatility to rise again, which is now occurring (Chart 1). Ultimately we expect the Republican Senate to capitulate to a major new stimulus bill. But the very near term is murky and the negotiations pose a clear and present danger to an equity market that has now surpassed its pre-COVID-19 highs (Chart 2). Chart 1Volatility Is Bottoming, Will Rise Ahead Of US Election
Volatility Is Bottoming, Will Rise Ahead Of US Election
Volatility Is Bottoming, Will Rise Ahead Of US Election
Chart 2Markets Recovered, Near-Term Risk To Downside
Markets Recovered, Near-Term Risk To Downside
Markets Recovered, Near-Term Risk To Downside
US-China Conflict: The White House has revoked Chinese tech giant Huawei’s general license, leaving the company in thrall to periodic Commerce Department allowances that will impede business. It has also expanded punitive measures to a slew of subsidiaries and Chinese software companies like TikTok (ByteDance) and WeChat (Tencent). We have argued that President Trump’s electoral vulnerability and economic stimulus in both countries lowered the bar to conflict and decoupling. Both countries have an interest in reducing their interdependency and the COVID-19 crisis has given them an opportunity to make structural changes that were previously more difficult. Neither the US tech sector, nor China-exposed US stocks, nor Taiwanese equities are pricing this monumental geopolitical risk at present (Chart 3). Combining these two views results in a dangerous outlook for global risk assets in the near term. The reason we argued that US-China tensions would escalate to the point of disrupting markets this year was that we viewed domestic stimulus as lowering the economic and financial bar that prevented conflict. Hence US and Chinese confrontational steps could go farther than the market expected and eventually something would snap (Chart 4). Chart 3Market Ignores US-China Escalation
Market Ignores US-China Escalation
Market Ignores US-China Escalation
Chart 4US And Global Stimulus Enable US-China Fight
Trade War Sans Stimulus Is Unsustainable
Trade War Sans Stimulus Is Unsustainable
Yet today tensions are escalating despite the failure to arrange a new jolt of domestic stimulus. This is true on both sides, as China is also seeing a deceleration in stimulus provision, mainly on the monetary side, that we also expect to be temporary but nevertheless has negative implications in the near term. The longer fresh stimulus is delayed, the more likely that markets will respond to the historic breakdown in US-China relations, US political instability, and other risks to corporate earnings and the economic recovery. Constraints On Politicians Support Cyclical Recovery To be sure, there is evidence that politicians are aware of their limits and already heading back to the negotiating table. Even with talks ongoing, the risks of delayed stimulus or Chinese retaliation are substantial. First, the White House, House Democrats, and Senate Republicans are continuing to negotiate despite being on recess while hosting national party conventions this week and next. House members are rushing back to Washington to vote on measures to boost the US postal service amid a controversy over how to handle mail-in voting for the election amid the pandemic. This has opened a pathway for stimulus talks to get back on track. It could result in a “skinny” stimulus bill quickly, or otherwise new developments could lead to the roughly $2.5 trillion blowout that we expect based on the two sides splitting the difference on most issues (Table 1). Table 1Stimulus Bill Will Hit $2.5 Trillion If Democrats And Republicans Split The Difference
Trade War Sans Stimulus Is Unsustainable
Trade War Sans Stimulus Is Unsustainable
Chart 5Trump’s Reelection Bid Stands On The Economy
Trade War Sans Stimulus Is Unsustainable
Trade War Sans Stimulus Is Unsustainable
Second, the US and China are arranging to keep talking. Ostensibly they are checking up on the status of the Phase One trade deal. The Trump administration cannot easily walk away from this deal– unless Trump irredeemably becomes a lame duck making a desperate bid to turn the tables on the Democrats. To do so would hurt Trump’s credibility on renegotiating US trade deals and likely trigger a selloff in the stock market that could set back the economic recovery and remove the last leg that his reelection bid stands on (Chart 5). The Chinese, for their part, have stuck with the deal despite US punitive measures because they do not want to provoke Trump, lest he attempt to inflict maximum damage on their economy in his final months or in a second presidential term. The renminbi is not depreciating relative to the dollar, suggesting that the tenuous truce is intact for now (Chart 6). Chart 6Renminbi Signals Phase One Trade Deal Intact ... For Now
Renminbi Signals Phase One Trade Deal Intact ... For Now
Renminbi Signals Phase One Trade Deal Intact ... For Now
Yet The Market May Sell Before Politicians Soften Their Line Nevertheless in the very near term investors have very low visibility on what happens next. Congress could still fumble and cause greater doubts. It could easily fail to reach a new stimulus deal until after September 8 when the Senate returns or September 14 when the House returns. President Trump’s executive orders, and negotiating gestures from Republicans, are a tenuous bridge for markets as they fall far short of even the Republicans’ $1 trillion asking price. The stock market will plunge if the talks collapse, but it will also drop if the stimulus falls short. The market may have to sell off to force politicians to provide stimulus and temper strategic competition. Trump’s complicated attempt to extend relief via executive orders, and/or a skinny deal that does not include direct rebates to households and funding for state and local governments, would be inadequate for the needs of the economy (Chart 7). It is imperative for Senate Republicans to capitulate and come closer to the Democrats $2.4 trillion standing offer (down from $3.4 trillion) – but it is possible they could miscalculate and fail to compromise. Democrats will not cave because they ultimately benefit at the ballot box if stimulus flops and financial turmoil returns. Chart 7US Economy Needs Extended Period Of Fiscal Support
US Economy Needs Extended Period Of Fiscal Support
US Economy Needs Extended Period Of Fiscal Support
On the China front, it is not guaranteed that China will refrain from retaliation against tech companies like Apple that depend on China for their operations. The market is betting that a rally entirely based on the tech sector can be sustained even in the face of an expanding tech war between the world’s biggest economies (Chart 8). Yet China suffers an economic and strategic blow from the US imposition of a technological cordon and Xi Jinping could decide to retaliate immediately. He could come to believe that the risk of not retaliating – which would entail continuing economic recovery and possibly Trump’s reelection on an anti-China platform – is greater than the risk of retaliation and financial turmoil. He has the ability to stimulate the domestic economy and benefits if he sets a precedent that American presidents lose if they attack China. China may not turn to Taiwan immediately, but since 2016 we have highlighted that Taiwan, not Hong Kong, is the major geopolitical risk stemming from the US-China crisis. Saber-rattling, cyber-rattling, and punitive economic measures are picking up in the Taiwan Strait and could lead to a global geopolitical crisis at any time. Here, too, the base case is that China will remain in a holding pattern until after the US election. It also should use economic sanctions long before it resorts to the final military option (Chart 9). But there is a large risk of miscalculation as the US seeks to cut off Taiwan semiconductor trade with China while Taiwan reduces its economic dependency on the mainland and tightens its defense relations with the United States. The Trump administration presents a window of opportunity so the risks are elevated in the lead up to and aftermath of the US election. Chart 8Tech Bubble Amid Tech War An Obvious Danger
Tech Bubble Amid Tech War An Obvious Danger
Tech Bubble Amid Tech War An Obvious Danger
Chart 9China's Economic Card May Be Only Thing Preventing War
China's Economic Card May Be Only Thing Preventing War
China's Economic Card May Be Only Thing Preventing War
We do not view Chinese economic sanctions on Taiwan as a tail risk but rather as our base case. Of course, we eschew conspiracy theories and usually seek to curb enthusiasm over war risks, as with Sino-Indian saber-rattling. But Taiwan is the epicenter of the political, military, and technological struggle between Washington and Beijing. War is a tail-risk, but even minor clashes would have a major impact on global financial markets. Other Risks Come To Forefront Amid Stimulus Hiccup Chart 10Trump’s Comeback Substantial If Stimulus Passes, Pandemic Subsides
Trade War Sans Stimulus Is Unsustainable
Trade War Sans Stimulus Is Unsustainable
The longer stimulus is delayed, the more likely that other risks will rise to the forefront and trouble the equity market. The US election does not offer much upside for markets at this point. Other risks stem from Iran and Russia. In the US election, President Trump is beginning to make a comeback in the opinion polling (Chart 10). Trump’s approval rating benefits from signing off on deals, so a final stimulus bill from Congress is essential. But a stimulus bill, a continued rollover in new cases of COVID-19, and a revival of support among his base would improve his odds of winning. Former Vice President Joe Biden is not polling much better against Trump than former Secretary of State Hillary Clinton did back in 2016 (Chart 11). Biden’s momentum in national opinion polling has been arrested, especially in battleground states, and the lower end of the “band of uncertainty” around the polling also suggests that Trump is within striking distance (Chart 12). Chart 11Biden Polling About Same As Hillary Versus Trump
Trade War Sans Stimulus Is Unsustainable
Trade War Sans Stimulus Is Unsustainable
Chart 12Trump Still Within Striking Distance Of Biden
Trade War Sans Stimulus Is Unsustainable
Trade War Sans Stimulus Is Unsustainable
Our election model suggests that Trump has a 42% chance of winning, which is higher than our subjective 35% (Chart 13). We will upgrade if a stimulus bill is agreed. A Trump comeback may be received well by US equity markets – as it prevents tax hikes, re-regulation, higher minimum wages, and a federal push to revive labor unions, all promoted by Biden and the Democrats. But then again, Biden’s agenda is more reflationary, whereas Trump faces obstacles in a still-Democratic House, leaving global trade as the path of least resistance – which is market-negative. The dollar may bounce on the prospect of a Trump second term (Chart 14). Tech stocks, Chinese currency, and other cyclicals, such as the euro and European stocks, will suffer a setback if Trump is reelected. Chart 13We Give Trump 35% Odds, Quant Model Shows Upside At 42%
Trade War Sans Stimulus Is Unsustainable
Trade War Sans Stimulus Is Unsustainable
Lesser risks, still notable, include Iran and Russia. Chart 14Trump Could Trigger Near-Term Dollar Bounce
Trump Could Trigger Near-Term Dollar Bounce
Trump Could Trigger Near-Term Dollar Bounce
We have maintained that the US and Iran are in a bull market of geopolitical tensions and that this could result in crisis around the election. The US’s decision on August 20 unilaterally to maintain the expiring international conventional arms embargo on Iran is a clear trigger for a military incident. The macro and market implications are different and less dire than with a US-China crisis. But oil price volatility would rise due to regional instability, President Trump’s reelection bid could benefit, and that would carry the implication of expanding trade war with China. Meanwhile our expectation of sharply rising Russian geopolitical risk is materializing both within Russia and in relations with Europe, which is preparing sanctions over the suppression of dissent within both Russia and its satellite state Belarus. Russia is capable of interfering in the US election while a Democratic victory would likely lead to a US policy offensive against Russia. Investors must look beyond the short term. If stimulus is passed, the stock market will go up, but the US and China will be further enabled and ultimately their strategic showdown will cap the gains by harming the tech sector. Meanwhile, if the stimulus fails, then the market will plunge. Investment Takeaways At present the stock market seems prepared for Trump to remain in the White House – or for Republicans to retain the Senate. The market’s YTD profile matches that of past elections that result in gridlock, as opposed to the Democratic “clean sweep” scenario that we have flagged as the likeliest outcome (Chart 15). However, this profile will change, the market will correct, if Trump does not sign a new relief act. Assuming stimulus ultimately passes, markets will cheer and Trump’s comeback in the polls will get a boost. He could still lose the election, given fundamental political and economic weaknesses captured in our state-by-state quantitative model above. But the election itself would be more closely fought – with a contested outcome more likely to occur and roil markets. Finally a Trump victory would give a new mandate to the US-China breakdown and the revolution in the global trading system, which is ultimately negative for risk assets and the cyclical recovery. Hence our confidence that the next few months will be marked by volatility. Ultimately geopolitical and macro fundamentals are negative for the dollar even if Trump provides the occasion for a last gasp in the past decade’s dollar bull market. The US is monetizing its debt and flooding the world with dollar liquidity. Meanwhile China and other powers are diversifying away from the dollar and into gold, the euro, the yen, and other reserve currencies over the long run (Chart 16). Chart 15Dollar Outlook Bearish In Medium Term
Dollar Outlook Bearish In Medium Term
Dollar Outlook Bearish In Medium Term
Chart 16Stock Market Preparing For Trump Win And More Gridlock?
Stock Market Preparing For Trump Win And More Gridlock?
Stock Market Preparing For Trump Win And More Gridlock?
The great US fiscal debate is over, regardless of Trump or Biden, as populism has made austerity impracticable and massive twin deficits will ensue. Thus we remain long gold and the Japanese yen. We have refrained from re-initiating our long EUR-USD trade given our expectation of stimulus hiccups and US-China tensions, but will reconsider if and when these hurdles are cleared. Our strategic portfolio continues to expect a global recovery over the next twelve months and beyond but tactically we are positioned against downside risks. Matt Gertken Vice President Geopolitical Strategy mattg@bcaresearch.com
Highlights The strength in global semiconductor sales in recent months has been due to one-off factors stemming from pandemic-related lockdowns. As the one-off demand surge subsides, global semiconductor sales will decline modestly toward the end of this year. In the near term, global semiconductor stock prices are vulnerable due to overbought conditions, excessive valuations and demand disappointment. The global semiconductor industry is at the epicenter of the US-China confrontation, and more US restrictions on chips sales to China are probable. This is another risk for this sector's share prices. Nevertheless, the structural outlook for global semiconductor demand is constructive. Its CAGR may rise from 3% during 2014-2019 to 5% during 2020-2024. Feature Investor euphoria has taken hold of semiconductor stocks. Global semiconductor stock prices have skyrocketed by 68% from March lows and 96% from December 2018 lows. Meanwhile, global semiconductor sales during March-June rose only by 5% from a year ago. As a result, the ratio of market cap for global semiconductor stocks relative to global semiconductor sales has reached its highest level since at least the inception of data in 2003 (Chart 1). Chart 1Global Semiconductor Sector: Market Cap-To-Sales Ratio Has Surged
Global Semiconductor Sector: Market Cap-To-Sales Ratio Has Surged
Global Semiconductor Sector: Market Cap-To-Sales Ratio Has Surged
With semi equity multiples very elevated, their share prices have become even more sensitive to global semiconductor demand growth. Hence, the focus of this report is to try to gauge the strength of global semiconductor demand, both in the near term and structurally. Near-term semiconductor stock prices could disappoint due to weak chip demand from the smartphone sector and diminishing purchases of personal computers (PCs) and servers. However, structurally, we are positive on global semiconductor demand, which is underpinned by the continuing rollout of 5G networks and phones, a wider adoption of data centers, and further technological advancements in artificial intelligence (AI), cloud computing, edge computing and smaller nodes for chip manufacturing (Box 1). Box 1 Key Technologies Underpinning Potential Global Semiconductor Demand AI refers to the simulation of human intelligence in machines, for example, computers that play chess and self-driving cars. The goals of AI include learning, reasoning and perception. Cloud computing is the delivery of computing services – including servers, storage, databases, networking, software, analytics and intelligence – over the Internet (“the cloud”) to offer faster innovation, flexible resources and economies of scale. Edge computing is a form of distributed computing, which brings computation and data storage closer to where it is needed, to improve response times and save bandwidth. Technology node refers to the width of line that can be processed with a minimum width in the semiconductor manufacturing industry, such as technology nodes of 10 nanometers (nm), 7nm, 5nm and 3nm. The smaller the nodes are, the more advanced they are. Near-Term Headwinds Chart 2World Semiconductor Sales Diverged From The Global Business Cycle
World Semiconductor Sales Diverged From The Global Business Cycle
World Semiconductor Sales Diverged From The Global Business Cycle
Semiconductor demand worldwide grew by 6% year-on-year in the first half of this year. There has been a remarkable divergence between world semiconductor sales and the global business cycle (Chart 2). The divergence between semiconductor sales and economic activity was most striking in the US and China. Semiconductor sales in China rose by 5% year-on-year in Q12020, and in the US they grew by 29% year-on-year in Q22020, despite a contraction in their aggregate demand during the same period. By contrast, Q2 annual growth of semiconductors sales was -2.2% for Japan, -17% for Europe and 1.8% for Asia ex. China and Japan (Chart 3). The reasons why the US and China posted a surge in semiconductor demand while Europe and Japan experienced a contraction in domestic semiconductor sales are as follows: Most data center investment is occurring in the US and China. Chart 4 shows that 40% of global hyperscale data centers are operating in the US, much larger than any other countries/regions. China, in turn, ranked second, with a global share of 8%. Chart 3Strong Semiconductor Sales In The US And China, But Not Elsewhere
Strong Semiconductor Sales In The US And China, But Not Elsewhere
Strong Semiconductor Sales In The US And China, But Not Elsewhere
Chart 4The US Has The Most Global Hyperscale Data Centers
Global Semiconductor Stocks: A Hiatus Is Overdue In A Structural Bull Market
Global Semiconductor Stocks: A Hiatus Is Overdue In A Structural Bull Market
Demand contraction in Europe and Japan is due to semiconductor demand in these regions mainly originating from the automobile sector, where production was severely hit by the global pandemic. About 37% of European semiconductor sales were from last year’s automotive market. We believe the divergence between global economic activity and semiconductor sales, as demonstrated by Chart 2 on page 3, has been due to one-off factors, as the global pandemic lockdowns have spurred semiconductor demand. Such a one-off demand boost will likely dissipate in the coming months. Traditional PCs and tablets: There has been a surge in demand for traditional PCs1 and tablets in the past six months. This was due to the significant increase in online activities, such as working from home, education, e-commerce, gaming and entertainment. Data from the International Data Corporation (IDC) has revealed that shipments of traditional PCs and tablets in volume terms had a strong year-on-year growth of 11.2% and 18.6%, respectively, in the period of April-June (Chart 5). Looking forward, even renewed lockdowns will not lead to a similar rush to buy these products. Many households are already equipped to work from home and for other online activities. With many countries gradually opening their economies, such demand will diminish. The traditional PC and tablet sectors together account for about 13% of global chip demand (Chart 6). Chart 5Personal Computers Sales Have Surged Amid Lockdowns
Personal Computers Sales Have Surged Amid Lockdowns
Personal Computers Sales Have Surged Amid Lockdowns
Chart 6The Breakdown Of Global Semiconductor Sales By Type Of Usage
Global Semiconductor Stocks: A Hiatus Is Overdue In A Structural Bull Market
Global Semiconductor Stocks: A Hiatus Is Overdue In A Structural Bull Market
Chart 7Server Sales Have Surged Amid Lockdowns
Server Sales Have Surged Amid Lockdowns
Server Sales Have Surged Amid Lockdowns
Server demand: Another major semiconductor demand contribution in Q2020 was from the server sector, which spiked by 21% year-on-year (Chart 7). The surge in online activities triggered a strong demand for cloud services and remote work applications, both of which require computer servers to run on. However, demand from the server sector is also set to diminish in 2H2020 and Q1 2021. Provided the inventories at major data center operators, including Microsoft, Google and Amazon, remain at high levels,2 global cloud service providers will likely reduce their orders of servers next quarter.3 Enterprises will also likely cut their investment in computer servers in 2H2020, as many of them had already increased their purchases of servers to prepare employees and business processes for remote working. We expect global server demand growth to soften in 2H2020. The Digitimes Research forecasted a 5.6% quarter-on-quarter contraction in 3Q2020 and a further cut in global sever shipment in the 4Q2020.2 The global server sector accounts for about 10% of global chip demand and, together with PCs and tablets, they make for 23% (please refer to Chart 6 on page 5). Further, the smartphone sector – accounting for 27% of global semiconductor demand – will continue struggling in H2 this year. The global total smartphone demand has been hit severely, as households delayed their new smartphone purchases. According to Canalys’ data, global smartphone shipments dropped by 13% and 14% year-on-year in Q1 and Q2, respectively. The strength in global semiconductor sales in recent months has been due to one-off factors stemming from the lockdowns. Chart 8Global Smartphone Shipments Will Likely Remain Weak In 2020H2
Global Smartphone Shipments Will Likely Remain Weak In 2020H2
Global Smartphone Shipments Will Likely Remain Weak In 2020H2
We expect smartphone shipments to continue contracting over the next three-to-six months (Chart 8). We believe global consumers will remain cautious in their spending on discretionary goods, such as smartphones, due to lowered incomes and increased job uncertainty. The IDC also forecasted that global smartphone shipments would not grow until 1Q2021.4 The Chinese smartphone sales showed a considerable weakness in July, with a 35% year-on-year contraction, which is much deeper than the 20% decline in H1 this year. 5G smartphone shipments also slowed last month, with a 21% drop from the previous month. Bottom Line: The strength in global semiconductor sales in recent months has been due to one-off factors stemming from the lockdowns. As this one-off demand subsides, global semiconductor sales will decline modestly toward the end of this year. Given the overbought conditions and the elevated equity valuations, global semiconductor stocks are currently vulnerable to near-term disappointments in semiconductor demand. At The Epicenter Of The US-China Rivalry Semiconductors are at the epicenter of the US-China confrontation. Ultimately, the US-China contention is about future technological dominance. That is access to technology and the capability to develop new technologies. The global semiconductor industry is at the epicenter of the US-China confrontation. China currently accounts for about 35% of the global semiconductor demand. US restrictions on semi producers worldwide to supply semiconductors to Chinese buyers constitute a major risk to semiconductor stock prices. On August 17, the US announced fresh sanctions that restrict all US and foreign semiconductor companies from selling chips developed or produced using US software or technology to Huawei, without first obtaining a license. In May, the US had already limited companies, such as the Taiwan Semiconductor Manufacturing Company (TSMC), from making and supplying Huawei with its self-designed chips. In addition, the US recently threatened bans on Chinese-owned apps TikTok and WeChat, and signaled that it could soon restrict Alibaba’s operations in the US. Chart 9Global Semi Companies' Sales To China Are Substantial
Global Semiconductor Stocks: A Hiatus Is Overdue In A Structural Bull Market
Global Semiconductor Stocks: A Hiatus Is Overdue In A Structural Bull Market
The global semiconductor sector is highly vulnerable to further escalation in the tension between these two superpowers. Major global semiconductor companies’ sales are heavily exposed to China, and their revenue from China ranges from 16% to 50% of total (Chart 9). We have been puzzled why global semi share prices have been rallying in spite of US limitations on semiconductor shipments to Huawei and its affiliated entities. One explanation could be that the Chinese companies that are not affiliated with Huawei are able to import semiconductors and then supply them to Huawei. If this is true, the US will have no other choice but to limit all semiconductor sales to China. This will be devastating for global semi producers given their large exposure to China. In anticipation of US punitive policies limiting its access to semiconductors, China had boosted its semiconductor imports over the past 12 months (Chart 10, top panel). Chinese imports of integrated circuits rose by 12% year-on-year in 1H2020, which is much higher than the 5% year-on-year increase in Chinese semiconductor demand during the same period (Chart 10, bottom panel). This gap suggests the country had restocked its semiconductor inventories. China has particularly restocked its imports of non-memory chips with imports of processor & controller and other non-memory chips in H1, surging by 30% and 20%, respectively, in US dollar terms (Chart 11). For memory chips, the contraction in Chinese imports was mainly due to a decline in global memory chip prices. Chart 10China Had Likely Restocked Its Semi Inventories
China Had Likely Restocked Its Semi Inventories
China Had Likely Restocked Its Semi Inventories
Chart 11Strong Chinese Imports In Non-Memory Chips
Strong Chinese Imports In Non-Memory Chips
Strong Chinese Imports In Non-Memory Chips
Bottom Line: The global semiconductor industry is at the epicenter of the US-China confrontation, and more restrictions on sales to China are probable. In turn, the restocked semiconductor inventory in China raises the odds of weakening mainland semiconductor import demand in H2 of this year. Structural Tailwinds Table 1Global Semiconductor Demand CAGR Forecast Over 2020-2024 By Device
Global Semiconductor Stocks: A Hiatus Is Overdue In A Structural Bull Market
Global Semiconductor Stocks: A Hiatus Is Overdue In A Structural Bull Market
We are optimistic on structural global semiconductor demand. Its nominal CAGR may rise from 3% during 2014-2019 to 5% during 2020-2024 in US dollar terms. Table 1 shows our demand growth forecasts for global chips in the main consuming sectors over the next five years. The major contributing sectors during 2020-2024 will be 5G smartphones, servers, industrials, electronics and automotive manufacturing. The underlying driving forces are the continuing rollout of 5G networks and phones, the development of data centers, and further technological advancements in AI, cloud computing and edge computing. Currently, the world is still in the early stages of 5G network development. AI, cloud computing and edge computing are constantly evolving. With increasing adoption of 5G smartphones, computer servers and IoT devices, global semiconductor demand is in a structural uptrend (Box 2). Box 2 Key Components For The Virtual World In Development Data centers and cloud computing allow data to be stored and applications to be running off-premises and to be accessed remotely through the internet. Edge computing allows data from Internet of things (IoT) devices to be analyzed at the edge of the network before being sent to a data center or cloud. IoT devices contain sensors and mini-computer processors that act on the data collected by the sensors via machine learning. The IoT is a growing system of billions of devices — or things — worldwide that connect to the internet and to each other through wireless networks. AI technology empowers cloud computing, edge computing and IoT devices. 5G is at the heart of the IoT industry transformation, making a world of everything connected possible. 5G Smartphone Currently, China is the world’s largest 5G-smartphone consumer and the leading 5G-adopter in the world. According to Digitimes Research, global 5G smartphone shipments will reach over 250 million units in 2020, with 170 million (68%) in China and only 80 million units in the world ex. China. Looking forward, 5G smartphone shipments are set to accelerate worldwide over the coming years. Chart 125G Phone Shipments In China Will Continue To Rise
5G Phone Shipments In China Will Continue To Rise
5G Phone Shipments In China Will Continue To Rise
The 5G phone shipments in China will continue to rise. The 5G phone sales penetration rate in China is likely to rise from 60% in July to 95% by the end of 2022. In such a case, we estimate that the monthly Chinese 5G phone shipments will increase from the current 16 million units to about 25-30 million units in 2022 (Chart 12). In the rest of the world, the 5G smartphone adoption pace will also likely speed up over the next five years. The 5G phone selling prices in the world outside China will drop, as more models are introduced and become more affordable. 5G smartphone prices have already fallen in China and will inevitably fall elsewhere. Chinese 5G smartphone producers will ship their low-priced 5G phones overseas, putting pressure on other producers to lower their prices. The 5G infrastructure development is accelerating in China and will accelerate in the rest of the world. Both China and South Korea have been very aggressive in their respective 5G network development. As of the end of June, China's top three carriers: China Mobile, China Unicom, and China Telecom – which together serve more than 1.6 billion mobile users in the country – had installed 400,000 5G base stations against an annual target of 500,000. In comparison, as of April 2020, American carriers had only put up about 10,000 5G base stations.5 As the US is competing with China on the 5G front, the country will likely boost its investment in 5G network development aggressively over the next five years in order to catch up to, or even exceed, China. Importantly, the 5G smartphone has more silicon content than 4G smartphones. More silicon content means higher semiconductor value. Rising 5G smartphone sales and higher silicon content together will more than offset the loss in semiconductor sales due to falling global 4G smartphone shipments. Based on our analysis, we expect a CAGR growth of 4% in semiconductor demand from the global smartphone sector over the next five years, slightly lower than the 5% in previous five years (Table 1 on page 10). This also takes into consideration that the 5G network will be more difficult and more expensive to develop than the 4G network. Servers Global server shipment growth will be highly dependent on both the pace and the scale of data center development (Box 3). Data centers account for over 60% of global server demand. The future growth of data centers is promising. The global trend of data localization6 due to the concerns of data privacy and national security will also bolster a boom of data centers over the next five years. A growing number of countries are adopting data localization requirements, such as China, Russia, Indonesia, Nigeria, Vietnam and some EU countries. While the Chinese data center market is expected to expand by a CAGR of about 28% over 2020-2022,7 a report recently released by Technavio forecasted the global data center industry’s CAGR at over 17% during 2019-2023. We forecast that the global semiconductor demand from servers will grow at a CAGR of 12% over 2020-2024. Box 3 Data Centers There are four main types of data centers – enterprise data centers, managed services data centers, colocation data centers, and cloud data centers. Data centers can have a wide range of number of servers. Corporate data centers tend to have either 200 (small companies), or 1000 servers (large companies). In comparison, a hyperscale data center usually has a minimum of 5,000 servers linked with an ultra-high speed, high fiber count network. Outsourcing and a move towards the cloud are driving the growth of the hyperscale data center. Instead of companies investing in physical hardware, they can rent server space from a cloud provider to both save their data and reduce costs. Amazon, Microsoft, Google, Apple and Alibaba are all top global cloud service providers. The more hyperscales to be built up, the higher the demand for servers. In 2019, about 13% of the total number of data centers in China were of the hyperscale and large-scale varieties. The plan of new infrastructure development announced earlier this year by Beijing was aiming to increase the number of hyperscale and large-scale data centers in China. Among current data centers either under construction or to be developed in the near future, 36% of them are hyperscale and large-scale data centers. IoTs Technological advancements in AI, cloud computing and edge computing, in combination with 5G network development, will facilitate the IoTs adoption. According to the GSMA,8 46 operators in 24 markets had launched commercially available 5G networks by 30 January 2020. It forecasted that global IoT connections will be increased from 12 billion mobile devices in 2019 to 25 billion in 2025 with a CAGR at 13%.9 IoTs chips include the Artificial Intelligence of Things (AIoT) – a powerful convergence of AI and the IoT. IoTs is an interconnected network of physical devices. Every device in the IoT is capable of collecting and transferring data through the network. Looking forward, global demand of AI chips and IoT chips will have significant potential to grow with creation of “smarter manufacturing”, “smarter buildings”, “smarter cities”, etc. AI applications can be used in manufacturing processes to render them smarter and more automated. Productivity will be enhanced as machines achieve significantly improved uptime while also reducing labor costs. There are plenty of upsides in industrial semiconductor demand (Chart 13). We expect the CAGR of industrial electronics to increase from 3.4% during 2014-2019 to 8% during 2020-2024. AI applications can create smart buildings by increasing connectivity across enterprise assets, enabling home network infrastructure (e.g., routers and extenders) and employing home-security devices (e.g., cameras, alarms and locks). AI applications can be used to create smart cities. A smart city is an urban area that uses different types of IoT electronic sensors to collect data. Insights gained from that data are used to manage assets, resources and services efficiently; in return, that data is used improve operations across the city. China has already developed about 750 trial sites of smart cities with different degrees of smartness in the past decade. As AI and 5G technology advances, the existing smart cities’ “smartness” will be upgraded and new trial smart cities will be implemented. Based on IDC data, China’s investment in smart cities will rise at a CAGR of 13.5% over 2020-2023 (Chart 14). Globally, the U.S., Japan, European countries and other nations are also actively developing smart cities. According to a new study conducted by Grand View Research, the global smart cities market size is expected to grow at a CAGR of 24.7% from 2020 to 2027.10 Chart 13Plenty Of Upside In Industrial Semiconductor Demand
Plenty Of Upside In Industrial Semiconductor Demand
Plenty Of Upside In Industrial Semiconductor Demand
Chart 14China’s Investment In Smart Cities Will Continue To Grow
Global Semiconductor Stocks: A Hiatus Is Overdue In A Structural Bull Market
Global Semiconductor Stocks: A Hiatus Is Overdue In A Structural Bull Market
Automotive We expect the global automotive chip market to grow at a CAGR of 9% during 2020-2024, as in 2014-2019. The increase in consumption of semiconductors by the auto industry will continue to be driven by the market evolution toward autonomous, connected, electric and shared mobility. Most new vehicles now include some level of advanced driver assist systems (ADAS), such as adaptive cruise control, automatic brakes, blind spot monitoring, and parallel parking. The whole industry is progressing toward fully autonomous vehicles in the coming years. Increasing adoption of automotive chips and recovering car sales will revive automotive chip sales. In addition, rising penetration of new energy vehicles (NEVs) is beneficial to semiconductor sales, as NEVs contain higher semiconductor content than conventional vehicles. Conventional vehicles contain an average of a $330 value of semiconductor content while hybrid electric vehicles can contain up to $1,000 and $3,500 worth of semiconductors.11 Regarding other sectors, we are also positive on structural demand of storage and consumer electronics. AI applications generate vast volumes of data—about 80 exabytes per year, which is expected to increase by about tenfold to 845 exabytes by 2025.12 In addition, developers are now using more data in AI and deep learning (DL) training, which also increases storage requirements. With massive potential demand for storage, we estimate a CAGR of 7% over 2020-2024 (Table 1 on page 10). A recent report from ABI Research predicts that the COVID-19 pandemic will increase global sales of wearables (such as a Fitbit or Apple Watch) by 29% to 30 million shipments of the devices this year. With contribution from wearables, we expect global semiconductor demand from the consumer sector to grow at a CAGR of 3% over 2020-2024, the same rate as in the previous five years. Bottom Line: Continuing rollout of 5G networks and phones, development of data centers, and further technological advancements in AI and cloud computing will provide tailwinds to structural global semiconductor demand, accelerating its CAGR growth from 3% during 2014-2019 to 5% during 2020-2024. Valuations And Investment Conclusions Most global semiconductor stocks are currently over-hyped. Critically, both DRAM and NAND prices have been deflating since January, reflecting weak demand for memory chips. Yet, share prices of memory producers have rallied (Chart 15). Overall, global semiconductor stock prices have diverged from their sales and profits. Overall, global semiconductor stock prices have diverged from their sales and profits (Chart 16). Chart 15Falling Memory Prices Pose Risk To Memory Stocks
Falling Memory Prices Pose Risk To Memory Stocks
Falling Memory Prices Pose Risk To Memory Stocks
Chart 16Global Semiconductor Stocks Have Deviated From Profits
Global Semiconductor Stocks Have Deviated From Its Profits
Global Semiconductor Stocks Have Deviated From Its Profits
Consequently, the multiples of semiconductor stocks have spiked to multi-year highs (Chart 17). Even after adjusting for negative US real bond yields, valuations of semiconductor stocks are not cheap. Chart 18 illustrates the equity risk premium for global semiconductor stocks is at the lower end of its range of the past 10 years. The ERP is calculated as forward earnings yield minus 10-year US TIPS yields. It is impossible to time a correction or know what the trigger would be (US-China tensions have been our best guess). Nevertheless, we do not recommend chasing semiconductor stocks higher due to their overstretched technicals and valuations on the one hand and potential weakening demand in H2 on the other. Chart 17Global Semiconductor Stocks: Elevated Valuations
Global Semiconductor Stocks: Elevated Valuations
Global Semiconductor Stocks: Elevated Valuations
Chart 18Equity Risk Premium For Global Semi Stocks Is Historically Low
Equity Risk Premium For Global Semi Stocks Is Historically Low
Equity Risk Premium For Global Semi Stocks Is Historically Low
In addition, the ratio of global semi equipment stock prices relative to the semi equity index correlates with absolute share prices of global semi companies. This is because equipment producers are higher-beta as they outperform during growth accelerations and underperform during growth slumps. The basis is that semi manufacturers have to purchase equipment if there is actual strong demand coming up and vice versa. The recent underperformance by global semi equipment stocks relative to the semi equity index might be an early sign of a potential reversal in semi share prices in absolute terms (Chart 19). Chart 19A Signal Of A Potential Reversal In Semi Share Prices
A Signal Of A Potential Reversal In Semi Share Prices
A Signal Of A Potential Reversal In Semi Share Prices
Meanwhile, we believe the subsector- memory chip stocks - will outperform the overall semiconductor index amidst the potential correction, because they have lagged and are less over-extended. Finally, we remain neutral on Taiwanese and Korean bourses within the EM equity space for now. Escalation in US-China confrontation, as well as their exposure to semiconductors, put these bourses at near-term risk. That said, we are reluctant to underweight these markets because fundamentals in EM outside North Asia remain challenging. Ellen JingYuan He Associate Vice President ellenj@bcaresearch.com Footnotes 1Traditional PCs are comprised of desktops, notebooks, and workstations. 2Global server shipments to contract 5.6% sequentially in 3Q2020, says Digitimes Research 3Global server shipments forecast to increase by 5% this year: TrendForce 4IDC Expects Worldwide Smartphone Shipments to Plummet 11.9% in 2020 Fueled by Ongoing COVID-19 Challenges 5America does not want China to dominate 5G mobile networks 6“Data localization” can be defined as the act of storing data on a device that is physically located within the country where the data was created. Data localization requirements are governmental obligations that explicitly mandate local storage of personal information or strongly encourage local storage through data protection laws that erect stringent legal compliance obligations on cross-border data transfers. 7The big data center industry ushered in another outbreak 8The GSMA represents the interests of mobile operators worldwide, uniting more than 750 operators with almost 400 companies in the broader mobile ecosystem, including handset and device makers, software companies, equipment providers and internet companies, as well as organizations in adjacent industry sectors. 9GSMA: 5G Moves from Hype to Reality – but 4G Still King 10Smart Cities Market Size Worth $463.9 billion By 2027 11The Automotive Semiconductor Market – Key Determinants of U.S. Firm Competitiveness 12AI is data Pac-Man. Winning requires a flashy new storage strategy.
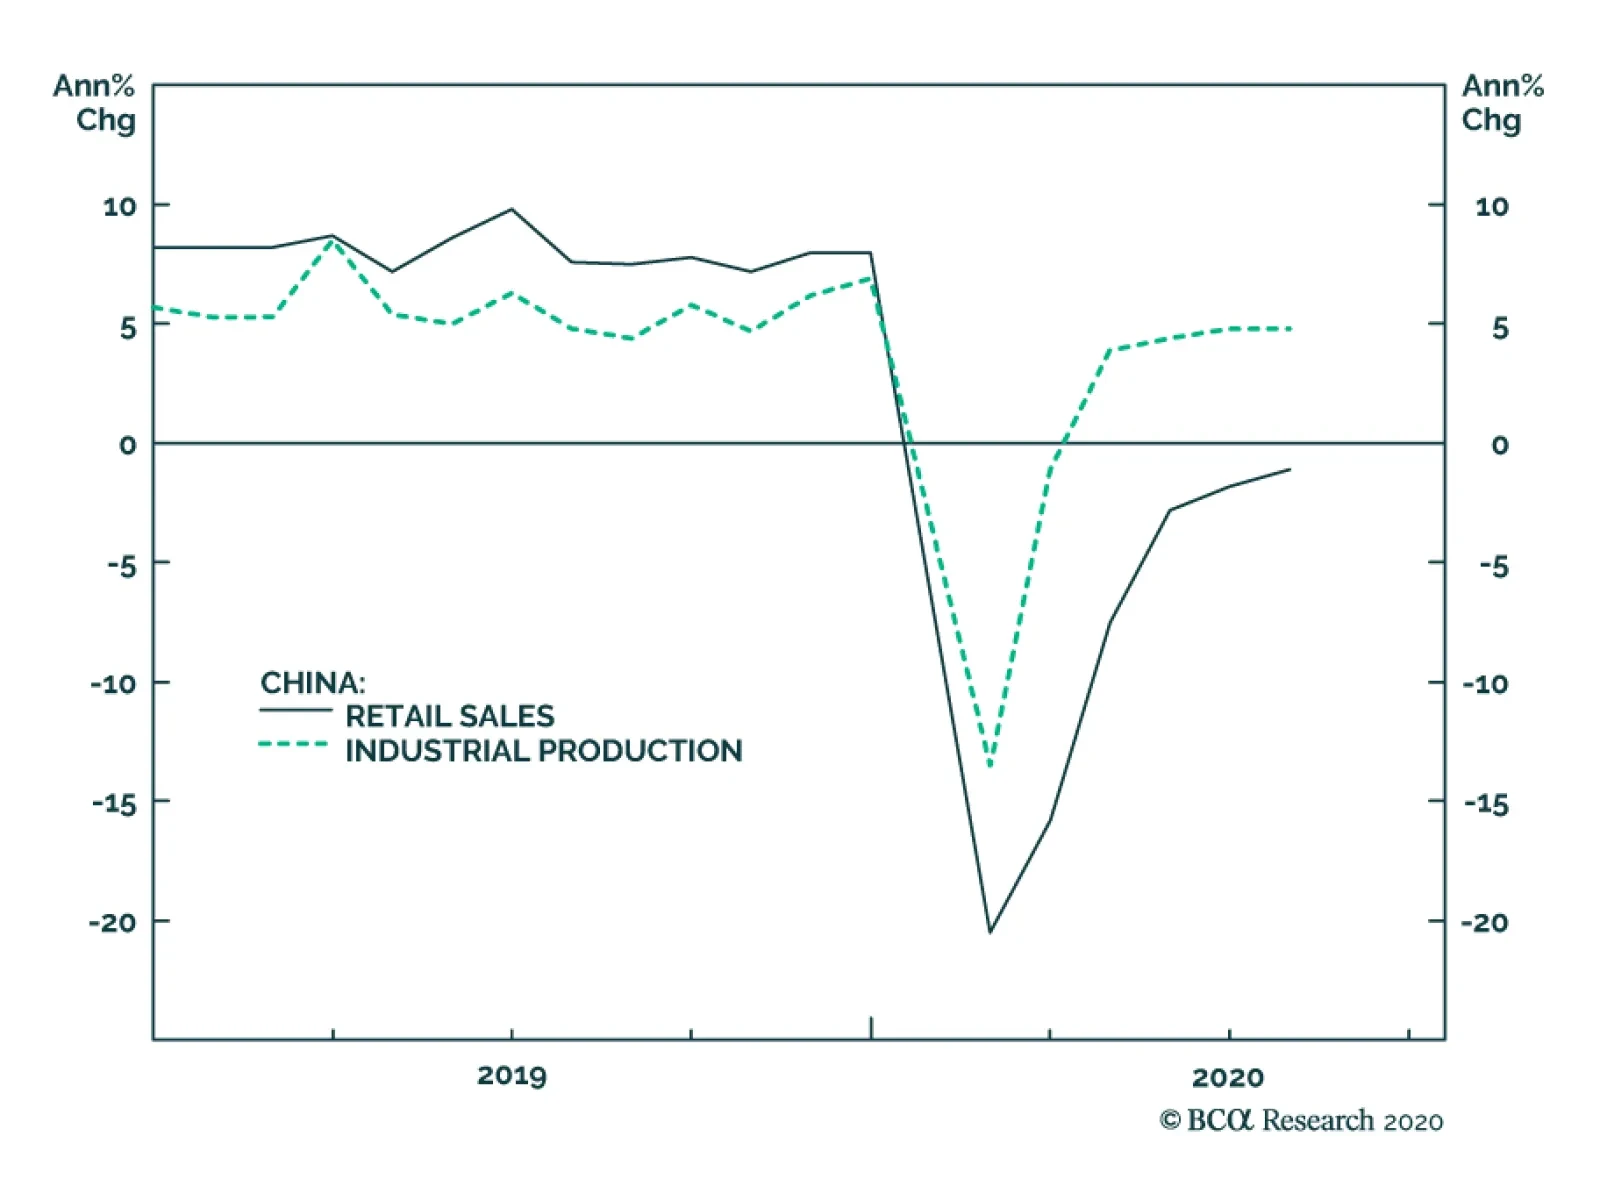
Chinese investment and retail sales data surprised slightly on the downside in July. Retail sales, for example, fell by 1.1% year-on-year, better than the 1.8% decline in June, but below the consensus expectation of +0.1%. The unemployment rate -– which the…
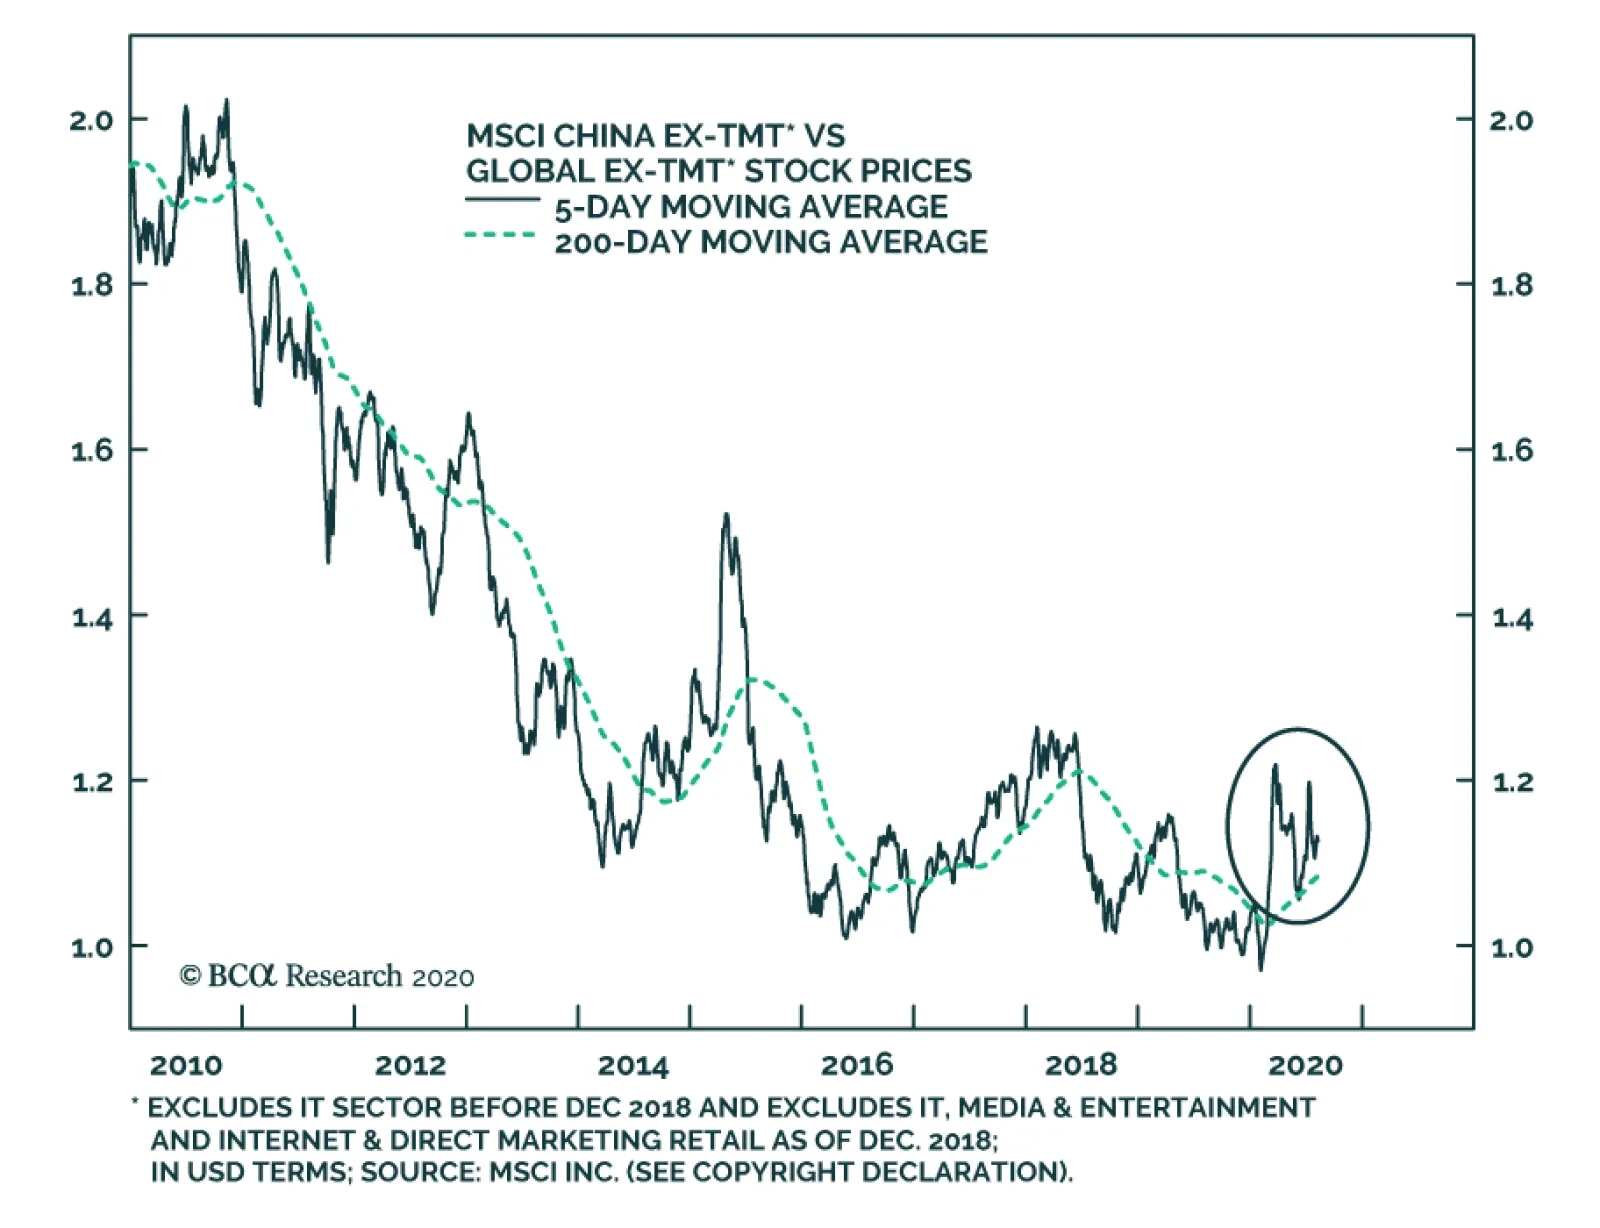
BCA Research's China Investment Strategy service is sticking to its strategic and cyclical overweight view on Chinese equities despite President Trump's opening a new front in the Sino-US tech war by banning China-based apps like TikTok. The impact on both…
Dear Client, In lieu of our regular report next week, we are sending you a Special Report from my colleague Chester Ntonifor, Foreign Exchange Strategist. Chester will share his outlook on the Hong Kong Dollar. I hope you will find his report insightful. Please note that next week’s report will be published on Friday, August 21. Best regards, Jing Sima, China Strategist Highlights President Trump's ban of China-based apps marks a new front in the Sino-US tech war. There is no change in our strategic views. The impact on both China’s aggregate economic growth outlook and the financial markets should be limited on a cyclical basis. Consider overweight Chinese offshore ex-TMT stocks and onshore semiconductor stocks within a global equity portfolio, against a backdrop of escalating hostilities in the tech sphere. Feature Chart 1Five Chinese Companies Are Mentioned In The New "Clean Network" Initiative
Five Chinese Companies Are Mentioned In The New "Clean Network" Initiative
Five Chinese Companies Are Mentioned In The New "Clean Network" Initiative
Geopolitical risks again stirred up volatility last week in China’s equity markets. President Trump issued two executive orders to take effect in 45 days, banning US transactions with the Chinese-owned social media apps TikTok and WeChat. Shares in Tencent, the China-based Internet giant that owns WeChat, have plummeted by 11% in China’s offshore market following the ban announcement (Chart 1). The event underscores that technology is at the root of a power struggle between the US and China. The struggle will likely be exploited by Trump as the US presidential election nears and Trump’s polling numbers lag. However, we remain constructive on Chinese stocks over the next 6 to 12 months. Although the latest development remains highly fluid, the tensions should not have a material impact on the cyclical outlook for China’s aggregate economy or financial markets. This will be the case as long as the situation does not degenerate into an outright tariff increase on Chinese export goods or other strategic actions with the potential to cause major economic damage. Given rising downside risks to Chinese tech company stocks in the near term, we recommend investors hold a neutral position on Chinese tech giant company equities versus their global peers. Instead, investors should overweight Chinese “old economy” stocks as well as sectors that are greatly benefited from policy support. We initiate two trades today: long MSCI China ex-TMT versus MSCI Global ex-TMT;1 and long domestic semiconductor stocks versus global semiconductor benchmark. A New Front In Tech War It is likely that the US will implement the ordered bans in some way. Banning TikTok wasn’t a surprise because the US had amply signaled its displeasure with the app in preceding months. The social media company has rapidly gained US market share and hence access to American users’ data. Its parent company ByteDance is based in Beijing and therefore subject to China’s cybersecurity laws, a major source of bilateral tensions. The company originated in a Chinese acquisition of an American company, another irritant for the Trump administration. The US is now pressuring TikTok’s US operations to sell the app to an American-based company such as Microsoft. Regarding Trump’s executive order on WeChat and Tencent, it is not clear what “transactions” with Tencent will be disallowed from the US market.2 Additionally, US officials later appeared to backpedal and limit the scope of the executive order on Tencent to only the WeChat app. We have a few preliminary observations on the evolving situation: It is unknown how far the executive action will go regarding Tencent. The Internet titan gets less than 5% of its revenues from outside China, according to its 2019 financial statement. However, Tencent has many prominent investments in the US gaming and music industries. The US Commerce Department has 45 days to interpret and enforce the directive. The vague language in the executive order provides the US with enough legal space to deprive Tencent of US technologies in those sectors, and would severely curtail Tencent’s online gaming business, which is its main engine of growth. The bans underscore the US administration’s intention to extend tech hostilities with China by denying Chinese tech companies the access to compete and expand globally. Last week, Secretary of State Mike Pompeo announced a five-pronged “Clean Network” initiative that would scrub Chinese companies from US telecommunications networks entirely.3 China, for its part, has been progressively banning US social media giants since 2009. China has not announced any retaliatory actions since the executive orders were issued. Top Chinese policymakers seem to have shifted gears from a tit-for-tat retaliation to a carefully calibrated diplomatic reaction that does not ramp up tensions further. Moreover, there is a sizeable contingent of top Chinese policymakers pushing for reconciliation with the US. We think that China’s senior leaders prefer to dial down the current conflict and take a wait-and-see approach until after the US presidential election in November. Nevertheless, the next two to three months will be unpredictable as the election nears and Trump’s polling numbers lag behind his rival Joe Biden. Bottom Line: China’s leading Internet and tech companies are embroiled in a US-China feud. Pressures will likely intensify with other tech companies potentially also targeted. For now, stay neutral on leading Chinese tech company stocks within a global equity portfolio. Stick With The Knowns Chinese tech company stock prices will likely be extremely volatile in the short run. Nevertheless, we are staying the course with our constructive cyclical view on overall Chinese stocks and we do not recommend any one-way bets on the market during the next two to three months. China’s financial markets have been shaken by negative surprises relating to frictions with the US. However, investors cheer on even the slightest easing of tensions between the two countries. Last Friday’s volatile trading was a good example: initial confusion over the ban’s scope in Trump’s order led to a more than 10% plunge in Tencent stock during morning trading in the Hong Kong market, but the losses were cut in half after the US indicated the ban only affected the WeChat app. Chart 2Chinese Tech Company Stocks Rallied Through Most Of The Trade War
Chinese Tech Company Stocks Rallied Through Most Of The Trade War
Chinese Tech Company Stocks Rallied Through Most Of The Trade War
Economic policy support from the Chinese government and “national team” can also distort the short-term price trend in tech equities. These stocks have risen by more than 20% in both the onshore and offshore markets since the beginning of 2018, despite the deteriorating US-China relationship (Chart 2). While we are neutral on tech company stocks, we recommend overweight Chinese “old economy” stocks and remain constructive on domestic sectors that are beneficiaries of government policy support. We are initiating two trades: long MSCI China ex-TMT versus MSCI Global ex-TMT; and long domestic semiconductor stocks versus global semiconductor benchmark. The reflationary efforts since early this year facilitated a strong rebound in China’s industrial sector activities and profits (Chart 3). In turn, China’s ex-tech "old economy" stocks have outperformed relative to their global peers. Even though the handful of tech titans account for roughly 35% of the investable market capitalizations, MSCI China stock prices excluding tech titans have decisively broken out of their 200-day moving average, which suggests there is still sufficient support to our constructive view on the overall investable index (Chart 4). Chart 3Investors Have Been Focusing On China's Stimulus And Economic Recovery
Investors Have Been Focusing On China's Stimulus And Economic Recovery
Investors Have Been Focusing On China's Stimulus And Economic Recovery
Chart 4Chinese "Old Economy" Stocks Have Prevailed Of Late
Chinese "Old Economy" Stocks Have Prevailed Of Late
Chinese "Old Economy" Stocks Have Prevailed Of Late
Our cyclical overweight view on China’s domestic stocks also remains unchanged. The domestic market is much more sensitive to the trend in monetary conditions, credit growth and economic cycles than the investable market. As we pointed out in last week’s report,4 monetary conditions are accommodative and credit and economic growth remain in an uptrend. This underscores that China’s domestic stocks have more upside potential than investable stocks, even in an escalating geopolitical risk environment. Chart 5Chinese Semis Are On Fire
Chinese Semis Are On Fire
Chinese Semis Are On Fire
Lastly, more pressure from the US and the West to curb the advancement of Chinese technology will only encourage the leadership to double down on supporting state-led technology programs. This argues for a more bullish view on Chinese tech companies that focus on the domestic market, at least on a cyclical basis (Chart 5). Last week the State Council updated its policy, supporting two strategically important sectors: integrated circuits and software. The central government has had policies in place to support these two sectors since 2000 and updates its support policies every decade or so. Last week's updated version will allow chip companies to enjoy even more tax exemptions and favorable financing than the first set of support policies. China has clearly stepped up its promotion of self-sufficiency and redoubled its efforts to thwart any pressures meant to restrain its technological progress. As pointed out by our Geopolitical Strategy team,5 the U.S. and its allies control 95% of the global semiconductor market (Chart 6). Nonetheless, China is the world’s largest importer, accounting for about one-third of global semiconductor sales, making it the largest consumer of semiconductors (Chart 7). Chart 6China’s Chip Makers Are Still Small Fry
Sticking With Chinese “Old Economy” Stocks In A Widening Tech War
Sticking With Chinese “Old Economy” Stocks In A Widening Tech War
Chart 7China Accounts For 60% Of Global Semiconductor Demand
Sticking With Chinese “Old Economy” Stocks In A Widening Tech War
Sticking With Chinese “Old Economy” Stocks In A Widening Tech War
Chart 8Made In China 2025 Targets
Sticking With Chinese “Old Economy” Stocks In A Widening Tech War
Sticking With Chinese “Old Economy” Stocks In A Widening Tech War
In brief, China relies a lot on imported semiconductors and is working to mitigate this dangerous vulnerability. The Made in China 2025 program estimates that China will produce 70% of its demand for integrated circuits by 2030 (Chart 8). Bottom Line: China’s domestic industrial sector will continue to recover in the next 6 to 12 months. The nation’s semiconductor industry will get a boost from recently shored-up government policy supports. Overweight these sectors in the face of expanding tensions from the US tech war against China. Jing Sima China Strategist jings@bcaresearch.com Footnotes 1TMT stocks include information technology prior to December 2018, and include media & entertainment and internet & direct marketing retail sectors after December 2018. 2Please see the orders: https://www.whitehouse.gov/presidential-actions/executive-order-addressing-threat-posed-tiktok/ and https://www.whitehouse.gov/presidential-actions/executive-order-addressing-threat-posed-wechat/ 3https://www.state.gov/announcing-the-expansion-of-the-clean-network-to-safeguard-americas-assets/ 4Please see China Investment Strategy Weekly Report "China Macro And Market Review," dated August 5, 2020, available at cis.bcaresearch.com 5Please see China Investment Strategy Special Report "U.S.-China: The Tech War And Reform Agenda," dated December 12, 2018, available at cis.bcaresearch.com Cyclical Investment Stance Equity Sector Recommendations
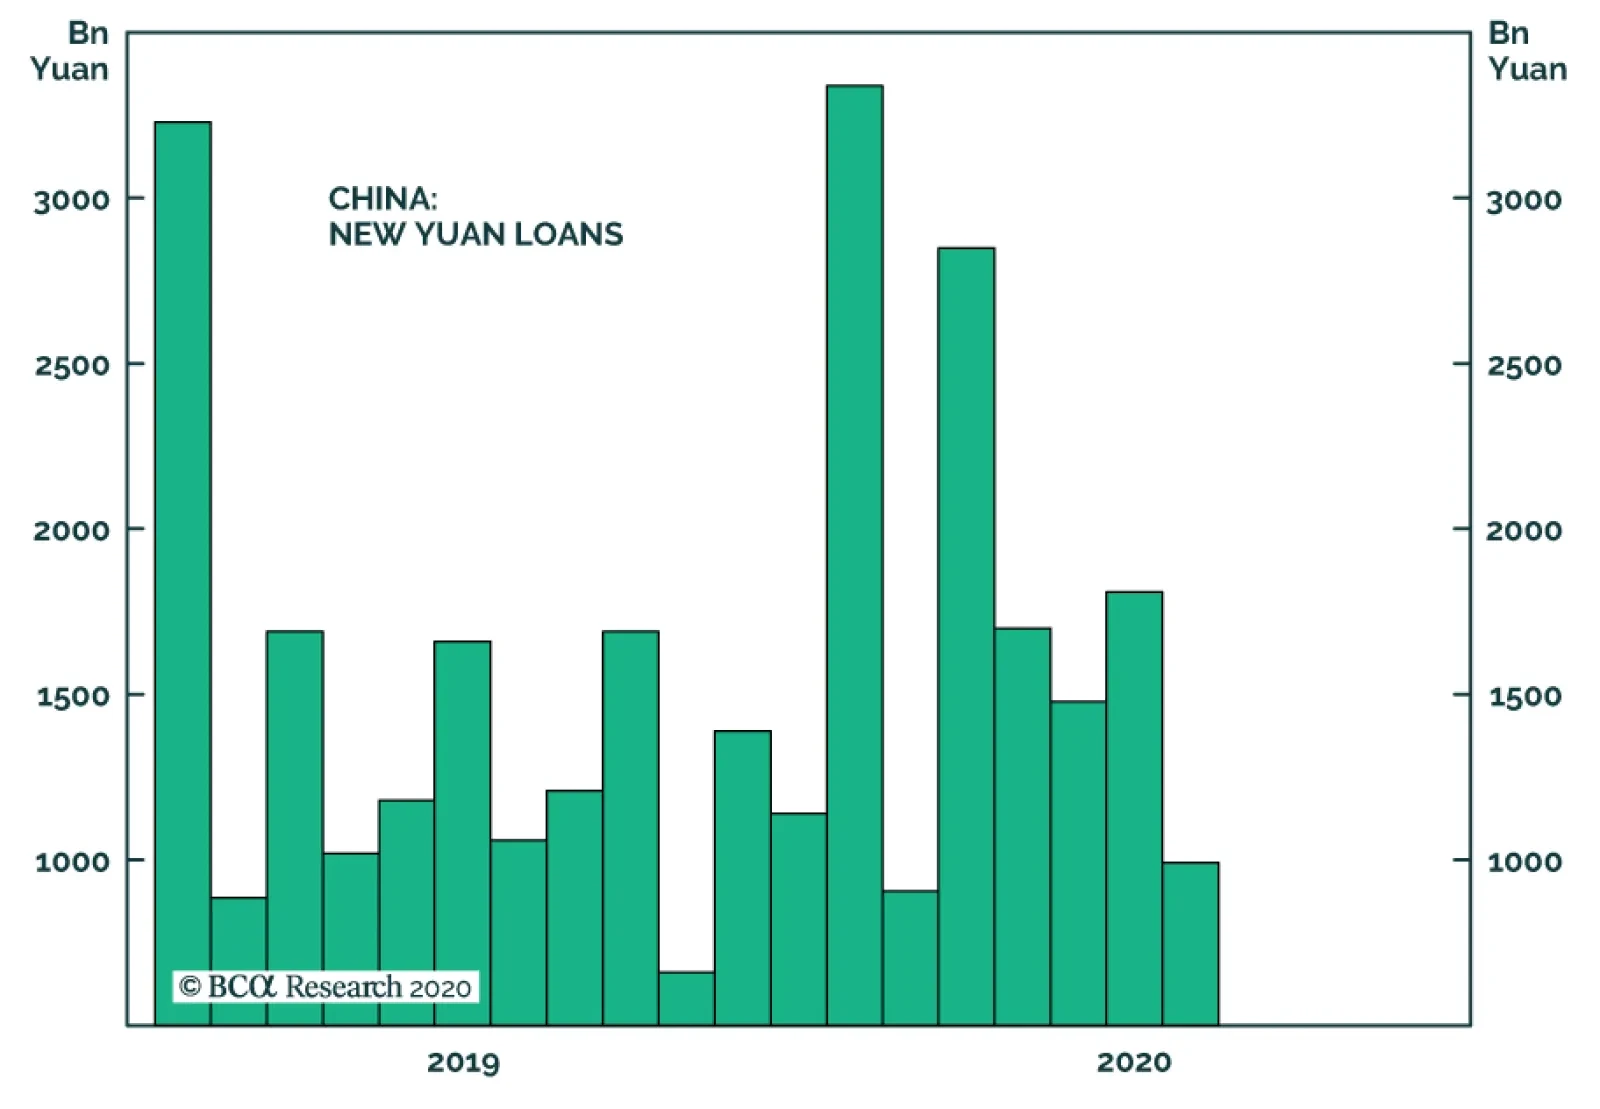
New Yuan loans in China came in at only CNY 992.7 billion in July, well below levels seen since policymakers opened the stimulus floodgates in March. However, it would be premature to suggest that this dip in lending signals a shift toward a more…
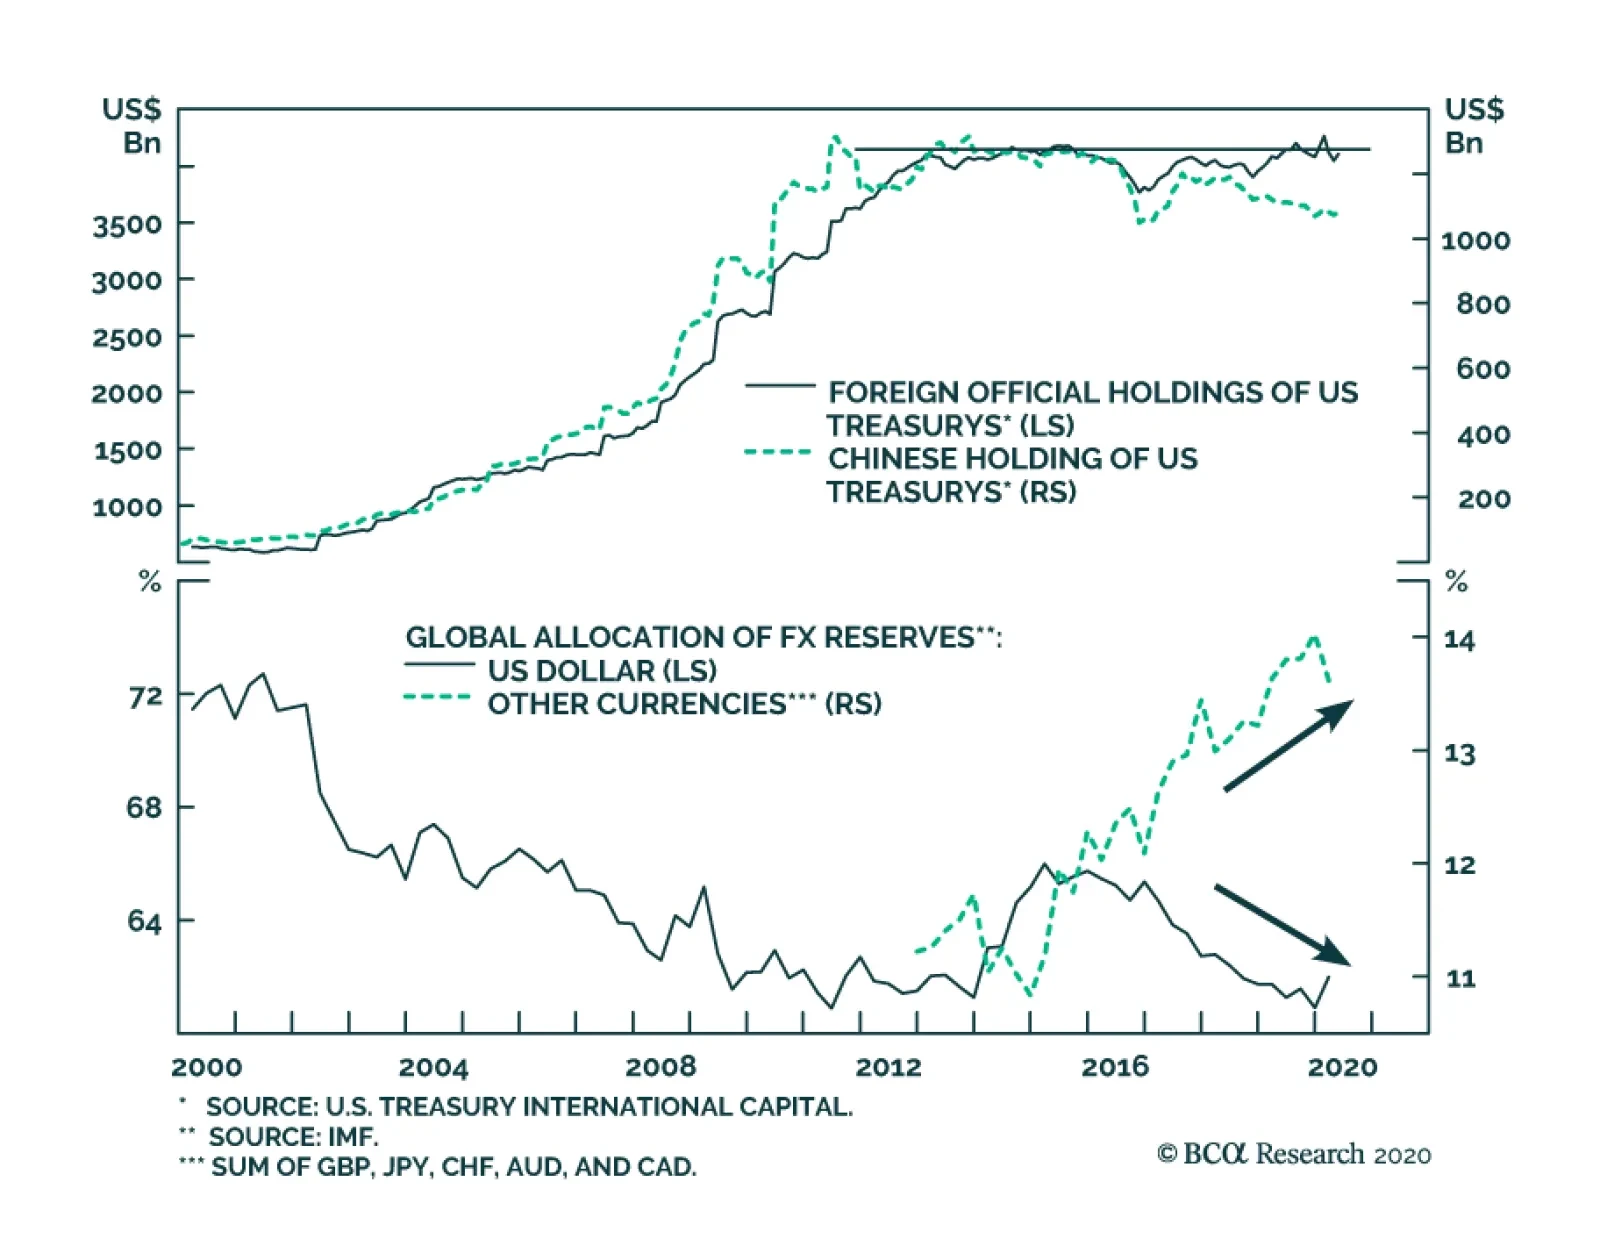
The biggest developments overnight Sunday were geopolitical. President Donald Trump signed an executive order to provide more relief to Americans. Then China fired a new salvo in the geopolitical war with the US. In a nutshell, both parties are aggressively…