China
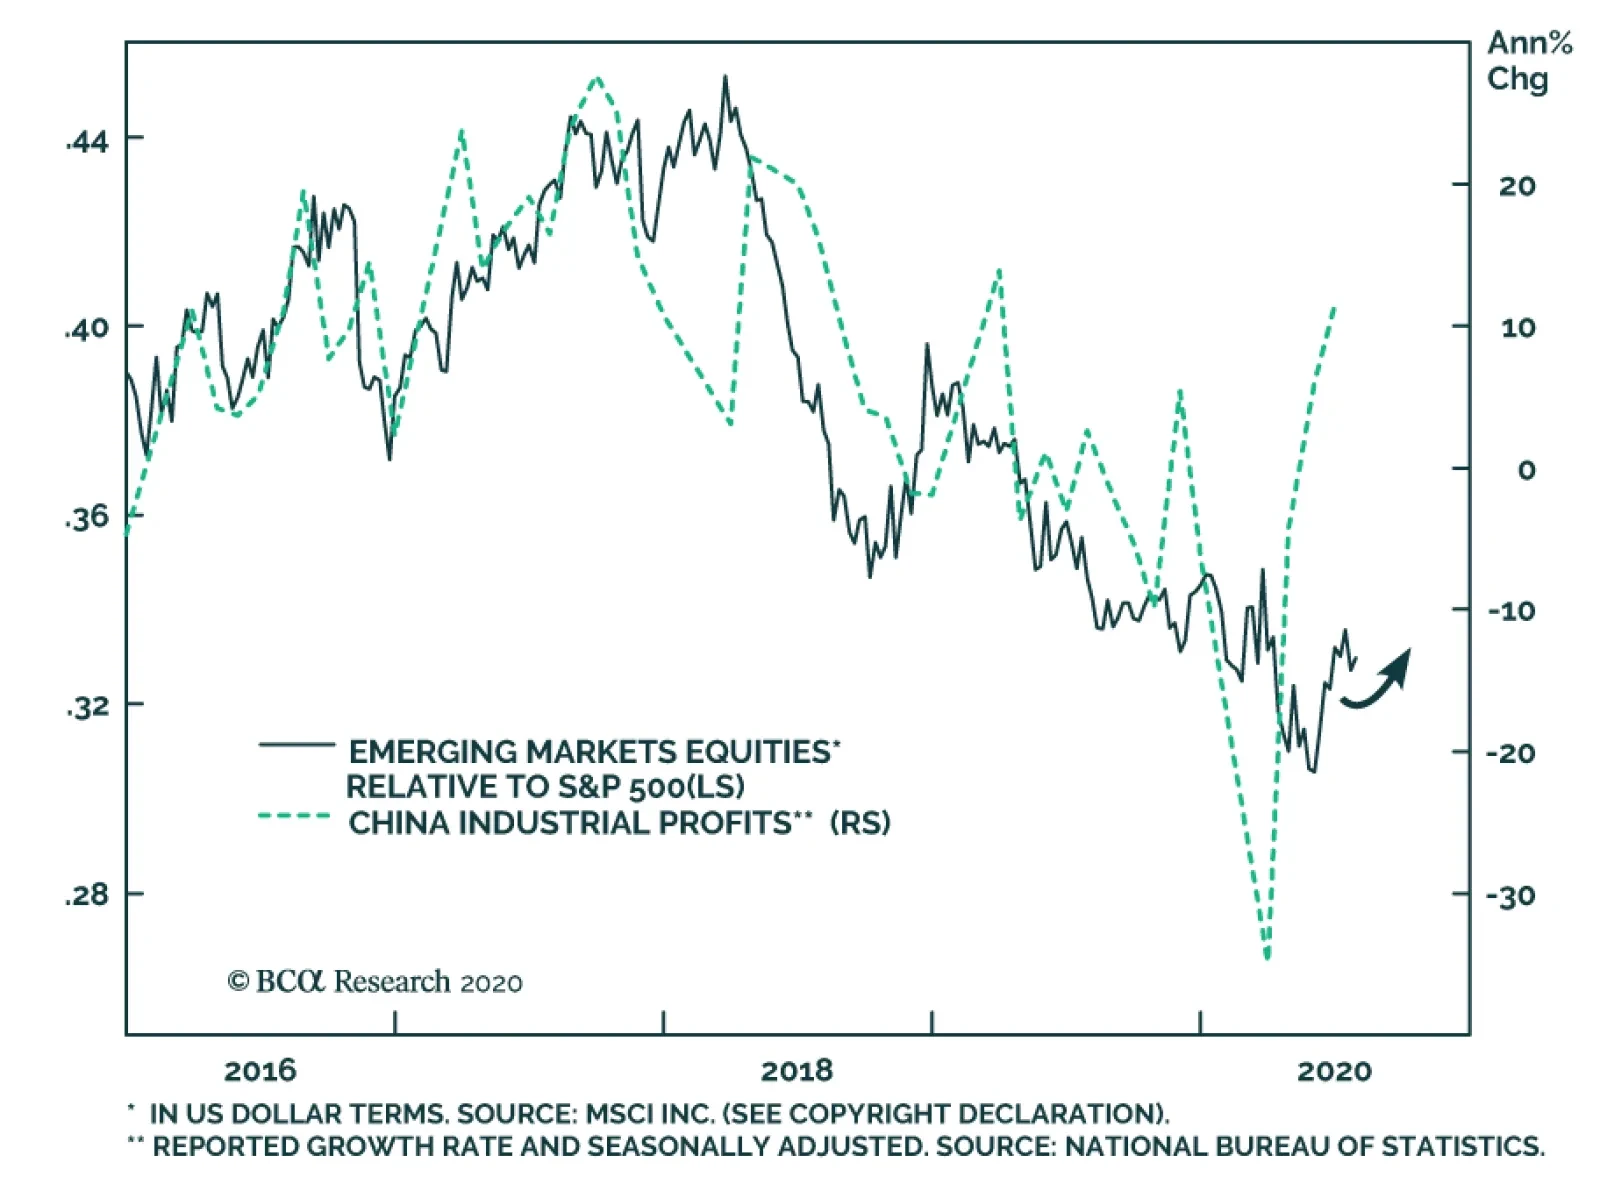
In June, China’s industrial profits growth continued to recover, rising from a 6% annual pace to an 11.5% one. For the past four and a half years, strengthening Chinese industrial profits growth aligns with an outperformance of EM equities relative to US…

Highlights The EU’s €750 billion fiscal package, along with another round of US stimulus likely exceeding $1 trillion, will support global oil demand. On the supply side, OPEC 2.0’s production discipline likely holds, and US shale output will remain depressed. These fundamentals, along with a weakening USD, will continue to support Brent prices, which are up 129% from their lows in April. China’s record-setting crude-oil-import surge during the COVID-19 pandemic – averaging 12.7mm b/d in 1H20, up 28.5% y/y – is at risk of slowing in 2H20, as domestic storage fills. Supply-side risks are acute: Massive OPEC 2.0 spare capacity – which could exceed 6mm b/d into 2021 – will tempt producers eager to monetize these to boost revenue. On the demand side, COVID-19 infection rates are surging in the US. Progress on vaccines notwithstanding, politically intolerable public-health risks in big consuming markets could usher in demand-crushing lockdowns again. Economic policy uncertainty remains elevated globally, but the balance of risks continues to favor the upside: We expect 2H20 Brent prices to average $44/bbl, and 2021 prices to average $65/bbl, unchanged from last month’s forecast. Feature We are marginally lifting our forecast of average 2020 Brent prices to $43/bbl, with 2H20 expected to average $44/bbl, and $65/bbl next year, unchanged from June. Marginal improvements to preliminary supply and demand estimates earlier in the COVID-19 pandemic support the thesis that fundamentals will not derail the massive oil-price rally that lifted Brent 129% from its April 21 low of $19.30/bbl. A weakening US dollar, and the expectation this trend will continue, also is supportive to commodities in general, oil in particular. As a result, we are marginally lifting our forecast of average 2020 Brent prices to $43/bbl, with 2H20 expected to average $44/bbl, and $65/bbl next year, unchanged from June (Chart of the Week). The three principal oil-market data providers – the US EIA, IEA and OPEC – raised demand estimates at the margin for 1H20, particularly for 2Q20, the nadir for global oil consumption. The EIA’s estimate for 2Q20 demand shows an upward revision of 550k b/d from last month’s estimate. On the supply side, the EIA estimates global output fell -8.1mm b/d in 2Q20, a -300k b/d downward revision vs. its estimate from last month (Chart 2). Chart of the WeekOil Price Rally Remains Intact
Oil Price Rally Remains Intact
Oil Price Rally Remains Intact
Chart 2OPEC 2.0, US Shale Production Cuts Deepen
OPEC 2.0, US Shale Production Cuts Deepen
OPEC 2.0, US Shale Production Cuts Deepen
We continue to expect the drawdown in storage levels to flatten – and then backwardate – the forward curves for Brent and WTI. After accounting for this better-than-expected fundamental performance, we now expect global supply to fall 5.9mm b/d in 2020 and to increase 4.2mm b/d in 2021. On the demand side, we now expect 2020 demand to fall 8.1mm b/d vs. 8.9mm b/d last month, and for 2021 demand to rise 7.8mm b/d vs 8.5mm b/d in June (Chart 3). This will keep the physical deficit we’ve been forecasting for 2H20 and 2021 in place, allowing OECD storage to fall to 3,026mm barrels by year-end and to 2,766mm barrels by the end of next year (Chart 4). Chart 3Supply-Demand Balances Tighten ...
Supply-Demand Balances Tighten ...
Supply-Demand Balances Tighten ...
Chart 4... Leading To Deeper Storage Draws ...
... Leading To Deeper Storage Draws ...
... Leading To Deeper Storage Draws ...
We continue to expect the drawdown in storage levels to flatten – and then backwardate – the forward curves for Brent and WTI (Chart 5). One caveat, though: We are watching floating storage levels closely, particularly in Asia: The current structure of the Brent forwards does not support carrying floating inventory, but it’s been slow moving lower (Chart 6). This could reflect a slowing in China’s crude-oil import surge, which hit record levels in May and June. Chart 5... And More Backwardation In Brent And WTI Forwards ...
... And More Backwardation In Brent And WTI Forwards ...
... And More Backwardation In Brent And WTI Forwards ...
Chart 6… Even As Floating Storage In Asia Remains Elevated
Balance Of Oil-Price Risk Remains To The Upside
Balance Of Oil-Price Risk Remains To The Upside
China’s Crude-Import Binge Ending? There is a non-trivial risk China’s crude-buying binge during the COVID-19 pandemic, which supported prices during the brief Saudi-Russian market-share war in March and the collapse in global demand in 2Q20, may have run its course (Chart 7).1 At the depths of the global pandemic in 2Q20, China’s year-on-year (y/y) crude imports surged 15%. According to Reuters, China’s crude oil imports totaled 12.9mm b/d in June, a record level for the second month in a row.2 Much of this was converted to refined products – chiefly gasoline and diesel fuel – as China’s demand recovered from the global pandemic (Chart 8). China’s 208 refineries can process 22.3mm b/d of crude, according to the Baker Institute at Rice University in Houston.3 Refinery runs in June were estimated at just over 14mm b/d by Reuters. Chart 7China's Crude Import Binge Stalls
China's Crude Import Binge Stalls
China's Crude Import Binge Stalls
Chart 8China's Refiners Lift Runs As Imports Surge
China's Refiners Lift Runs As Imports Surge
China's Refiners Lift Runs As Imports Surge
A reduction in China’s crude imports would force barrels to either remain on the water until refiners find a need for it, or demand for refined products increases in the region. China imports its oil into 59 port facilities, which can process ~ 16mm b/d. Storage is comprised of 74 crude oil facilities holding ~ 706mm barrels, and 213 refined-product facilities with capacity to hold ~ 357mm barrels of products (Map 1). By Reuters’s count, ~ 2mm b/d of crude went into storage in the January-May period, while close to 2.8mm b/d was stored in June. Official storage data is a state secret, so it is not possible to determine whether China’s crude and product storage is full. However, if crude oil imports remain subdued – and floating storage in Asia remains elevated – we would surmise the Chinese storage facilities are close to full. Additionally, any sharp and sustained increase in refined product exports would indicate storage is brimming. Map 1Baker Institute China Oil Map
Balance Of Oil-Price Risk Remains To The Upside
Balance Of Oil-Price Risk Remains To The Upside
A reduction in China’s crude imports would force barrels to either remain on the water until refiners find a need for it, or demand for refined products increases in the region. We expect the latter condition to obtain, in line with our expectation of a global recovery in demand, even though China remains out of sync with the rest of the world presently. China was the first state to confront the pandemic and first to emerge out of it; its trading partners still are in various stages of recovery (Chart 9). Chart 9China's Demand Recovery Likely Will Be Choppy
China's Demand Recovery Likely Will Be Choppy
China's Demand Recovery Likely Will Be Choppy
OPEC 2.0’s Remains Sensitive To Demand Fluctuations OPEC 2.0’s leaders – the Kingdom of Saudi Arabia (KSA) and Russia – also managed to secure additional “compensation” cuts from members that have missed their targets in previous months. The asynchronous recovery in global oil demand poses a unique problem for OPEC 2.0 this year and next. OPEC 2.0 will be easing production curtailments to 7.7mm b/d beginning in August from 9.6mm b/d in July, on the advice of its Joint Ministerial Monitoring Committee (JMMC). This is a decision that will be closely monitored, amid rising concern over the speed of demand recovery in the US and EM economies, due to mounting COVID-19 cases (Chart 10). The surge in US infections relative to its trading partners is of particular concern, given the size of US oil demand (Chart 11). In 2H20, we expect US demand will account for close to 20% of global demand, much the same level it was prior to the pandemic (Table 1). Chart 10COVID-19 Infections Surge In The US
Balance Of Oil-Price Risk Remains To The Upside
Balance Of Oil-Price Risk Remains To The Upside
Chart 11US COVID-19 Infections Are A Risk To Global Commodity Demand
Balance Of Oil-Price Risk Remains To The Upside
Balance Of Oil-Price Risk Remains To The Upside
Table 1BCA Global Oil Supply - Demand Balances (MMb/d, Base Case Balances)
Balance Of Oil-Price Risk Remains To The Upside
Balance Of Oil-Price Risk Remains To The Upside
OPEC 2.0’s leaders – the Kingdom of Saudi Arabia (KSA) and Russia – also managed to secure additional “compensation” cuts from members that have missed their targets in previous months, bringing the actual increase in production closer to 1-1.5mm b/d. Together, Iraq, Nigeria, Kazakhstan, and Angola, over-produced versus their May and June targets by ~ 760k b/d. In our balances estimates, as is our normal practice, we haircut these estimates and use a lower compliance level that those stated in the official OPEC 2.0 agreement. In the case of these producers, we assume they will compensate for ~ 70% of their overproduction, bringing the adjusted cuts to ~ 8.3mm b/d. This should be sufficient to maintain the current supply deficit in oil markets that continues to support Brent prices above $40/bbl. However, the reliance on laggards’ extra cuts to balance markets adds instability. There is a lot of supply on the sidelines from the OPEC 2.0 cuts and the restart of the Neutral Zone shared by Saudi Arabia and Kuwait. The JMMC is continually assessing supply-demand balances and remains focused on making sure the totality of the cuts does not fall on a small group of countries. It reiterated its position that “achieving 100% conformity from all participating Countries is not only fair, but vital for the ongoing rebalancing efforts and to help deliver long term oil market stability.” In June, OPEC 2.0’s overall compliance was 107% – mostly reflecting over-compliance from KSA, the UAE, and Kuwait.4 There is a lot of supply on the sidelines from the OPEC 2.0 cuts and the restart of the Neutral Zone shared by Saudi Arabia and Kuwait. The US EIA estimates that within the original OPEC cartel spare capacity will average close to 6mm b/d this year, the first time since 2002 that it has exceeded 5mm b/d. On top of this, there’s the looming downside risk of a new Iran deal if Democrats win the White House and Congress in US elections in November, and a possible restart of Libyan exports this year. Watch The DUCs In The US With WTI prices averaging $41/bbl so far in July, we continue to expect part of previously shut-in US production to come back on line in July, August and September. Nonetheless, the negative effect of the multi-year low rig count will be felt heavily in 4Q20 and 1Q21 and will push production lower. The rig count appears to be bottoming but is not expected to increase meaningfully until WTI prices move closer to $45-50/bbl. On average it takes somewhere between 9-12 months for the signal from higher prices to result in new oil production flowing to market in the US. As the rig count moves back up in 2021, its effect on production will be apparent only in late-2021. However, the massive inventory of drilled-but-uncompleted (DUC) wells in the main US tight-oil basins will provide a source of cheaper new supply, if WTI prices remain above $40/bbl. DUCs are 30-40% cheaper to complete compared to drilling a new well from start. We expect DUCs completion will begin adding to US crude output in 1Q21, and that this will continue to be a source of supply beyond 2021. Bottom line: Global economic policy uncertainty remains elevated, albeit off its recent highs (Chart 12). We expect this uncertainty to continue to wane, which will allow the USD to continue to weaken. This will spur global oil demand, and will augment the fiscal and monetary stimulus to the COVID-19 pandemic undertaken globally. Chart 12Global Policy Uncertainty Remains High, Which Could Support USD Demand
Balance Of Oil-Price Risk Remains To The Upside
Balance Of Oil-Price Risk Remains To The Upside
Nonetheless, the global recovery remains out of sync, which complicates OPEC 2.0’s production management, and markets’ estimation of supply-demand balances. Uneven success in combating the pandemic keeps the risk of lockdowns on the radar in the US. Policy is driving oil production at present, and, given the temptation to monetize spare capacity, the supply side remains a risk to prices. We continue to see upside risk dominating the evolution of prices and are maintaining our expectation Brent prices will average $44/bbl in 2H20 – lifting the overall 2020 average to $43/bbl – and $65/bbl next year. Our expectation WTI will trade $2-$4/bbl below Brent also remains intact. Robert P. Ryan Chief Commodity & Energy Strategist rryan@bcaresearch.com Hugo Bélanger Associate Editor Commodity & Energy Strategy HugoB@bcaresearch.com Fernando Crupi Research Associate Commodity & Energy Strategy FernandoC@bcaresearch.com Commodities Round-Up Energy: Overweight Canadian oil production averaged 4.6mm b/d in 2Q20 vs. 5.5mm b/d in 2Q19, based on EIA estimates. The lack of demand from US refiners – crude imports from Canada fell by 420k b/d y/y during the quarter – and close to maxed-out local storage facilities pushed prices below cash costs, forcing the shut-ins of more than 1mm b/d of crude production. Canadian energy companies started releasing their 2Q20 earnings this week and analysts expect the results to be one of the worst ever recorded, reflecting the extent of the pain producers felt during the COVID-19 shock. Base Metals: Neutral High-grade iron ore prices (65% Fe) were trading above $120/MT this week, on the back of forward guidance from the commodity’s top exporter, Brazilian miner Vale, which suggested exports will be lower than had been previously estimated this year, according to Fastmarkets MB, a sister service of BCA Research. This is in line with an Australian Department of Industry, Science, Energy and Resources analysis in June, which noted, “The COVID-19 pandemic appears to have affected both sides of the iron ore market: demand disruptions have run up against supply problems localised in Brazil, where COVID-19-related lockdowns have derailed efforts to recover from shutdowns in the wake of the Brumadinho tailings dam collapse” (Chart 13). Precious Metals: Neutral Our long silver position is up 17.5% since it was recommended July 2. We are placing a stop-loss on the position at $21/oz, our earlier target, given the metal was trading ~ $22/oz as we went to press. The factors supporting gold prices – chiefly low real rates in the US, a weakening dollar and global monetary accommodation, also support silver prices. However, silver also will benefit from the recovery in industrial activity and incomes we anticipate in the wake of global fiscal and monetary stimulus, which will drive demand for consumer products (Chart 14). Ags/Softs: Underweight Lumber prices have more than doubled since April lows. The uncertainty brought by the COVID-19 health emergency altered the perception of future housing demand and, by extension, lumber demand, to the point that mills responded by substantially decreasing capacity utilization rates. However, in the wake of global monetary and fiscal stimulus, housing weathered the storm better than expected. Furthermore, a surge in DIY projects from individuals working from home at a time of reduced supply contributed to the current state of market shortage. Chart 13Lower Supply Supports Iron Ore Prices
Lower Supply Supports Iron Ore Prices
Lower Supply Supports Iron Ore Prices
Chart 14Silver Favored Over Gold
Silver Favored Over Gold
Silver Favored Over Gold
Footnotes 1 In our reckoning, a non-trivial risk is something greater than Russian roulette odds – i.e., a 1-in-6 chance of an event occuring. Re the ever-so-brief Saudi-Russian market-share war, please see KSA, Russia Will Be Forced To Quit Market-Share War, which we published March 19, 2020. It is available at ces.bcaresearch.com. 2 Please see COLUMN-China's record crude oil storage flies under the radar: Russell published by reuters.com July 20, 2020. 3 The Baker Institute’s Open-Source Mapping of China's Oil Infrastructure was last updated in March 2020. The map is “a beta version and is likely missing some pieces of existing infrastructure. The challenge of China’s geographic expanse — it is roughly the same area as the U.S. Lower 48 — is compounded by a lack of transparency on the part of China’s government,” according to the Baker Institute. 4 In our supply-side estimates, we used IEA estimates of cuts for June this month. This doesn’t change the overall estimate of cuts from our earlier analysis; however, it slightly changes how the 9.7mm b/d was split between OPEC 2.0 members. the official eased cuts are 7.7mm b/d from 9.7mm b/d in May-June-July, but it actually is closer to 8.3mm b/d accounting for the compensation from the countries mentioned above. Investment Views and Themes Recommendations Strategic Recommendations Tactical Trades Trade Recommendation Performance In 2020 Q2
Balance Of Oil-Price Risk Remains To The Upside
Balance Of Oil-Price Risk Remains To The Upside
Commodity Prices and Plays Reference Table Trades Closed in 2020 Summary of Closed Trades
Balance Of Oil-Price Risk Remains To The Upside
Balance Of Oil-Price Risk Remains To The Upside
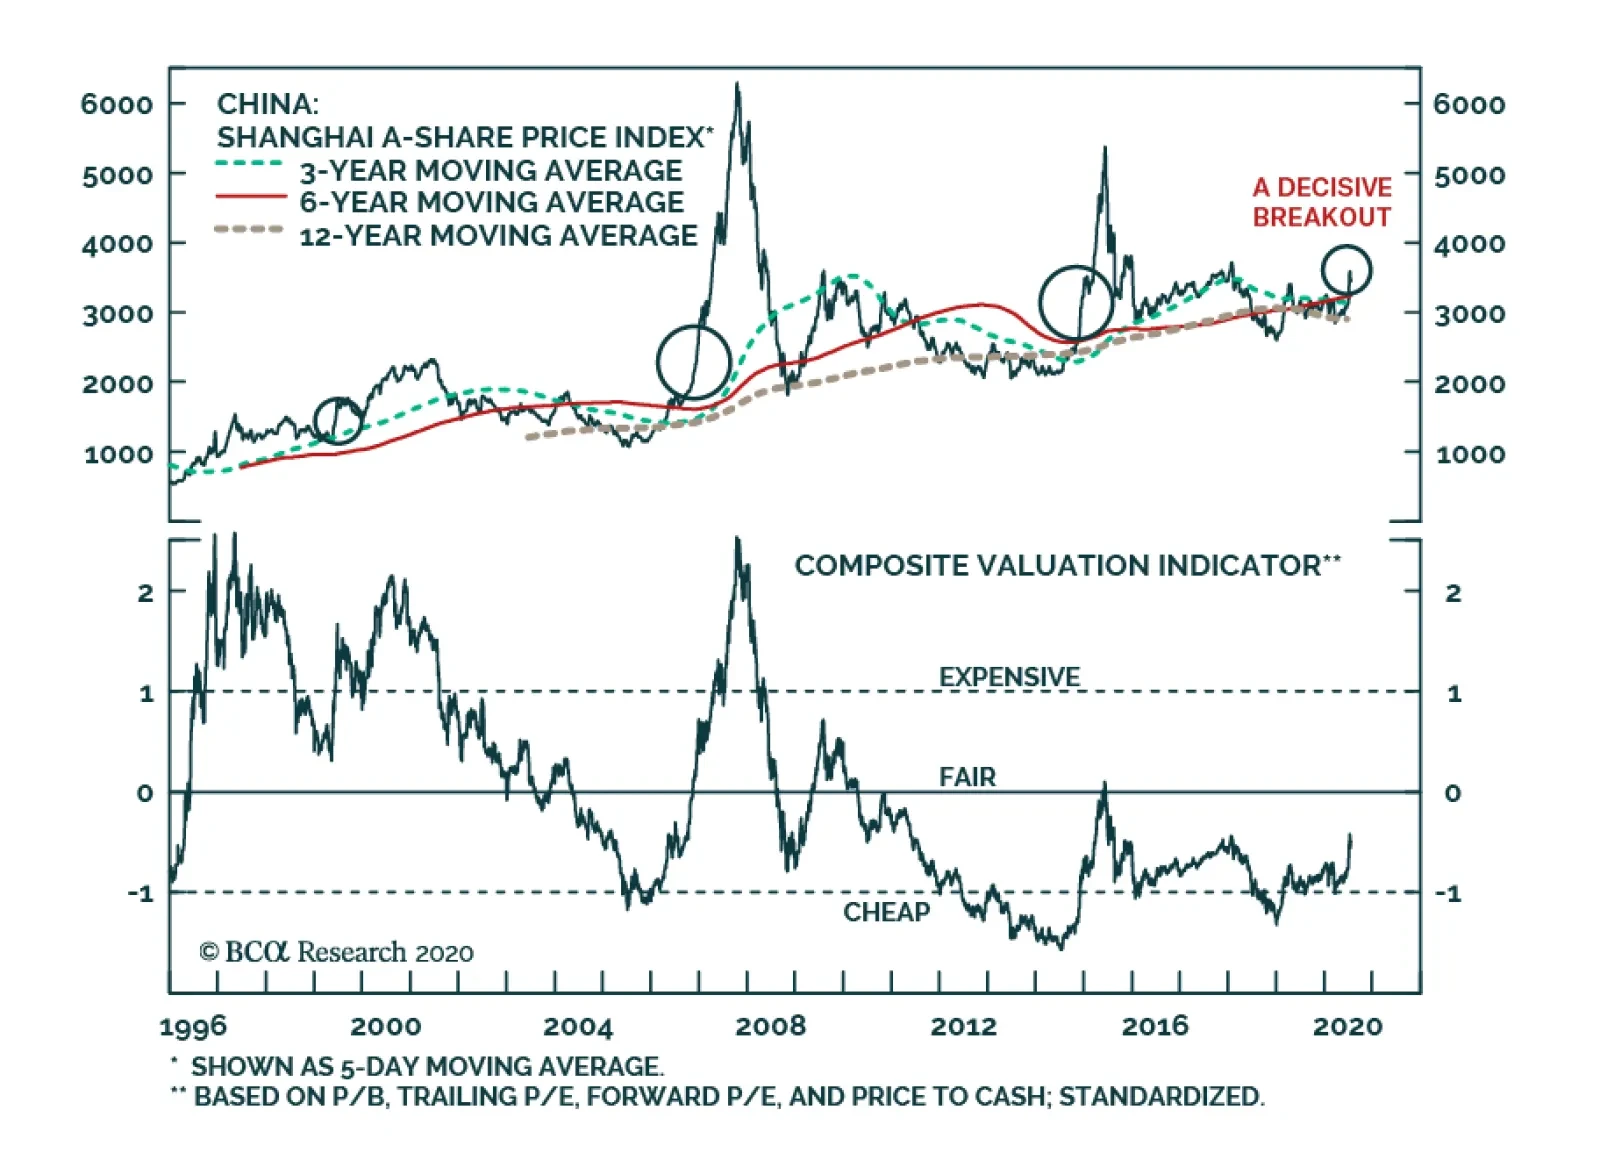
BCA Research's China Investment Strategy service believes that both A-Shares and investable bourses still have room for upside in the ongoing bull market. Chinese bull markets typically last 2-2.5 years and involve three phases. The length and boundaries…
Highlights Chinese stocks are still in the “public participation phase” of a cyclical bull market and have not yet reached the “excess phase.” Economic fundamentals should provide support for more upside in Chinese stock prices in the next 6 to 12 months. Even if Chinese stocks evolve into a boom-bust cycle reminiscent of 2014-15, near-term technical price corrections should provide good buying opportunities. We remain overweight Chinese equities in both absolute and relative terms, and recommend investors increase their exposure to beaten-down cyclically-geared stocks, particularly in China’s domestic market. Feature Chinese stocks rallied by 15% and 13% in the onshore and offshore markets, respectively, in the first 10 days of July. However, both markets gave up almost half of their gains in the third week of the month. The above-expectation Q2 GDP growth figure, which was released last Thursday, only exacerbated the market selloffs. This month’s rollercoaster ride in Chinese equities reminds investors of the boom-bust stock market cycle in 2014-2015, and raises the inevitable question: is it too late to buy or is it too early to sell Chinese stocks? We believe Chinese stocks are still at an early stage of a cyclical bull market. While the recent near-vertical escalation in equity prices was clearly overdone, any near-term technical corrections will provide good buying opportunities. Three Phases Of A Bull Market Chinese bull markets typically last 2-2.5 years and involve three phases.1 The length and boundaries of each phase in a bull run are often blurred and are best identified in hindsight. However, this framework helps put the ongoing market rally in both A shares and investable stocks into perspective. In our view, the A share market is currently in the early stage of the “public participation phase”, whereas investable stocks seem to be halfway through (Chart 1A and 1B). Chart 1AA Shares In Early Stage Of The “Public Participation Phase (PPP)”
A Shares In Early Stage Of The "Public Participation Phase (PPP)"
A Shares In Early Stage Of The "Public Participation Phase (PPP)"
Chart 1BChinese Investable Shares May Be Halfway Through PPP
Chinese Investable Shares May Be Halfway Through PPP
Chinese Investable Shares May Be Halfway Through PPP
We think that the current bull market started in January 2019, following a bear market from 2016 to 2018. We upgraded Chinese stocks from neutral to cyclically overweight in April 2019, which was a couple of months into the “accumulation phase” of the bull market underway. The accumulation phase is the start of an uptrend, typically after a bear market, when smart money begins to buy stocks; fundamentals still look bleak and valuations are at exceptionally depressed levels. Chart 2China’s Economy Should Be On Track To A Cyclical Upturn
Chinese Stocks: Stay Invested
Chinese Stocks: Stay Invested
The public participation phase typically exhibits a massive increase in trading volumes and explosive growth in new investor accounts. This phase begins when the market is already off the bottom and negative sentiment begins to wane on signs of economic improvement (Chart 2). As the bull trend is clearly established, technical and trend traders also begin to pile in, generating a self-feeding cycle. The market begins to feel overheated, making value investors uncomfortable, but valuations are not yet extreme (Chart 3). This phase tends to last longer than the other two stages in a bull market primary trend. The expansion of multiples remains the dominant driver for the broad market while earnings struggle (Chart 4). Chart 3Valuations In A Shares Are Not Too Extreme
Valuations In A Shares Are Not Too Extreme
Valuations In A Shares Are Not Too Extreme
For investable shares, we believe that the bull market is probably more than halfway through the public participation phase (Chart 5). The market has decisively broken out of its key technical resistance and entered into expensive territory (Chart 6). Still, neither A-share nor investable markets seem to be in the “excess phase” as witnessed in 2015 (Table 1). Chart 4Market Returns Between Multiples And Earnings Growth: Chinese A Shares
Market Returns Between Multiples And Earnings Growth: Chinese A Shares
Market Returns Between Multiples And Earnings Growth: Chinese A Shares
Chart 5Market Returns Between Multiples And Earnings Growth: Chinese Investable Shares
Market Returns Between Multiples And Earnings Growth: Chinese Investable Shares
Market Returns Between Multiples And Earnings Growth: Chinese Investable Shares
Chart 6Valuations In Chinese Investable Shares Are Becoming Expensive, But Not Too Stretched
Valuations In Chinese Investable Shares Are Becoming Expensive, But Not Too Stretched
Valuations In Chinese Investable Shares Are Becoming Expensive, But Not Too Stretched
Table 1Multiples In Chinese Stocks Are Not Yet In The “Excess Phase”
Chinese Stocks: Stay Invested
Chinese Stocks: Stay Invested
China's short and volatile stock market history provides some classic examples of equity boom-bust cycles. The massive bull market in Chinese A shares between 2013 and 2016 fits the three phases perfectly: stock prices jumped by a whopping 93% in the three phases of the bull market between early 2013 and May 2015. The bull market eventually marched onto the excess phase in the first half of 2015 and reached the ultimate top in May 2015 with a trailing P/E of 25 and price-to-book of over 3. Bottom Line: Both the A-share and investable bourses still have room for upside in the ongoing bull market. Remain overweight on both investable and domestic shares, but domestic stocks have more latitude for rally as China’s economy and earnings continue to recover. Pullbacks Not Enough To Turn Bearish On July 1 we upgraded our tactical (0 to 3 months) call on Chinese stocks and initiated long Chinese domestic and investable stock trades relative to global benchmarks. While it is impossible to predict whether the current market will supercharge into a boom-bust cycle as seen in 2014-15, we intend to keep the trades given our conviction that cyclically there is still upside to Chinese stock prices. To turn cyclically bearish on Chinese shares, the following conditions need to develop: First, the broad market should reach an overvalued extreme, at which point gravity would set in. Some sectors and small-cap names, particularly in the ChiNext board, are currently stretched (Chart 7). However, overall market valuations still appear reasonable, based on our composite valuation indicator. Historically, major peaks in the market occurred when the valuation indicator reached much higher levels. Further, cyclically-adjusted equity risk premiums (ERPs) in both Chinese onshore and offshore stocks are materially higher than their historical means (Chart 8). This suggests investors have already priced in extremely high uncertainties surrounding the Chinese economy. Perhaps overdone, in our view. As China's economy continues to recover, their ERPs should shrink, pushing stock prices higher. Chart 7A Structural Bull Run In Chinese Tech Stocks
A Structural Bull Run In Chinese Tech Stocks
A Structural Bull Run In Chinese Tech Stocks
Chart 8Equity Risk Premium In Chinese Stocks Are Extremely High And Will Likely Shrink, Pushing Stock Prices Higher
Equity Risk Premium In Chinese Stocks Are Extremely High And Will Likely Shrink, Pushing Stock Prices Higher
Equity Risk Premium In Chinese Stocks Are Extremely High And Will Likely Shrink, Pushing Stock Prices Higher
Secondly, liquidity should tighten. An important liquidity source is margin lending, which has gone up exponentially since late June and invited regulatory attention (Chart 9). Instead of waiting for overleverage in the market to form a momentum like in the 2014 cycle, Chinese regulators seem to be more vigilant and restrictive this time. By acting early and removing some steam from recent market velocity, a healthier secular bull market can develop. China’s overall monetary conditions are another important source of liquidity. If the policy stance turns from easing to tightening before the economy fully recovers, then it will lead to a compression in multiples in the equity market before stock prices can gain support from an earnings recovery. Historically, Chinese authorities tend to maintain an easing stance for at least three quarters following a nadir in the economy (Chart 10). The track record of Chinese policymakers suggests that the PBoC will likely keep monetary policy accommodative through the end of this year. Chart 9Chinese Authorities Have Been Cracking Down On Overleverage Early In This Bull Run
Chinese Authorities Have Been Cracking Down On Overleverage Early In This Bull Run
Chinese Authorities Have Been Cracking Down On Overleverage Early In This Bull Run
Chart 10Easy Policy Should Sustain Through End Of 2020
Easy Policy Should Sustain Through End Of 2020
Easy Policy Should Sustain Through End Of 2020
Finally, the economy should weaken significantly, which would elevate the equity risk premium and threaten the earnings outlook. A second wave of COVID-19 would have to be severe enough to substantially impact China’s economic recovery, however, the pandemic situation in China seems to be contained and earnings recovery is on course (Chart 11, 12A, 12B, and 12C). Additionally, a major pandemic-triggered shock would only force Chinese authorities to up their ante on reflation and revive domestic demand, which could benefit stocks. Chart 11COVID-19 Virus Spread Has Been Largely Contained Within China
COVID-19 Virus Spread Has Been Largely Contained Within China
COVID-19 Virus Spread Has Been Largely Contained Within China
Chart 12AA Share Prices Are Not Too Far Ahead Of Earnings Recovery
A Share Prices Are Not Too Far Ahead Of Earnings Recovery
A Share Prices Are Not Too Far Ahead Of Earnings Recovery
Bottom Line: Chinese equities will likely experience technical corrections in the near term, but the downside risks are not enough to turn bearish. Chart 12BChinese Investable Stock Prices Seem A Bit Ahead Of Its Own Historical Performance…
Chinese Investable Stock Prices Seem A Bit Ahead Of Its Own Historical Performance...
Chinese Investable Stock Prices Seem A Bit Ahead Of Its Own Historical Performance...
Chart 12C…But Still Not Too Expensive Compared With Global Benchmarks
...But Still Not Too Expensive Compared With Global Benchmarks
...But Still Not Too Expensive Compared With Global Benchmarks
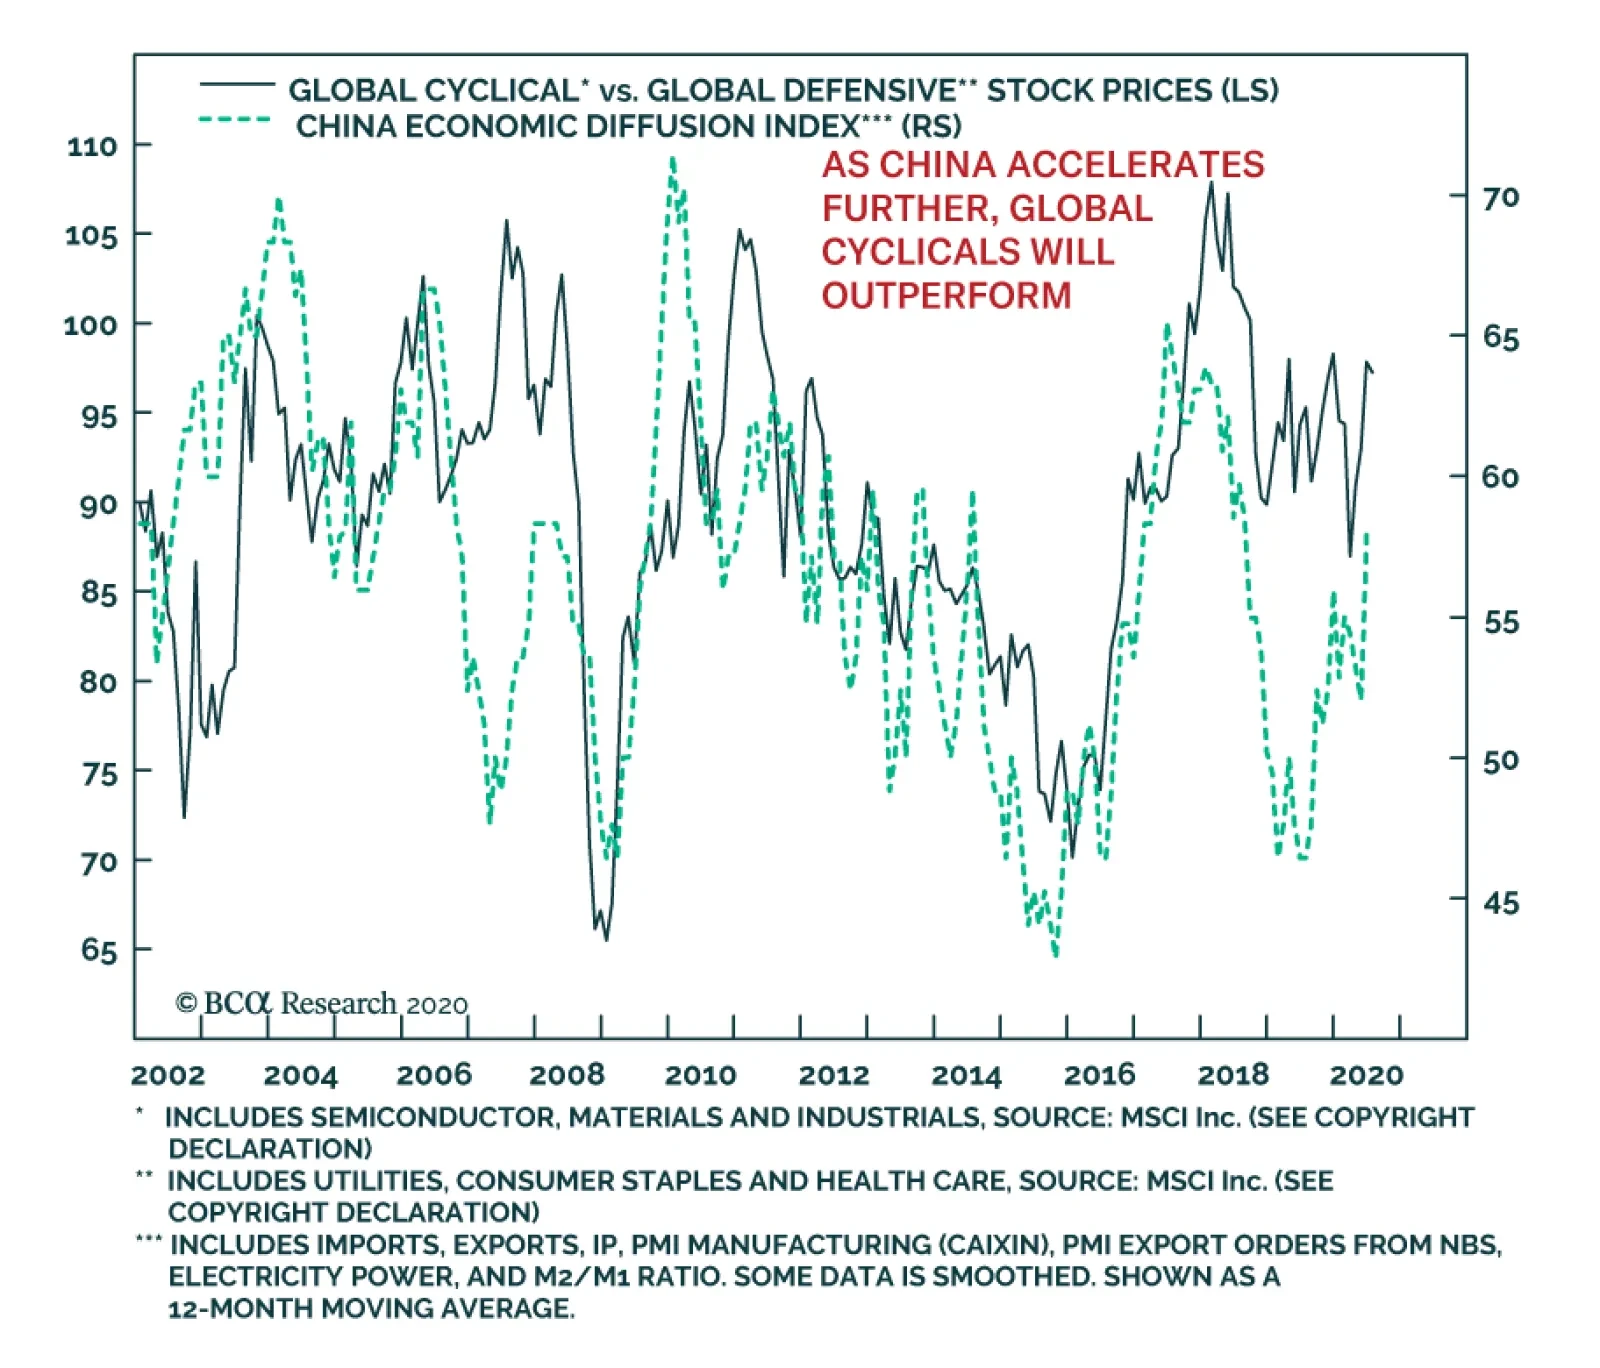
Investment Conclusions Regardless of the direction of Chinese stocks in absolute terms, we recommend investors overweight equities within a global equity portfolio (Chart 13). Investors should also tilt their exposure to battered cyclicals, particularly in China’s domestic stock market (Chart 14). We favor consumer discretionary, materials and industrials in the next 6 to 12 months. Chart 13We Remain Overweight On Chinese Stocks
We Remain Overweight On Chinese Stocks
We Remain Overweight On Chinese Stocks
Chart 14Cyclical Stocks Are Likely To Prevail Over Defensives
Cyclical Stocks Are Likely To Prevail Over Defensives
Cyclical Stocks Are Likely To Prevail Over Defensives
Chinese equity prices have run ahead of economic fundamentals and setbacks will be likely in the near term. Still, these setbacks are buying opportunities and we recommend buying on the dip if Chinese equities, in either onshore or offshore markets, were to fall by 5% to 10% from current levels. However, consecutive selloffs accumulating to a 15% or greater fall in Chinese stock prices within a short period of time (e.g. 2 to 3 weeks) would prompt us to close our long Chinese equity trades. Historically, when the prices of Chinese equities fell by such a magnitude, the selloffs tended to trigger panic among China’s massive retail investors and, in turn, form a self-reinforcing downward spiral and push Chinese stocks into a prolonged bear market (Chart 15). Chart 15Oversized Selloffs Historically Tend To Push Chinese Stocks Into Prolonged Bear Markets
Oversized Selloffs Historically Tend To Push Chinese Stocks Into Prolonged Bear Markets
Oversized Selloffs Historically Tend To Push Chinese Stocks Into Prolonged Bear Markets
Jing Sima China Strategist jings@bcaresearch.com Footnotes 1 Please see China Investment Strategy Weekly Report "Three Phases Of A Bull Market," dated April 22, 2015, available at cis.bcaresearch.com Cyclical Investment Stance Equity Sector Recommendations
At first glance, China’s GDP growth in Q2 was a positive surprise, rising 11.5% on a quarterly, seasonally adjusted rate, well above expectations of 9.6%. Moreover, while the year-to-date data continues to show a contraction in output, this decline is of…
Highlights Exogenous risks will remain more of a threat to grain prices than out-of-whack fundamentals, which are closer to balance than not, as the USDA’s World Agricultural Supply and Demand Estimates (WASDE) indicate. COVID-19-induced public-health risks leading to renewed lockdowns – particularly in the US, where infection rates are rampaging ahead of its trading partners’ – remain at the forefront of these exogenous risks (Chart of the Week). Headline-grabbing grain purchases notwithstanding, fraying Sino-US trade, diplomatic and military relations again threaten these markets, particularly soybeans. China promises to retaliate against actions taken by US President Donald Trump in response to a new security law Beijing foisted on Hong Kong at the end of June, which sharply curtails freedom and autonomy. Sino-US military tensions in the South China Sea remain elevated. Countering these risks, a weaker USD – in line with our House view – would boost demand for grains as EM income growth picks up. Still, global economic policy uncertainty will remain a formidable headwind to a weaker USD. Feature Grains generally are closer to balance than not globally, which suggests the next market-moving developments – outside weather – will be caused by news exogenous to fundamentals (Chart 2). Chart of the WeekCOVID-19 Infection Surge In US Could Lead To Renewed Lockdowns
Exogenous Risks Keep Grains, Beans On Edge
Exogenous Risks Keep Grains, Beans On Edge
The four key markets tracked by the UN’s Agricultural Market Information System (AMIS) – corn, wheat, rice and soybeans – are in “a generally comfortable global supply situation. However, in many parts of the world, local markets brace for the looming impacts of COVID-19, amid uncertainties related to demand, logistics and even access to food.”1 Chart 2Grain Markets Close To Balanced
Grain Markets Close To Balanced
Grain Markets Close To Balanced
The USDA sees corn markets tightening in the coming 2020-21 crop year beginning in September, with US production down 995mm bushels on the back of lower plantings and harvests.2 Output ex-US is expected to be largely unchanged, while Chinese corn demand will pick up in response to higher soybean feed usage. Stocks in China, Argentina, the EU, Canada, and Mexico, are expected to be lower leading to a net decline in global inventories. US soybean stocks are expected to increase, but this will be offset by declines in Brazil and China, reducing global bean inventories by some 1.3mm tons to 95.1mm, based on USDA estimates. The USDA’s soybean export commitments to China (i.e., outstanding sales plus accumulated exports) are 1.8mm tons higher than last year at 16.2mm tons, but still are well below historic levels (Chart 3). The US slack has been picked up by Brazilian exports, which have been aided by a weak BRL and record bean crops. A weaker USD and a resumption of Sino-US bean trade would reverse this. Wheat and rice stocks are expected to increase globally. Wheat inventories are expected to hit record highs globally, with China accounting for a little more than half of these stocks, and India accounting for 10%. Rice supplies are expected to increase more than demand globally, lifting ending stocks for the 2020-21 crop year to a record 186mm tons; China and India account for 63% and 21% of these inventories, respectively, in the USDA’s estimates. Chart 3Sino-US Trade Tensions Reduce Soybean Exports
Exogenous Risks Keep Grains, Beans On Edge
Exogenous Risks Keep Grains, Beans On Edge
Chart 4Rising US COVID-19 Infections Are A Risk, But Won’t Derail Global Recovery
Exogenous Risks Keep Grains, Beans On Edge
Exogenous Risks Keep Grains, Beans On Edge
Sources Of Market-Moving News The public-health fallout from the COVID-19 pandemic continues, particularly in the US, which is seeing a second wave of infections multiplying rapidly. With markets largely in line with fundamentals, the three most likely sources of market-moving “new news” affecting grain markets – outside weather – will come from public-health developments, particularly in the US; political developments affecting global trade, particularly the escalating Sino-US diplomatic tensions; and FX-market developments, which will continue to process these developments in real time. The public-health fallout from the COVID-19 pandemic continues, particularly in the US, which is seeing a second wave of infections multiplying rapidly (Chart 4). While we do not except a repeat of the massive lockdowns earlier this year, rising infection rates do place increasing strains on public-health resources, which could force officials to reimpose lockdowns locally. The global recovery from the pandemic remains uneven, with China’s recovery apparently ahead of most other states in terms of returning its economy to normal. China was first to be hit by the virus and first to largely recover, due to its more extensive lockdowns. Rising geopolitical tensions centered on China could throw global trade patterns into disarray again, just as the world is attempting to emerge from the COVID-19 pandemic. For grain markets, China remains an attractive destination for exporters, given the premium grains and soybeans trade at relative to other destinations (Chart 5). This should keep China’s imports of grains robust in the near future, particularly for corn (Chart 6). Chart 5China Grains Prices Are Attractive To Exporters
China Grains Prices Are Attractive To Exporters
China Grains Prices Are Attractive To Exporters
While economics favor movement of grains – and other commodities – to China, rising geopolitical tensions centered on China could throw global trade patterns into disarray again, just as the world is attempting to emerge from the COVID-19 pandemic. Chart 6China Should Remain Well Bid For Corn
Exogenous Risks Keep Grains, Beans On Edge
Exogenous Risks Keep Grains, Beans On Edge
A new security law foisted on Hong Kong by Beijing at the end of June limiting freedom and autonomy drew sharp responses from the US and EU. President Trump this week signed an order ending Hong Kong’s preferential status as a US trading partner in the wake of the new law, and threatened direct sanctions against Chinese officials involved in enforcing the law.3 The European Union issued a statement on July 1, which decried the passage of the law by the Standing Committee of China’s National People’s Congress, expressing “grave concerns about this law which was adopted without any meaningful prior consultation of Hong Kong’s Legislative Council and civil society.”4 In addition to this political turmoil, the US and China are engaged in a war of words over China’s territorial claims on the South China Sea, which is contested by states surrounding the sea and branded as illegal by the US.5 The US and China carried out simultaneous large-scale naval exercises earlier this month, raising concerns of an unintended military confrontation.6 Weaker USD Will Buoy Grain Markets We are aligned with our House view expecting a weakening of the USD, driven by the massive fiscal and monetary stimulus from the US; lower real rates in the US, and America’s apparent inability to successfully contain the COVID-19 pandemic to the degree other states (e.g., China) have (Chart 7). This implies the US is at a greater risk of a marked slowdown in its ongoing economic recovery. These factors will support flows to markets ex-US, pressuring the USD lower. For grain markets this will be bullish for demand. A weaker USD lifts EM GDP growth, which boosts industrial activity (Chart 8). Higher income boosts demand for protein, which drives demand for corn and soybeans used as animal feed, and grain consumption (wheat and rice).7 Chart 7USD Weakness Expected As Real Rates Fall, Deficits Rise
USD Weakness Expected As Real Rates Fall, Deficits Rise
USD Weakness Expected As Real Rates Fall, Deficits Rise
Chart 8Weaker USD Boosts EM Income, Which Lifts Protein and Grain Demand
Weaker USD Boosts EM Income, Which Lifts Protein and Grain Demand
Weaker USD Boosts EM Income, Which Lifts Protein and Grain Demand
On the supply side, a higher (lower) US dollar decreases (raises) the local costs of production for ag exporting countries with a certain lag. A persistently high (low) dollar will incentivize (disincentivize) crop planting in these countries – allowing producers to increase local currency profits from USD-denominated ag exports. This pushes up (down) global supply at the margin. Hence, over relatively long periods, ag prices and the US dollar tend to trend in opposite directions. We cannot ignore the USD’s role as a safe-haven, which is particularly evident during periods of financial, economic and geopolitical stress. Longer term, disparities in monetary and fiscal policies, interest rates, and economic activity between the US and other DM economies will dominate the evolution of the dollar. In our simulations for the USD’s trajectory between now and the end of the year, a 5% depreciation of the USD would lift the CCI grains and oilseed index 13%, while a 5% strengthening of the dollar would push the index down by -8% by December 2020 (Chart 9).8 Should this weakening in the USD materialize, we can expect US grains’ stocks-to-use ratios to fall, which would reinforce price strength in grains (Chart 10). Chart 9USD Weakness Will Buoy Grains
USD Weakness Will Buoy Grains
USD Weakness Will Buoy Grains
While the weaker-dollar scenarios are our favored evolution, we cannot ignore the USD’s role as a safe-haven, which is particularly evident during periods of financial, economic and geopolitical stress (Chart 11). Chart 10Weaker USD Would Lower STU Ratios, And Provide Support To Grain Prices
Weaker USD Would Lower STU Ratios, And Provide Support To Grain Prices
Weaker USD Would Lower STU Ratios, And Provide Support To Grain Prices
Chart 11USD's Safe-Haven Status Could Keep Dollar Well Bid
USD's Safe-Haven Status Could Keep Dollar Well Bid
USD's Safe-Haven Status Could Keep Dollar Well Bid
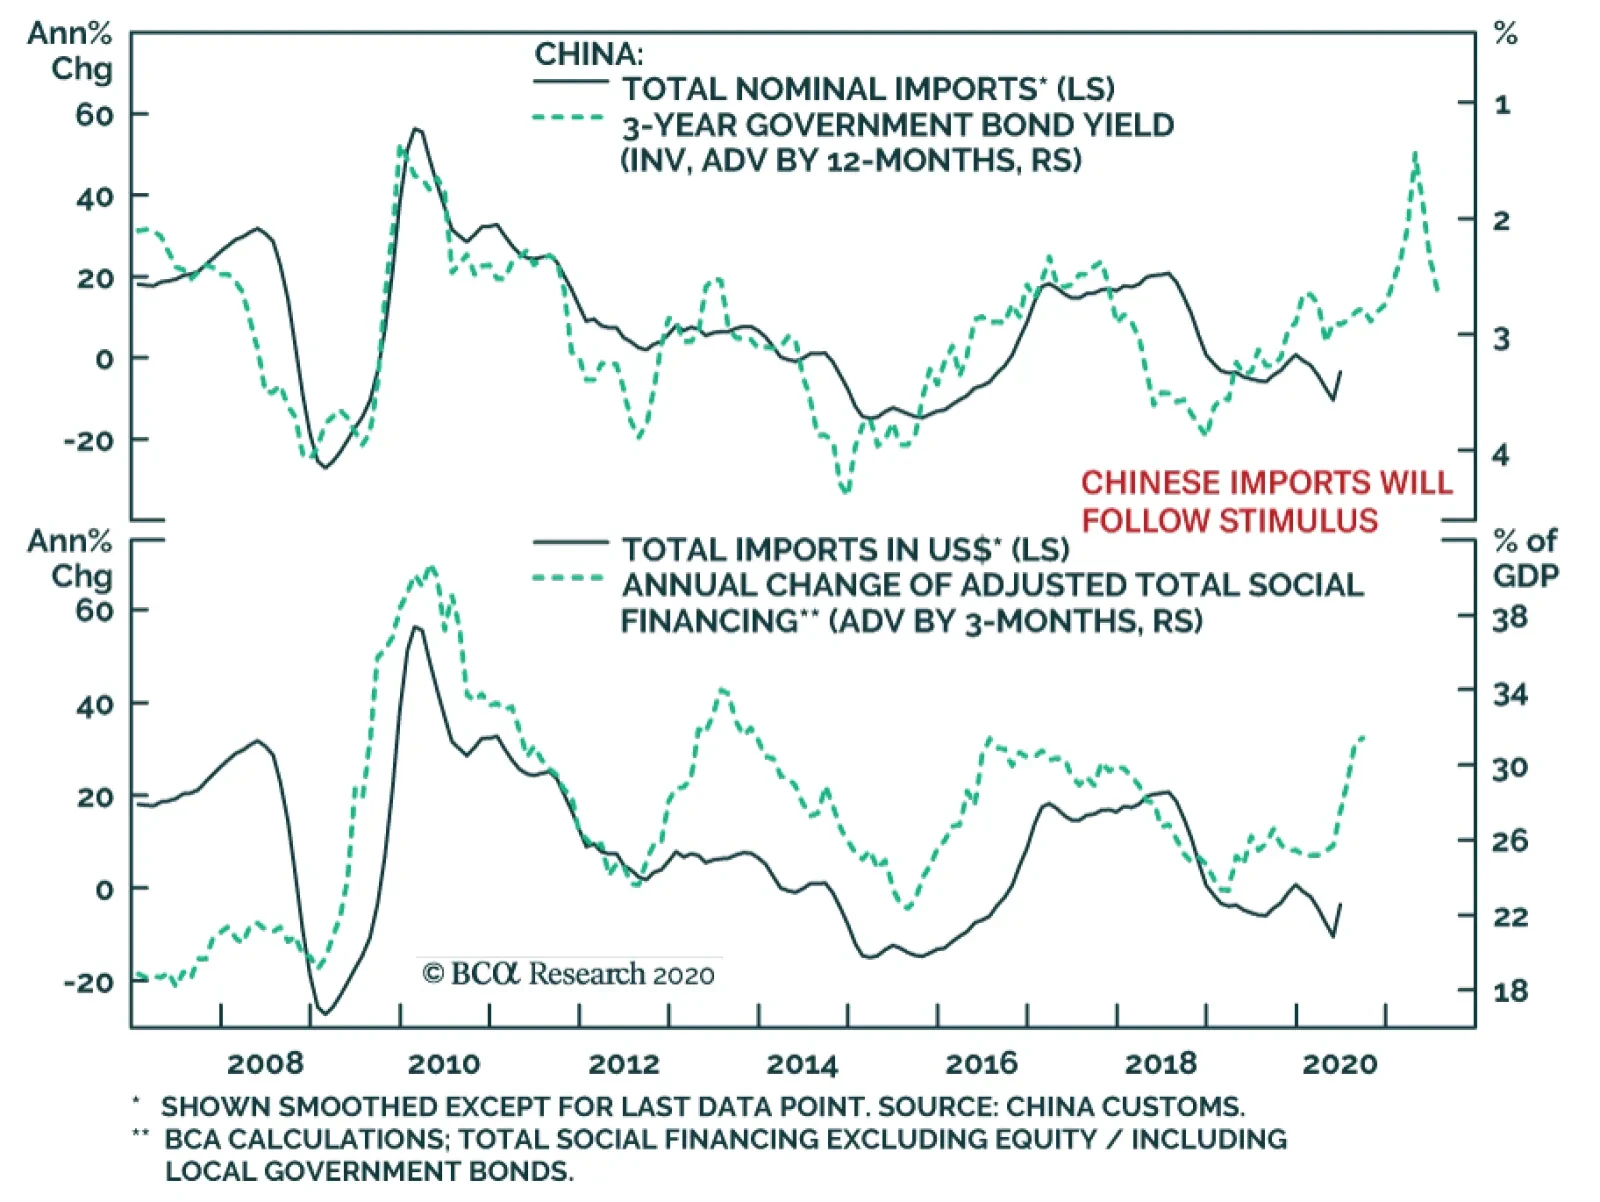
Bottom Line: Global grain markets are closer to balance than not, leaving exogenous risks – i.e., a COVID-19 second wave, renewed Sino-US trade and military tensions, and a stronger USD – as the key threats to grain prices. The impact of these exogenous risks will be filtered through to grain markets – and commodities generally – via FX markets. While we expect a weaker USD to prevail, in line with our House view, we cannot gainsay the dollar’s safe-haven role and its attraction during times of tension and crisis. Robert P. Ryan Chief Commodity & Energy Strategist rryan@bcaresearch.com Hugo Bélanger Associate Editor Commodity & Energy Strategy HugoB@bcaresearch.com Fernando Crupi Research Associate Commodity & Energy Strategy FernandoC@bcaresearch.com Commodities Round-Up Energy: Overweight As we go to press, Brent prices are steady at ~ $43/bbl as market participants await OPEC 2.0's Joint Ministerial Monitoring Committee decision on next month's output levels. The group is reportedly set to ease production curtailment to 7.7mm b/d starting next month from 9.7mm b/d in July. This would add to the growing concerns about the impact on oil demand of mounting COVID-19 cases in the US and in EM economies. Still, Saudi Arabia’s Energy Minister reiterated the effective cuts would be deeper as countries that overproduced in May/Jun will have to compensate with extra cuts over the coming months. Our global oil balances point to a supply deficit in 2H20. Thus, prices will recover if a correction were to occur. Base Metals: Neutral Copper prices surged by 5% since last week and have now completely recovered from the damaging COVID-19 shock – up 4% ytd. Fears of strike over wages at Antofagasta’s Zaldivar mine in Chile – following unionized workers rejection of a pay offer – and of virus-related mine disruptions in Latin America, combined with strong imports numbers out of China for the month of June supported the recent rally.9 In USD terms, Chinese imports growth recovered to 2.7% from -16.7% in May as stimulus programs start impacting the real economy (Chart 12). Precious Metals: Neutral Gold and silver prices are up 19% and 9% ytd. Silver rose to $19.5/oz as of Tuesday’s close, pushing the gold-to-silver ratio down to 93 after several weeks at ~ 100. Silver prices are supported by both safe-haven and industrial demand at the moment, which is pushing its equilibrium value higher, based on our silver price model (Chart 13). Our long Dec/20 silver futures trade is up 6.4% since inception on July 2, 2020. Ags/Softs: Underweight On Tuesday the corn market shrugged off the biggest Chinese single-day purchase of U.S. corn and the USDA’s report of a 2% decline in corn crop conditions rated good to excellent. Despite this arguable bullish news, corn prices were still down on prospects of large carryovers both this season and the next marketing year, which begins in September. Going forward, the USDA cattle on feed inventory figure as well as ethanol demand will be key to assessing the evolution of corn carryovers. Feed and residual use of corn went down in the latest WASDE report, with year-to-date cattle on feed inventory lower than 2019, due to consumer stockpiling during the pandemic. With the beginning of grilling season well on its way re-stocking will be a challenging task. Chart 12Chinese Stimulus Will Lift Import Growth
Chinese Stimulus Will Lift Import Growth
Chinese Stimulus Will Lift Import Growth
Chart 13Higher Equilibrium Value of Silver
Higher Equilibrium Value of Silver
Higher Equilibrium Value of Silver
Footnotes 1 Please see the UN’s AMIS Market Monitor for July 2020. 2 Please see World Agricultural Supply and Demand Estimates (WASDE) published by the USDA July 10, 2020. 3 Reuters reports that per the executive order signed by Trump this week, “U.S. property would be blocked of any person determined to be responsible for or complicit in ‘actions or policies that undermine democratic processes or institutions in Hong Kong.’” In addition, the order requires US officials to “revoke license exceptions for exports to Hong Kong.” Hong Kong passport holders no longer will be accorded special treatment under the order as well. Please see China vows retaliation after Trump ends preferential status for Hong Kong published by reuters.com July 14, 2020. 4 Please see Declaration of the High Representative on behalf of the European Union on the adoption by China’s National People’s Congress of a National Security Legislation on Hong Kong. This was issued by the EU July 1, 2020. 5 Please see South China Sea dispute: China's pursuit of resources 'unlawful', says US published by bbc.com July 14, 2020. See also China Pushes Back Against U.S. Statement on South China Sea Claims, ASEAN Stays Silent published by news.usni.org July 14, 2020. 6 Please see U.S. Carriers Send a Message to Beijing Over South China Sea published by foreignpolicy.com July 9, 2020. 7 In our modeling, we find that ag prices are generally less responsive to short-term changes in the US dollar compared to oil or base metals, but that they follow a common trend with the dollar over the long term. 8 These percent changes scale linearly in percentage terms, so a 10% weakening of the USD would lift the index 26%. 9 Please see Workers at Antofagasta's Zaldivar copper mine in Chile vote to strike: union published by reuters.com on July 10, 2020. Investment Views and Themes Recommendations Strategic Recommendations Tactical Trades Trade Recommendation Performance In 2020 Q2
Exogenous Risks Keep Grains, Beans On Edge
Exogenous Risks Keep Grains, Beans On Edge
Commodity Prices and Plays Reference Table Trades Closed in 2020 Summary of Closed Trades
Exogenous Risks Keep Grains, Beans On Edge
Exogenous Risks Keep Grains, Beans On Edge
Highlights The EM equity benchmark’s concentration in the top six stocks – that in turn correlate with US FAANGM – has risen substantially. Hence, the outlook for US mega-cap stocks will continue to significantly impact the EM equity benchmark. US FAANGM stocks have been closely tracking the trajectory of – and share many other similarities with – previous bubbles. Hence, it is risky to dismiss the mania thesis. That said, it is impossible to know how long this equity mania will last, how far it will go and what will trigger its volte-face. Odds of a repeat of the 2015 boom-bust cycle in Chinese equities are low. The rally in Chinese stocks and commodities might be due for a pause. Feature Concentration Risk Chart 1EM: Mega-Caps Stocks Versus The Equal-Weighted Index
EM: Mega-Caps Stocks Versus The Equal-Weighted Index
EM: Mega-Caps Stocks Versus The Equal-Weighted Index
The EM equity index's hefty gains since the late-March lows have largely been at the hands of about six stocks: Alibaba, Tencent, TSMC, Samsung, Naspers and Meituan-Dianping (Chart 1). The latter is a Chinese web-service platform company, while Naspers derives 75% of its revenue from its equity ownership in Tencent and 25% from a Russian internet company. For ease of reference, we refer to the big four (Alibaba, Tencent, Samsung and TSMC) as EM ATST. Table 1 illustrates that the top six companies combined account for about 24.3% of the MSCI EM equity market cap. For comparison, US FAANGM (Facebook, Apple, Amazon, Netflix, Google and Microsoft) account for 25% of the S&P 500 market cap. The remainder of the EM equity universe – including all Chinese, Korean and Taiwanese stocks other than the six mega caps listed above – has rallied less (Chart 1). This is very similar to the dynamics in the US equity market, where the equally-weighted index has substantially diverged from the FAANGM index (Chart 2). Table 1Market Cap Weights & Performance Since March Lows
EM Equities: Concentration And Mania Risks
EM Equities: Concentration And Mania Risks
Chart 2US: FAANGM Versus The Equal-Weighted Index
US: FAANGM Versus The Equal-Weighted Index
US: FAANGM Versus The Equal-Weighted Index
Table 2MSCI EM Stocks: Country Weights
EM Equities: Concentration And Mania Risks
EM Equities: Concentration And Mania Risks
The EM ATST’s exponential rise has also boosted their respective country weightings in the MSCI EM equity benchmark. Table 2 demonstrates that China, Korea and Taiwan together account for 65% of the EM benchmark, India for 8% and all other 22 countries combined for 27%. Note that the market cap ($1.7 trillion) of the remaining 22 countries is almost as large as the market cap of the top six EM individual stocks. On the whole, concentration in the EM benchmark is as high as ever. Apart from global trade and Chinese growth, there are two other forces that will define the direction of EM mega-cap stocks: (1) rising geopolitical tensions between the US and China, and (2) a continuous mania or bust in “new economy” stocks. We discuss the latter in the following section. Escalating tensions between the US and China, including North Korea’s potential assault on South Korea, pose risks to Chinese, Korean and Taiwanese stocks. This is one of the critical reasons why we have been reluctant to chase these markets higher, despite upgrading our outlook on Chinese growth. If these bourses relapse, their sheer weight in the EM benchmark will pull the index down. The EM equity index’s outperformance in recent weeks has been due to the surge in both EM mega-cap stocks and Chinese share prices more broadly. Bottom Line: The EM equity benchmark concentration has risen substantially due to outsized gains in several “new economy” stocks. What’s more, the EM equity index’s outperformance in recent weeks has been due to the surge in both EM mega-cap stocks and Chinese share prices more broadly (we discuss the latter below). If the global mania in “new economy” stocks persists, EM ATST could well drive the overall EM equity index higher. Conversely, if “new economy” shares roll over for whatever reason, the EM equity benchmark’s advance will reverse. A Bubble Or Not? An assessment of the sustainability of the rally in US FAANGM stocks is critical for investors in the EM equity benchmark if for no other reason than the concentration hazard. We present the following considerations in assessing whether the FAANGM and EM ATST rally is or is not a mania: First, the exponential rally in FAANGM stocks is not a new phenomenon: It has been taking place over the past 10 years. Our FAANGM index – an equal-weighted average of six stocks (Facebook, Amazon, Apple, Netflix, Google and Microsoft) – has increased 20-fold in real (inflation-adjusted) US dollar terms since January 2010. Its rise is on par with the magnitude of the bull market in the Nasdaq 100 index in the 1990s and Walt Disney in the 1960s, and well exceeds other bubbles, as illustrated in Chart 3. All price indexes on Chart 3 are shown in real (inflation-adjusted) terms. Chart 3Each Decade = One Mania
EM Equities: Concentration And Mania Risks
EM Equities: Concentration And Mania Risks
All these manias and bubbles started with excellent fundamentals, and price gains were initially justified. Toward the end of the decade, however, their outsized gains attracted momentum chasers and speculators, catapulting share prices exponentially higher. Second, a financial mania requires: (1) solid past performance; (2) a story that can capture investors’ imaginations, and (3) plentiful liquidity. The “new economy” stocks fit all of these criteria: They have delivered super-sized performance over the past 10 years; They easily capture ordinary people’s imaginations – the average person on the street knows that FAANGM and EM ATST stocks benefit from people working from home and spending more time online; The Federal Reserve and many other central banks are injecting enormous amounts of liquidity into their respective economies. Third, there is a striking similarity between the FAANGM rally and previous bubbles: The mania-subjects of the preceding decades assumed global equity leadership early in their respective decade, rose steadily throughout, and went exponential at the very end of the decade. The latest parabolic surge in FAANGM stocks along with its duration (10 years of global equity outperformance and leadership) and magnitude (20-fold price appreciation in real inflation-adjusted terms) conspicuously resembles those of previous bubbles. Interestingly, the majority of previous bubbles peaked and tumbled around the turn of each decade, the exception being Walt Disney – the Nifty-Fifty bubble of the 1960s – which rolled over in 1973. Given FAANGM stocks have been closely tracking the trajectory of previous bubbles, it will not be surprising if 2020 ends up marking the peak for “new economy” stocks. Fourth, the last exponential upleg in the tech and telecom bubble of 1999-2000 occurred amid a one-off demand surge for tech hardware and software. The Y2K scare – worries that computers and networks around the world might malfunction on the New Year/new millennium eve – spurred many companies to order new hardware and upgrade their systems and networks. As a result, there was a one-off boom in orders in the global technology industry in the fourth quarter of 1999 and first quarter of 2000. Chart 4Orders For Computers And Electronics Have Remained Resilient
Orders For Computers And Electronics Have Remained Resilient
Orders For Computers And Electronics Have Remained Resilient
Investors extrapolated this one-off demand surge into the future, mistaking it for recurring growth. As a result, they assigned extremely high valuations to these tech stocks in the first quarter of 2000. Similarly, since March, working and shopping from home has sharply increased demand for web services, online shopping, cloud computing and tech hardware. The top panel of Chart 4 demonstrates that US manufacturing orders for computers and electronic products did not contract in the March-May period, while orders for capital goods have plunged since March. Similarly, Taiwanese exports – which are heavy on tech hardware – are holding up well despite the crash in global trade (Chart 4, bottom panel). Some of this demand strength is structural, but part of it is one-off and non-recurring. Certainly, one should not extrapolate their recent growth rates into the future. However, investors are prone to extrapolation and chasing winners. Fifth, valuations of US FAANGM and EM ATST are elevated. Trailing P/E ratios for EM ATST stocks are shown in Table 3. Table 3Price-To-Earnings For Top 6 EM Stocks
EM Equities: Concentration And Mania Risks
EM Equities: Concentration And Mania Risks
All in all, provided both US FAANGM and EM ATST consist of admirable companies with great competitive advantages and business models, it is tempting to dismiss the bubble argument. Nevertheless, there are enough similarities with previous manias to compel investors to be vigilant. Even great companies have a fair price, and substantial price overshoots will not be sustainable. We sense a growing number of investors deem US FAANGM and EM ATST stocks as invincible. When some stocks are regarded as unbeatable, their top is not far. Our major theme for the past decade – elaborated in the report, How To Play EM In The Coming Decade1 published in June 2010 – has been as follows: Sell commodities / buy health care and technology. Until 2019, we were recommending being long EM tech/short EM resource stocks. Unfortunately, since 2019, the corrections in EM “new economy” stocks have proved to be too short and fleeting, and we were unable to buy-in. Their share prices have lately gone parabolic: They are now in a full-blown mania phase. As to global equity leadership change from growth to value stocks, we maintain that major leadership rotations typically occur during or at the end of an equity selloff, as we elaborated in our October 3, 2019 report (Charts 5 and 6). Chart 5EM vs DM: Leadership Rotation Requires Market Turbulence
EM vs DM: Leadership Rotation Requires Market Turbulence
EM vs DM: Leadership Rotation Requires Market Turbulence
Chart 6Growth vs Value: Leadership Rotation Requires Market Turbulence
Growth vs Value: Leadership Rotation Requires Market Turbulence
Growth vs Value: Leadership Rotation Requires Market Turbulence
Apparently, the February-March selloff did not produce a shift in equity leadership. Barring a major selloff, “new economy” stocks will likely continue to lead. Chart 7Fed Rate Cuts Did Not Prevent The S&P 500 Bubble From Unravelling
Fed Rate Cuts Did Not Prevent The S&P 500 Bubble From Unravelling
Fed Rate Cuts Did Not Prevent The S&P 500 Bubble From Unravelling
Finally, easy money policies encourage speculation and contribute to the build-up of manias. However, when a bubble starts unravelling, low interest rates are often unable to avert the bust. For example, when the tech bubble began bursting in 2000, the Fed cut rates aggressively and US bond yields plunged. Yet, low interest rates did not prevent tech share prices from deflating further (Chart 7). Bottom Line: It is impossible to know how long this equity mania will last, how far it will go and what will trigger its volte-face. One thing is certain: there is a lot of froth – particularly in terms of valuation and positioning – in these “new economy” stocks. Yet, these excesses could last longer and get larger. A Mania In Chinese Equities? Many commentators have rushed to compare the latest surge in Chinese stocks with the exponential advance in the first half of 2015. We do not think this rally will go on without interruption for another five months like it did back then. Our rationale is as follows: The Chinese authorities are much more vigilant now, and they will try to induce periodic corrections to avoid another mania and bust similar to those that occurred five years ago. The Chinese authorities are much more vigilant now, and they will try to induce periodic corrections to avoid another mania and bust similar to those that occurred five years ago. Both China’s MSCI Investable and CSI 300 equity indexes are retesting their previous highs (Chart 8). In the past they failed to break above these levels, and this time is likely to be no different, at least for now. The latest spike is more likely to be the final hurrah before a setback. Critically, the 12-month forward P/E ratio for China’s MSCI Investible index has also risen to its previous peaks (Chart 9, top panel). This has occurred with little improvement in the 12-month forward EPS (Chart 9, bottom panel). In short, share prices have run ahead of the business cycle and are already pricing in a lot of profit recovery. Chart 8Chinese Stocks Are At Their Previous Highs
Chinese Stocks Are At Their Previous Highs
Chinese Stocks Are At Their Previous Highs
Chart 9Chinese Investable Stocks: A Rally Driven By P/E Expansion
Chinese Investable Stocks: A Rally Driven By P/E Expansion
Chinese Investable Stocks: A Rally Driven By P/E Expansion
Chart 10Chinese Onshore Stocks: A Two-Tier Market
Chinese Onshore Stocks: A Two-Tier Market
Chinese Onshore Stocks: A Two-Tier Market
Most of the rally since the March lows has been due to “new economy” stocks. Share prices of “old economy” companies did not do that well before July. Tech stocks in the onshore market have gone parabolic (Chart 10, top panel). This contrasts with lackluster performance of materials, industrials, and property stocks (Chart 10, bottom panels). Critically, in the onshore market, tech stocks are trading at the following trailing P/E ratios: the market cap-weighted P/E is 155, and the median P/E is 60. Needless to say, these valuations are outright expensive. Bottom Line: Odds of a repeat of the 2015 boom-bust cycle are low. The rally in Chinese stocks might be due for a pause. On June 18, we upgraded Chinese stocks to overweight from neutral within the EM benchmark, a recommendation that remains intact. We have a much lower conviction on the absolute performance of Chinese stocks in the near-run. China And Commodities An important question to address is whether the rally in commodities in general and copper in particular are signals of a sustainable recovery in the mainland economy. Without a doubt, economic conditions in China have been improving, and infrastructure spending has been accelerating. However, the magnitude of the upswing in copper prices is excessive relative to the strength of the Chinese economy. The spike in resource prices in general and copper in particular has been due to three forces: (1) China’s unprecedented super-strong imports; (2) global investors buying commodities; and (3) output cuts. It is highly unlikely that commodity demand in China is this strong. In our opinion, this reflects restocking. Chart 11 shows that Chinse imports of copper and copper products surged by 100% in June from a year ago, while imports of steel products increased by 100% and oil import volumes rose by 34%. It is highly unlikely that commodity demand in China is this strong. In our opinion, this reflects restocking. Provided cheap credit availability, wholesalers, intermediaries or users of commodities have rushed to buy before prices rise further. In the case of copper, it will take several months before the real economy absorbs that much of the red metal. Hence, China’s copper imports are poised to relapse in the coming months. Chart 12 illustrates that investors’ net long positions in copper have risen to their highest level since early 2019. Consistently, the July Bank of America/Meryl Lynch Global Fund Manager Survey revealed that as of early July, portfolio managers had built up their largest net long positions in commodities since July 2011. Not only oil but also copper and iron ore prices have benefitted from production declines. Due to surging COVID infections, Chile and Peru have sharply reduced copper output and Brazil has curtailed iron ore production. Chart 11Chinese Imports Of Commodities Have Surged
Chinese Imports Of Commodities Have Surged
Chinese Imports Of Commodities Have Surged
Chart 12Investors Have Gone Long Copper
Investors Have Gone Long Copper
Investors Have Gone Long Copper
Simultaneous buying of commodities by China and global investors as well as production cuts have considerably benefited resource prices as of late. Our suspicion is that commodities inventories in China have become elevated. This entails reduced purchases by China, and by extension an air pocket in commodities prices in the months ahead. Bottom Line: The rally in resources in general and copper in particular is at risk of a correction. We remain long gold/short copper. Investment Strategy In absolute terms, the risk-reward of EM share prices is not attractive. However, as we have argued in the past two months, FOMO (fear-of-missing-out) mania forces could take share prices higher. The timing of a reversal is never easy especially when a FOMO-driven mania is alive. For now, for asset allocators we reiterate a below-benchmark allocation in EM stocks within a global equity portfolio. However, a breakdown in the trade-weighted US dollar will prompt us to upgrade EM within the global equity benchmark (Chart 13). The broad trade-weighted dollar is teetering on an edge but has not yet broken down (Chart 14). In sum, global equity portfolios should be ready to upgrade their EM allocation to neutral on signs that the broad trade-weighted US dollar is breaking down. Chart 13EM vs DM: Is The Downtrend Intact?
EM vs DM: Is The Downtrend Intact?
EM vs DM: Is The Downtrend Intact?
Chart 14The Broad Trade-Weighted Dollar Is On An Edge
The Broad Trade-Weighted Dollar Is On An Edge
The Broad Trade-Weighted Dollar Is On An Edge
As we argued last week, the US dollar could weaken against DM currencies amid the next selloff in global share prices. This is why last week we switched our short positions in an EM currency basket from the US dollar to an equally-weighted basket of the euro, the Swiss franc and Japanese yen. This strategy remains valid. The US dollar is at risk versus DM currencies. However, EM exchange rates may not be out of the woods, given their poor fundamentals on the one hand and potential geopolitical risks in North Asia on the other. We are neutral on both EM local currency bonds and EM sovereign and corporate credit. Arthur Budaghyan Chief Emerging Markets Strategist arthurb@bcaresearch.com Footnotes 1 Please see Emerging Markets Strategy Special Report "How To Play EM In The Coming Decade," dated June 10, 2010. Equities Recommendations Currencies, Credit And Fixed-Income Recommendations
China’s June trade numbers offered some hope for the global economy. In USD terms, the annual growth rate of exports rebounded to 0.5% from -3.3% last May. Imports’ growth recovered to 2.7% from -16.7%. Shipments of masks and medical supplies supercharged…
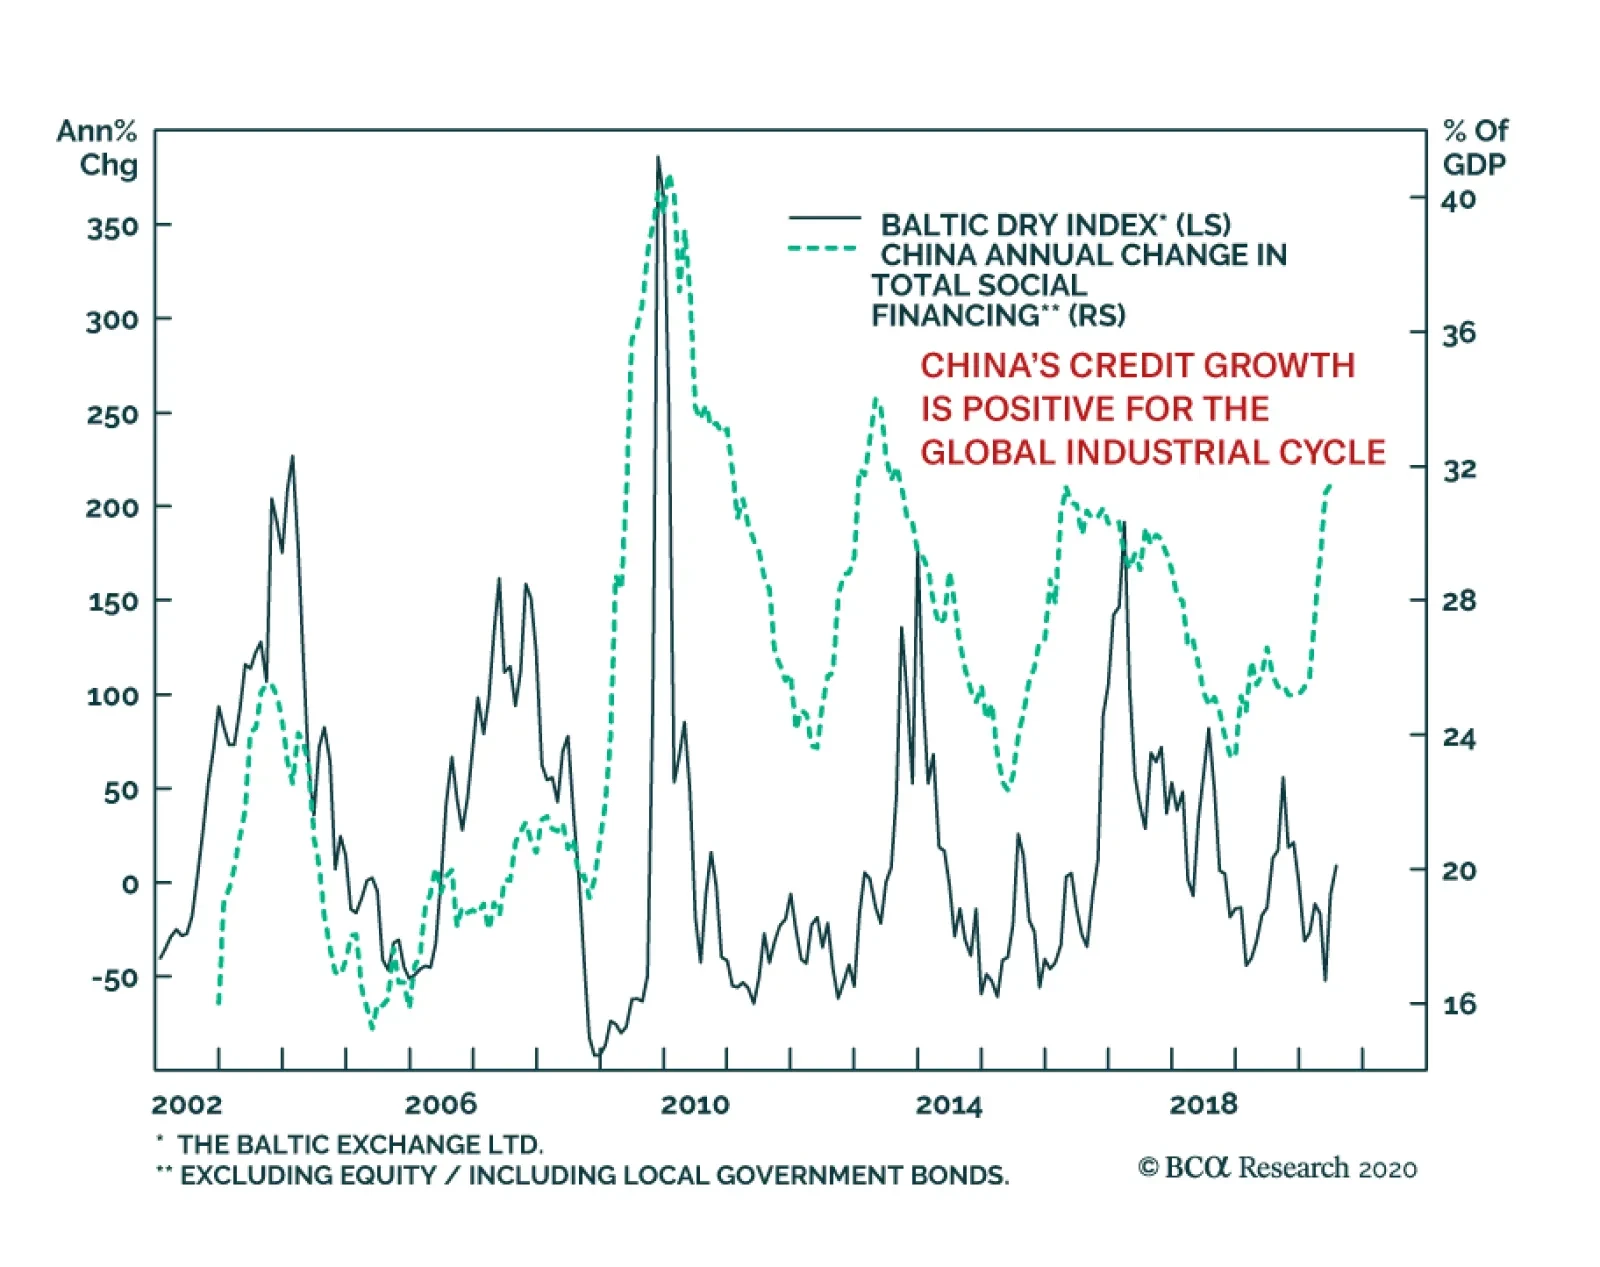
China’s credit growth remains strong. In June, new loans hit CNY1.8 trillion, bringing new bank lending to CNY12.1 trillion for the first half of 2020, which beats the previous peak of CNY9.7 trillion recorded in H1 2019. Total social financing (which…
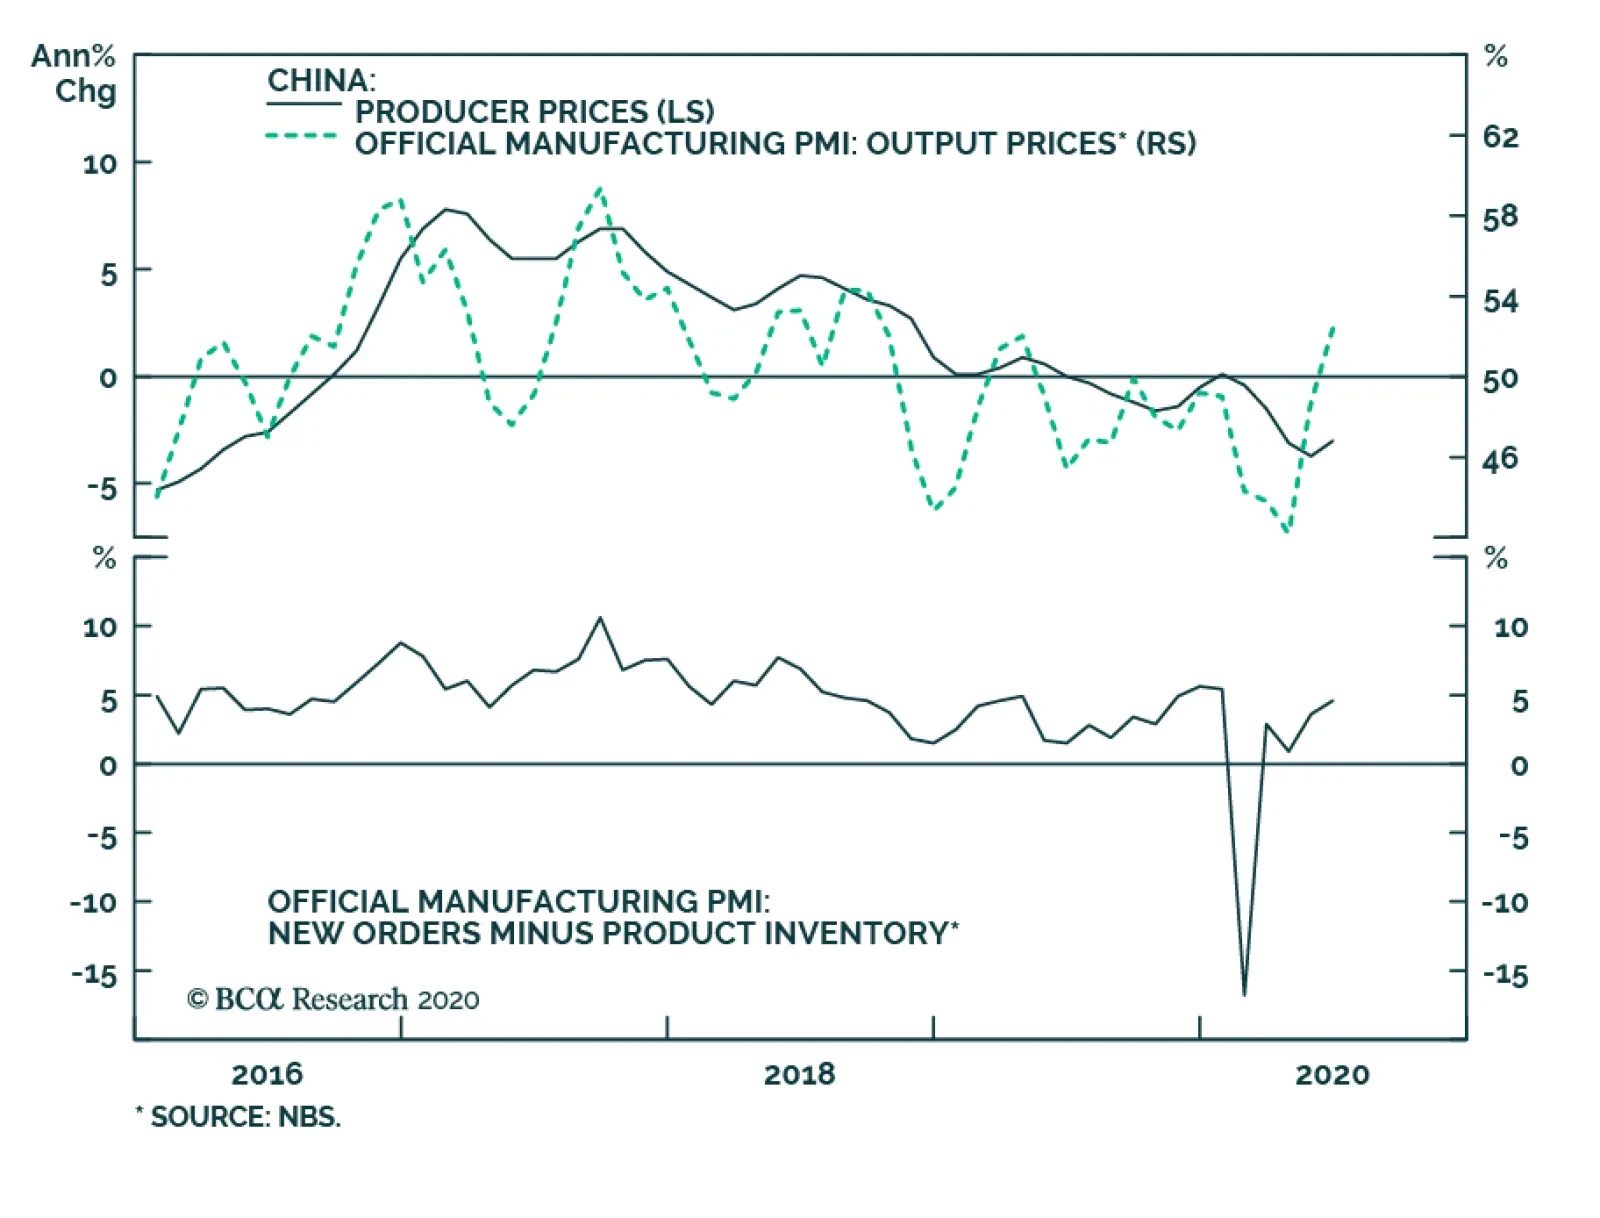
China’s official manufacturing PMI ticked up to 50.9 in June from 50.6 in the previous month. The Caixin manufacturing PMI came in at 51.2 in June vs. 50.7 in May and beat the market expectation of 50.5. Both readings suggest that China’s manufacturing sector…