China

Feature Over the last several years when I travelled to Europe, I would meet with Ms. Mea, an outspoken client of the Emerging Markets Strategy service. We have published our conversations with Ms. Mea in the past and this semi-annual series has complemented our regular reports. She has challenged our views and convictions, serving as a voice for many other clients. In addition, these conversations have highlighted nuances of our analysis, for her and to the benefit of our readers. With travel restrictions in force, this time we had to resort to an online meeting with Ms. Mea. Below are the key parts of our conversation from earlier this week. Ms. Mea: Let’s begin with your main thesis, which over the past several years has been as follows: China’s growth drives EM business cycles and financial markets overall. Indeed, as long as China’s growth dithers, EM growth and asset prices languish. However, since the pandemic started China has stimulated aggressively and there are clear signs that the economy is recovering. The latest surge in Chinese share prices confirms that a robust recovery is underway. Why do you not think China’s economy is on the upswing? Answer: True, we believe China’s business cycle is instrumental to EM economies’ growth and balance of payments. We upgraded our outlook for Chinese growth in our May 28 report as the National People’s Congress set the objective for monetary policy in 2020 to significantly accelerate the growth rate of broad money supply and total social financing relative to last year. Indeed, broad money growth as well as both private and public credit have accelerated since April and will continue to increase (Chart I-1). Domestic orders have also surged though export orders are still languishing (Chart I-2). Chart I-1China: Money And Credit Will Continue Accelerating
China: Money And Credit Will Continue Accelerating
China: Money And Credit Will Continue Accelerating
Chart I-2China: Improvement In Domestic Orders But Not In Export Ones
China: Improvement In Domestic Orders But Not In Export Ones
China: Improvement In Domestic Orders But Not In Export Ones
That said, financial markets, including the ones leveraged to China, have run ahead of fundamentals and a pullback is overdue. We have been waiting for such a setback to turn more positive on EM risk assets and currencies. Further, the snapback in business activity following the lockdown should not be confused with an economic expansion. As economies around the world reopened, business activity was bound to improve. Were any asset markets priced to reflect months or a whole year of closures? Even at the nadir of the global equity selloff in late March, we do not think risk assets were priced for extended lockdowns. The Chinese economy will likely eventually experience a robust expansion later this year but the nearterm outlook for global risk assets and commodities remains risky. In our view, the rally in global stocks and commodities has been much stronger than is warranted by the near-term economic conditions in a majority of economies around the world. In short, we have not been surprised at all by the economic data that has emerged since economies have reopened, but we have been perplexed by the markets’ response to these data. Even in China, which is ahead of all other countries in regards to the reopening and normalization of business activity, the level and thrust of economic activity remains worrisome. Specifically: China's manufacturing PMI new orders and the backlog of orders sub-components remain below the neutral 50 line (Chart I-3). The imports subcomponent of the manufacturing PMI has shown signs of peaking below the 50 line, portending a risk to industrial metals prices (Chart I-4). Chart I-3China Manufacturing PMI: Measures Of Orders Are Still Below 50
China Manufacturing PMI: Measures Of Orders Are Still Below 50
China Manufacturing PMI: Measures Of Orders Are Still Below 50
Chart I-4A Yellow Flag For Commodities
A Yellow Flag For Commodities
A Yellow Flag For Commodities
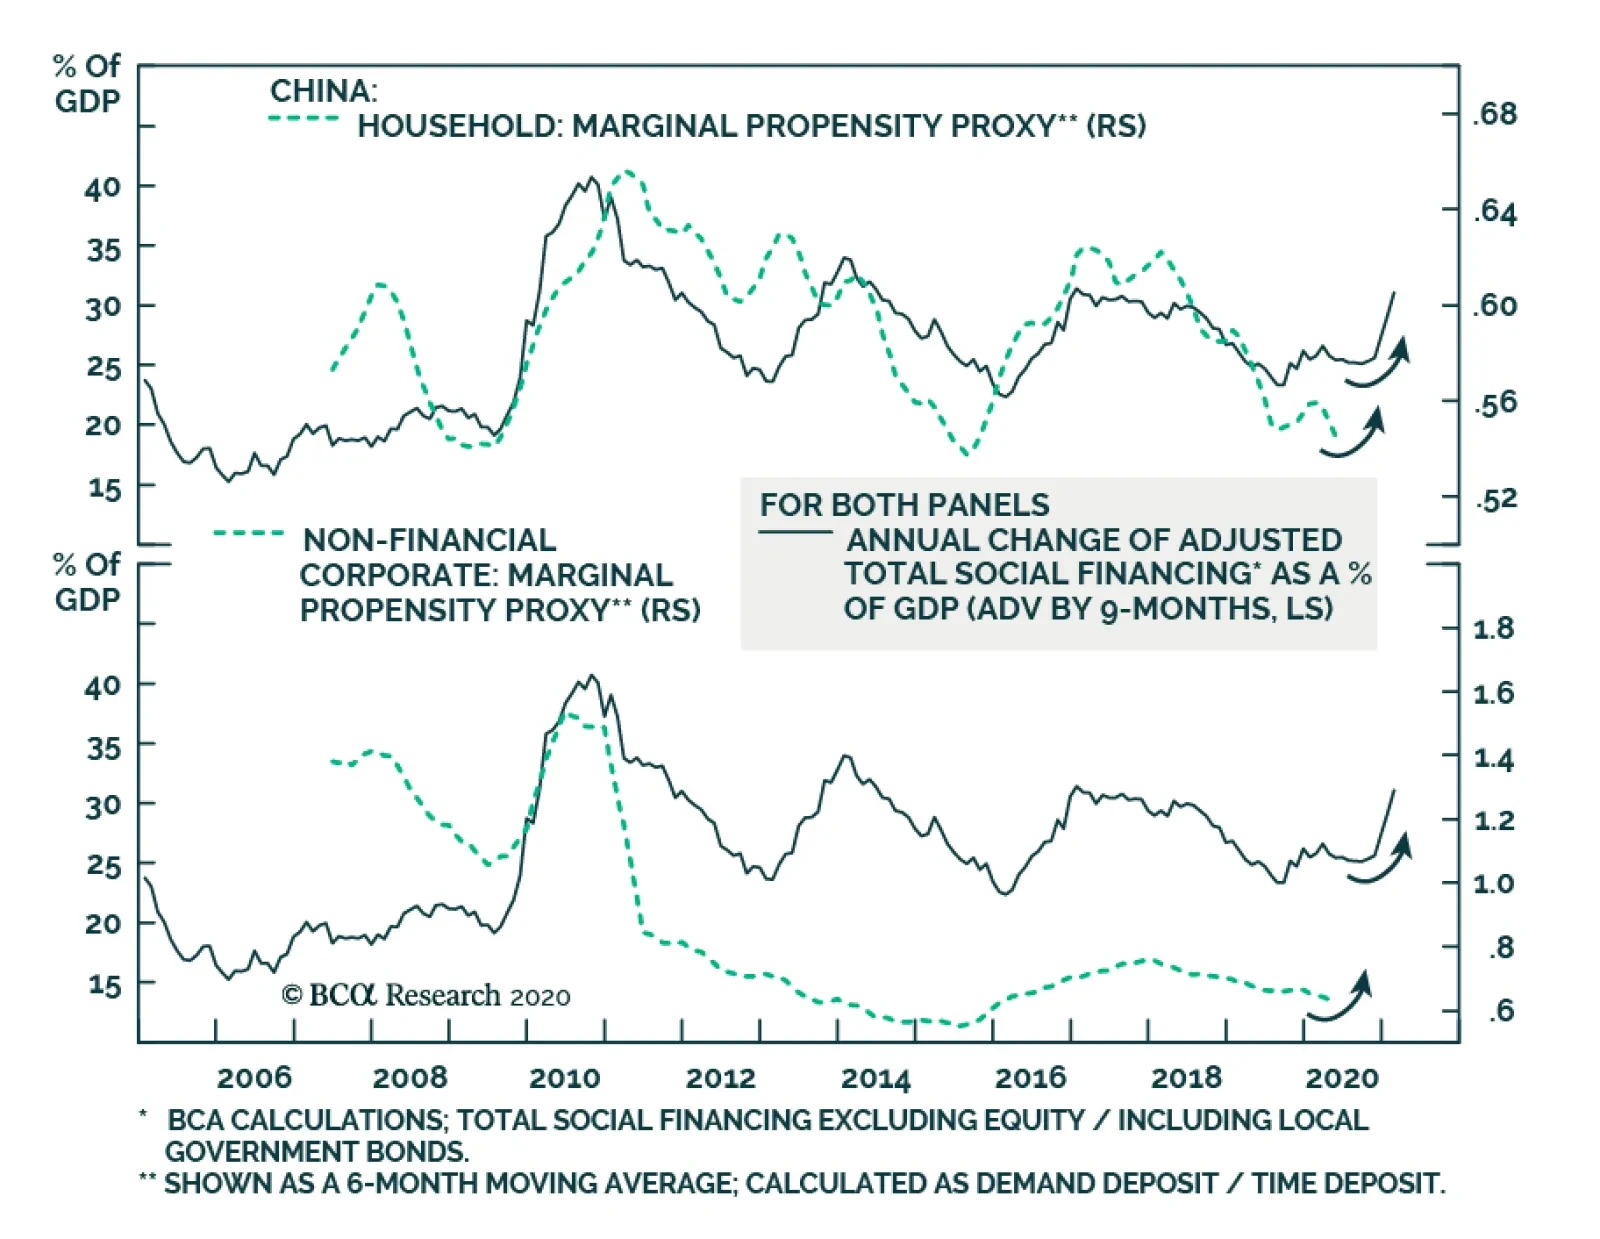
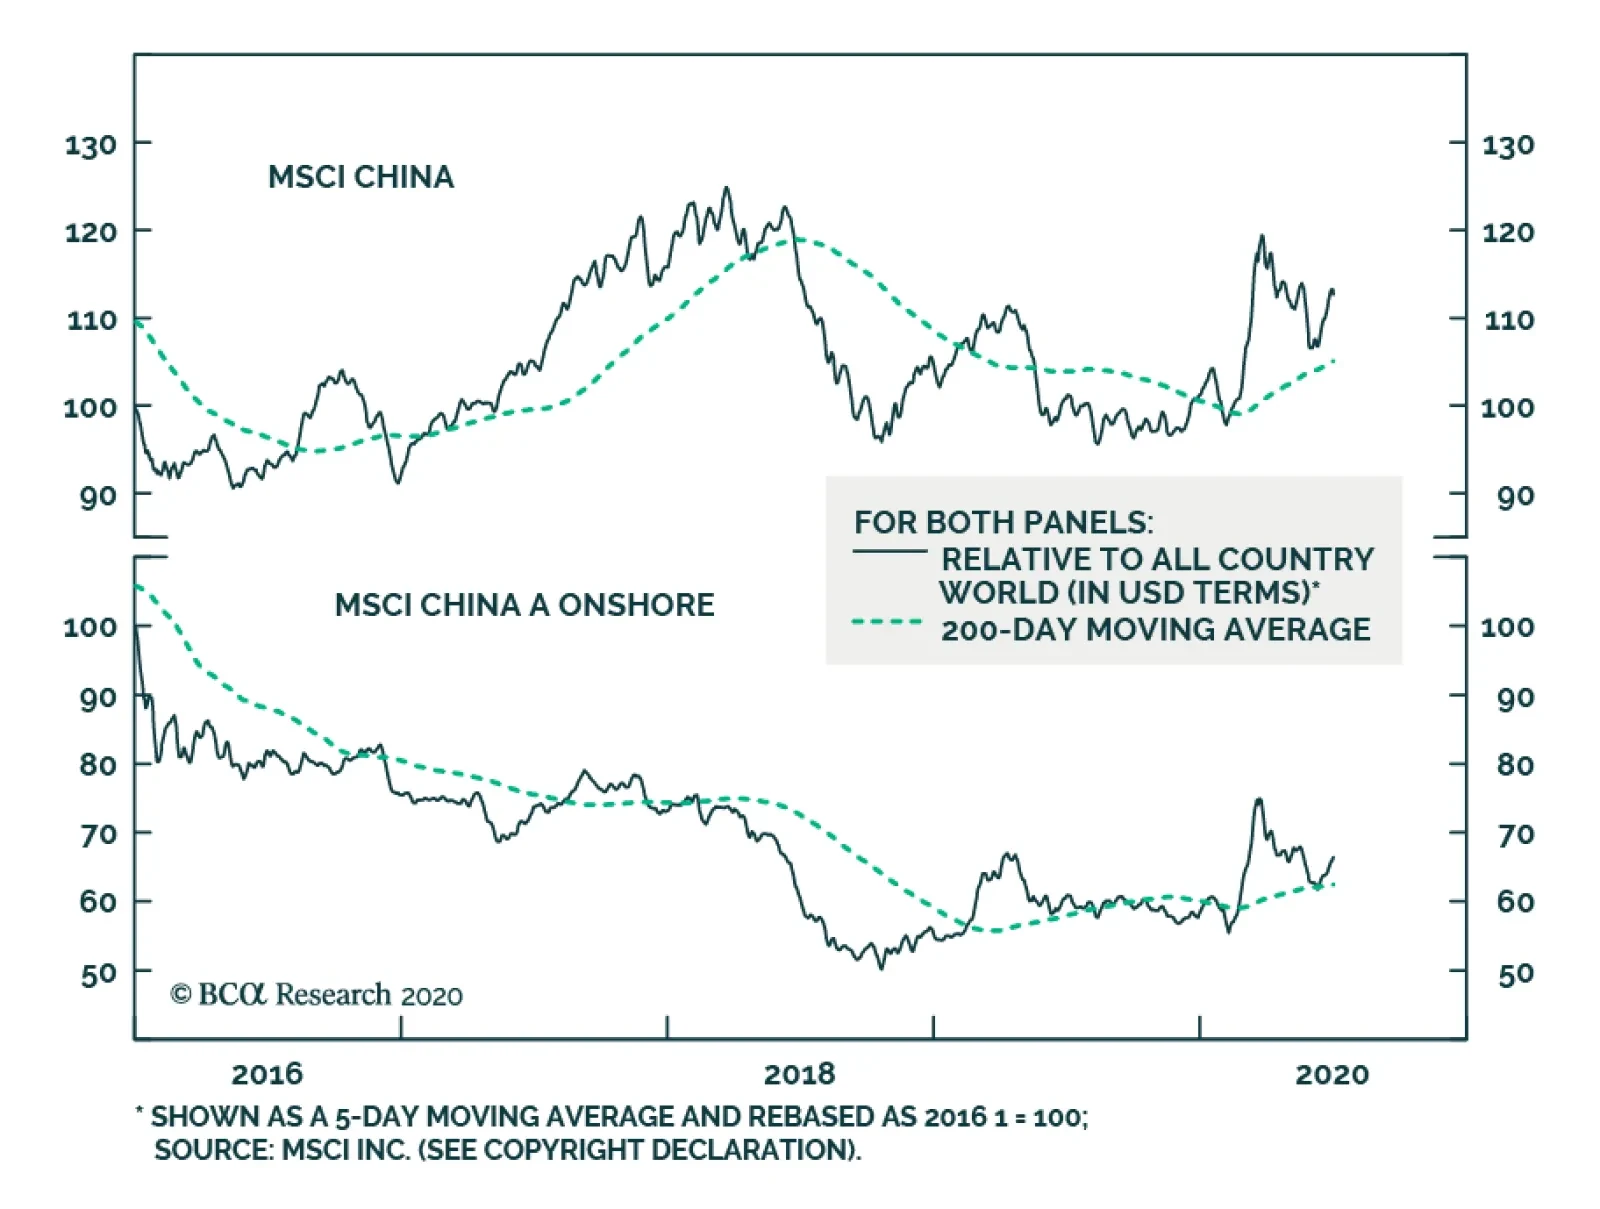
Marginal propensity to spend for both enterprises and households continues to trend lower (Chart I-5). These gauge the willingness of consumers and companies to spend and, hence, reflect the multiplier effect of the stimulus. These indicators contend that the multiplier so far remains low/weak. Finally, with the exception of new economy stocks (such as Ali-Baba and Tencent) that have been exceptionally strong worldwide, Chinese share prices leveraged to capital expenditure and consumer discretionary spending had not been particularly strong before last week, as illustrated in Chart I-6. Chart I-5Marginal Propensity To Spend Among Chinese Households And Enterprises
Marginal Propensity To Spend Among Chinese Households And Enterprises
Marginal Propensity To Spend Among Chinese Households And Enterprises
Chart I-6Chinese Stocks Had Been Languishing Till Late Outside New Economy Ones
Chinese Stocks Had Been Languishing Till Late Outside New Economy Ones
Chinese Stocks Had Been Languishing Till Late Outside New Economy Ones
In a nutshell, the Chinese economy will likely eventually experience a robust expansion later this year but the near-term outlook for global risk assets and commodities remains risky. As to EM risk assets, the key risk to our stance is a FOMO-driven rally buoyed by the “visible hand” of governments. Ms. Mea: What is your interpretation of the latest policy push in China for higher share prices? Is it also a part of the “visible hand” of government? Don’t you think this could create another strong multi-month run like it did in early 2015? Answer: Yes, this is one of many instances of the “visible hand” of governments around the world. It is not clear why Beijing is boosting investor sentiment and explicitly promoting higher share prices given how badly similar efforts in 2015 ultimately ended. At the moment, we can only speculate that one or several of the following reasons are behind this move: Beijing is preparing for an escalation in the US-China geopolitical confrontation ahead of the US presidential elections. This latter is highly probable in our opinion.1 To limit the impact of this confrontation on their economy, they want to ensure that the stock market remains in an uptrend. The same can be said for the US authorities. Apparently, the “visible hands” of both Washington and Beijing have and will continue to push share prices higher in their domestic markets. Robust equity markets will become a prominent feature of the geopolitical confrontation between the US and China. In the long run, however, this is a very negative phenomenon for the world because the two of the largest and most prominent stock markets could increasingly be driven by the “visible hand” of their governments rather than by fundamentals. As a result, equity markets could regularly send wrong price signals and will no longer serve as an efficient mechanism of capital allocation. Chart I-7Foreign Inflows Into China Have Accelerated This Year
Foreign Inflows Into China Have Accelerated This Year
Foreign Inflows Into China Have Accelerated This Year
Beijing has been luring foreign investors to buy onshore stocks and bonds and this strategy has become more vital in expectation of an escalation in the US-China confrontation. Chart I-7 shows that net inflows into onshore stocks and bonds have been surging. The more US investors buy into mainland markets, the more these investors will exercise pressure on the current and future US administrations to go soft on China. Like those US companies relying on Chinese demand, large US investment funds will have a notable exposure to Chinese financial markets and will accordingly lobby the White House and Congress to take a less adversarial stance toward China. This will reduce the maneuvering room of US politicians in this geopolitical confrontation. Finally, it is also possible that these latest media reports encouraging a bull market in China were not initiated by leaders in Beijing but were in fact spurred by mid-level bureaucrats. If that is the case, a full-blown mania akin to the one in 2015 will not be repeated and the latest frenzy surrounding Chinese stocks could end up being the final surge before a correction sets in. In brief, Chinese stocks, like other bourses worldwide, are in a FOMO-driven mania that might last for a while. Nevertheless, regardless of the direction of Chinese stocks in absolute terms, we reiterate our overweight stance on Chinese equities within the EM benchmark. Also, we have a strong conviction with respect to the merits of a long Chinese/short Korean stocks trade. Both these positions were initiated on June 18 before the latest surge in Chinese stocks. The “visible hands” of both Washington and Beijing have and will continue to push share prices higher in their domestic markets. Ms. Mea: What will it take for you to go long EM risk assets and currencies in absolute terms? Answer: EM equities, credit markets and currencies are driven by three, or more recently four, factors. We need to witness or foresee an imminent improvement in three out of four of these to go outright long. These factors include: (1) China’s business cycle and its impact on EM via global trade; (2) each individual EM country’s domestic fundamentals (inflation/deflation, balance of payments, return on capital, domestic economic cycles, monetary and fiscal policies, health of the banking system, domestic politics, etc.); (3) global risk-on and risk-off cycles that drive portfolio flows into EM. The direction of the S&P500 is an important trendsetter for these risk-on and risk-off cycles; (4) swings in geopolitical confrontation between the US and China. The first element – China’s impact on EM – is becoming positive. There could be a minor setback in mainland business cycles in the near term, but this should be used as a buying opportunity. As to structural problems in China like credit/money and property bubbles as well as the misallocation of capital, ongoing money and credit growth acceleration will fill in holes and kick the can down the road. That said, those structural problems will become even more challenging in the years to come. In short, Beijing is making credit, money and property bubbles even bigger. The second factor – domestic fundamentals in EM ex-China, Korea and Taiwan – remain downbeat. The COVID-19 outbreak has been out of control in a number of EM economies (Chart I-8). In addition, outside of China, Korea and Taiwan, EM fiscal stimulus has not been as large as in DM economies. Critically, the monetary transmission mechanism has been broken in several developing economies. In particular, central banks’ rate cuts have not translated to lower lending rates in real terms (Chart I-9). Chart I-8The COVID-19 Pandemic Has Not Peaked In Several Major EM Economies
The COVID-19 Pandemic Has Not Peaked In Several Major EM Economies
The COVID-19 Pandemic Has Not Peaked In Several Major EM Economies
Chart I-9Lending Rates Are Still High In EM ex-China, Korea And Taiwan
Lending Rates Are Still High In EM ex-China, Korea And Taiwan
Lending Rates Are Still High In EM ex-China, Korea And Taiwan
The basis is two-fold: First, banks saddled with non-performing loans are reluctant to bring down their lending rates and lend more; and second, the considerable decline in EM inflation has pushed up real lending rates (Chart I-9). The third variable driving EM financial markets – the S&P 500 – remains at risk of a material setback. If the S&P drops more than 10 or 15%, EM stocks, currencies and credit markets will also sell off markedly. Finally, there is the fourth aspect of the EM view – geopolitics – which could be critical in the coming months. The US-China confrontation will likely heighten leading up to the US elections. This will likely involve North and South Korea and Taiwan. Chart I-10EM ex-China, Korea And Taiwan: Stocks And Currencies
EM ex-China, Korea And Taiwan: Stocks And Currencies
EM ex-China, Korea And Taiwan: Stocks And Currencies
Chinese investable stocks as well as Korean and Taiwanese equities altogether make up 65% of the MSCI EM benchmark. Hence, a flareup in geopolitical tensions will weigh on these three bourses. Outside these markets, EM share prices and currencies have already rolled over (Chart I-10). In sum, out of the four factors listed above only the Chinese business cycle warrants an upgrade on overall EM. The other three drivers of the EM view are still negative. This keeps us on the sidelines for now. Importantly, we have been gradually moving our investment strategy from bearish to neutral on EM. Specifically, we: Took profits on the long EM currencies volatility trade on March 5. Took large profits on the long gold / short oil and copper trade on March 11. Booked gains on the short position in EM stocks on March 19. Recommended receiving long-term (10-year) swap rates (or buying local currency bonds while hedging the exchange rate risk) in many EMs on April 23. Upgraded EM sovereign credit from underweight and booked profits on our short EM corporate and sovereign credit / long US investment grade bonds strategy on June 4. The only asset class where we have not yet closed our shorts is EM currencies. In fact, we now recommend shifting our short in EM currencies (BRL, CLP, ZAR, TRY, KRW, PHP and IDR) from the US dollar to an equal-weighted basket of the Swiss franc, the euro and the Japanese yen. Unlike the March selloff, the dollar could depreciate even if the S&P 500 and global stocks drop. Ms. Mea: What is the rationale behind switching your short positions in EM currencies against the US dollar to short positions versus the Swiss franc, the euro and Japanese yen? Wouldn’t the selloff in global stocks drive the greenback higher? Answer: We have been bullish on the US dollar since 2011, consistent with our negative view on EM and commodities prices and recommendation of favoring the S&P 500 versus EM. What is making us question this strategy are the following, in order of importance: First, the Federal Reserve is monetizing US public and some private debt. The amount of US dollars is surging. Meanwhile, the pace of broad money supply growth is much more timid in the euro area, Switzerland and Japan. Broad money growth is 23% in the US, 9% in the euro area, 2.5% in Switzerland, 5% in Japan and 11% in China. This will reduce investors’ willingness to hold dollars as a store of value, incentivizing them to switch to other DM currencies. Second, the pandemic is out of control in the US and this will damage its near-term growth outlook. More fiscal stimulus and more debt monetization will be required to revive the economy. Third, the Fed will not hike interest rates even if inflation rises well above their 2% target in the next several years. This implies that the Fed will prefer to be behind the inflation curve in the years to come, which is bearish for the greenback. Finally, the yen and the euro as well as EM currencies are cheaper than the US dollar (Chart I-11 and Chart I-12). Chart I-11The US Dollar Is Expensive, The Yen Is Cheap
The US Dollar Is Expensive, The Yen Is Cheap
The US Dollar Is Expensive, The Yen Is Cheap
Chart I-12EM ex-China, Korea And Taiwan: Currencies Are Cheap
EM ex-China, Korea And Taiwan: Currencies Are Cheap
EM ex-China, Korea And Taiwan: Currencies Are Cheap
The broad trade-weighted US dollar has yet to break down as per the top panel of Chart I-13, but we are becoming nervous about it. Unlike the March selloff, the dollar could depreciate even if the S&P 500 and global stocks drop. Ms. Mea: That is interesting. Has there ever been an episode where the US dollar depreciated while the S&P 500 sold off? Answer: Yes, it occurred in late 2007 and H1 2008. The 2007-08 bear market in global stocks can be split into two periods. During the initial phase of that bear market, the US dollar depreciated substantially despite the drawdowns in global equity and credit markets (Chart I-14, top and middle panels). Chart I-13Trade-Weighted Dollar And Asian Currencies: At A Critical Juncture
Trade-Weighted Dollar And Asian Currencies: At A Critical Juncture
Trade-Weighted Dollar And Asian Currencies: At A Critical Juncture
Chart I-14In Late 2007 And H1 2008: The US Dollar Fell Amid An Equity Bear Market
In Late 2007 And H1 2008: The US Dollar Fell Amid An Equity Bear Market
In Late 2007 And H1 2008: The US Dollar Fell Amid An Equity Bear Market
EM stocks performed in line with DM ones during the first phase (Chart I-14, bottom panel). The economic backdrop was characterized by the US recession and US banks tightening credit. In fact, EM growth was still robust during that phase even though the US economy was shrinking. Remarkably, commodities prices were surging – oil reached $140 per a barrel and copper $4 per ton in June 2008. The second phase of that bear market commenced in autumn of 2008 when Lehman went bust. The orderly bear market in global stocks gave way to an acute phase – a crash in all global risk assets. Business activity collapsed worldwide and the US dollar surged. In the current cycle, the order will likely be the reverse of the 2007-08 bear market. March 2020 witnessed a crash in global risk assets and the global economy plunged similar to the second phase of the 2007-08 bear market while the US dollar surged. The second stage of this recession could resemble the first phase of the 2007-08 bear market. There will be neither worldwide lockdowns nor a crash in business activity. However, the level of activity might struggle to recover as rapidly as markets have priced in or there might be relapses in economic conditions in certain parts of the world. This is especially true for the US and other countries where the pandemic has not been effectively contained. On the whole, the second downleg in the S&P 500 and global stocks will be less dramatic but could last for a while and still be meaningful (more than 10-15%). Critically, unlike the March 2020 selloff, the greenback will likely struggle during this episode for the reasons we outlined above. Ms. Mea: What about overweighting EM equities and credit versus their DM peers? Will EM equities, credit and currencies underperform their DM peers in the potential selloff that you expect? Wouldn’t USD weakness help EM risk assets to outperform even in a broad risk selloff? Answer: Yes, we can see a scenario where EM stocks and credit markets perform in line or better than their DM peers in a potential selloff. The key is the dollar’s dynamics. If the dollar rebounds, EM stocks and credit markets will underperform their DM counterparts. If the dollar weakens during this selloff, EM stocks and credit will likely perform in line with or better than their DM peers. In sum, a technical breakdown in the broad trade-weighted dollar and a breakout in the emerging Asian currency index – both shown in Chart I-13 – would lead us to upgrade our EM allocation in both global equity and credit portfolios. For now, we are only switching our shorts in EM currencies from the US dollar to an equally-weighted basket of the Swiss franc, the euro and the Japanese yen. Ms. Mea: What are some of your other current observations on financial markets? Answer: The breadth and thrust of this global equity rally has already peaked and is weakening. It is just a matter of time before a narrowing breadth translates into lower aggregate stock indexes for both EM and DM equities as illustrated by our advance-decline lines in Chart I-15. Chart I-15EM and DM Equity Breadth Measures Have Rolled Over
EM and DM Equity Breadth Measures Have Rolled Over
EM and DM Equity Breadth Measures Have Rolled Over
Chart I-16Cyclicals And High-Beta Stocks Have Been Struggling
Cyclicals and High-Beta Stocks Have Been Struggling
Cyclicals and High-Beta Stocks Have Been Struggling
Consistently, there has already been a decoupling between various sectors and industries. The rally has been solely focused on tech and new economy stocks. Equity prices in China and Taiwan have been surging while the rest of the EM equity index has been languishing. In the DM equity space, global industrials, US high-beta stocks and micro caps have already rolled over (Chart I-16). Further, our Risk-On/Safe-Haven currency index is flashing red for EM equities (Chart I-17). Chart I-17A Red Flag For EM Equities?
A Red Flag For EM Equities?
A Red Flag For EM Equities?
Chart I-18Long Gold / Short Stocks
Long Gold / Short Stocks
Long Gold / Short Stocks
Finally, EM share prices have outperformed DM stocks since late May mostly due to the sharp rally in Chinese, Korean and Taiwanese stocks. Hence, the breadth of EM equity outperformance has been subdued. Ms. Mea: To wrap up our conversation, I want to ask you what is your strongest conviction trade for the coming months? Answer: Our strongest conviction trade is long gold / short global or EM stocks (Chart I-18). This trade will do well regardless of the direction of global share prices, the US dollar, and bond yields. Arthur Budaghyan Chief Emerging Markets Strategist arthurb@bcaresearch.com Footnotes 1 Please see Geopolitical Strategy Special Report "Watch Out For A Second Wave (Of US-China Frictions)," dated June 10, 2020, available at gps.bcaresearch.com Equities Recommendations Currencies, Credit And Fixed-Income Recommendations
BCA Research's China Investment Strategy service concludes that although the intensity of the PBoC’s monetary easing may start to taper in H2, the central bank is likely to stay on the easing course and keep liquidity conditions ample. Bank lending to the…
Dear Client, In lieu of our regular report next week, I will present our view on China’s economic recovery, geopolitical risks, and implications on financial markets in two live webcasts. The webcasts will take place next Wednesday, July 15 at 10:00AM EDT (English) and at 9:00PM EDT (Mandarin). Best regards, Jing Sima, China Strategist Highlights China’s economic recovery continues through June, but the pace of its demand-side recovery has been more muted compared to the V-shaped rebound in 2009. The intensity of the PBoC’s monetary easing may start to taper in H2, but the central bank is likely to stay on the easing course and keep liquidity conditions ample. Bank lending to the corporate sector should increase further in H2. Chinese stocks rallied through last week’s enactment of the new national security law for Hong Kong and the subsequently announced sanctions from the US government. The existing US sanctions should have limited impact on Hong Kong and mainland China’s economies and financial markets. We remain positive on Chinese stocks despite the recent rallies in China’s equity markets. Feature June’s official and Caixin manufacturing PMIs indicate that China’s economic recovery continues at a steady rate, with the production side of the economy picking up slightly faster than the demand side. The drag on China’s economic recovery from lackluster demand growth should be temporary. Unlike in 2015 when policy uncertainties hindered the recovery in both economic activity and stock prices, the Chinese government has been determined to support its economy and job market in the current cycle. The massive stimulus implemented since March has tremendously boosted activities in China’s construction sector. While households and the corporate sector remain reluctant to spend and to invest, their marginal propensity to spend usually catches up with credit growth with about a 6-9-month lag (Chart 1). The sharp pickup in credit growth should meaningfully support China’s economic rebound, while a better global growth outlook in H2 should also provide some modest tailwinds. On June 30, the PBoC announced a 0.25 percentage point cut to its relending rates for small and rural enterprises and to its general rediscount rate. While the scale of rate cuts in H2 will unlikely match that of Q1, China’s monetary and fiscal policy support will remain in place through the rest of the year. Chinese investable and domestic equities were some of the best performers among global asset classes in June, whereas they were the third-worst the month prior (Chart 2). In the first week of July, both Chinese investable and domestic stocks rallied even further. As we noted in our last week’s report,1 China’s stronger economic outlook, less uncertainty related to its domestic COVID-19 containment, and policy support should provide more room for Chinese stocks to trend upwards. Last week’s passing of the new national security law for Hong Kong and the subsequently announced sanctions from the US government, in our view, should have limited impact on investors’ sentiment for now. Chart 1China's Household And Corporate Marginal Propensities Lag The Credit Impulse By 6-9 Months
China's Household And Corporate Marginal Propensities Lag The Credit Impulse By 6-9 Months
China's Household And Corporate Marginal Propensities Lag The Credit Impulse By 6-9 Months
Chart 2Chinese Equities Are Taking Flight
China Macro And Market Review
China Macro And Market Review
Tables 1 and 2 present key developments in China’s economic and financial market performance in the past month, and we highlight several of these developments below: Table 1China Macro Data Summary
China Macro And Market Review
China Macro And Market Review
Table 2China Financial Market Performance Summary
China Macro And Market Review
China Macro And Market Review
China’s June official manufacturing PMI ticked up to 50.9 from 50.6 in the previous month. The Caixin manufacturing PMI came in at 51.2, beating the expectation of 50.5 and compared to 50.7 in May. Both suggest that China’s manufacturing sector continues to expand, however the pace of its demand-side recovery has been more muted compared to the V-shaped rebound in 2009 (Chart 3). Although the import and export subcomponents have fared better in June from the low levels in April and May, their readings in June were still below the 50 boom-bust line (Chart 4). Headwinds remain strong for global trade as the US and many of emerging economies are still struggling with the pandemic. Even without re-imposing lockdowns, the resurge in the number of new cases in the US may result in a drag on consumption and global trade. The IMF projects a 12% contraction in global trade in 2020. While the external demand may improve in H2, positive contribution to China's GDP growth from the net exports will be limited this year. Chart 3Current Recovery Lies Somewhere Between 2009 And 2015
Current Recovery Lies Somewhere Between 2009 And 2015
Current Recovery Lies Somewhere Between 2009 And 2015
Chart 4Demand-Side Recovery Remains Muted
Demand-Side Recovery Remains Muted
Demand-Side Recovery Remains Muted
The employment situation in the manufacturing sector has worsened since May, and has returned to contraction following a brief improvement in March and April (Chart 5). An estimated 8.7 million new graduates in 2020,2 a historical high number, will hit the job market in July and August. As such, China’s labor market will likely remain under significant pressure. Even though employment usually lags economic recoveries, depressed expectations on the job market will refrain policymakers from prematurely withdrawing stimulus measures. Small and micro enterprises are an important part of China’s private sector, which provides 80% of jobs in China. The manufacturing PMI of small enterprises fell below the 50 boom-bust line in June, reflecting a persistent weakness in this part of China’s economy. The recent relending and rediscount rate cuts suggest that the PBoC is committed to stay on the easing course. The intensity of monetary easing may start to taper in H2, but the central bank is likely to keep liquidity conditions ample and encourage banks to accelerate lending to the corporate sector. The contraction in Chinese producer prices deepened to -3.7% (year-over-year) in May. However, we think PPI deflation is likely to bottom in Q3. Both the purchasing and producer price subcomponents of the manufacturing PMI ticked up sharply in June, while the drawdown in industrial product inventory relative to new orders has accelerated (Chart 6). The ongoing accommodative policy should provide powerful tailwinds to both economic activity and the PPI in H2. The improvement in the PPI will help to boost industrial profits growth, which turned positive in May (year-over-year) for the first time this year. We expect year-to-date industrial profits to end the calendar year with a modest positive growth rate. Chart 5Labor Market Pressure Intensifies
Labor Market Pressure Intensifies
Labor Market Pressure Intensifies
Chart 6PPI Deflation Nears Its Bottom
PPI Deflation Nears Its Bottom
PPI Deflation Nears Its Bottom
China’s property market indicators have notably trended up in May, with year-over-year growth in housing demand normalizing to its pre-pandemic level (Chart 7A & Chart 7B). As the demand in housing rebounded faster than the supply, housing prices have correspondingly turned the corner in May after trending down for 6 consecutive months. Chart 7AHousing Prices Ticked Up Slightly Following A Sharp Fall In Q1
Housing Prices Ticked Up Slightly Following A Sharp Fall In Q1
Housing Prices Ticked Up Slightly Following A Sharp Fall In Q1
Chart 7BStrong Rebound In Property Investments
Strong Rebound In Property Investments
Strong Rebound In Property Investments
Chart 7B shows that housing investments and land purchases have also recovered to near their pre-pandemic levels. Financing restrictions for property developers that were put in place since 2018 have been loosened in H1, which helped to boost real estate investments. We expect the property sector financing conditions to remain accommodative through the rest of this year. Moreover, there is a possibility that the PBoC will lower the 5-year MLF (medium lending facility) rate in Q3. As downward pressures on China's labor market and household income growth intensify, the government is likely to lower the mortgage rate to ease payment constraints on households. Chart 8Chinese Stocks Rallied Through Frictions Over Hong Kong
Chinese Stocks Rallied Through Frictions Over Hong Kong
Chinese Stocks Rallied Through Frictions Over Hong Kong
Despite the passing of China’s new and controversial national security law for Hong Kong on June 30 and the subsequently announced sanctions from the US government, stock prices in both China’s onshore and offshore markets rallied (Chart 8). While we agree the US may impose further and more concrete sanctions on China during the months leading up to the November US presidential election, our preliminary assessment points to a limited economic cost on China from the existing US sanctions. The removal of Hong Kong’s special trade status will subject Hong Kong’s export goods to the same tariffs the US levies on Chinese exports. But the raised tariffs will barely make a dent in Hong Kong or mainland China’s export status quo. Hong Kong’s economy consists mainly of the financial, logistical and services sectors. The manufacturing sector only accounts for 1% of its overall economy. Chart 9 shows that Hong Kong’s exports to the US only accounted for around 1% of its total exports and 1.3% of its GDP in 2019. More importantly, of the $5 billion goods Hong Kong exports to the US, only 10% is actually produced in Hong Kong. Most of Hong Kong's exports to the US are goods produced in China that are re-exported through Hong Kong, which are already subject to the same tariffs as the goods China exports to the US directly.3 On the other hand, US exports to Hong Kong accounts for 2% of its total exports, with a trade surplus of about $30 billion in the past two years (Chart 9, bottom panel). The US trade surplus with Hong Kong has drastically reduced since the US-China trade war broke out in 2018, suggesting that the US has already imposed restrictions on its export goods to mainland China through Hong Kong. Moreover, the large trade surplus with Hong Kong as well as China’s commitment to the Phase One trade deal may be part of the reason President Trump is unwilling to impose more substantial sanctions on China right now. The US senate and house have also passed a bill which, if signed and implemented by President Trump, will allow the US government to levy any foreign financial institutions for knowingly conducting business with individuals who are involved in jeopardizing Hong Kong’s autonomy. Chinese banks with operations in the US will be mostly exposed to such sanctions. However, Chinese banks are largely domestic-focused with very low reliance on foreign-currency funding (Chart 10). Hence, the direct impact of a deteriorating operating environment in the US will be limited on Chinese banks. Chart 9Trade Sanctions On Hong Kong Exports Have A Minimum Impact On Its Local Economy
Trade Sanctions On Hong Kong Exports Have A Minimum Impact On Its Local Economy
Trade Sanctions On Hong Kong Exports Have A Minimum Impact On Its Local Economy
Chart 10Chinese Banking Sector Stock Performance Is Largely Driven By Domestic Policy Factors
Chinese Banking Sector Stock Performance Is Largely Driven By Domestic Policy Factors
Chinese Banking Sector Stock Performance Is Largely Driven By Domestic Policy Factors
Qingyun Xu, CFA Senior Analyst qingyunx@bcaresearch.com Jing Sima China Strategist jings@bcaresearch.com Footnotes 1 Please see China Investment Strategy Weekly Report "Upgrading Chinese Stocks To Overweight," dated July 1, 2020, available at cis.bcaresearch.com 2 iiMediaReport, Analysis report on current situation and development trend of Chinese employment entrepreneurship market in 2020. 3 Please see Nicholas Lardy, “Trump’s latest move on Hong Kong is bluster”. Peterson Institute For International Economies, dated June 1, 2020. Cyclical Investment Stance Equity Sector Recommendations
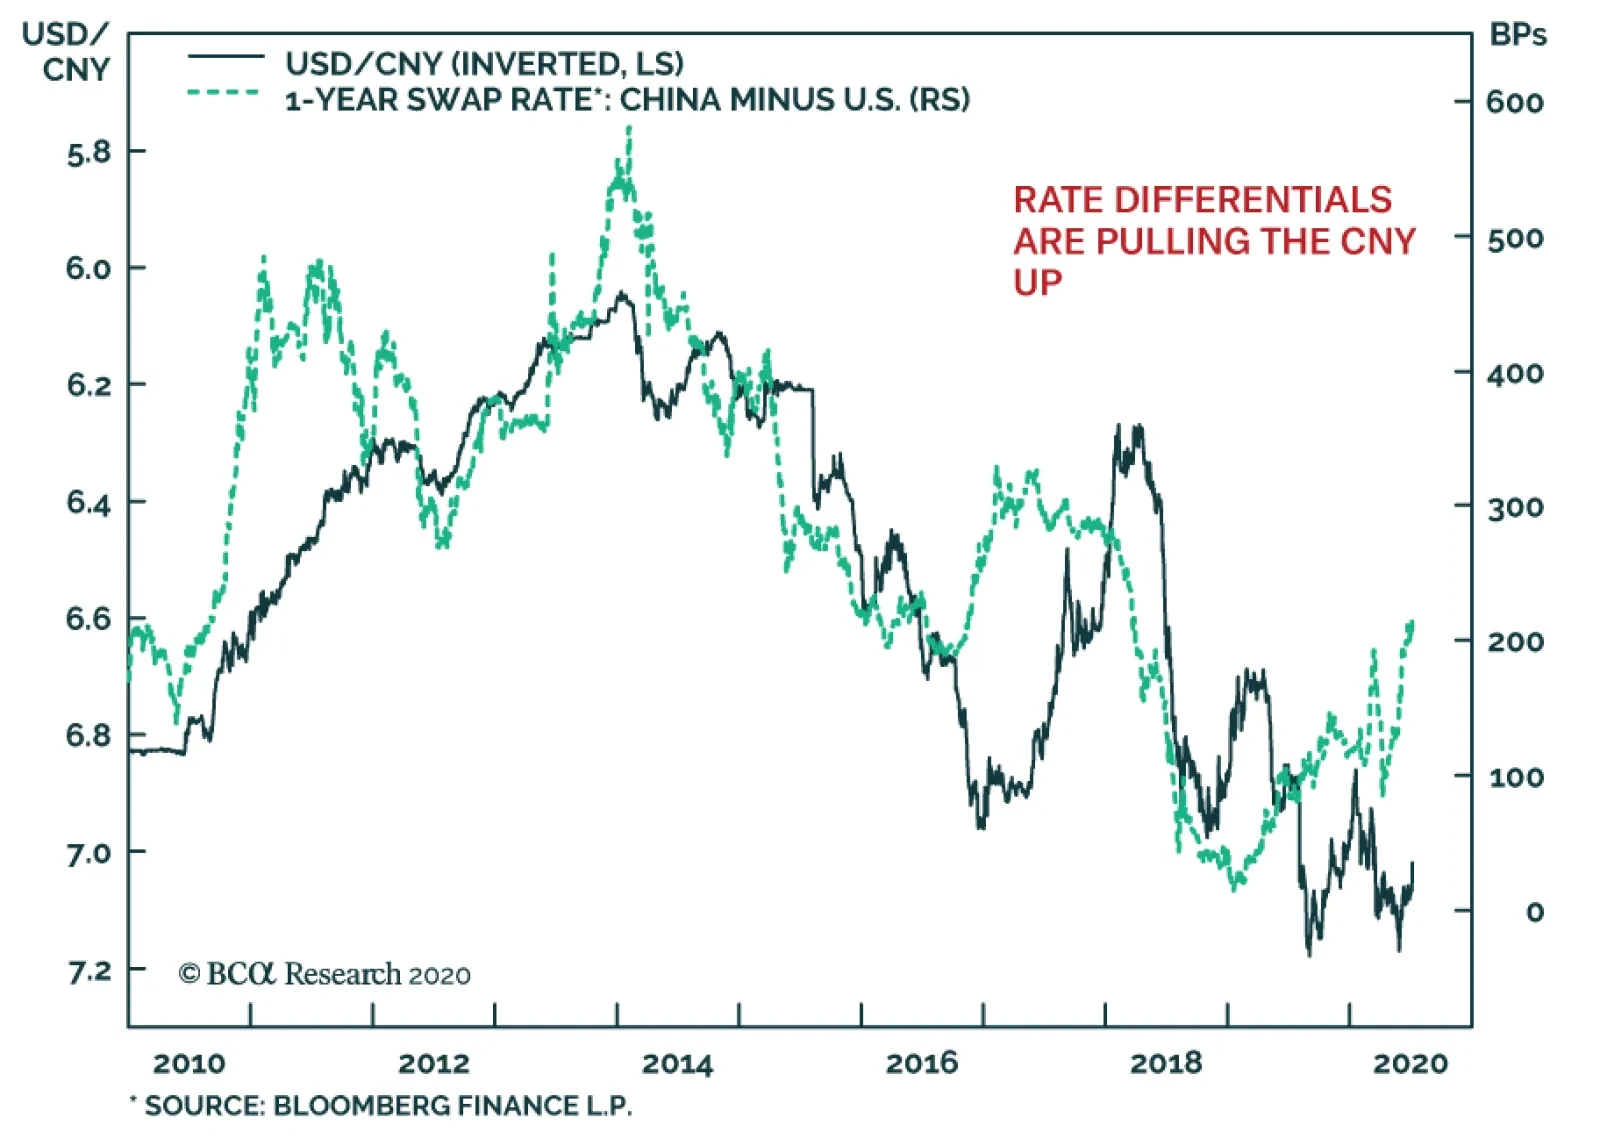
Since March 2018, the Chinese yuan has been driven by geopolitical forces, specifically, the evolution of tariffs imposed by the US on China’s exports. In recent weeks, financial variables seem once again to drive the CNY’s fluctuations. The muted US…
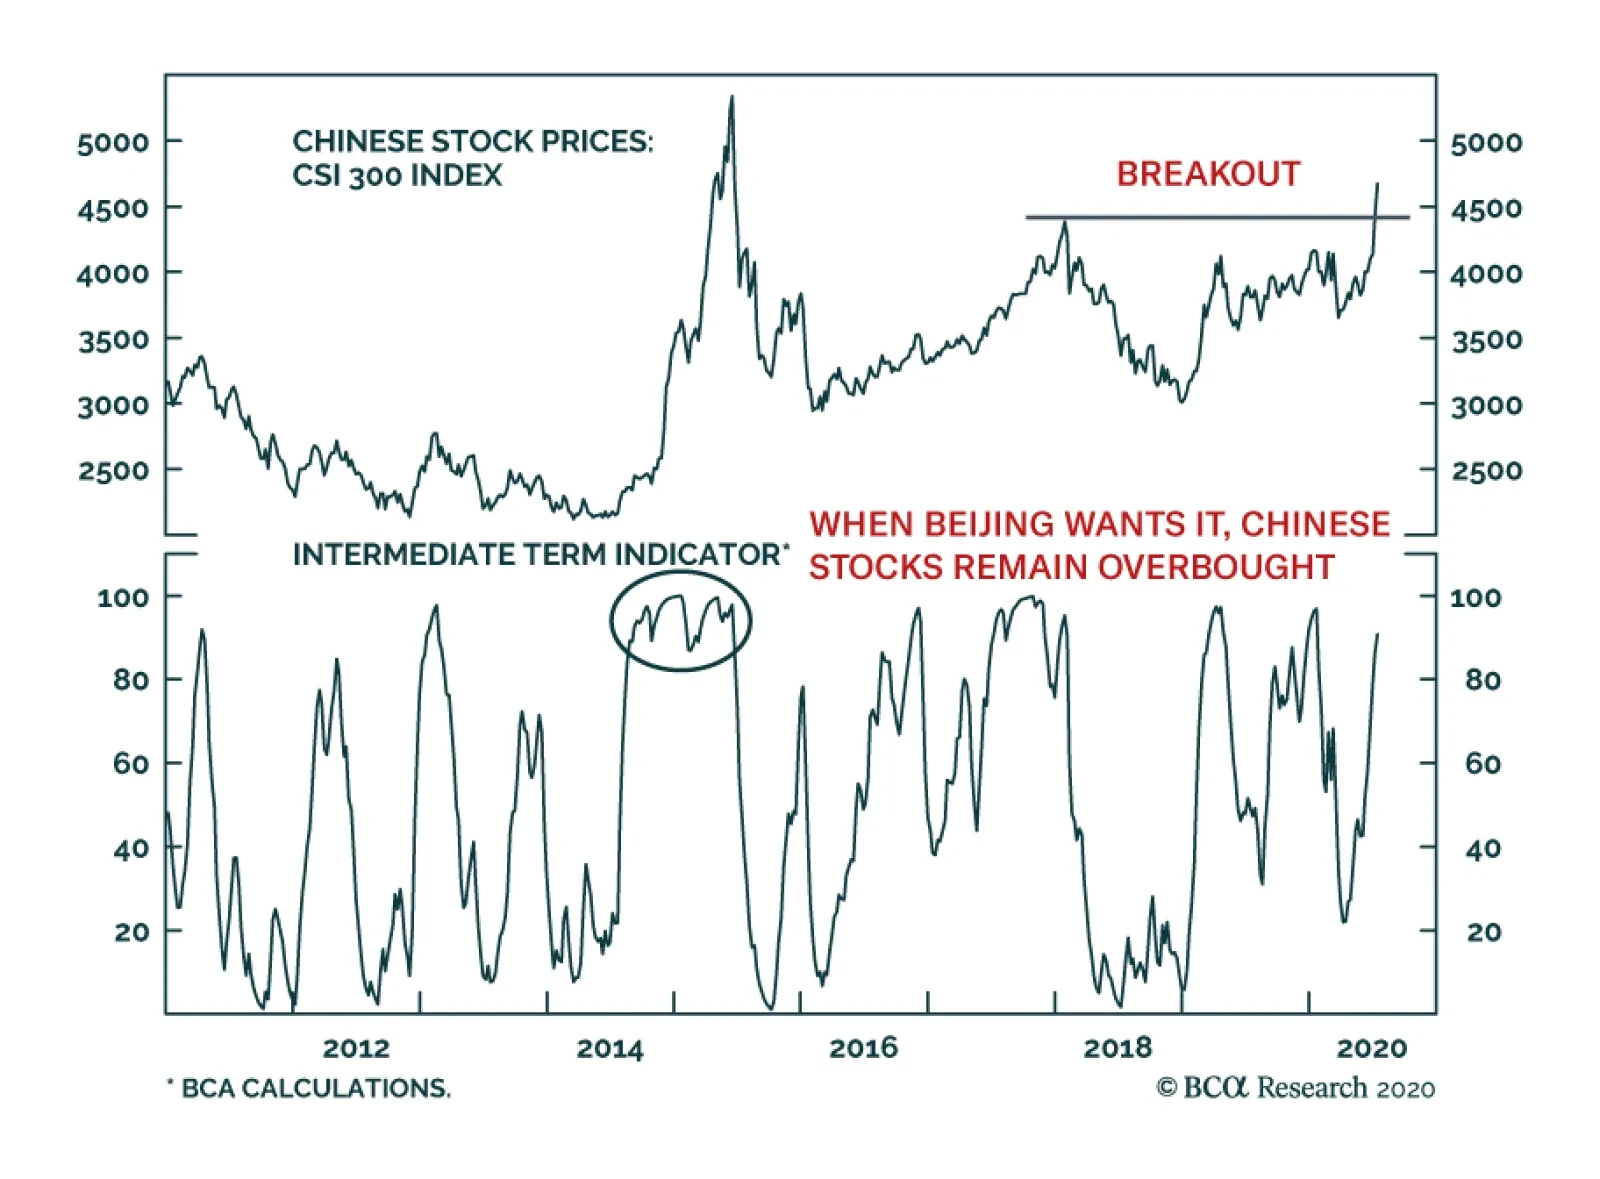
China’s CSI-300 equity index has broken out above its January 2018 peak. BCA Research’s China Investment Strategy team believes this break out has room to run, which should support the relative performance of EM equities. First, the Chinese economy is…
Highlights Theoretically the US could employ a “Reverse Kissinger” strategy – befriend Russia to isolate China or at least prevent the budding Russo-Chinese alliance. But Trump has made no headway in relations with Russia. Meanwhile Democrats now see engagement with Putin as a failure and will pursue a more aggressive policy. Competition in Europe’s natural gas market underscores the broader Russo-American geopolitical confrontation. Russia will likely succeed in preserving its share in the European natural gas market in the medium term, but not in the long run. We remain overweight Russian equities and bonds relative to EM benchmarks, but will downgrade if Biden’s election becomes a foregone conclusion. Feature Investors do not need to wait for the US election verdict to assess the general trajectory of US-Russia relations. Some points are clear regardless of whether President Trump or former Vice President Joe Biden prevails: US-Russia engagement had mostly but not entirely failed between the fall of the Soviet Union in 1991 and President Trump’s election in 2016. President Trump could not break free of the constraints of office and his administration has remained adversarial toward Russia despite his preference for deeper engagement. Whether Democrats or Republicans take the White House in 2021, the result will be confrontation with Russia over the four-year term and likely beyond. The geopolitical risk premium in the Russian ruble will rise relative to its current level. A Trump victory would reduce this risk, but only temporarily. The Failure Of Engagement Russia’s rise from the ashes of the Soviet Union can be illustrated by our Geopolitical Power Index – it shows Russia’s rise relative to the US in terms of demographic, economic, technological, commercial, and military variables that make a nation strong (Chart 1). Chart 1Russia Rose From Soviet Ashes, But Still Lags US
Russia Rose From Soviet Ashes, But Still Lags US
Russia Rose From Soviet Ashes, But Still Lags US
Russia is a shadow of its Soviet self and lags far behind the US in raw capability. But its recovery from the chaos of the 1998 financial crisis, fueled by a global commodity bull market, has consisted of a systematic removal of domestic political constraints. It is politically unified under the personal rule of Putin, has reformed its economy and modernized its military, and has successfully pushed back against the US and the West in its sphere of influence. Russia punches above its economic weight in the world by means of its military, which it has wielded opportunistically in Georgia, Ukraine, Syria, and Libya (Chart 2). Neither the US nor any other power was willing to fill the power vacuum in these locations. A Trump victory only temporarily reduces the rise in Russian geopolitical risk. The US and Russia have a fundamentally antagonistic relationship over influence in Europe and occasionally the Far East. They have little need to trade with each other. They are both large, independent commodity exporters and advanced weapon-makers separated by vast distances. Russia is threatened by the US’s military and technological superiority, its economic strength and newfound status as an energy exporter (see energy section), and its ability to undermine Russian legitimacy in the former Soviet sphere by promoting democracy. Russia’s advantage is that the US is internally divided by political factions. Putin’s popular approval has benefited from his restoration of domestic order and Russia’s standing as a great power. Successive American presidents have floundered under domestic partisanship and polarization (Chart 3). Chart 2Russia’s Military Punches Above Its Economic Weight
US-Russia: No Reverse Kissinger (Yet)
US-Russia: No Reverse Kissinger (Yet)
Chart 3Russia Is Politically Unified, The US is Internally Divided
US-Russia: No Reverse Kissinger (Yet)
US-Russia: No Reverse Kissinger (Yet)
Attempts to “reset” relations have failed.1 The Barack Obama administration’s 2009-11 Reset, announced by Biden, saw several concrete compromises, including the New START treaty and Russia’s joining the WTO. But the Bolotnaya Square protests in 2011-12, at the height of the Arab Spring, rekindled Moscow’s fear that the US aimed to foment “color revolutions” not only in Russia’s periphery but even in Russia itself. Faced with losing its control over Ukraine’s geopolitical orientation, Russia invaded parts of Ukraine and seized Crimea, the first military annexation of territory in Europe since World War II. The US and Europe applied extensive sanctions that last to this day and drag on Russian growth.2 True, Moscow cooperated on the 2015 nuclear deal with Iran. Russia does not want Iran to get nuclear weapons. Yet this is not imminent. And Russia gained global oil market share when the US walked away from the deal and restarted sanctions (Chart 4). Either way, Iran survives as a Russian ally capable of exerting influence across the Middle East. President Trump launched another attempt at engagement with Russia. If there is a strategic basis for this policy – i.e. if it is not just based in Trump’s personal proclivities – then it is the idea of a “Reverse Kissinger” maneuver. During the Cold War, the US befriended Maoist China in order to isolate the Soviet Union. Today, with China posing the clear threat to US hegemony, the US could try to befriend Russia to isolate China or at least prevent the budding Russo-Chinese alliance. The difference is that in 1972, American and Chinese interests were complementary. China wished to stabilize its borders and the US offered geopolitical relief as well as technology and knowhow. Today American and Russian interests are not complementary other than the political convenience of demonizing each other (Chart 5). The US offers Russia limited investment capital; Russia does not offer cheap labor or a vast consumer market. Chart 4Russia’s Oil Market Share Benefitted From Iran Sanctions
US-Russia: No Reverse Kissinger (Yet)
US-Russia: No Reverse Kissinger (Yet)
Chart 5US-Russo Interests Are Not Complementary
US-Russia: No Reverse Kissinger (Yet)
US-Russia: No Reverse Kissinger (Yet)
The Trump administration’s attempt to engage Putin has failed. Putin’s declaration of a global oil market share war this year drove American shale oil companies into bankruptcy during an election year. Barring an “October surprise” engineered by Putin to get Trump reelected, their “alliance” is at best rhetorical and at worst a mirage. Putin might favor Trump because he sharpens US internal divisions, or because he has an isolationist foreign policy preference, but Putin’s actions so far in 2020 suggest a deeper strategic reality: Russia seeks to foment political turmoil in the US, not solidify either of the parties in power, as the latter could backfire against Russia. What Comes After Engagement? Russia lacks the power to create a new world order, but it will continue to leverage its relative power to exercise a veto over affairs in the current global order, in which US influence is weakening. It can hasten the West’s decline by sowing divisions within the West. Chart 6COVID-19 Dented Support For Trump And Putin
US-Russia: No Reverse Kissinger (Yet)
US-Russia: No Reverse Kissinger (Yet)
What happens when US polarization falls and a new political consensus takes shape? This would pose a major threat to Putin’s strategic options. Thus it is relevant if Joe Biden wins the 2020 election with a strong majority and a full Democratic sweep of government. Presidents Trump and Putin, and their political parties, are among the worst performers amid the COVID-19 pandemic and recession (Chart 6). The implication is that Trump will lose the election and Putin will resort to time-tried techniques of confrontation with the West to restore his domestic support. Democrats will pursue a more aggressive policy toward Russia. The Democrats harbor a deep vendetta against Russia over its interference in the 2016 election and will go on the offensive to prevent Russia from trying to undermine their grip on power again. They will also seek to deter Russia from further undermining American strategic interests. Biden will try to revive NATO, expand US troop presence in eastern Europe, and promote democracy and human rights in Russia’s periphery, using the Internet to launch a disinformation campaign against Putin’s regime. Cyber warfare will escalate. A “Reverse Kissinger” is not achievable until Russia feels threatened by China. The silver lining for Russia is economic: Biden’s policies will help to weaken the dollar and cultivate a global growth recovery. Biden will be less inclined to start disruptive Trump-style trade war with China that could permanently damage China’s potential growth or global growth. Chinese imports are essential to propping up Russia’s sluggish economy. In enabling commodity prices to recover, and reducing global policy uncertainty, Biden would inadvertently aid Russian recovery (Chart 7). Chart 7The Silver Lining Of A Biden Presidency For Russia Is A Weaker Dollar
The Silver Lining Of A Biden Presidency For Russia Is A Weaker Dollar
The Silver Lining Of A Biden Presidency For Russia Is A Weaker Dollar
Ultimately Russia is insecure because the US threatens to undermine its economy and political legitimacy both at home and in its strategic buffers. Putin has re-centralized control while shutting out foreign influence. This approach is not changing anytime soon given the recent constitutional changes to prolong Putin’s rule till 2036. Preliminary reports claim that, with 65% of the public voting, these changes were ratified by 76% of the population.3 What changed is that the US is no longer as optimistic about engaging Russia. If anything, its internal divisions will encourage it to go on the offensive. Sanctions may well be expanded before they are eased, the Ukraine conflict could revive rather than simmer down, and new fronts in the conflict could widen, particularly in cyberspace. This is particularly the case if Biden wins the White House in November. The structural, geopolitical risk premium of US-Russia conflict is priced into Russian assets, but there is room for a cyclical increase if Biden is elected. Our market-based Russian geopolitical risk indicators – which define geopolitical risk as excessive ruble weakness relative to its macro context – show that Russian risk is elevated because of COVID-19, but dropping. The US election should reverse this trend, unless Trump wins (Chart 8). Chart 8Russian Geopolitical Risk Set To Increase Even If Trump Re-Elected
Russian Geopolitical Risk Set To Increase Even If Trump Re-Elected
Russian Geopolitical Risk Set To Increase Even If Trump Re-Elected
Alternative measures of political risk that utilize non-market variables support our qualitative assessment, such as the indicator provided by GeoQuant. The implication is that Russian political risk is higher than the market is pricing (Chart 9). Chart 9Market Is Underpricing Russian Political Risk
Market Is Underpricing Russian Political Risk
Market Is Underpricing Russian Political Risk
Kissinger Reversed? Not Yet. If Trump wins, could he not engineer a major détente with Russia? In 2018 the US shifted its national defense strategy to emphasize that “the central challenge to US prosperity and security is the reemergence of long-term, strategic competition,” arguing specifically that “it is increasingly clear that China and Russia want to shape a world consistent with their authoritarian model.4” Yet US geopolitical power has declined such that taking an offensive approach to Russia and China simultaneously is not practicable. If the US pursues the Reverse Kissinger strategy, then it will have to make major concessions to Putin’s Russia. It would need to provide substantial sanctions relief, accept the Crimean annexation, allow a high degree of Russian influence in Donbass (Ukraine), abandon hopes of retribution for the 2016 election interference, ask for a return to the 2015 nuclear deal on Iran at best, and settle for arms control agreements that do not cover new technologies. It is not clear that President Trump would concede this much in a second term, though in most cases he would have the power to do so. Yet Moscow cannot downgrade its cooperation with Beijing by much, since US-Russia détente never lasts long and China weighs more heavily in its economic calculus than the West’s sanctions. Chart 10US-Russo Struggle Is Subordinate To US-Sino Conflict
US-Russia: No Reverse Kissinger (Yet)
US-Russia: No Reverse Kissinger (Yet)
The Democrats, by contrast, are not prepared to make these concessions, particularly on 2016. They are more willing to pursue a gradualist approach in dealing with China, which they believe is less urgent due to shared economic interests.5 If the US confronts Russia, then Russia will draw closer to China. The informal alliance between these two powers is well advanced. A closer association provides China with a better position in waging its long-term geopolitical competition with the United States. Ultimately US grand strategy and public opinion will drive American presidents to take a harder line on China because it rivals the US in economic resilience and technology over the long run (Chart 10). The conflict with Moscow will eventually be subordinate to the US-China struggle. But a “Reverse Kissinger” is not achievable until Russia feels threatened by China, either through its own weakness or Chinese strength. A much stronger trans-Atlantic alliance, or much greater Chinese influence over East Asia and/or the Middle East, could trigger a shift in Russian strategy. We are not there yet. Russia’s cooperation with China will deepen, strengthening China’s hand and making it all the more imperative for the United States to solidify the trans-Atlantic alliance with Europe. Otherwise the risk of a precipitous decline in American power will threaten global stability. Bottom Line: US-Russian antagonism will continue for the foreseeable future. Russian geopolitical risk is underpriced, particularly if Biden wins the election. A Trump victory would offer only a temporary reprieve. Direct Competition In Energy Russia can offer low cost natural gas alongside an existing and projected (under construction) network of pipelines into Europe. This capability will help it to sustain and marginally increase its market share in Europe relative to the US in the medium term. In turn, this will help Russia secure vital revenues for its macro stability. Natural gas exports to Europe represent 2.5% of GDP or 9% of total exports. A Biden presidency is negative for Russian assets, but Russia has room to ease policy. In the long run, however, US LNG will challenge Russia’s share in the European natural gas market. On the whole, the US sees Russia as an economic competitor in the European natural gas market and it will continue to disrupt Russian natural gas exports to Europe through sanctions and/or by other means. A resulting market share war between the US and Russia will lead to low natural gas prices benefitting the consumer, Europe. Competition in Europe’s natural gas market underscores the broader geopolitical confrontation between the US and Russia. The following factors will shape heightened competition: Escalating Competition For European Natural Gas Market Europe will remain a major market for natural gas. The combination of falling domestic production, steady consumption growth and the ongoing structural shift to cleaner sources of energy will require greater imports of natural gas (Chart 11). Critically, Europe’s natural gas consumption might rise faster than its GDP making this market attractive to energy producers. According to the IEA, Europe’s consumption of natural gas will continue to grow at a steady rate over the next 5 years. In a nutshell, European policymakers are promoting cleaner energy such as natural gas over coal and nuclear energy. This push will facilitate rising demand for natural gas. Yet, European natural gas production is expected to drop by 40%, driven by field closures in the Netherlands and the UK. As such, the diverging gap between falling production and steady consumption opens up a space for both Russian and US natural gas exports into the continent. Russia Natural Gas Strategy: Russia and its largest natural gas producer, Gazprom, are aiming to increase their share in the European market from their current 36% to 40% (Chart 12). Chart 11Europe's Nat Gas Imports Will Continue Growing...
Europe's Nat Gas Imports Will Continue Growing...
Europe's Nat Gas Imports Will Continue Growing...
Chart 12...Allowing Russia To Grab Market Share
...Allowing Russia To Grab Market Share
...Allowing Russia To Grab Market Share
Table 1Russia’s Pipeline Export Capacity
US-Russia: No Reverse Kissinger (Yet)
US-Russia: No Reverse Kissinger (Yet)
More specifically, Russia’s latest 2035 strategy (known as ES-2035) reaffirms its two-pronged strategy: (i) continue to provide low-cost natural gas to Europe and Asia through pipelines and (ii) developing LNG export capacity for exports to the Far East. Pipelines: Russia’s export capacity to Europe is set to increase to 190 Bcm/y by 2022 excluding existing transit routes passing through Ukraine (Table 1). Two new sources of pipeline routes will be the Nord Stream2, coming online by the end of this year, and Turk Stream, expected to come online by 2022. These pipelines will have an export capacity of 55 Bcm/y and 31.5/y Bcm, respectively (Map 1). Map 1Russia’s Latest Pipelines Bypass Ukraine
US-Russia: No Reverse Kissinger (Yet)
US-Russia: No Reverse Kissinger (Yet)
Chart 13Russian Natural Gas Exports To Non-CIS Countries
Russian Natural Gas Exports To Non-CIS Countries
Russian Natural Gas Exports To Non-CIS Countries
Meanwhile, pipeline capacity through Ukraine will remain 140 Bcm/y. Ultimately, Russia has been determined to diversify its natural gas transit routes despite pressures from the US.6 In addition, Gazprom natural gas production for transport via pipeline is expected to increase by 35% to 983 Bcm in the next 15 years. The European market is essential to Russia’s export revenues, as it currently represents 56% of Russia’s total gas export volumes compared with 83% total export to non-CIS countries (Chart 13). Lastly, regarding natural gas pricing, Gazprom will continue to move away from oil-indexed long-term contracts to shorter-term spot market contracts. This change of tack will cause deflation in Gazprom’s export prices to Europe but will preserve Russia’s market share in its strategic European market. LNG: Russia will continue to be one the top four LNG producers alongside Qatar, Australia and the US. According to the latest estimates by the IEA, Russian exports of LNG, currently at 39 Bcm, are set to expand by 20% by 2025. The development of the Yamal peninsula into a major natural gas and LNG hub will allow Russia to produce close to 110 Bcm of LNG by 2035, which will constitute 16% of its overall current gas production. This will lead to continued LNG exports to various markets, particularly Europe, which consumes 50% of Russia’s LNG exports. Imported technology from Europe and external financing from China have allowed Novatek, Russia’s second largest natural gas producer, to become the leader in production and exports of LNG. Russia is also investing heavily in liquefaction. It is now fifth globally in liquefaction capacity. There are currently $21 billion in pre-final investment decision (FID) from the LNG Artic 2 in the Yamal that will increase its liquefaction capacity by over 200% by 2026. Lastly, it is estimated that 70-80% of total commodity exporters’ costs are sourced locally and are in rubles due to the import substitution policy adopted by Moscow in 2015. This will alleviate cost pressures arising from a potentially weaker ruble in exploiting the Yamal reserves. US Needs To Find A Market For Its LNG: US produces 920 bcm/y of natural gas but consumes only 830 bcm/y. The rest is available for export. The need to export rising excess of natural gas output puts the US in direct competition with other natural gas exporters such as Russia. Chart 14US LNG Exports To Europe To Rise
US LNG Exports To Europe To Rise
US LNG Exports To Europe To Rise
In the medium term, an oversupplied market alongside the COVID-19-induced demand shock in Europe will reduce European natural gas demand, hurting both the US and Russia. US LNG might lose market share in the European market to Russia due to falling production arising from capex cuts and bankruptcies in the US natural gas sector.7 Yet, in the long run, Europe’s geopolitical ties with the US and strategic interest in diversifying away from Russia make US LNG an obvious area of cooperation. The Trump-Juncker agreement in July 2018 led to a 300% increase in US LNG exports to Europe before the COVID-19 pandemic (Chart 14). Since coming into effect, the agreement also resulted in a doubling of EU utilization of LNG regasification capacity, from 30% to close to 60% in early 2020 and is expected to continue expanding in the years to come. Bottom Line: Russia will likely succeed in at least preserving its share in the European natural gas market in the medium term, but will be challenged by US LNG in the long run. Macro And Financial Market Implications For Russia Chart 15Russia: Low Public Debt Burden
Russia: Low Public Debt Burden
Russia: Low Public Debt Burden
Heightened confrontation with the US and new sanctions on Russia will materialize if Biden wins the presidency. All else constant, this is unfavourable for Russian asset prices. It should be noted, however, that years of fiscal conservativism, tight monetary policy, a prudent and pro-active bank regulatory stance as well as some success in import substitution have given Russia the capacity to offset negative external shocks by easing macro policy: Russia has one of the lowest public debt-to-GDP ratios among the largest countries in the world. Its total public debt stands at 13.5% of GDP (Chart 15). Its external public debt is at a mere 4% of GDP. As in many other countries, Russia’s fiscal deficit is widening sharply due to the pandemic and low oil prices. However, we expect the primary and overall fiscal deficits will be only 4.25% and 5% of GDP in 2020, respectively. So far, at 3.5% of GDP, the announced fiscal stimulus in response to the pandemic has been small by global standards. Russia has room to boost fiscal expenditure substantially this year and in the coming years to offset negative external shocks. The Central Bank still has room to reduce interest rates further. The real policy rate is 2.5% compared with 1% for EM ex-China, Korea and Taiwan (Chart 16, top panel). Russia’s local currency government bond yields offer value: their real yield is 2.5% compared with the EM GBI benchmark real yield of 1.5% (Chart 16, bottom panel). The Central Bank of the Russian Federation will refrain from QE-type policies (i.e., public debt monetization). This is a plus for the ruble relative to other EM currencies where central banks are engaged in QEs. Bank lending rates remain extremely elevated in Russia and local currency credit penetration is reasonably low (Chart 17). Companies and banks’ external indebtedness has declined from $1,200 bn in 2014 to $900 bn currently. Chart 16Russian Real Rates Offer Value
Russian Real Rates Offer Value
Russian Real Rates Offer Value
Chart 17Russia: Real Lending Rates Are Too Elevated!
Russia: Real Lending Rates Are Too Elevated!
Russia: Real Lending Rates Are Too Elevated!
Authorities have cleaned up the banking system. The number of banks has dropped from 1000 in 2010 to 430. Banks have written down and provisioned for a large amount of loans. All of these reduce Russia’s vulnerability to negative shocks. Finally, pressured by US and EU sanctions, Russia has been moderately successful in import substitution as we discussed in a previous report. The nation has expanded its productive capacity, especially in agriculture and some other industries. As a result, it now has more room to deploy fiscal and monetary stimulus to boost demand that will be satisfied by domestic rather than foreign output. In short, fiscal and monetary stimulus will not cause the currency to plunge. On the negative side, the outlook for productivity growth remains lukewarm. Russia’s long-term economic outlook will be characterized by relative stability but low growth, as has been the case in recent years. Combining our geopolitical and macro analysis, two conclusions stand out. First, we remain overweight Russian equities as well as both local currency and US dollar bonds relative to their EM benchmarks. If Trump stages a comeback over the next four months, which is not impossible, then the geopolitical risk premium will continue to fall. Trump would offer a reprieve in tensions for a year or two. Second, the US election threatens this view because Joe Biden is currently heavily favoured to beat Trump and if he does, he is likely to impose fresh sanctions on Russia, possibly as early as 2021. Therefore, if Biden’s election becomes a foregone conclusion, we will downgrade Russian assets. Matt Gertken Vice President Geopolitical Strategist mattg@bcaresearch.com Andrija Vesic Associate Editor andrijav@bcaresearch.com Footnotes 1 Michael McFaul, From Cold War To Hot Peace: The Inside Story of Russia and America (London: Penguin, 2018). 2 International Monetary Fund, “Russian Federation: 2019 Article IV Consultation,” IMF Country Report 19/260 (August 2019). 3 Ann M. Simmons and Georgi Kantchev, “Russians Vote for Overhaul That Could Keep Putin in Power Until 2036,” Wall Street Journal, July 1, 2020. 4 “Summary of the 2018 National Defense Strategy of the United States of America: Sharpening The American Military’s Competitive Edge,” Department of Defense, 2018. 5 Victoria Nuland, “Pinning Down Putin: How A Confident America Should Deal With Russia,” Foreign Affairs, July/August 2020. 6 The US has tried to stop Russia’s expansion of pipelines into Europe in the past. Evidenced from both Kennedy and Reagan administration policies directed towards the building of the Friendship oil pipeline in the 1960s and the Brotherhood gas pipeline in the 1980s, respectively. In response, Russia began developing its own technological capacity through import substitution, hurting western firms in the process. 7 "U.S. natural gas giant Chesapeake Energy goes bankrupt,” CBC, June 29, 2020.
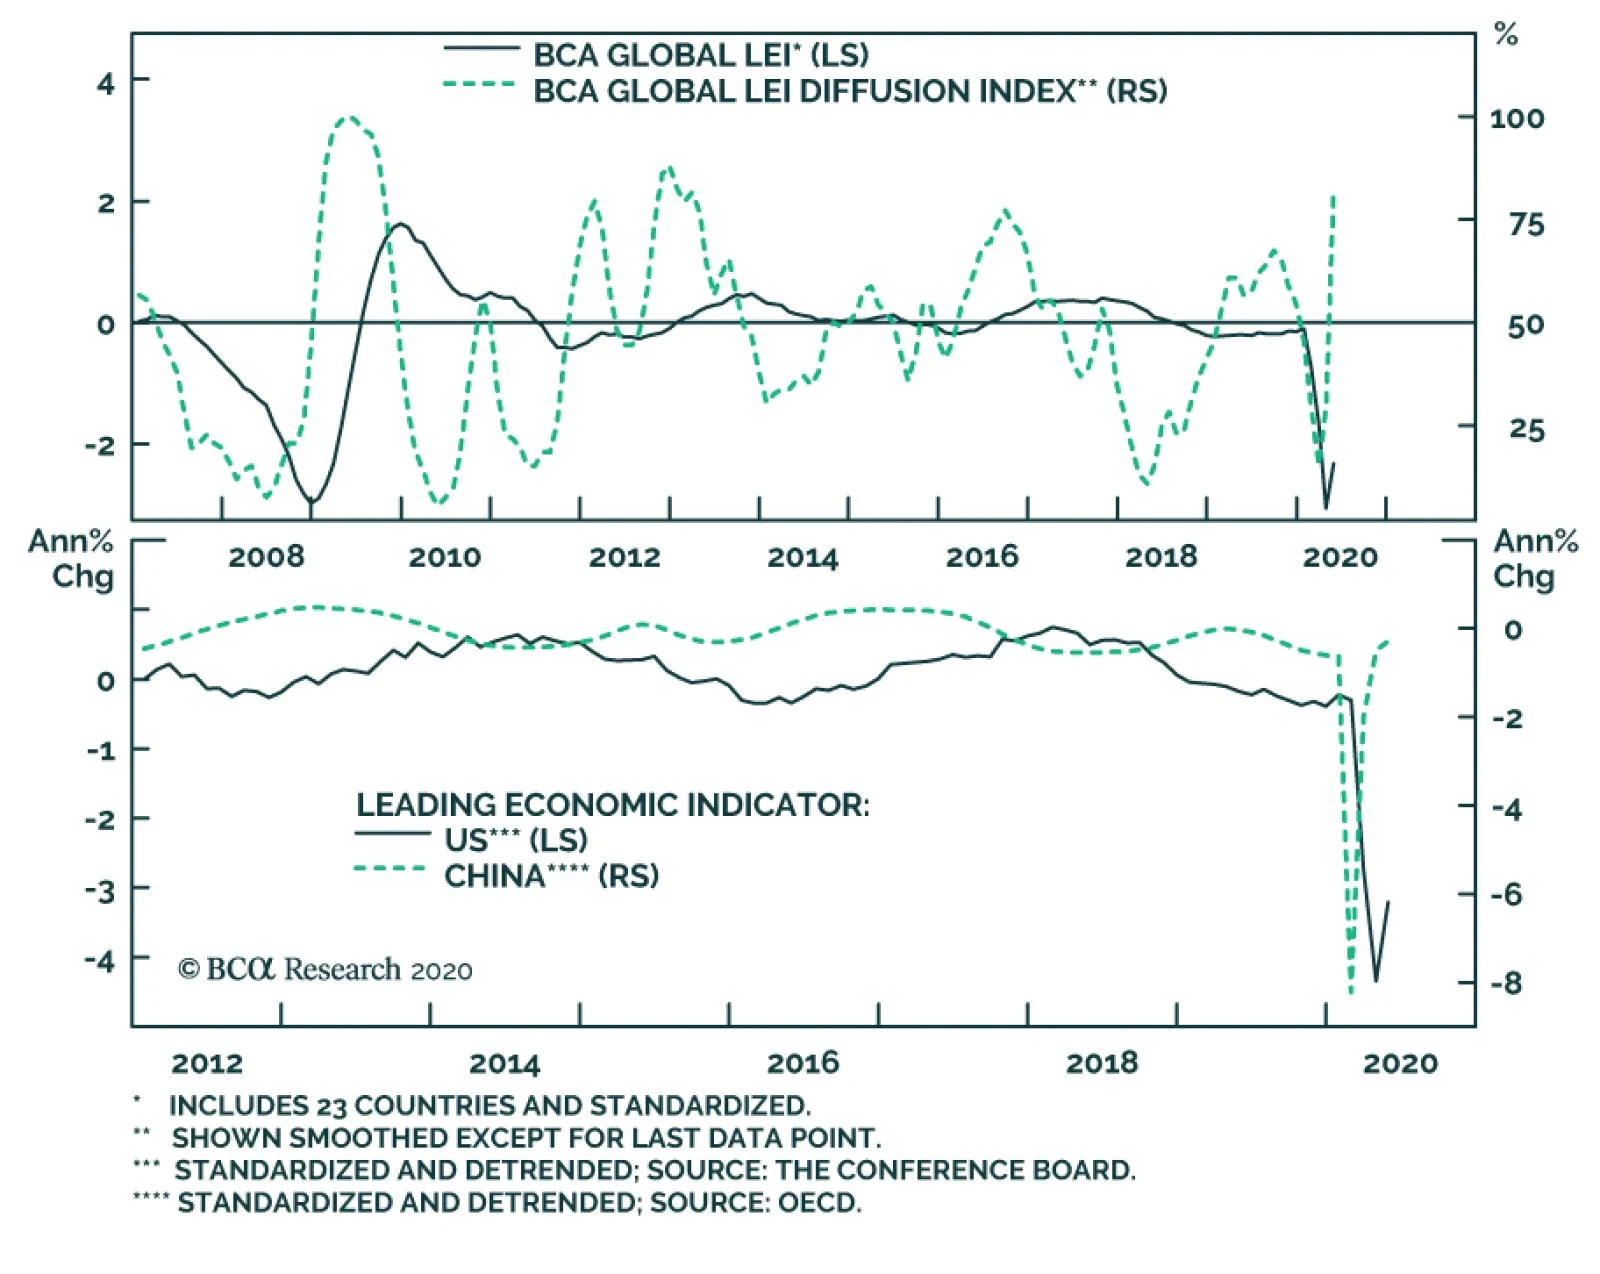
BCA’s Leading Economic Indicator (LEI) rebounded in May suggesting economic fundamentals are rapidly improving. Of the 23 countries included in the indicator, 80% saw an improvement in economic activity vs. last month. This points to further improvement in…
BCA Research's China Investment Strategy service is upgrading Chinese stocks on a tactical horizon and bringing it in line with its cyclical overweight stance. Chinese stocks have fewer downside risks compared to their global counterparts, which were…
Highlights We are moving our tactical call on Chinese stocks from neutral to overweight, bringing it inline with our cyclical stance on Chinese equities. Our cyclical overweight stance is supported by several factors: the rate of recovery in China’s economy and corporate profits should outpace the rest of the world in the next 9-12 months and valuations in Chinese stocks are relatively cheap. In the near term, compared with the tug-of-war in the US between resuming business activities and containing a second COVID-19 wave, China has a lower risk of a major second wave and re-lockdown of its economy. The recent request by China’s central government for banks to forgo a large portion of this year’s profits should have very limited effect on China’s overall stock performance. Feature Chinese stocks have fewer downside risks compared to their global counterparts, which were buffeted this past week by escalating COVID-19 case counts in the US and a slower global economy recovery according to IMF estimates. Chart 1Overweight Chinese Stocks
Overweight Chinese Stocks
Overweight Chinese Stocks
We have been tactically neutral on Chinese stocks since early April, due to heightened uncertainties about the path of the global pandemic and geopolitical tensions between the US and China.1 These uncertainties remain in place. Nevertheless, against the backdrop of a bleak outlook in normalizing global economic activity, the pandemic containment in China has been relatively successful and the nation’s economic outlook is slightly more positive. This argues for overweighting Chinese stocks in a global equity portfolio, on both tactical (0-3 months) and cyclical (6-12 months) time horizons (Chart 1). We are initiating two new trades: long Chinese stocks versus global benchmarks, in both onshore and offshore equity markets. At its June 17th State Council meeting, China’s central government asked that commercial banks give up 1.5 trillion yuan in profits and cap profit growth below 10% this year to support the real economy. While this rare government request may further depress the banking sector’s stock performance, we think its negative impact on China’s overall stock market will be minimal. Furthermore, the request should help to lower corporate financing costs - including the private sector and small businesses – and, therefore, help bolster corporate marginal propensity to invest. The net result will be positive on both China’s economic recovery and overall stock performance in the medium term. Better Than The Rest Compared to the rest of the world, Chinese stocks should be supported by a more positive economic outlook and relatively cheaper valuations in the next 9 to 12 months. Chart 2China May Return To Its Trend Growth In 2021
Upgrading Chinese Stocks To Overweight
Upgrading Chinese Stocks To Overweight
The IMF has downgraded its 2020 global economic growth projection to -4.9% from April’s -3%. According to the IMF’s baseline scenario, China is the only major economy that will still register positive growth this year, albeit very modest. This contrasts with an 8% growth contraction in developed nations and a 4.6% retrenchment in emerging economies excluding China. The IMF estimate also suggests that China’s level of economic output in 2021 will rise above its 2019 level, whereas the US and European GDP levels will remain below their pre-COVID 19 levels (Chart 2). If the global economy recovers at a slower-than-expected rate in the second half of this year, then there will be spillover effects on China through reduced demand for its goods. The IMF projected that global trade will shrink by nearly 12% this year (Chart 3). However, compared with Europe and a majority of EM economies, China’s economy is dominated by domestic rather than external demands (Chart 4). Moreover, a weaker external environment means that Chinese authorities will have to press on the stimulus pedal to avoid an outright growth contraction this year. Chart 3Global Trade Will Remain Depressed This Year...
Global Trade Will Remain Depressed This Year...
Global Trade Will Remain Depressed This Year...
Chart 4...But The Chinese Economy Has Become Less Reliant On External Demand
...But The Chinese Economy Has Become Less Reliant On External Demand
...But The Chinese Economy Has Become Less Reliant On External Demand
Industrial profit growth turned positive in May, the first year-over-year increase in 2020. On a year-to-date basis, industrial profits remain in deep contraction (Chart 5). As aggressive credit and fiscal stimulus works its way into the economy, however, we expect China’s industrial profits and GDP to turn modestly positive for the entire year of 2020. Positive annual expansion in China’s industrial profits, even if small, supports a recovery in corporate earnings and stock prices. Chart 5Industrial Profit Growth Should Pick Up Along With The Economy
Industrial Profit Growth Should Pick Up Along With The Economy
Industrial Profit Growth Should Pick Up Along With The Economy
Valuations in Chinese stocks have also become less expensive. Similar to the US and elsewhere, Chinese stock prices have trended upwards ahead of a corporate earnings recovery. Nevertheless, compared with other major economies, Chinese stocks have not diverged from its economic fundamentals as drastically as other major economies (Chart 6). Moreover, Chinese stocks are not traded at extreme multiples as experienced in previous cycles (Chart 7). Chart 6China's Stock Market Rally Less Decoupled From Economic Fundamentals
China's Stock Market Rally Less Decoupled From Economic Fundamentals
China's Stock Market Rally Less Decoupled From Economic Fundamentals
Chart 7Valuations in Chinese Stocks Are Not As Extended As In Previous Cycles
Valuations in Chinese Stocks Are Not As Extended As In Previous Cycles
Valuations in Chinese Stocks Are Not As Extended As In Previous Cycles
Bottom Line: China’s economic outlook for this year and next is better than the rest of the world, while its stocks are currently less overbought. This supports our positive view on Chinese stocks on a cyclical time frame. Lower Near-Term Risks China has been relatively successful in controlling its domestic infection rate compared with the uncertain path of virus containment in the US and most EM economies (Chart 8). China’s steady return to normalcy in business activities warrants a change in our tactical investment call on Chinese stocks from neutral to overweight. Chart 8Mind The Gap
Upgrading Chinese Stocks To Overweight
Upgrading Chinese Stocks To Overweight
China has seen a flare up in domestically transmitted cases since June 11, after successfully containing the virus and reporting only single-digit new cases for nearly two months. However, the new cases have not had any meaningful impact on China’s returning to normalcy in domestic business or consumer activities. This is in sharp contrast with the US where a resurgence in infection rates last week threatened a potential rollback in economic re-openings and the need to increase social distance measures (Chart 9). Indeed, several states in the US have responded to the second wave of virus spread by slowing or stalling reopening efforts. The ongoing tug-of-war between normalizing economic activities and containing the pandemic challenges the sustainability of the US stock rally that started in late March. China’s new COVID cases are concentrated in Beijing and the number of daily new infections has been limited to double digits (Chart 10). Instead of imposing a blanket lockdown as was done in late January and February, the Beijing government has only locked down a few high-risk districts. In the past two weeks the municipal government has also drastically expanded its testing to more than one-third of its 21 million residents, and promptly traced and isolated close contacts of infected people. Chart 9Running Ahead Of Itself?
Running Ahead Of Itself?
Running Ahead Of Itself?
Chart 10Beijing Quickly Brought New Case Numbers Down To Low Double-Digits
Upgrading Chinese Stocks To Overweight
Upgrading Chinese Stocks To Overweight
China’s authoritative style of containing the pandemic leaves little room for error. The chance is slim that the Chinese government will allow the number of infections, if any were to pop up, to manifest into a major second wave and derail its economic recovery. However, the US will undoubtedly experience some hiccups in the near term as it struggles to contain the virus and reopen its economy. Bottom Line: The near-term risk to China’s economic recovery due to a second wave of infections is lower relative to the rest of the world. A Few Words On Chinese Banks The central government’s request that commercial banks “sacrifice” 1.5 trillion yuan in profits this year will likely further depress the banking sector’s stock performance. However, it should have a limited negative impact on the performance of aggregate Chinese equities for the following reasons: The banking sector currently accounts for around 10% of market caps in both China's onshore and offshore equity markets, limiting the downside risks to the broad market from the sector’s price declines. The tech sector2 has been driving the overall stock performance in both China’s onshore and offshore equity markets (Chart 11). Chinese banks’ market capitalization as a share of the total broad market caps has declined in recent years, while the share of the tech sector has risen substantially (Chart 12). Chart 11The Tech Sector Has Been Driving Chinese Stock Performance Since 2016
The Tech Sector Has Been Driving Chinese Stock Performance Since 2016
The Tech Sector Has Been Driving Chinese Stock Performance Since 2016
Chart 12Banking Sector's Share Of Broad Market Has Been Declining
Banking Sector's Share Of Broad Market Has Been Declining
Banking Sector's Share Of Broad Market Has Been Declining
Unlikely its global peers, banking sector's relative performance in both China’s domestic and offshore equity markets are countercyclical; periods of outperformance in banking stocks have been negatively related to rising economic activity and broad market stock prices.3 In other words, China’s banking sector underperforms during an economic recovery. It has been underperforming the broad indexes in both the domestic and investable markets since mid-2018, regardless the sector’s profit growth (Chart 13A and 13B). Chart 13ARegardless Of Profit Growth...
Regardless Of Profit Growth...
Regardless Of Profit Growth...
Chart 13B...The Banking Sector Underperformed During Economic Recoveries
...The Banking Sector Underperformed During Economic Recoveries
...The Banking Sector Underperformed During Economic Recoveries
Banks will give up a large portion of this year's profits by offering lower lending rates, cutting fees, deferring loan repayments and granting more unsecured loans to small businesses. Based on our calculations, banks will achieve the 1.5 trillion yuan goal by either lowering their average lending rate by 20bps and/or by expanding loan growth by 15% in the 2nd half of 2020 from last year (Table 1). Both measures will benefit China’s real economy and corporate profits, as well as help to bolster corporate marginal propensity to invest. The net result will be positive on overall stock performance in the medium term. Table 1Scenarios On How Banks Will Make Up For The 1.5 Trillion Profit “Sacrifice”
Upgrading Chinese Stocks To Overweight
Upgrading Chinese Stocks To Overweight
Bottom Line: China’s banking sector will continue to underperform, but the impact from a profit reduction this year should have a limited negative impact on Chinese equities. The benefit of a “wealth transfer” from banks to the real economy, however, should more than offset the banking sector’s drag on Chinese stocks. Jing Sima China Strategist jings@bcaresearch.com Footnotes 1 Please see China Investment Strategy Weekly Report "Investing During A Global Pandemic," dated April 1, 2020, available at cis.bcaresearch.com 2 Please see the footnote in Chart 12 for the tech-related sectors included in China's offshore market and the TMT Index in the A-share market. 3 Please see China Investment Strategy Special Report "A Guide To Chinese Domestic Equity Sector Performance," dated November 27, 2019, available at cis.bcaresearch.com Cyclical Investment Stance Equity Sector Recommendations
Highlights Economic shocks in recent decades have led to surges in nationalism and the COVID-19 crisis is unlikely to be different. Nationalism adds to the structural challenges facing globalization, which is already in retreat. Investors face at least a 35% chance that President Trump will be reelected and energize a nationalist and protectionist agenda that is globally disruptive. China is also indulging in nationalism as trend growth slows, raising the probability of a clash with the US even if Trump does not win. US-China economic decoupling will present opportunities as well as risks – primarily for India and Southeast Asia. Feature Since the Great Recession, investors have watched the US dollar and US equities outperform their peers in the face of a destabilizing world order (Chart 1). Chart 1US Outperformance Amid Global Disorder
US Outperformance Amid Global Disorder
US Outperformance Amid Global Disorder
Global and American economic policy uncertainty has surged to the highest levels on record. Investors face political and geopolitical power struggles, trade wars, a global pandemic and recession, and social unrest. How will these risks shape up in the wake of COVID-19? First, massive monetary and fiscal stimulus ensure a global recovery but they also remove some of the economic limitations on countries that are witnessing a surge in nationalism. Second, nationalism creates a precarious environment for globalization – namely the wave of “hyper-globalization” since 2000. Nationalism and de-globalization do not depend on the United States alone but rather have shifted to the East, which means that geopolitical risks will remain elevated even if the US presidential election sees a restoration of the more dovish Democratic Party. Economic Shocks Fuel Nationalism’s Revival Nationalism is the idea that the political state should be made up of a single ethnic or cultural community. While many disasters have resulted from this idea, it is responsible for the modern nation-state and it has enabled democracies to take shape across Europe, the Americas, and beyond. Industrialization is also more feasible under nationalism because cultural conformity helps labor competitiveness.1 At the end of the Cold War, transnational communist ideology collapsed and democratic liberalism grew complacent. Each successive economic shock or major crisis has led to a surge in nationalism to fill the ideological gaps that were exposed. For instance, various nationalists and populists emerged from the financial crises of the late 1990s. Russian President Vladimir Putin sought to restore Russia to greatness in its own and other peoples’ eyes (Chart 2). Not every Russian adventure has mattered for investors, but taken together they have undermined the stability of the global system and raised barriers to exchange. The invasion of Crimea in 2014 and the interference in the US election in 2016 helped to fuel the rise in policy uncertainty, risk premiums in Russian assets, and safe havens over the past decade. The September 11, 2001 terrorist attacks in the United States created a surge in American nationalism (Chart 3). This surge has since collapsed, but while it lasted the US destabilized the Middle East and provided Russia and China with the opportunity to pursue a nationalist path of their own. Investors who went long oil and short the US dollar at this time could have done worse. Chart 2The Resurgence Of Russian Nationalism
Nationalism And Globalization After COVID-19
Nationalism And Globalization After COVID-19
Chart 3USA: From Nationalism To Anti-Nationalism
Nationalism And Globalization After COVID-19
Nationalism And Globalization After COVID-19
The 2008 crisis spawned new waves of nationalist feeling in countries such as China, Japan, the UK, and India (Chart 4). Conservatives of the majority cultural group rose to power, including in China, where provincial grassroots members of the elite reasserted the Communist Party’s centrality. Japan and India became excellent equity investment opportunities in their respective spheres, while the UK and China saw their currencies weaken. The rising number of wars and conflicts across the world since 2008 reflects the shift toward nationalism, whether among minority groups seeking autonomy or nation-states seeking living space (Chart 5). Chart 4Nationalist Trends Since The Great Recession
Nationalism And Globalization After COVID-19
Nationalism And Globalization After COVID-19
Chart 5World Conflicts Rise After Major Crises
Nationalism And Globalization After COVID-19
Nationalism And Globalization After COVID-19
COVID-19 is the latest economic shock that will feed a new round of nationalism. At least 750 million people are extremely vulnerable across the world, mostly concentrated in the shatter belt from Libya to Turkey, Iran, Pakistan, and India.2 Instability will generate emigration and conflict. Once again the global oil supply will be at risk from Middle Eastern instability and the dollar will eventually fall due to gargantuan budget and trade deficits. Today’s shock will differ, however, in the way it knocks against globalization, a process that has already begun to slow. Specifically, this crisis threatens to generate instability in East Asia – the workshop of the world – due to the strategic conflict between the US and China. This conflict will play out in the form of “proxy battles” in Greater China and the East Asian periphery. The dollar’s recent weakness is a telling sign of the future to come. In the short run, however, political and geopolitical risks are acute and will support safe havens. Globalization In Retreat Nationalism is not necessarily at odds with globalization. Historically there are many cases in which nationalism undergirds a foreign policy that favors trade and eschews military intervention. This is the default setting of maritime powers such as the British and Dutch. Prior to WWII it was the American setting, and after WWII it was the Japanese. Over the past thirty years, however, the rise of nationalism has generally worked against global trade, peace, and order. That’s because after WWII most of the world accepted internationalist ideals and institutions promoted by the United States that encouraged free markets and free trade. Serious challenges to that US-led system are necessarily challenges to global trade. This is true even if they originate in the United States. Globalization has occurred in waves continuously since the sixteenth century. It is not a light matter to suggest that it is experiencing a reversal. Yet the best historical evidence suggests that global imports, as a share of global output, have hit a major top (Chart 6).3 The line in this chart will fall further in 2020. American household deleveraging, China’s secular slowdown, and the 2014 drop in oil and commodities have had a pervasive impact on the export contribution to global growth. Chart 6Globalization Hits A Major Top
Globalization Hits A Major Top
Globalization Hits A Major Top
The next upswing of the business cycle will prompt an increase in trade in 2021. Global fiscal stimulus this year amounts to 8% of GDP and counting. But will the import-to-GDP ratio surpass previous highs? Probably not anytime soon. It is impossible to recreate America’s consumption boom and China’s production boom of the 1980s-2000s with public debt alone. Global trend growth is slowing. Isn’t globalization proceeding in services, if not goods? The world is more interconnected than ever, with nearly half of the population using the Internet – almost 30% in Sub-Saharan Africa. One in every two people uses a smartphone. Eventually the pandemic will be mitigated and global travel will resume. Nevertheless, the global services trade is also facing headwinds. And it requires even more political will to break down barriers for services than it does for goods (Chart 7). The desire of nations to control and patrol cyber space has resulted in separate Internets for authoritarian states like Russia and China. Even democracies are turning to censorship and content controls to protect their ideologies. Chart 7Both Goods And Services Face Headwinds
Both Goods And Services Face Headwinds
Both Goods And Services Face Headwinds
Political demands to protect workers and industries are gaining ground. Policymakers in China and Russia have already shifted back toward import substitution; now the US and EU are joining them, at least when it comes to strategic sectors (health, defense). Nationalists and populists across the emerging world will follow their lead. Regional and wealth inequalities are driving populations to be more skeptical of globalization. GDP per capita has not grown as fast as GDP itself, a simple indication of how globalization does not benefit everyone equally even though it increases growth overall (Chart 8). Inequality is a factor not only because of relatively well-off workers in the developed world who resent losing their job or earning less than their neighbors. Inequality is also rife in the developing world where opportunities to work, earn higher wages, borrow, enter markets, and innovate are lacking. Over the past decade, emerging countries like Brazil, Indonesia, Mexico, and South Africa have seen growing skepticism about whether foreign openness creates jobs or lifts wages.4 Immigration is probably the clearest indication of the break from globalization. The United States and especially the European Union have faced an influx of refugees and immigrants across their southern borders and have resorted to hard-nosed tactics to put a stop to it (Chart 9). Chart 8Global Inequality Fuels Protectionism
Nationalism And Globalization After COVID-19
Nationalism And Globalization After COVID-19
Chart 9US And EU Crack Down On Immigration
Nationalism And Globalization After COVID-19
Nationalism And Globalization After COVID-19
There is zero chance that these tough tactics will come to an end anytime soon in Europe, where the political establishment has discovered a winning combination with voters by promoting European integration yet tightening control of borders. This combination has kept populists at bay in France, Italy, the Netherlands, Spain, and Germany. A degree of nationalism has been co-opted by the transnational European project. In the US, extreme polarization could cause a major change in immigration policy, depending on the election later this year. But note that the Obama administration was relatively hawkish on the border and the next president will face sky-high unemployment, which discourages flinging open the gates. Reduced immigration will weigh on potential GDP growth and drive up the wage bill for domestic corporations. If nationalism continues to rise and to hinder the movement of people, goods, capital, and ideas, then it will reduce the market’s expectations of future earnings. American Nationalism Still A Risk The United States is experiencing a “Civil War Lite” that may take anywhere from one-to-five years to resolve. The November 3 presidential election will have a major impact on the direction of nationalism and globalization over the coming presidential term. If President Trump is reelected – which we peg at 35% odds – then American nationalism and protectionism will gain a new lease on life. Other nations will follow the US’s lead. If Trump fails, then nationalism will likely be driven by external forces, but protectionism will persist in some form. Chart 10Trump Is Not Yet Down For The Count
Nationalism And Globalization After COVID-19
Nationalism And Globalization After COVID-19
Investors should not write Trump off. If the election were held today, Trump would lose, but the election is still four months away. His national approval rating has troughed at a higher level than previous troughs. His disapproval rating has spiked but has not yet cleared its early 2019 peak (Chart 10).5 This is despite an unprecedented deluge of bad news: universal condemnation from Democrats and the media, high-profile defections from fellow Republicans and cabinet members, stunning defeats at the Supreme Court, and scathing rebukes from top US army officers. If Trump’s odds are 35% then this translates to a 35% chance that the United States will continue pursuing globally disruptive “America First” foreign and trade policies in the 2020-24 period. First Trump will attempt to pass a Reciprocal Trade Act to equalize tariffs with all trading partners. Assuming Democrats block it in the House of Representatives, he will still have sweeping executive authority to levy tariffs. He will launch the next round in the trade war with China to secure a “Phase Two” trade deal, which will be tougher because it will be focused on structural reforms. He could also open new fronts against the European Union, Mexico, and other trade surplus countries. By contrast, these risks will melt away if Biden is elected. Biden would restore the Obama administration’s approach of trade favoritism toward strategic allies and partners, such as Europe and the members of the Trans-Pacific Partnership, but only occasional use of tariffs. Biden would work with international organizations like the World Trade Organization. His foreign policy would also open up trade with pariah states like Iran, reducing the tail-risk of a war to almost zero. Biden would be tougher on China than Presidents Obama or Bill Clinton, as the consensus in Washington is now hawkish and Biden would need to keep the blue-collar voters he won back from Trump. He may keep Trump’s tariffs in place as negotiating leverage. But he is less likely to expand these tariffs – and there is zero chance he will use them against Europe. At the same time, it will take a year or more to court the allies and put together a "coalition of the willing" to pressure China on structural reforms and liberalization. China would get a reprieve – and so would financial markets. Thus investors have a roughly 65% chance of seeing US policy “normalize” into an internationalist (not nationalist) approach that reduces the US contribution to trade policy uncertainty and geopolitical risk over the next few years at minimum. But there are still four months to go before the election; these odds can change, and equity market volatility will come first. Moreover a mellower US would still need to react to nationalism in Asia. European Nationalism Not A Risk (Yet) European nationalism has reemerged in recent years but has greatly disappointed the prophets of doom who expected it to lead to the breakup of the European Union. The southern European states suffered the most from COVID-19 but many of them have made their decision regarding nationalism and the supra-national EU. Greece underwent a depression yet remained in the union. Italians could easily elect the right-wing anti-establishment League to head a government in the not-too-distant future. But there is no appetite for an Italian exit. Brexit is the grand exception. If Trump wins, then the UK and British Prime Minister Boris Johnson will be seen as the vanguard of the revival of nationalism in the West. If Trump loses, English nationalism will appear an isolated case that is constrained by its own logic given the response of Scottish nationalism (Chart 11). The trend in the British Isles would become increasingly remote from the trends in continental Europe and the United States. The majority of Europeans identify both as Europeans and as their home nationality, including majorities in countries like Greece, Italy, France, and Austria where visions of life outside the union are the most robust (Chart 12). Even the Catalonians are focused on options other than independence, which has fallen to 36% support. Eastern European nationalists play a careful balancing game of posturing against Brussels yet never drifting so far as to let Russia devour them. Chart 11English Versus Scottish Nationalism
English Versus Scottish Nationalism
English Versus Scottish Nationalism
Chart 12European Nationalism Is Limited (For Now)
European Nationalism Is Limited (For Now)
European Nationalism Is Limited (For Now)
Europeans have embraced the EU as a multi-ethnic confederation that requires dual allegiances and prioritizes the European project. COVID-19 has so far reinforced this trend, showing solidarity as the predominant force, and much more promptly than during the 2011 crisis. It will take a different kind of crisis to reverse this trend of deeper integration. European nationalists would benefit from another economic crash, a new refugee wave from the Middle East, or conflict with Turkish nationalism. The latter is already burning brightly and will eventually flame out, but not before causing a regional crisis of some kind. European policymakers are containing nationalism by co-opting some of its demands. The EU is taking steps to guard against globalization, particularly on immigration and Chinese mercantilism. The lack of nationalist uprisings in Europe do not overthrow the contention that globalization is slowing down. Europe can become more integrated at home while maintaining the higher barriers against globalization that it has always maintained relative to the UK and United States. Chinese Nationalism The Biggest Risk The nationalist risk to globalization is most significant in East Asia and the Pacific, where Chinese nationalism continues the ascent that began with the Great Recession. China’s slowdown in growth rates has weakened the Communist Party’s confidence in the long-term viability of single-party rule. The result has been a shift in the party line to promote ideology and quality of life improvements to compensate for slower income gains. Xi Jinping’s governing philosophy consists of nationalist territorial gains, promoting “the China Dream” for the middle class, and projecting ambitious goals of global influence by 2035 and 2049. The result has been a clash between mainland Chinese and peripheral Chinese territories – especially Hong Kong and Taiwan (Chart 13). The turn away from Chinese identity in these areas runs up against their economic interest. It is largely a reaction to the surge in mainland nationalist sentiment, which cannot be observed directly due to the absence of reliable opinion polling. Chart 13Chinese Nationalism On The Mainland, Anti-Nationalism In Periphery
Nationalism And Globalization After COVID-19
Nationalism And Globalization After COVID-19
The conflict over identity in Greater China is perhaps the world’s greatest geopolitical risk. While Hong Kong has no conceivable alternative to Beijing’s supremacy, Taiwan does. The US is interested in reviving its technological and defense relationship with Taiwan now that it seeks to counterbalance China. Chart 14Taiwan: Epicenter Of US-China Cold War
Nationalism And Globalization After COVID-19
Nationalism And Globalization After COVID-19
Beijing may be faced with a technology cordon imposed by the United States, and yet have the option of circumventing this cordon via Taiwan’s advanced semiconductor manufacturing. Taiwan’s “Silicon Shield” used to be its security guarantee. Now that the US is tightening export controls and sanctions on China, Beijing has a greater need to confiscate that shield. This makes Taiwan the epicenter of the US-China struggle, as we have highlighted since 2016. The risk of a fourth Taiwan Strait crisis is as pertinent in the short run as it is over the long run, given that the US and China have already intensified their saber-rattling in the Strait (Chart 14), including in the wake of COVID-19 specifically. China’s secular slowdown is prompting it to encroach on the borders of all of its neighbors simultaneously, creating a nascent balance-of-power alliance ranging from India to Australia to Japan. If China fails to curb its nationalism, then eventually US political polarization will decline as the country unites in the face of a peer competitor. If American divisions persist, they could drive the US to instigate conflict with China. Thus a failure of either side to restrain itself is a major geopolitical risk. The US and China ultimately face mutually assured destruction in the event of conflict, but they can have a clash in the near term before they learn their limits. The Cold War provides many occasions of such a learning process – from the Berlin airlift to the Cuban missile crisis. Such crises typically present buying opportunities for financial markets, but the consequences could be more far reaching if the Asian manufacturing supply chain is permanently damaged or if the shifting of supply chains out of China is too rapid. Globalization will also suffer as a result of currency wars. The US has not been successful in driving the dollar down, a key demand of the US-China trade war. It is much harder to force China to reform its labor and wage policies than it is to force it to appreciate its currency. But unlike Japan in 1985, China will not commit to unilateral appreciation for fear of American economic sabotage. Punitive measures will remain an American tool. Contrary to popular belief, the US is not attempting to eliminate its trade deficit. It is attempting to reduce overreliance on China. Status quo globalization is intolerable for US strategy. But autarky is intolerable for US corporations. The compromise is globalization-ex-China, i.e., economic decoupling. Investment Implications Chart 15Favor International Stocks As Growth Revives
Favor International Stocks As Growth Revives
Favor International Stocks As Growth Revives
US stock market capitalization now makes up 58% of global capitalization (Chart 15), reflecting the strength and innovation of American companies as well as a worldwide flight to safety during a decade of rising policy uncertainty and geopolitical risk. The revival of global growth amid this year’s gargantuan stimulus will prompt a major rotation out of US equities and into international and emerging market equities over the long run. As mentioned, the US greenback would also trend downward. However, there will be little clarity on the pace of nationalism and the fate of globalization until the US election is decided. Moreover the fate of globalization does not depend entirely on the United States. It mostly depends on countries in the east – Russia, China, and India, all of which are increasingly nationalistic. A miscalculation over Taiwan, North Korea, the East China Sea, the South China Sea, trade, or technology could ignite into tariffs, sanctions, boycotts, embargoes, saber-rattling, proxy battles, and potentially even direct conflict. These risks are elevated in the short run but will persist in the long run. As the US decouples from China it will have to deepen relations with other trading partners. The trade deficit will not go away but will be redistributed to Asian allies. Southeast Asian nations and India – whose own nationalism has created a shift in favor of economic development – will be the long-run beneficiaries. Matt Gertken Vice President Geopolitical Strategist mattg@bcaresearch.com Footnotes 1 Ernest Gellner, Nations and Nationalism (Ithaca, NY: Cornell University Press, 1983). 2 Neli Esipova, Julie Ray, and Ying Han, “750 Million Struggling To Meet Basic Needs With No Safety Net,” Gallup News, June 16, 2020. 3 Christopher Chase-Dunn et al, “The Development of World-Systems,” Sociology of Development 1 (2015), pp. 149-172; and Chase-Dunn, Yukio Kawano, Benjamin Brewer, “Trade globalization since 1795: waves of integration in the world-system,” American Sociological Review 65 (2000), pp. 77-95. 4 Bruce Stokes, “Americans, Like Many In Other Advanced Economies, Not Convinced Of Trade’s Benefits,” September 26, 2018. 5 In other words, the mishandling of COVID-19 and the historic George Floyd protests of June 2020 have not taken as great of a toll on Trump’s national approval, thus far, as the Ukraine scandal last October, the government shutdown in January-February 2019, the near-failure to pass tax cuts in December 2017, or the Charlottesville incident in August 2017. This is surprising and points once more to Trump’s very solid political base, which could serve as a springboard for a comeback over the next four months.