China

Dear Client, Next week we will be sending you a Special Report providing our insights on the much-anticipated China National People’s Congress. We think the messages sent from the conference will be highly relevant to both the global economy and financial markets. Please note: instead of Wednesday, the Special Report will be published on Thursday the 28th of May. Best regards, Jing Sima China Strategist Highlights Insert HiEarly signs suggest a renewed appetite among Chinese consumers for real assets and durable goods. China’s discretionary consumption will likely benefit greatly from pro-growth measures, and recover much faster than the aggregate consumption. The unemployment rate has been rising and largely concentrated in lower-income workers. Elevated unemployment will be a drag on China’s overall consumption, but its impact on discretionary consumption is limited. We are initiating two trades: long investable consumer discretionary/short investable consumer staples and long domestic consumer discretionary/broad A-share market. Feature Chart 1Sectors Directly Benefiting From Stimulus Are Recovering Faster
Sectors Directly Benefiting From Stimulus Are Recovering Faster
Sectors Directly Benefiting From Stimulus Are Recovering Faster
Economic data released last week showed that China’s economy continued to recover, particularly the infrastructure, construction and high-tech sectors (Chart 1). On the other hand, household consumption, which accounts for nearly 40% of the country’s economy, remained in a deep contraction in April. While we think the annual growth in China’s aggregate household demand will remain muted this year, the breakdown in April’s retail sales data suggests that the speed in consumer discretionary spending is already accelerating (Chart 2). During economic recoveries, consumer discretionary spending usually rebounds ahead of a recovery in overall consumption. Even though the current economic downturn is extra-ordinary, we believe that China’s discretionary consumption growth will pick up faster and stronger than the aggregate household consumption. Consumer discretionary stocks, an early cyclical sector in China’s equity market, troughed about 3 months ahead of a bottoming in Chinese investable and domestic stock prices in previous cycles. In line with our constructive view on Chinese stocks in the next 6 to 12 months, we recommend investors overweight Chinese consumer discretionary stocks relative to the benchmarks. In addition, we are initiating a long position in investable consumer discretionary versus investable consumer staples, and a long position in domestic consumer discretionary versus A-share market. Chart 2Discretionary Consumption Is Rebounding Faster Than Staples
A Consumption Recovery On Two Tracks
A Consumption Recovery On Two Tracks
China’s Stimulus-Driven Consumption Cycles Chinese consumption cycles since 2008 have mostly reflected the effectiveness of China’s pro-consumption and stimulus policies. So far, the Chinese government’s stimulus measures have been concentrated in the corporate sector rather than households. Nevertheless, government pro-growth measures, flush liquidity in the market and global travel restrictions should provide a lift to domestic sales of durable and luxury goods. Chart 3 illustrates how, in contrast to the US, China’s retail sales have grown faster than nominal GDP during every economic downturn since 2008. A reason for this counter-cyclicality in China’s consumption is that the monthly retail sales data consists of household, government and business purchases. Since the Chinese government tends to increase its expenditures during economic downturns, the increases in government purchases help to offset the declines in household and business consumption. Chart 3Retail Sales In China Have Become 'Countercyclical' Since 2008
Retail Sales In China Have Become 'Countercyclical' Since 2008
Retail Sales In China Have Become 'Countercyclical' Since 2008
Chart 4China's Post-GFC Consumption Cycles Largely Driven By Stimulus
China's Post-GFC Consumption Cycles Largely Driven By Stimulus
China's Post-GFC Consumption Cycles Largely Driven By Stimulus
A more important contributor to the faster retail sales growth during economic down cycles is government stimulus. Direct pro-consumption policies, such as sales tax cuts and subsidies, helped to boost auto sales in every cycle since 2008, whereas stimulus measures to enhance home sales indirectly led to an upcycle in the sales of home appliances in 2015-2016 (Chart 4). April’s retail sales data showed a sharp rebound in Chinese household consumption in autos, appliances and furniture (Chart 5). The strong comeback in durable goods purchases in April was driven by a release of pent-up demand and government pro-consumption measures. Since March, local governments have handed out subsidies, vouchers and tax reductions on consumer durable goods purchases and discretionary spending, such as travel and restaurant dining. By end-April, an estimate of 40 billion yuan worth of consumption vouchers were issued by provincial and city-level governments, with more than 90 percent of them targeted at discretionary goods and services. We think the government will announce further policies to support consumption at the May 22-23 National People’s Congress. Chart 5A Strong Comeback In Durable Goods Sales
A Consumption Recovery On Two Tracks
A Consumption Recovery On Two Tracks
Chinese consumers took on more medium- and long-term loans in March and April, indicating a renewed appetite for purchasing real assets and durable goods (Chart 6). This is partially because consumers want to take advantage of lower interest rates and easier monetary conditions. Moreover, Chinese households may also be seeking real assets to hedge future inflation and financial market uncertainties. Housing in China in the past two decades has been perceived as countercyclical and a low-risk asset that holds value. Early signs indicate a renewed Chinese consumers’ appetite for real assets and durable goods. Both land sales and real estate investment growth returned to positive territory in April, while the contraction in floor space started, completed, and sold all narrowed. The upward cycle in the property market should continue to support a recovery in household appliances and furniture (Chart 7). Chart 6Appetite For Real Asset Purchases May Be Returning
Appetite For Real Asset Purchases May Be Returning
Appetite For Real Asset Purchases May Be Returning
Chart 7A Recovering Property Market Should Help Boost Home Appliance Sales
A Recovering Property Market Should Help Boost Home Appliance Sales
A Recovering Property Market Should Help Boost Home Appliance Sales
In addition, global travel restrictions will likely remain in place through this year. This may prompt Chinese consumers to allocate a larger portion of their discretionary spending budgets to domestic, high-end consumer goods and services. Bottom Line: Early signs indicate a renewed consumer appetite for real assets and durable goods. The government’s pro-consumption and pro-growth measures should further boost discretionary spending. The Wealth Effect The consumption behavior of Chinese households will likely be driven by both the change in the value of their assets, and their expectations of the immediate or perceived future loss of employment and income. Housing is the largest part of Chinese households’ net worth.1 At the same time, financial assets account for a much lower share of Chinese households’ net worth versus their American peers.2 Home prices are much less volatile than stock prices, and we expect home prices in China to grow faster this year than in 2019. Hence the wealth effect of housing on Chinese consumers should remain positive. The unemployment rate has been elevated, but job losses so far are concentrated in the labor-intensive, lower-skilled manufacturing and service sectors (Chart 8). While lower-income workers account for more than half of China’s total population, their share of the country’s total household wealth and income is dismal compared with households in the top 10 percentile earnings3 (Chart 9). In fact, households in the bottom 40 percentile essentially have no discretionary spending capacity.4 Households in the top 40 group (middle- and upper middle-class urbanites) are the main driver of China’s discretionary and luxury goods market.5 Chart 8Job Losses So Far Concentrated In Lower-Skilled, Lower-Wage Manufacturing & Service Sectors
A Consumption Recovery On Two Tracks
A Consumption Recovery On Two Tracks
Chart 9Higher-Income Chinese Households Will Drive Recovery In Discretionary Consumption
A Consumption Recovery On Two Tracks
A Consumption Recovery On Two Tracks
Because poorer households tend to have a higher marginal propensity to consume than the richer ones, China’s high income inequality may reduce the aggregate demand and has the potential to structurally stagnate its household consumption growth. This is a topic we hope to provide insights on in our future research. Cyclically, however, accommodative monetary conditions and outsized stimulus during economic downturns often help augment richer households’ net worth as well as increase their discretionary purchasing power. Our constructive view on China’s discretionary consumption could change if a second wave of Covid-19 infections is virulent enough to trigger another round of global lockdowns. In this case unemployment may expand from lower-income to middle-class Chinese consumers and extend from temporary to permanent job losses. Consumption will also be constrained by more widespread income declines and renewed physical lockdowns. Bottom Line: Job losses are concentrated in the lower-income household group so far. While developments in the pandemic remain fluid, our baseline view suggests that the wealth effect will have a limited impact on Chinese middle-class consumers. Investment Conclusions The recovery is still in its early stages, but government stimulus is bearing fruit in discretionary consumption. Furthermore, the elevated unemployment rate should prompt the government to roll out more consumption and growth-supporting measures at this week’s NPC conference, which will help further boost Chinese consumers’ appetite for discretionary spending. China’s investable consumer discretionary sector has consistently outperformed both the broad market and consumer staples during previous economic recoveries. China’s investable consumer discretionary sector has consistently outperformed both the broad market and consumer staples during previous economic recoveries (Chart 10). The overwhelming shares of China’s online tech titans in the investable market, such as Alibaba and JD, make a strong case to overweight the consumer discretionary sector given that both online platforms will continue to benefit from the Chinese government’s pro-consumption schemes. On the other hand, the behavior of consumer discretionary versus consumer staples in China’s A-share market has been atypical. Chart 11 shows domestic consumer discretionary stocks have consistently underperformed consumer staples since 2015, even during the 2016/2017 upcycle in broad market stock prices. We think a few underlying factors may be at play: Chart 10The CD Sector Has Consistently Outperformed CS In Offshore Market Upcycles...
The CD Sector Has Consistently Outperformed CS In Offshore Market Upcycles...
The CD Sector Has Consistently Outperformed CS In Offshore Market Upcycles...
Chart 11...It Is Not The Case In The Onshore Market
...It Is Not The Case In The Onshore Market
...It Is Not The Case In The Onshore Market
Food and beverage companies in mainland China have one of the highest ROAs and the lowest financial leverages, which is preferred by Chinese domestic investors; Chinese liquor brands such as Kweichow Moutai and Wuliangye, which are listed on the A-share market and within the consumer staples group, have become collectable luxury goods. They have helped driving up the prices of consumer staple equities (Chart 12); Soaring food prices since 2017 have helped to widen profit margins among food processing firms (Chart 13). Chart 12Some 'Consumer Staples' Have Become Luxury Goods
Some 'Consumer Staples' Have Become Luxury Goods
Some 'Consumer Staples' Have Become Luxury Goods
Chart 13Soaring Food Prices Also A Contributing Factor
Soaring Food Prices Also A Contributing Factor
Soaring Food Prices Also A Contributing Factor
For investors with a time horizon longer than a 12 months, consumer discretionary sector is a winner. However, for investors with a time horizon longer than 12 months, average returns in consumer discretionary stocks still beat staples in the past three market recoveries (Table 1). This is true for both onshore and offshore markets. As such, we recommend investors go long on consumer discretionary versus consumer staples in the investable market, and also go long on domestic consumer discretionary versus the broad domestic market. We are initiating these two trades today. Table 1CD Sector Still A Winner On A 12-18 Month Horizon
A Consumption Recovery On Two Tracks
A Consumption Recovery On Two Tracks
Jing Sima China Strategist jings@bcaresearch.com Footnotes 1 Housing accounts for 59.1% in Chinese households’ net worth, compared with 30% in the US. PBoC, “2019 Chinese Urban Households Assets And Liabilities Survey”. 220.4% of Chinese households’ total net worth is in financial assets. In the US, the share is 42.5%. PBoC, “2019 Chinese Urban Households Assets And Liabilities Survey”. 3China’s low-income households account for about 60% of China’s population as of 2015. “How well-off is China’s middle class?” Center For Strategy & International Studies. https://chinapower.csis.org/china-middle-class/ 4 “Can China Avoid the Middle Income Trap?” Damien Ma, Foreign Policy, March 2016 5China Consumer Report 2020, McKinsey & Company, December 2019 Cyclical Investment Stance Equity Sector Recommendations
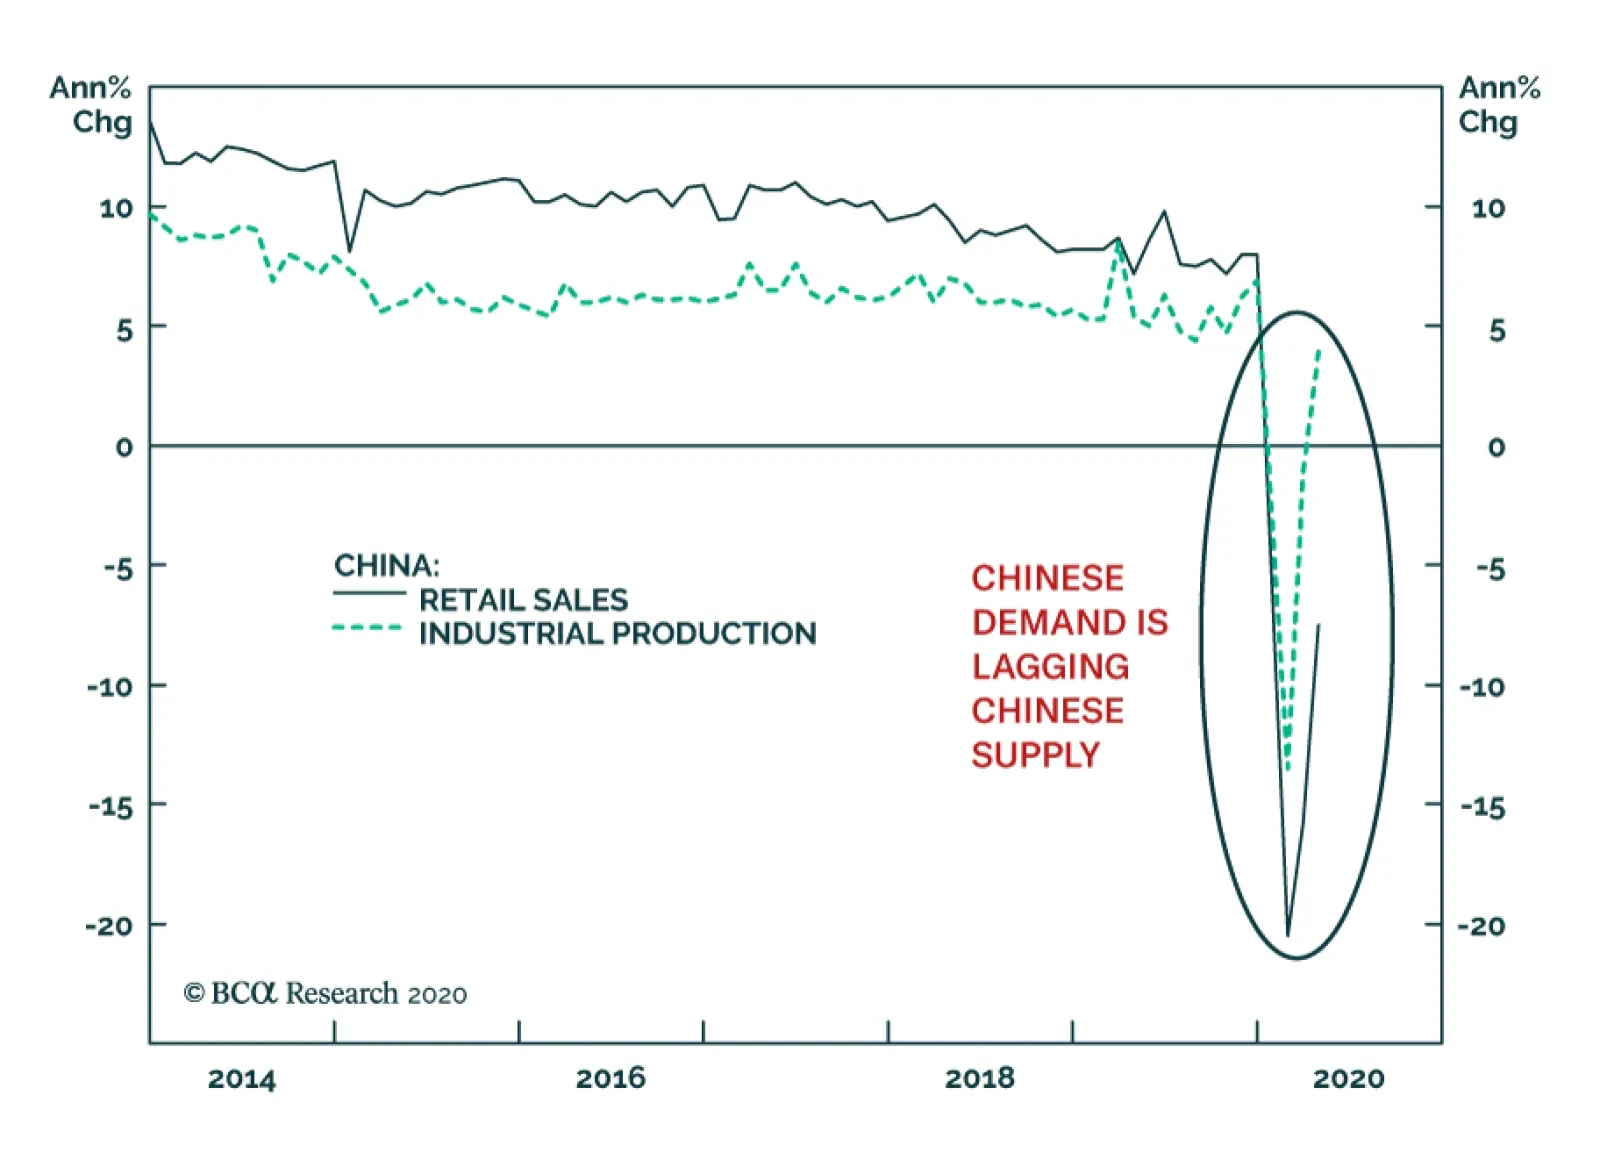
China’s data releases on Friday were mixed, at best. On the positive side, industrial production rebounded to a 3.9% annual growth rate in April. However, retail sales remain weak as they contracted at a 7.5% annual rate. This dichotomy between the supply…
Dear Client, With this weekly update on the Chinese economy, we are sending you a Special Report published by BCA Geopolitical Strategy team and authored by my colleague Matt Gertken. Lately we have been getting numerous questions from our clients, on the risk of a significant re-escalation in the US-China conflict. Matt’s report provides timely insights on the topic, and we trust you will find the report very helpful. Best regards, Jing Sima, China Strategist Feature An Update On The Chinese Economy Since mid-April, the speed of resumption in China’s domestic business activity has accelerated. Industrial enterprises appear to be operating at 87% of normal activity levels as of May 11, up from 81.8% one month ago. Small to medium-sized enterprise (SMEs) are estimated to now operate at 87.3% of their normal activity, a vast improvement from 82.3% just two weeks ago. Chart 1Pickup In M1 Still Modest
Pickup In M1 Still Modest
Pickup In M1 Still Modest
The material easing in monetary conditions and strong flows of local government special-purpose bond issuance in the past two months helped jump start a recovery in the construction sector. But at this early stage of a domestic economic rebound and in the middle of a deep global economy recession, China’s corporate marginal propensity to invest remains muted (Chart 1). Household consumption showed some resilience during last week’s “Golden Week” holiday. The strength in big-ticket item purchases, however, was highly concentrated among consumers in China’s wealthiest urban areas (Chart 2). The COVID-19 pandemic has created a situation resembling a combination of SARS and the global financial crisis. Now the physical constraints on consumption have largely been lifted, consumers’ willingness to spend, after a brief period of compensatory spending, will be suppressed if their expectations of the medium-term job and income security remain pessimistic (Chart 3). Chart 2A Compensatory Rebound In Big-Ticket Item Sales
A Compensatory Rebound In Big-Ticket Item Sales
A Compensatory Rebound In Big-Ticket Item Sales
Chart 3The Average Chinese Consumer Remains Cautious
The Average Chinese Consumer Remains Cautious
The Average Chinese Consumer Remains Cautious
Next week we will publish a report, focusing on China’s consumption in a post-pandemic environment. Looking forward, we maintain the view that China’s business activity will pick up momentum in H2, when the massive monetary and fiscal stimuli continue working its way into the economy. Downside risks to employment and income loom large, which makes it highly unlikely that the authorities will tighten their policy stance any time soon. As such, while we maintain our defensive tactical positioning due to near-term economic and geopolitical uncertainties, our view remains constructive on both the economy and Chinese financial asset prices in the next 6 to 12 months. (Chart 4). Chart 4Recovery To Gain Traction In H2
Recovery To Gain Traction In H2
Recovery To Gain Traction In H2
Jing Sima China Strategist jings@bcaresearch.com #WWIII The phrase “World War III” or #WWIII went viral earlier this year in response to a skirmish between the US and Iran (Chart 1). Only four months later, the US and China are escalating a strategic rivalry that makes the Iran conflict look paltry by comparison (Chart 2). Chart 1US-Iran Tensions Were Just A Warm-Up
#WWIII
#WWIII
Chart 2The Thucydides Trap
The Thucydides Trap
The Thucydides Trap
Fortunately, the two great powers are constrained by the same mutually assured destruction that constrained the US and the Soviet Union during the Cold War. They are also constrained by the desire to prevent their economies from collapsing further. Unfortunately, the intensity of their rivalry can escalate dramatically before reaching anything truly analogous to the Berlin Airlift or Cuban Missile Crisis – and these kinds of scenarios are not out of the question. Safe haven assets will catch a bid and the recovery in US and global risk assets since the COVID selloff will be halted. We maintain our defensive tactical positioning and will close two strategic trades to book profits and manage risk. In the wake of the pandemic and recession, geopolitics is the next shoe to drop. The War President Over the past 24 hours the White House has taken several steps indicating that President Trump is adopting the “war president” posture in the run-up to the US election: Export controls: Trump has gone forward with new export controls on “dual-purpose” technologies – those that have military as well as civilian applications, in a delayed reaction to China’s policy of civil-military technological fusion. The Commerce Department has wide leeway in whether to grant export licenses under the rule – but it is a consequential rule and would be disruptive if enforced strictly. Supply chain de-risking: Trump is also going forward with new restrictions on the import of foreign parts for US power plants and electricity grid. The purpose is to remove risks from critical US infrastructure. COVID investigation: Trump has hinted that the novel coronavirus that causes the COVID-19 disease may have originated in the Wuhan Institute of Virology. The Director of National Intelligence issued a statement indicating that the Intelligence Community does not view the virus as man-made (not a bio-weapon), but is investigating the potential that the virus transferred to humans at the institute. The State Department had flagged the institute for risky practices long before COVID. Trump avoided the bio-weapon conspiracy theory and is focused on the hypothesis that the laboratory’s investigations into rare coronaviruses led to the outbreak. New tariffs instead of reparations: Director of the National Economic Council Larry Kudlow denied that the US would stop making interest and principal payments on some Chinese holdings of US treasuries. He said that the “full faith and credit of the United States’ debt obligation is sacrosanct. Absolutely sacrosanct.” Trump denied that this form of reparations, first floated by Republican Senator Marsha Blackburn of Tennessee, was under consideration. Instead he suggested that new tariffs would be much more effective, raising the threat for the first time since the Phase One trade deal was agreed in principle in December. Strategic disputes: Tensions have flared up in specific, concrete ways across the range of US-Chinese relations – in the cyber-realm, psychological warfare, Korean peninsula, Taiwan Strait, and South China Sea. These could lead to sanctions. The war president posture is one in which President Trump recognizes that reelection is extremely unlikely in an environment of worse than -4.8% economic growth and likely 16% unemployment. Therefore he shifts the basis of his reelection to an ongoing crisis and appeals to Americans’ patriotism and desire for continuity amid crisis. Bottom Line: Protectionism is not guaranteed to work, and therefore it was not ultimately the path Trump took last year when he still believed a short-term trade deal could boost the economy. Now the bar to protectionism has been lowered. The Decline Of US-China Relations President Trump may still be bluffing, China may take a conciliatory posture, and a massive cold war-style escalation may be avoided. However, it is imprudent to buy risk assets on these reasons today, when the S&P 500’s forward price-to-earnings ratio stands at 20.15. It is more prudent to prepare for a historic escalation of tensions first, buy insurance, then reassess. Why? Because the trajectory of US-China relations is empirically worsening over time. US household deleveraging and the Chinese shift away from export-manufacturing (Chart 3) broke the basis of strong relations during the US’s distractions in Iraq and Afghanistan and China’s “peaceful rise” in the early 2000s. US consumers grew thriftier while Chinese wages rose. Not only has China sought economic self-sufficiency as a strategic objective since General Secretary Xi Jinping took power in 2012, but the Great Recession, Trump trade war, and global pandemic have accelerated the process of decoupling between the two economies. Decoupling is an empirical phenomenon, and it has momentum, however debatable its ultimate destination (Chart 4). Obviously policy at the moment is accelerating decoupling. Chart 3The Great Economic Divorce
The Great Economic Divorce
The Great Economic Divorce
Chart 4Decoupling Is Empirical
Decoupling Is Empirical
Decoupling Is Empirical
The US threat to cease payments on some of China’s Treasury holdings is an inversion of the fear that prevailed in the wake of 2008, that China would sell its treasuries to diversify away from dependence on the US and the greenback. China did end up selling its treasuries, but the US was not punished with higher interest rates because other buyers appeared. The US remains the world’s preponderant power and ultimate safe haven (Chart 5). By the same token, Trump and Kudlow naturally poured water on the threat of arbitrarily stopping payments because that would jeopardize America’s position. Instead Trump is threatening a new round of trade tariffs. Since the US runs a large trade deficit with China, and China is more exposed to trade generally, the US has the upper hand on this front. But it is important to notice that US tariff collections as a share of imports bottomed under President Obama (Chart 6). Chart 5Treasuries Can't Be Weaponized By Either Side...
Treasuries Can't Be Weaponized By Either Side...
Treasuries Can't Be Weaponized By Either Side...
Chart 6... But Tariffs Can And Will Be
... But Tariffs Can And Will Be
... But Tariffs Can And Will Be
The US shift away from free trade toward protectionism occurred in the wake of the 2008 financial crisis. President Trump then popularized and accelerated this policy option in an aggressive and unorthodox way. Trade tariffs are a tool of American statecraft, not the whim of a single person, who may exit the White House in January 2021 anyway. The retreat from globalization is not a passing fancy. Today’s recession also marks the official conclusion of China’s historic 44 year economic boom – and hence a concrete blow to the legitimacy of the ruling Communist Party (Chart 7). The more insular, autarkic shift in the Communist Party’s thinking is not irreversible, but there are no clear signs that Xi Jinping is pivoting toward liberalism after eight years in power. Chart 7Recession Destabilizes The 'G2' Powers
Recession Destabilizes The 'G2' Powers
Recession Destabilizes The 'G2' Powers
China’s unemployment rate has been estimated as high as 20.5% by Zhongtai Securities, which then retracted the estimate (!). It is at least at 10%. Moreover 51 million migrant workers vanished from the job rolls in the first quarter of the year. Maximum employment is the imperative of East Asian governments, especially the Communist Party, which has not dealt with joblessness since the late 1990s. The threat to social and political stability is obvious. The party will take extraordinary measures to maintain stability – not only massive stimulus but also social repression and foreign policy distraction to ensure that people rally around the flag. Xi Jinping has tried to shift the legitimacy of the party from economic growth to nationalism and consumerism, the “China Dream.” But the transition to consumer growth was supposed to be smooth. Financial turmoil, the trade war, and now pandemic and recession have forced the Communist Party off the training wheels well before it intended. Xi’s communist ideology, economic mercantilism, and assertive foreign policy have created an international backlash. The US is obviously indulging in nationalism as well. A stark increase in inequality and political polarization exploded in President Trump’s surprise election on a nationalist and protectionist platform in 2016 (Chart 8). All candidates bashed China on the campaign trail, but Trump was an anti-establishment leader who disrupted corporate interests and followed through with his tariff threats. The result is that the share of Americans who see China’s power and influence as a “major threat” to the United States has grown from around 50% during the halcyon days of cooperation to over 60% today. Those who see it as a minor threat have shrunk to about a quarter of the population (Chart 9). Chart 8A Measure Of Inequality In The US
A Measure Of Inequality In The US
A Measure Of Inequality In The US
Chart 9US Nationalism On The Rise
#WWIII
#WWIII
Chart 10Broad-Based Anti-China Sentiment In US
#WWIII
#WWIII
As with US tariff policy, the bipartisan nature of US anger toward China is significant. More than 60% of Democrats and more than 50% of young people have an unfavorable view of China. College graduates have a more negative opinion than the much-discussed non-college-educated populace (Chart 10). Already it is clear, in Joe Biden’s attack ads against Trump, that this election is about who can sound tougher on China. The debate is over who has the better policy to put “America first,” not whether to put America first. Biden will try to steal back the protectionist thunder that enabled Trump to break the blue wall in the electorally pivotal Rust Belt in 2016 (Map 1). Biden will have to win over these voters by convincing them that he understands and empathizes with their Trumpian outlook on jobs, outsourcing, and China’s threats to national security. He will emphasize other crimes – carbon emissions, cyber attacks, human rights violations – but they will still be China’s crimes. He will return to the “Pivot to Asia” foreign policy of his most popular supporter, former President Barack Obama. Map 1US Election: Civil War Lite
#WWIII
#WWIII
Bottom Line: Economic slowdown and autocracy in China, unprecedented since the Cultural Revolution, is clashing with the United States. Broad social restlessness in the US that is resolving into bipartisan nationalism against a peer competitor, unprecedented since the struggle with the Soviets in the 1960s, is clashing with China. Now is not the time to assume global stability. Constraints Still Operate, But Buy Insurance The story outlined above is by this time pretty well known. But the “Phase One” trade deal allowed global investors to set aside this secular story at the beginning of the year. Now, as Trump threatens tariffs again, the question is whether he will resort to sweeping, concrete, punitive measures against China that will take on global significance – i.e. that will drive the financial markets this year. Trump is still attempting to restore his bull market and magnificent economy. As long as this is the case, a constraint on conflict operates this year. It is just not as firm or predictable. Therefore we are looking for three things. First, will President Trump’s approval rating benefit so much from his pressure tactics on China that he finds himself driven into greater pressure tactics? This raises the risk of policy mistakes. Second, will Trump’s approval rating fall into the doldrums, stuck beneath 43%, as the toll of the recession wears on him and popular support during the health crisis fades? “Lame duck” status would essentially condemn him to electoral loss and incentivize him to turn the tables by escalating the conflict with China. Chart 11Trump May Seek A Crisis ‘Bounce’ To Popularity
#WWIII
#WWIII
Presidents are not very popular these days, but a comparison with Trump’s two predecessors shows that while he can hardly obtain the popularity boost that Obama received just before the 2012 election, he could hope for something at least comparable to what George W. Bush received amid the invasion of Iraq (Chart 11). (Trump has generally been capped at 46% approval, the same as his share of the popular vote in 2016.) The reason this is a real risk, not a Shakespearean play, is outlined above: however cynical Trump’s political calculus, he would be reasserting US grand strategy in the face of a great power that is attempting to set up a regional empire from which, eventually, to mount a global challenge. Thus if he is convinced he cannot win the election anyway, this risk becomes material. Investors should take seriously any credible reports suggesting that Trump is growing increasingly frustrated with his trailing Biden in head-to-head polls in the swing states. Third, will China, under historic internal stress, react in a hostile way that drives Trump down the path of confrontation? China has so far resorted to propaganda, aircraft carrier drills around the island of Taiwan, and maritime encroachments in the South China Sea – none of which is intolerably provocative to Trump. A depreciation of the renminbi, a substantial change to the status quo in the East or South China Seas, or an attempt to vitiate US security guarantees regarding US allies in the region, could trigger a major geopolitical incident. A fourth Taiwan Strait crisis is fully within the realm of possibility, especially given that Taiwan’s “Silicon Shield” is fundamentally at stake. While we dismissed rumors of Kim Jong Un’s death in North Korea, any power vacuum or struggle for influence there is of great consequence in today’s geopolitical context. Aggressive use of tariffs always threatened to disrupt global trade and financial markets, but tariffs function differently in the context of a global economic expansion and bull market, as in 2018-19, than they do in the context of a deep and possibly protracted recession. Trump has a clear political incentive to be tough on China, but an equally clear financial and economic incentive to limit sweeping punitive measures and avoid devastating the stock market and economy. If events lower the economic hurdle, then the political incentive will prevail and financial markets will sell. Bottom Line: However small the risk of Trump enacting sweeping tariffs, the downside is larger than in the 2018-19 period. The stock market might fall by 40%-50% rather than 20% in an all-out trade war this year. Investment Takeaways Go tactically long US 10-year treasuries. Book a 9.7% profit on our long 30-year US TIPS trade. Close long global equities (relative to US) for a loss of 3.8%. Matt Gertken Vice President Geopolitical Strategist mattg@bcaresearch.com Footnotes Cyclical Investment Stance Equity Sector Recommendations
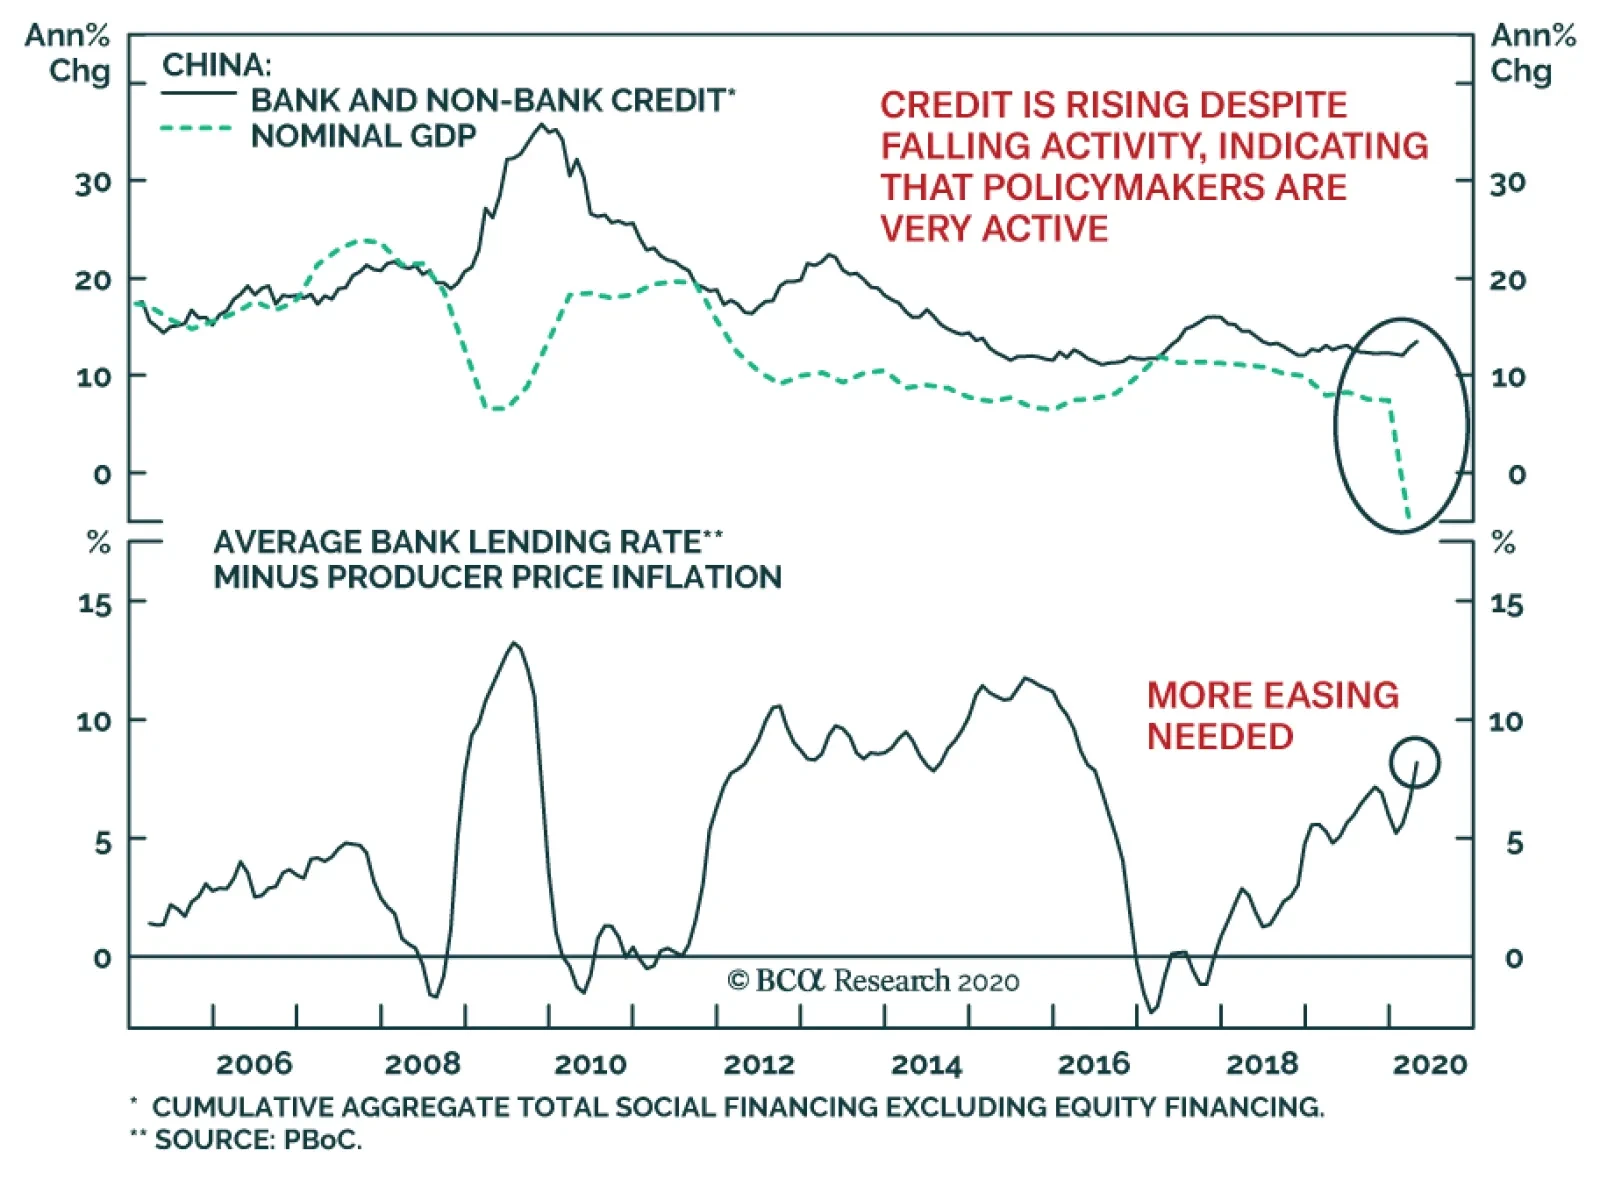
BCA Research’s China Investment and Geopolitical strategists strongly expect that Chinese authorities will continue to add large amounts of stimulus in the Chinese economy. While the rhetorical focus on employment is a crucial clue, the behavior of credit…
China’s new total social financing flows slowed to CNY3.09 trillion in April, down from CNY5.15trillion in March. Despite the slowdown, credit flows beat expectations of CNY 2.78 trillion. As a result, the 12-month Chinese credit flows are accelerating…
Highlights Ever since the Federal Reserve’s liquidity injections, the dollar has been trading in a bifurcated manner. Historically, this has been a rare event. The main bifurcation has been between developed market and commodity/emerging market currencies. Stability in the USD/CNY exchange rate is a key indicator to watch. Movements in this cross will indicate where the balance of forces are shifting. Feature Chart I-1A Tale Of Two Dollars
A Tale Of Two Dollars
A Tale Of Two Dollars
The Federal Reserve’s dollar liquidity injections have been massive, but two dollars continue to fight a tug of war. The first is the DXY index, which has largely surrendered to the flood of liquidity offered through the Fed’s swap lines and temporary FIMA repo facility. In fact, cross-currency basis swaps in both Japan and the euro area, a measure of offshore dollar funding stress, have eased. As a result, volatility in the DXY index has been crushed, keeping it largely below the psychological 100 level. However, on the other side of the liquidity battle front have been emerging market and commodity currencies, some of which continue to make fresh lows. Remarkably, these have included currencies such as the Brazilian real that also have swap agreements with the US. In short, a rare divergence has opened up between two dollars (Chart I-1). Historically, whenever this has occurred, either the DXY index was on the verge of making new highs, or procyclical currencies were very close to a bottom. In our April 3rd report, we suggested three reasons as to why the dollar could remain well bid in the near term.1 In this report, we explore these reasons further and offer one variable to watch as the key arbiter between the two – the USD/CNY exchange rate. A Tale Of Two Dollars The bifurcated dollar performance has been underpinned by three factors. The 14 developed and emerging market currencies that have swap lines with the Fed2 all bottomed around March 19, when the funding announcement was made. These include currencies of countries that were initially excluded from a prior swap agreement such as Australia, Norway and New Zealand. The exception to this rule has been the Brazilian real. By extension, some currencies currently excluded from the swap agreement such as the Turkish lira and South African rand remain in freefall. The temporary repo facility for foreign and international monetary authorities (FIMA), which allows FIMA account holders to temporarily exchange their Treasury securities held with the Fed for US dollars, has instilled confidence. As such, this has assuaged selling pressure on currencies with ample dollar foreign exchange reserves. However, some currencies with low reserves such as the South African rand or Turkish lira continue to face downside risks. A huge portion of offshore dollar funding has been financed by non-bank entities. Not only does a rising dollar lift the debt burden of borrowers, but it also raises solvency risk for these concerns. Notably, non-banks have limited access to central bank swap lines. Of the US$12 trillion in dollar-denominated foreign debt outstanding, 32% is from emerging markets, a share that has increased massively since the financial crisis (Chart I-2). This might explain why currencies like the Brazilian real, exposed to significant foreign-currency corporate debt obligations, continue to see selling pressure, despite the Fed facilities in place (Chart I-3). Chart I-2Rising EM Dollar Debt
Rising EM Dollar Debt
Rising EM Dollar Debt
Chart I-3Some EM Have High External Debt
Some EM Have High External Debt
Some EM Have High External Debt
In short, with the Fed and many other developed-market central banks engaged in active purchases of corporate paper, a line in the sand has been drawn between currencies where the lenders of last resort have stepped in, and others where their central banks are still unwilling to take credit risk. Put another way, certain currency markets are starting to price USD solvency risk, resulting from the broad shutdown in their economies and the rise in the greenback. Unfortunately, there is nothing the Fed can do about this. Dollar liquidity shortages tend to be vicious because they trigger negative feedback loops. As offshore dollar rates among non-banks begin to rise, this lifts the cost of capital for borrowing entities, with debt repayment replacing capital spending. This is where China can step in. The People’s Bank of China has massive foreign exchange reserves, worth about US$3.1 trillion. This means it can provide swap agreements that will almost cover the totality of EM foreign dollar debt. The important distinction from foreign exchange reserves is that swap agreements entail no exchange of currency. As such, it is about confidence. With low external debt and massive FX reserves, the PBoC can instill this confidence in countries that have low and/or falling foreign exchange reserves. Certain currency markets are starting to price USD solvency risk, resulting from the broad shutdown in their economies and the rise in the greenback. There has been a precedent to this. Since the global financial crisis, as the PBoC has been engaging in powerful monetary stimulus, the number of bilateral swap lines offered to foreign central banks has also ballooned. Bloomberg no longer publishes swap data for the PBoC, but a recent article suggests that as recent as 2018, the Chinese central bank had bilateral local currency swap agreements with central banks or monetary authorities in 38 countries and regions, with a total amount of around 3.7 trillion yuan (Chart I-4).3 Remarkably, this excluded the US Fed. This means that the USD/CNY exchange rate will become a key arbiter of the divergence between the two dollars. If Asian and Latin American currencies can stabilize versus the RMB and the USD/CNY exchange rate can remain stable, then an informal accord has been established. So far, the RMB appears the arbiter between these two dollars (Chart I-5). Chart I-4Chinese Swaps To The Rescue?
Chinese Swaps To The Rescue?
Chinese Swaps To The Rescue?
Chart I-5USD/CNY As A Dollar Arbiter
USD/CNY As A Dollar Arbiter
USD/CNY As A Dollar Arbiter
We understand that geopolitical tensions between the US and China are escalating, and so the probability of such an event – if global growth rebounds earnestly – is low. However, should global growth remain weak, a fall in the RMB will highlight the PBoC is actively using its currency as a weapon. This will suggest all bets are off. Bottom Line: Developed market commodity currencies have a correlation of almost parity with EM FX (Chart I-6). An explicit swap agreement between China and emerging market countries could be the key to assuage dollar funding pressures within emerging markets. This will ease the selling pressure on developed-market commodity currencies. Chart I-6The Risk To Commodity Currencies
The Risk To Commodity Currencies
The Risk To Commodity Currencies
Market Signals And Signposts Ever since Richard Nixon severed the gold-dollar link in the early ‘70s, there have been three major episodes when some currencies bucked the broad dollar trend. Historically, this has been driven by two major factors (Table I-1):4 Table I-1Summary Of Currency Divergence Episodes
Line In The Sand
Line In The Sand
De-synchronized global growth A localized debt/economic crisis The first episode occurred in the early 1990s. As the world was exiting a recession in part triggered by tight US monetary policies, lower US interest rates allowed the dollar to fall along with rising global growth. Only the yen, on the back of an economy entering into a debt deflation spiral (where positive real rates begot more currency appreciation), was able to buck this trend. Developed market commodity currencies have a correlation of almost parity with EM FX. The late 1990s saw the capitulation of Asian currencies. As a safe haven, the US dollar started to benefit from repatriation flows. Asean and commodity currencies were under intense selling pressure from pegged exchange rates and a long period of low interest rates that had generated massive imbalances. Remarkably, the euro was the area of shelter.. The world in 2005-2006 was entering a full-blown mania. Procyclical currencies were benefitting from Chinese industrialization and the creation of the euro. Meanwhile, Japan continued to sag under a mountain of debt. This pushed market participants to increasingly use the yen as a funding currency for carry trades, allowing it to depreciate versus the US dollar. Enter 2020. The world today is in a synchronized slowdown, but varying degrees of policy measures suggest we could continue to see a lack of synchronicity in dollar trading over the near term: The euro area appears poised to recover faster than the US in the near term (Chart I-7). If this proves correct, any knee-jerk selloffs in the euro should be bought. This is directly linked to the speed at which European economies reopen, relative to the US. By extension, Asian currencies should do better than those in Latin America. Conclusion: the dollar could fall against the euro, but rise against some emerging market currencies. The easiest way to express this view is to buy the cheapest European currencies, such as the Norwegian krone and Swedish krona. We are long both. The yen, typically used as a funding currency, will be hostage to a sudden stop in funding flows. This is because there is no interest rate advantage anymore between Japanese and US paper, once accounting for hedging costs (Chart I-8). This suggests carry trades in developed markets, using the Japanese yen, are stuck in the barn for now. Meanwhile, as a safe haven currency, the yen will still benefit from a rise in FX volatility. Short USD/JPY hedges make sense. Chart I-7Euro Area Versus##br## US Growth
Euro Area Versus US Growth
Euro Area Versus US Growth
Chart I-8The Yen Is No Longer An Attractive Funding Currency
The Yen Is No Longer An Attractive Funding Currency
The Yen Is No Longer An Attractive Funding Currency
Commodity and emerging market FX will be the outlier against the US dollar for now. These continue to face downward pressure in the near term. In terms of commodities, the sudden stop in demand has been met with an overwhelmingly slow response to curtail supply. Eventually, higher demand will benefit these currencies, but the supply story dominates for now in crude oil and industrial commodities. That said, this week’s rise in Chinese commodity imports was encouraging. Stay tuned. Chester Ntonifor Foreign Exchange Strategist chestern@bcaresearch.com Footnotes 1 Please see Foreign Exchange Strategy Weekly Report, titled “Capitulation?,” dated April 3, 2020, available at fes.bcaresearch.com. 2 These include the Bank Of Canada, Bank Of Japan, Bank Of England, European Central Bank, the Swiss National Bank, the Reserve Bank of Australia, the Banco Central do Brasil, the Danmarks Nationalbank (Denmark), the Bank of Korea, the Banco de Mexico, the Norges Bank, the Reserve Bank of New Zealand, the Monetary Authority of Singapore, and the Sveriges Riksbank. 3 Please see The History Of Commerce, China. 4 Please see Foreign Exchange Strategy Special Report, titled “Can There Be More Than One US Dollar”, dated June 08, 2018, available at fes.bcaresearch.com. Currencies U.S. Dollar Chart II-1USD Technicals 1
USD Technicals 1
USD Technicals 1
Chart II-2USD Technicals 2
USD Technicals 2
USD Technicals 2
Recent data in the US have been negative: The Markit manufacturing PMI fell to 36.1 in April; the services PMI also slipped to 26.7. ISM manufacturing PMI dropped to 41.5 and non-manufacturing PMI declined to 41.8. The trade deficit widened from $39.8 billion to $44.4 billion in March. Unit labor costs increased by 4.8% quarterly in Q1, while nonfarm productivity fell by 2.5%. Initial jobless claims continued to grow by 3169K last week. The DXY index surged by 1.5% this week. The Senior Loan Officer Survey released this week reported an increasing net percentage of domestic banks tightening standards for most loan types in Q1, including C&I, auto and mortgage loans. On Tuesday, the Fed’s Raphael Bostic said that there are great uncertainties around “V-shape” recovery. Report Links: Capitulation? - April 3, 2020 The Dollar Funding Crisis - March 19, 2020 Are Competitive Devaluations Next? - March 6, 2020 The Euro Chart II-3EUR Technicals 1
EUR Technicals 1
EUR Technicals 1
Chart II-4EUR Technicals 2
EUR Technicals 2
EUR Technicals 2
Recent data in the euro area have been negative: The Markit manufacturing PMI fell further from 33.6 to 33.4 in April, while the services PMI stayed low at 12. Sentix investor confidence remained low at -41.8 in May. Retail sales contracted by 9.2% year-on-year in March, compared to a 3% increase the previous month. The euro declined by 0.8% against the US dollar this week. The German court has criticized the ECB bond-buying programme, warning that the ECB’s purchases could be illegal under German law unless the ECB can prove otherwise. Continuing conflicts among Eurozone members and imbalances between countries could add more pressure on the ECB. In addition, the European Commission forecasts the euro zone economy to contract by a record 7.7% this year. Report Links: On The DXY Breakout, Euro, And Swiss Franc - February 21, 2020 Updating Our Balance Of Payments Monitor - November 29, 2019 On Money Velocity, EUR/USD And Silver - October 11, 2019 Japanese Yen Chart II-5JPY Technicals 1
JPY Technicals 1
JPY Technicals 1
Chart II-6JPY Technicals 2
JPY Technicals 2
JPY Technicals 2
Recent data from Japan have been negative: The manufacturing PMI fell from 43.7 to 41.9 in April. Vehicle sales kept contracting by 25.5% year-on-year in April, following a decline of 10.2% in March. Monetary base increased by 2.3% year-on-year in April, down from a 2.8% increase the previous month. The Japanese yen appreciated by 0.4% against the US dollar this week, despite broad US dollar strength. Since the beginning of the Fed swap lines operation this year, the BoJ has the highest liquidity swaps with the Fed, amounting to US$220 billion as of April 30, helping to ease dollar funding pressure in Japan. Report Links: The Near-Term Bull Case For The Dollar - February 28, 2020 Building A Protector Currency Portfolio - February 7, 2020 Currency Market Signals From Gold, Equities And Flows - January 31, 2020 British Pound Chart II-7GBP Technicals 1
GBP Technicals 1
GBP Technicals 1
Chart II-8GBP Technicals 2
GBP Technicals 2
GBP Technicals 2
Recent data in the UK have been mostly negative: The Markit manufacturing PMI fell further to 32.6 from 32.9 in April, while services PMI remained low at 13.4. Nationwide housing prices increased by 3.7% year-on-year in April, up from 3% the previous month. Money supply (M4) surged by 7.4% year-on-year in March. The British pound plunged by 2.7% against the US dollar this week. The Bank of England held interest rates unchanged on Thursday morning, while warning that the coronavirus crisis will push the UK economy into its deepest recession in 300 years. The Bank is now forecasting the output to slip by 3% in Q1, followed by a 2.5% plunge in Q2. Report Links: Updating Our Balance Of Payments Monitor - November 29, 2019 A Few Trade Ideas - Sept. 27, 2019 United Kingdom: Cyclical Slowdown Or Structural Malaise? - Sept. 20, 2019 Australian Dollar Chart II-9AUD Technicals 1
AUD Technicals 1
AUD Technicals 1
Chart II-10AUD Technicals 2
AUD Technicals 2
AUD Technicals 2
Recent data in Australia have been mixed: Building permits plunged by 4% month-on-month in March, down from 19.4% the previous month. Exports surged by 15.1% month-on-month while imports fell by 3.6% in March. The trade surplus expanded by A$6.8 billion to A$10.6 billion. The Australian dollar fell by 1.5% against the US dollar this week. On Tuesday, the RBA kept its interest rate unchanged at 0.25%. More importantly, the Bank has scaled back the size and frequency of bond purchases, which so far totalled A$50 billion, while stating that they are prepared to scale-up the purchases again should conditions worsen. In addition, the RBA forecasts the output to fall by roughly 10% in the first half of 2020 and by 6% over the year, followed by a rebound of 6% next year. Report Links: On AUD And CNY - January 17, 2020 Updating Our Balance Of Payments Monitor - November 29, 2019 A Contrarian View On The Australian Dollar - May 24, 2019 New Zealand Dollar Chart II-11NZD Technicals 1
NZD Technicals 1
NZD Technicals 1
Chart II-12NZD Technicals 2
NZD Technicals 2
NZD Technicals 2
Recent data in New Zealand have been mixed: Building permits fell by 21.3% month-on-month in March, down from 5.7% increase in February. The unemployment rate ticked up from 4% to 4.2% in Q1, lower than the expected 4.4%. Employment increased by 0.7% quarter-on-quarter. The participation rate increased by 30 bps to 70.4%. In addition, wage rates increased by 2.5% annually. The New Zealand dollar dropped by 1.8% against the US dollar this week. While many may call the Q1 Labour Market Statistics a positive surprise, Statistics New Zealand has indicated that the March data from household labour force survey was interrupted due to the lockdown in March. In a typical quarter, around 25% of the interviews for this survey are carried out face-to-face. We expect the Q2 Labour Survey to show more clearly how the COVID-19 lockdown has changed New Zealand’s labour market. Report Links: Updating Our Balance Of Payments Monitor - November 29, 2019 Place A Limit Sell On DXY At 100 - November 15, 2019 USD/CNY And Market Turbulence - August 9, 2019 Canadian Dollar Chart II-13CAD Technicals 1
CAD Technicals 1
CAD Technicals 1
Chart II-14CAD Technicals 2
CAD Technicals 2
CAD Technicals 2
Recent data in Canada have been negative: The Markit manufacturing PMI plunged from 46.1 to 33 in April. Both exports and imports fell notably in March: exports narrowed by C$2.3 billion to C$46.3 billion. Imports decreased by C$1.8 billion to C$47.7 billion. The trade deficit widened from C$0.9 billion to C$1.4 billion. Bloomberg Nanos confidence ticked up from 37.1 to 37.7 for the week ended May 1. The Canadian dollar fell by 0.9% against the US dollar this week. The decline in exports was led by auto manufacturing, aircraft, and energy products. Moreover, a depreciating Canadian dollar has largely impacted the trade values in March. When expressed in US dollar terms, export fall by 9.2% month-on-month and imports by 8.1%, which compares favourably with 4.7% decrease in exports and 3.5% decline in imports in Canadian dollars. Report Links: More On Competitive Devaluations, The CAD And The SEK - May 1, 2020 A New Paradigm For Petrocurrencies - April 10, 2020 The Loonie: Upside Versus The Dollar, But Downside At The Crosses Swiss Franc Chart II-15CHF Technicals 1
CHF Technicals 1
CHF Technicals 1
Chart II-16CHF Technicals 2
CHF Technicals 2
CHF Technicals 2
Recent data in Switzerland have been mostly negative: The manufacturing PMI fell from 43.7 to 40.7 in April, above the expectations of 34.6. Consumer climate plunged from -9.4 to -39.3 in Q2. Headline consumer prices fell by -1.1% year-on-year in April, down from -0.5% in March, also below the expectations of -0.8%. The unemployment rate increased from 2.8% to 3.3% on a seasonally adjusted basis in April. The Swiss franc fell by 1% against the US dollar this week. With consumer prices decreasing for a third consecutive month, the SNB has stepped up the currency intervention. Total sight deposits have increased by nearly 77 billion CHF this year, compared to only 13.2 billion CHF in 2019 and 2.3 billion CHF in 2018. Report Links: On The DXY Breakout, Euro, And Swiss Franc - February 21, 2020 Currency Market Signals From Gold, Equities And Flows - January 31, 2020 Portfolio Tweaks Before The Chinese New Year - January 24, 2020 Norwegian Krone Chart II-17NOK Technicals 1
NOK Technicals 1
NOK Technicals 1
Chart II-18NOK Technicals 2
NOK Technicals 2
NOK Technicals 2
There has been no significant data release from Norway this week. The Norwegian krone appreciated by 0.6% against the US dollar this week. On Thursday morning, the Norges Bank delivered a surprise rate cut by 25 bps to a record low of 0 due to the severity of the coronavirus and huge decline in oil prices. However, they also implied that further cuts into negative territory are unlikely. In addition, Governor Øystein Olsen said that they expect the output to drop by roughly 5% this year, a decline of a magnitude that has not been seen since World War II. Report Links: A New Paradigm For Petrocurrencies - April 10, 2020 Building A Protector Currency Portfolio - February 7, 2020 On Oil, Growth And The Dollar - January 10, 2020 Swedish Krona Chart II-19SEK Technicals 1
SEK Technicals 1
SEK Technicals 1
Chart II-20SEK Technicals 2
SEK Technicals 2
SEK Technicals 2
Recent data in Sweden have been negative: Manufacturing PMI fell from 42.6 to 36.7 in April. Industrial production fell by 0.1% year-on-year in March. Manufacturing new orders contracted by 2% year-on-year in March, down from 5.7% increase in February. The Swedish krona has been more or less flat against the US dollar this week. Like the ECB, the Riksbank might have some legal issues regarding its bond purchases program. The current Riksbank Act does not allow the bank to make outright purchases of corporate bonds or other private securities on the primary or secondary markets. So far, the Riksbank has purchased 5.6 billion SEK of corporate commercial papers to support the economy under the COVID-19. Report Links: Updating Our Balance Of Payments Monitor - November 29, 2019 Where To Next For The US Dollar? - June 7, 2019 Balance Of Payments Across The G10 - February 15, 2019 Trades & Forecasts Forecast Summary Core Portfolio Tactical Trades Limit Orders Closed Trades
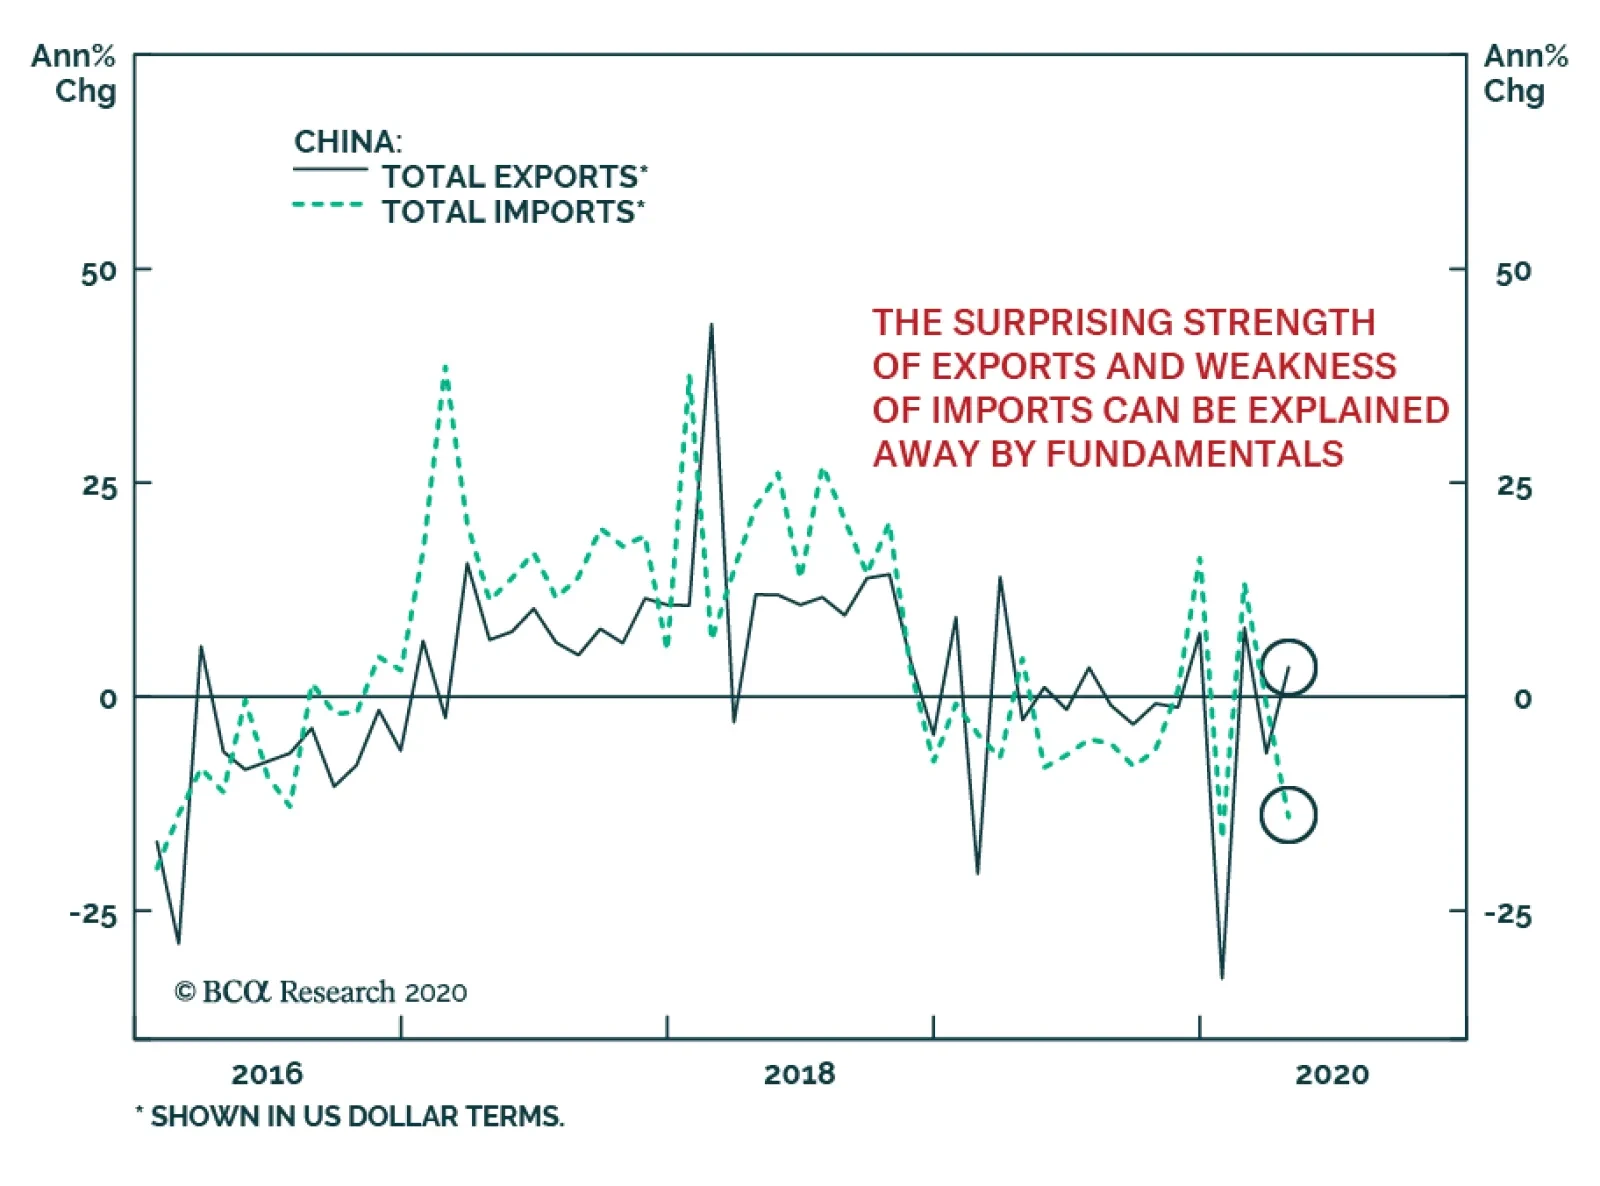
China’s April trade numbers were surprising. Despite a global pandemic that has arrested economic activity among China’s trading partners, annual export growth hit 3.5% in USD terms. Meanwhile, imports denominated in USD terms contracted at a 14.2% annual…
Highlights Our baseline view foresees a U-shaped recovery, as economies slowly relax lockdown measures. There are significant risks to this forecast, however. On the upside, a vaccine or effective treatment could hasten the reopening of economies and recovery in spending. On the downside, containment measures could end up being eased too quickly, leading to a surge in new cases. A persistent spell of high unemployment could also permanently damage economies, especially if fiscal and monetary stimulus is withdrawn too quickly. In addition, geopolitical risks loom large, with the US election likely to be fought on who sounds tougher on China. Earnings estimates have yet to fall as much as we think they will, making global equities vulnerable to a near-term correction. Nevertheless, the spread between earnings yields and bond yields is wide enough to justify a modest overweight to stocks on a 12-month horizon. Is It Safe To Come Down? We published a report two weeks ago entitled Still Stuck In The Tree where we likened the current situation to one where an angry bear has chased a hiker up a tree.1 Having reached a high enough branch to escape immediate danger, the hiker breathes a sigh of relief. As time goes by, however, the hiker starts to get nervous. Rather than disappearing back into the forest, the bear remains at the base of the tree licking its chops. Meanwhile, the hiker is cold, hungry, and late for work. Like the hiker, the investment community breathed a collective sigh of relief when the number of cases in Italy and Spain, the first two major European economies to be hit by the coronavirus, began to trend lower. In New York City, which quickly emerged as the epicentre of the crisis in the United States, more COVID patients have been discharged from hospitals than admitted for the past three weeks (Chart 1). Chart 1Discharges From New York Hospitals Have Exceeded Admissions For The Past Three Weeks
Risks To The U
Risks To The U
Deepest Recession Since The 1930s Yet, this progress has come at a very heavy economic cost. The IMF expects the global economy to shrink by 3% this year (Chart 2). In 2009, global GDP barely contracted. Chart 2Severe Damage To The Global Economy This Year
Risks To The U
Risks To The U
The sudden stop in economic activity has led to a surge in unemployment. According to the Bloomberg consensus estimate, the US unemployment rate rose to 16% in April. The true unemployment rate is probably higher since to be considered unemployed one has to be looking for work, which is difficult if not impossible in the presence of widespread lockdowns. Regardless, even the official unemployment rate is the worst since the Great Depression (Chart 3). Chart 3Unemployment Rate Seen Jumping To Levels Not Reached Since The Great Depression
Unemployment Rate Seen Jumping To Levels Not Reached Since The Great Depression
Unemployment Rate Seen Jumping To Levels Not Reached Since The Great Depression
Unshackling The Economy A key difference from the 1930s is that today’s recession has been self-induced. Policymakers want workers to stay home as much as possible. The hope is that once businesses reopen, most of these workers will return to their jobs. How long will that take? Our baseline scenario envisions a slow but steady reopening of the global economy starting later this month, which should engender a U-shaped economic recovery. Since mid-March, much of the world has been trying to compensate for lost time by taking measures that would not have been necessary if policymakers had acted sooner. As Box 1 explains, some loosening of lockdown measures could be achieved without triggering a second wave of cases once the infection rate has been brought down to a sufficiently low level. To the extent that economic activity tends to move in tandem with the number of interactions that people have, a relaxation of social distancing measures should produce a modest rebound in growth. New technologies and a better understanding of how the virus is transmitted should also allow some of the more economically burdensome measures to be lifted. As we have discussed before, mass testing can go a long way towards reducing the spread of the disease (Chart 4).2 Right now, high-quality tests are in short supply, but that should change over the coming months. Chart 4Mass Testing Will Help
Risks To The U
Risks To The U
Increased mask production should also help. Early in the pandemic, officials in western nations promulgated the view that masks do not work. At best, this was a noble lie designed to ensure that anxious consumers did not deprive frontline workers of necessary safety equipment. At worst, it needlessly led many people astray. As East Asia’s experience shows, mask wearing saves lives. A recent paper estimated that the virus could be vanquished if 80% of people wore masks that were at least 60% effective, a very low bar that even cloth masks would pass (Chart 5).3 Chart 5Masks On!
Risks To The U
Risks To The U
Recent research has also cast doubt on the merits of closing schools. The China/WHO joint commission could not find a single instance during contact tracing where a child transmitted the virus to an adult. A study by the UK Royal College of Paediatrics provides further support to the claim that children are unlikely to be important vectors of transmission. The evidence includes a case study of a nine year-old boy who contracted the virus in the French Alps but fortunately failed to transmit it to any of the more than 170 people he had contact with in three separate schools.4 Along the same lines, there is evidence that the odds of adults catching the virus indoors is at least one order of magnitude higher than outdoors.5 This calls into question the strategy of states such as California of clearing out prisons of dangerous felons in order to make room for beachgoers.6 Upside Risks To The U: Medical Breakthroughs While a U-shaped economic recovery remains our base case, we see both significant upside and downside risks to this outcome. The best hope for an upside surprise is that a vaccine or effective treatment becomes available soon. There are already eight human vaccine trials underway, with another 100 in the planning stages. In the race to develop a vaccine, Oxford is arguably in the lead. Scientists at the university’s Jenner Institute have developed a genetically modified virus that is harmless to people, but which still prompts the immune system to produce antibodies that may be able to fight off COVID. The vaccine has already worked well on rhesus monkeys. If it proves effective on humans, researchers hope to have several million doses available by September. On the treatment side, Gilead’s remdesivir gained FDA approval for emergency use after early results showed that it helps hasten the recovery of coronavirus patients. Hydroxychloroquine, which President Trump has touted on numerous occasions, is the subject of dozens of clinical trials internationally. While evidence that hydroxychloroquine can treat the virus post-infection is thin, there is some data to suggest that it can work well as a prophylactic.7 Research is also being conducted on nearly 200 other treatments, including an improbable contender: famotidine, the compound found in the heartburn remedy Pepcid.8 Downside Risk: Too Open, Too Soon Chart 6The Lesson From The Spanish Flu: The Second Wave Could Be Worse Than The First
Risks To The U
Risks To The U
As noted above, once the number of new cases drops to sufficiently low levels, some relaxation of containment measures can be achieved without reigniting the pandemic. That said, there is a clear danger that measures will end up being relaxed too aggressively and too soon. This is precisely what happened during the Spanish Flu (Chart 6). It has become customary to talk about the risk of a second wave of infections; however, the reality is that we have not even concluded the first wave. While the number of cases in New York has been falling, it has been rising in many other US states. As a result, the total number of new coronavirus cases nationwide has remained steady for the past five weeks (Chart 7). It is the same story globally: Falling caseloads in western Europe and East Asia have been offset by rising cases in countries such as Russia, India, and Brazil (Chart 8). Chart 7The Spread Of COVID-19 Has Not Been Contained Everywhere (I)
Risks To The U
Risks To The U
Chart 8The Spread Of Covid-19 Has Not Been Contained Everywhere (II)
Risks To The U
Risks To The U
Chart 9Widespread Social Distancing Has Dampened The Spread Of All Flus And Colds
Risks To The U
Risks To The U
At the heart of the problem is that COVID-19 remains a highly contagious disease. Most studies assign a Reproduction Number, R, of 3-to-4 to the virus. As a point of comparison, the Spanish flu is estimated to have had an R of 1.8. An R of 3.5 would require about 70% of the population to acquire herd immunity to keep the virus at bay.9 As discussed in Box 2, the “true” level of herd immunity may be substantially greater than that. At this point, if you come down with a cough and fever, you should assume you have COVID. As Chart 9 shows, social distancing measures have brought the number of viral respiratory illnesses down to almost zero in the United States. Up to 30% of common cold cases stem from the coronavirus family. Just like it would be foolhardy to assume that the common cold has been banished from the face of the earth, it would be unwise to assume that COVID will not return if containment measures are quickly lifted. Downside Risk: Permanent Economic Damage Chart 10No Spike In Bankruptcies For Now
Risks To The U
Risks To The U
There are a lot of asymmetries in economics: It is easier to lose a job than to find one; starting a new business is also more difficult than going bankrupt. The good news so far is that bankruptcies have been limited and most unemployed workers have not been permanently laid off (Chart 10 and Chart 11). Thus, for the most part, the links that bind firms to workers have not been severed. Chart 11Temporary Layoffs Account For Most Of The Recent Increase In Unemployment
Temporary Layoffs Account For Most Of The Recent Increase In Unemployment
Temporary Layoffs Account For Most Of The Recent Increase In Unemployment
Unfortunately, there is a risk that the economy will suffer permanent damage if unemployment remains high and economic activity stays depressed. For some sectors, such as airlines, long-term damage is nearly assured. It took a decade for real household spending on airlines to return to pre 9/11 levels (Chart 12). It could take even longer for the physiological scars of the pandemic to fade. While businesses outside the travel and hospitality sectors will see a quicker rebound, they could still experience subdued demand for as long as social distancing measures persist. Chart 129/11 Was A Big Shock For US Air Travel
9/11 Was A Big Shock For US Air Travel
9/11 Was A Big Shock For US Air Travel
There is not much that fiscal policy can do to reverse the immediate hit to GDP from the pandemic. If people cannot work, they cannot produce. What fiscal stimulus can do is push enough money into the hands of households and firms to enable them to meet their financial obligations, while hopefully creating some pent-up demand that can be unleashed when businesses reopen. For now and for the foreseeable future, there is no need to tighten fiscal policy. The private sector in the major economies is generating plenty of savings with which governments can finance budget deficits. Indeed, standard economic theory suggests that if governments tried to “save more” by reducing budget deficits, total national savings would actually decline.10 Nevertheless, just as fiscal policy was prematurely tightened in many countries following the Great Recession, there is a risk that austerity measures will be reintroduced too quickly again. Likewise, calls to tighten monetary policy could grow louder. Just this week, Germany’s constitutional court ruled that the EU Court of Justice had overstepped its powers by failing to require the ECB to conduct an assessment of the “proportionality” of its controversial asset purchase policy. The German high court ordered the Bundesbank to suspend QE in three months unless the ECB Governing Council provides “documentation” showing it meets the criteria of proportionality. Among other things, the ruling could undermine the ECB’s newly launched €750 billion Pandemic Emergency Purchase Programme (PEPP). Downside Risk: Geopolitical Tensions Had the virus originated anywhere else but China, President Trump could have made a political case for further deescalating the Sino-US trade war in an effort to shore up the US economy and stock market. Not only did that not happen, but the likelihood of a new clash between China and the US has gone up dramatically. Antipathy towards China is rising (Chart 13). As our geopolitical team has stressed, the US election is likely to be fought on who can sound tougher on China. With the economy on the ropes, Trump will try to paint Joe Biden as too passive and conflicted to stand up to China. Indeed, running as a “war president” may be Trump’s only chance of getting re-elected. Chart 13US Nationalism Is On The Rise Amid Broad-Based Anti-China Sentiment
Risks To The U
Risks To The U
At the domestic political level, the pandemic has exacerbated already glaringly wide inequalities. While well-paid white-collar workers have been able to work from the comfort of their own homes, poorer blue-collar workers have either been furloughed or asked to continue working in a dangerous environment (in nursing homes or meat-packing plants, for example). It is not clear what the blowback from all this will be, but it is unlikely to be benign. Investment Implications Global equities and credit spreads have tracked the frequency of Google search queries for “coronavirus” remarkably well (Chart 14). As coronavirus queries rose, stocks plunged; as the number of queries subsided, stocks rallied. If there is a second wave of infections, anxiety about the virus is likely to grow again, leading to another sell-off in risk assets. Chart 14Joined At The Hip
9/11 Was A Big Shock For US Air Travel Joined At The Hip
9/11 Was A Big Shock For US Air Travel Joined At The Hip
Chart 15Negative Earnings Revisions Will Weigh On Stocks In The Near Term
Risks To The U
Risks To The U
Earnings estimates have come down, but are still above where we think they ought to be. This makes global equities vulnerable to a correction (Chart 15). Meanwhile, retail investors have been active buyers, eagerly gobblingup stocks such as American Airlines and Norwegian Cruise Lines that have fallen on hard times recently (Chart 16). They have also been active buyers of the USO oil ETF, which is down 80% year-to-date. When retail investors are trying to catch a falling knife, that is usually an indication that stocks have yet to reach a bottom. As such, we recommend that investors maintain a somewhat cautious stance on the near-term direction of stocks. Chart 16Retail Investors Keen To Buy The Dip
Risks To The U
Risks To The U
Chart 17Favor Equities Over Bonds Over A 12-Month Horizon
Favor Equities Over Bonds Over A 12-Month Horizon
Favor Equities Over Bonds Over A 12-Month Horizon
Chart 18USD Is A Countercyclical Currency
USD Is A Countercyclical Currency
USD Is A Countercyclical Currency
Looking further out, the spread between earnings yields and bond yields is wide enough to justify a modest overweight to stocks on a 12-month horizon (Chart 17). If global growth does end up rebounding, cyclicals should outperform defensives. As a countercyclical currency, the dollar will probably weaken (Chart 18). A weaker greenback, in turn, will boost commodity prices (Chart 19). Historically, stronger global growth and a softer dollar have translated into outperformance of non-US stocks relative to their US peers (Chart 20). Thus, investors should prepare to add international equity exposure to their portfolios later this year. Chart 19Commodity Prices Usually Rise When The Dollar Weakens
Commodity Prices Usually Rise When The Dollar Weakens
Commodity Prices Usually Rise When The Dollar Weakens
Chart 20Non-US Equities Tend To Outperform Their US Peers When Global Growth Is Improving And The Dollar Is Weakening
Non-US Equities Tend To Outperform Their US Peers When Global Growth Is Improving And The Dollar Is Weakening
Non-US Equities Tend To Outperform Their US Peers When Global Growth Is Improving And The Dollar Is Weakening
Box 1The Dynamics Of R
Risks To The U
Risks To The U
Box 2Why Herd Immunity Is Not Enough
Risks To The U
Risks To The U
Peter Berezin Chief Global Strategist peterb@bcaresearch.com Footnotes 1 Please see Global Investment Strategy Weekly Report, “Still Stuck In The Tree,” dated April 16, 2020. 2 Please see Global Investment Strategy Weekly Report, “Testing Times,” dated April 9, 2020. 3 Philip Anfinrud, Valentyn Stadnytskyi, et al., “Visualizing Speech-Generated Oral Fluid Droplets with Laser Light Scattering,” nejm.org (April 15, 2020); Jeremy Howard, Austin Huang, Li Zhiyuan, Zeynep Tufekci, Vladmir Zdimal, Helene-mari van der Westhuizen, et al., “Face Masks Against COVID-19: An Evidence Review,” Preprints.org, (April 12, 2020); and Liang Tian, Xuefei Li, Fei Qi, Qian-Yuan Tang, Viola Tang, Jiang Liu, Zhiyuan Li, Xingye Cheng, Xuanxuan Li, Yingchen Shi, Haiguang Liu, and Lei-Han Tang, “Calibrated Intervention and Containment of the COVID-19 Pandemic,” arxiv.org (April 2, 2020). 4 “COVID-19 – Research Evidence Summaries,” Royal College of Paediatrics and Child Health; and Alison Boast, Alasdair Munro, and Henry Goldstein, “An evidence summary of Paediatric COVID-19 literature,” Don’t Forget The Bubbles (2020). 5 Hiroshi Nishiura, Hitoshi Oshitani, Tetsuro Kobayashi, Tomoya Saito, Tomimasa Sunagawa, Tamano Matsui, Takaji Wakita, MHLW COVID-19 Response Team, and Motoi Suzuki, “Closed environments facilitate secondary transmission of coronavirus disease 2019 (COVID-19),” medRxiv (April 16, 2020). 6 “Coronavirus: Arrests as California beachgoers defy lockdown,” Skynews (April 26, 2020); and “High-risk sex offender rearrested days after controversial release from OC Jail,” abc7.com (May 1, 2020). 7 Sun Hee Lee, Hyunjin Son, and Kyong Ran Peck, “Can post-exposure prophylaxis for COVID-19 be considered as an outbreak response strategy in long-term care hospitals?” International Journal of Antimicrobial Agents (April 25, 2020). 8 Brendan Borrell, “New York clinical trial quietly tests heartburn remedy against coronavirus,” Science (April 26, 2020). 9 In the simplest models, the herd immunity threshold is reached when P = 1-1/Ro, where P is the proportion of the population which has acquired immunity and Ro is the basic reproductive number. Assuming an Ro of 3.5, heard immunity will be achieved once more than 71.4% of the population has been infected (1-1/3.5). For further discussion on this, please refer to Global Investment Strategy, “Second Quarter 2020 Strategy Outlook: World War V,” dated March 27, 2020. 10 It is easiest to understand this point by considering a closed economy where savings, by definition, equals investment. Savings is the sum of private and public savings. Suppose the economy is depressed and the government increases public savings by either raising taxes or cutting spending. Since this action will further depress the economy, private investment will fall even more. But, since investment must equal total savings, private savings must decline more than proportionately with any increase in public savings. This happens because tighter fiscal policy leads to lower GDP. It is difficult to save if one does not have a job. To the extent that lower GDP reduces employment, it also tends to reduce private-sector savings. Global Investment Strategy View Matrix
Risks To The U
Risks To The U
Current MacroQuant Model Scores
Risks To The U
Risks To The U
Highlights Base metals are rebounding faster than oil in 2Q20, reflecting China’s first-in-first-out recovery from the global GDP hit caused by the COVID-19 pandemic (Chart of the Week). By 3Q20, the rebound in oil markets could be stronger than expected and surpass the base metals’ recovery, if the IMF’s latest EM GDP growth projections prove out. We examine a higher-growth scenario for non-OECD oil consumption – our proxy for EM demand – using the Fund’s projections. In it, EM oil consumption rises to 54.9mm b/d by 4Q20 and 56.4mm b/d by 4Q21. This would exceed our current estimates by 6.6% this year and 2.1% in 2021, if realized. Stronger EM consumption, coupled with global crude-oil production cuts would cause crude and product inventories to draw sooner and faster than expected, if these trends continue. Global policy uncertainty – economic and political – remains the critical risk to our metals and oil price outlooks, as it could retard a revival of growth and trade. The US and China appear to be on a collision course once again. Serious risks to global public health remain, particularly in light of a recently disclosed mutation to COVID-19. Feature Base metals are rebounding faster than oil in 2Q20, reflecting China’s first-in-first-out recovery from the global GDP hit caused by the COVID-19 pandemic. Prices for base metals likely will continue rebounding from the global hit to GDP caused by COVID-19 and its associated lockdowns, recovering more of the ground lost to the pandemic in 2Q20 than crude oil prices. This is largely a reflection of China’s first-in-first-out recovery from the global pandemic and the aggregate demand destruction following in its wake. This is the signal coming from our updated market-driven indicators shown in the Chart of the Week.1 China accounts for ~ half of the demand for refined base metals worldwide, and a comparable share of the supply side for refined metals and steel (Chart 2). Chart of the WeekBase Metals Rebounding Faster Than Crude Oil
Base Metals Rebounding Faster Than Crude Oil
Base Metals Rebounding Faster Than Crude Oil
We use principal components analysis to extract common factors driving industrial commodity prices in real time from trading markets, which allows us to get a preliminary estimate of the recovery in base metals and crude oil demand. The two indicators shown in the Chart of the Week use daily stock and commodity prices, and other daily economic data. These indicators are called the Metals Demand Component and the Oil Demand Component. The former is largely dependent on the recovery in China/EM industrial activity, and also affects all cyclical commodities, including oil. Chart 2China Dominates Base Metals Supply And Demand
First Metals Then Crude
First Metals Then Crude
Chart 3Policy Stimulus Will Restore Profitability In China
Policy Stimulus Will Restore Profitability In China
Policy Stimulus Will Restore Profitability In China
The base metals’ rebound likely will continue throughout 2H20 as China’s economic activity gradually normalizes, fiscal and monetary stimulus kick in, and firms’ profitability recovers (Chart 3). “China’s industrial sector should get a boost from an acceleration in infrastructure investment and producer prices should turn moderately positive later in Q3,” based on the analysis of our colleagues in BCA’s China Investment Strategy.2 A weaker USD will start showing up in stronger indications of global growth – particularly in the EM markets – which will reverse the downtrend in our data-driven indicators of economic activity (Chart 4). However, given the lags in the release of these data, this will take time. Currently, our Metals Demand Component suggests the trend in base metals demand is upward and established, while our Oil Demand Component is still quite volatile and not yet decisively upward. Nonetheless, our oil indicator does highlight what appears to be a bottom in oil demand. Chart 4A Weaker USD Will Reverse Lagging Indicators Of Activity
A Weaker USD Will Reverse Lagging Indicators Of Activity
A Weaker USD Will Reverse Lagging Indicators Of Activity
EM Demand Surge Will Revive Oil Prices The EM oil-demand growth forecast derived from the IMF’s GDP projections indicate growth could rise to as much as 54.9mm b/d by 4Q20 and 56.4mm b/d by 4Q21. This would exceed our current estimates by 6.6% this year and 2.1% in 2021, if realized. Over the short term, oil prices could diverge from demand until storage builds are contained and the market moves into a deficit. The logistics of moving and storing oil remains the primary driver of its price over the very short term, especially for landlocked crudes. The drain in storage could occur earlier than we expected in our forecast last month, if the IMF’s global growth trajectory play out in line with its latest projections.3 Using the Fund’s projections for EM GDP, we examine a scenario in which non-OECD oil demand grows significantly more than we estimated last month. Indeed, the EM oil-demand growth forecast derived from the IMF’s GDP projections indicate growth could rise to as much as 54.9mm b/d by 4Q20 and 56.4mm b/d by 4Q21. This would exceed our current estimates by 6.6% this year and 2.1% in 2021 (Chart 5), if realized. EM growth is the critical variable for global oil-demand growth, accounting for ~ 80% of global consumption growth in the past five years. As we’ve noted for some time, the massive fiscal and monetary stimulus being deployed globally will fuel the recovery of commodity demand (Chart 6). The oil-demand scenario driven by the IMF’s latest GDP projections, and the EIA’s April forecast share a common view of a sharp recovery in the level of non-OECD demand, with the former seeing demand destruction reversed by September, and the latter expecting EM consumption to return to pre-COVID-19 levels toward the end of this year, slightly ahead of us.4 Chart 5EM Oil Demand Could Surge On The Back Of Massive Global Stimulus
EM Oil Demand Could Surge On The Back Of Massive Global Stimulus
EM Oil Demand Could Surge On The Back Of Massive Global Stimulus
Chart 6Global Fiscal and Monetary Stimulus Will Surge In 2020 And 2021
First Metals Then Crude
First Metals Then Crude
A surge in EM oil-demand growth – should it play out as expected – will occur against the backdrop of sharply lower global production levels this year. OPEC 2.0 pledged to cut ~ 8mm b/d starting this month vs. its 1Q20 levels, with its putative leaders – KSA and Russia – accounting for ~ 1.5mm b/d and 2mm b/d, respectively, of the reductions. (Based on OPEC 2.0’s October 1, 2018, reference level – except for KSA and Russia, both of which are cutting from a nominal 11mm b/d level – the cuts amount to almost 10mm b/d for May-June, and 7.7mm b/d for 2H20).5 In addition, the US likely will lose close to 2.5mm b/d from involuntary cuts between now and the end of 2021 due to the global oil price collapse (Chart 7).6 Chart 7US Shale-Oil Output Could Fall ~ 2.5mm b/d
US Shale-Oil Output Could Fall ~ 2.5mm b/d
US Shale-Oil Output Could Fall ~ 2.5mm b/d
OPEC 2.0 Might Have To Lift Production The demand surge implied by the IMF’s expected EM GDP recovery this year and next almost surely would be met by higher output in OPEC 2.0 production. The demand surge implied by the IMF’s expected EM GDP recovery this year and next almost surely would be met by higher output in OPEC 2.0 production, to keep prices from charging ahead too sharply in 2H20 and in 2021. The increase in the coalition’s spare capacity – consisting of the production taken off the market through production cuts and the 2.5mm b/d or so that it had prior to the COVID-19-induced demand destruction – will allow OPEC 2.0 to quickly meet any supply shortfalls as demand recovers before the US shale-oil producers can ramp production. All the same, the market could experience episodic volatility on the upside, if our EM demand calculations based on IMF GDP projections and those of the EIA are correct. It is highly likely, in our view, OPEC 2.0 will be the direct beneficiary of the massive fiscal and monetary stimulus of the DM and EM economies– oil being a derived demand that depends on the income available to firms and households. This means the odds of seeing $80/bbl Brent is more likely than not next year: Importantly, EM and DM consumers will be better equipped to absorb higher oil prices with the massive stimulus sloshing around the global economy next year. For now, we are maintaining our expectation of $65/bbl average prices for Brent next year, but we will continue to watch EM GDP growth in upcoming World Bank and IMF research (Chart 8). Chart 8Upside Risks in Oil Prices As GDP Growth Prospects Improve
Upside Risks in Oil Prices As GDP Growth Prospects Improve
Upside Risks in Oil Prices As GDP Growth Prospects Improve
Oil Price Risks Abound An upside surprise in EM oil-demand growth – consistent with the IMF’s revised GDP projections – could cause us to increase our demand expectation when we update balances and forecasts this month. Two-way price risk abounds in the oil markets. Even if options volatility on the CBOE is considerably lower than its recent record-setting peak, it still is close to 100% on an annualized basis (Chart 9). On the upside, as we’ve discussed above, if EM GDP growth is in the neighborhood projected by the IMF, demand could surge, based on our calculations. We have no doubt OPEC 2.0 can cover any shortfall, but it can’t do it immediately, so we would expect episodic volatility this year and next. Chart 9Oil Price Risk Abounds
Oil Price Risk Abounds
Oil Price Risk Abounds
On the downside, the COVID-19 pandemic could enter a second wave just as governments around the world are removing lockdown orders and phasing in a return to normal commerce. Of particular note in this regard is the emergence of a mutation of the original strain of the COVID-19 virus that is more contagious, and now constitutes the dominant strain in the world. The mutated form of the virus appeared in Europe and quickly spread to the US east coast, and then the rest of the planet.7 Also, the risk that “animal spirits” will not re-emerge in businesses and consumers globally remains elevated. Despite the large increase in global money supply, confidence needs to be restored for the money multiplier to move up. In addition to that, signs of another round in the Sino-US trade war in the offing could restrain growth and trade. Bottom Line: Our base case remains a resumption in global growth in 2H20, with base metals recovering most of their lost ground in 2Q20 and oil following in 3Q20. An upside surprise in EM oil-demand growth – consistent with the IMF’s revised GDP projections – could cause us to increase our demand expectation when we update balances and forecasts this month. However, serious risks to global public health remain, and trade tensions between the US and China once again are percolating. Robert P. Ryan Chief Commodity & Energy Strategist rryan@bcaresearch.com Hugo Bélanger Associate Editor Commodity & Energy Strategy HugoB@bcaresearch.com Commodities Round-Up Energy: Overweight Refinery runs in the US collapsed by 25% this year in the wake of the COVID-19-induced economic shutdown. Still, WTI prices rose 30% this week – from a very low level – as oil supply in the US – and globally – is adjusting rapidly to lower demand (Chart 10). Wells shut-ins are accelerating throughout North America. In the Bakken Basin, shut-ins reportedly reached 400k b/d this week.8 Moreover, the effect of the 50% YTD decline in US rig count will be visible over the coming weeks. The rig count is now well below the level necessary to keep production flat. Precious Metals: Neutral Gold prices remained above $1,700/oz as of Tuesday’s close, supported by elevated economic uncertainty. Virus-related uncertainty will gradually wane as economies reopen. This could pull gold down temporarily as safe-asset demand is reduced. Nonetheless, our Geopolitical team believes risk and uncertainty will partly shift to the geopolitical arena in the run-up of the US election.9 Additionally, the massive stimulus by the US Fed and Treasury will become an important driver of the yellow metal’s price going forward. Gold will trend higher as US rates remain stuck at zero, as it did in 2008 (Chart 11). Ags/Softs: Underweight Following lockdown easing measures in different parts of the world, hopes of a rebound in ethanol demand helped push CBOT Corn futures 0.5% higher on Tuesday. Additionally, continuing drought conditions in Brazil will limit the country’s yields and support corn prices in the near term. Soybeans climbed 3¢/bu on Tuesday, backed by China’s booking of 378k tons of the oilseed as it seeks to fulfill the US trade deal obligations. Gains throughout corn and soybeans were mitigated by a strong planting progress as reported by the USDA. Wheat ended slightly higher after field assessments conducted by Oklahoma State University Extension projected the state harvest down by 13.5 Mn bushels year-on-year. Chart 10Crude Recouping Some Ground
Crude Recouping Some Ground
Crude Recouping Some Ground
Chart 11Fed Rates Stuck At Zero Will Push Gold Higher
Fed Rates Stuck At Zero Will Push Gold Higher
Fed Rates Stuck At Zero Will Push Gold Higher
Footnotes 1 Given the importance of the daily prices in these indicators, we are explicitly assuming trading markets are continually processing fundamental information on supply, demand, inventories, and financial and economic conditions in industrial commodity markets and reflecting them in prices. This is especially important when an exogenous event like the COVID-19 pandemic hits global markets. Market participants have to work out the implications of the shock and its resolution in real time, which can make for exceptionally volatile prices. Lags in the economic data provided by the likes of the World Bank, the IMF, EIA, IEA and OPEC make the time series we typically rely on to model fundamentals and their expected evolution less effective in estimating the current state of commodity markets. Their forecasts, however, remain extremely useful, as they are developed by analysts with particular expertise in global macroeconomic forecasting, in the case of the World Bank and IMF, and oil markets, in the case of the EIA, IEA and OPEC. 2 Please see A Slow And Rocky Path To Recovery published by BCA Research’s China Investment Strategy April 29, 2020. It is available at cis.bcaresearch.com. 3 Please see US Storage Tightens, Pushing WTI Lower for our most recent supply-demand balances and oil price forecasts, which were published April 16, 2020. We use the global growth forecasts of the IMF and the World Bank as inputs to our fundamental modeling to estimate oil demand. In particular, we’ve found a parsimonious relationships between OECD, non-OECD and world oil demand and DM and EM GDP. Chapter 1 of the Fund’s advance forecast was published last month in its World Economic Outlook under the title “The Great Lockdown.” 4 Assuming the Fund’s projections of EM GDP are approximately correct, the impact on oil demand is quite large as can be seen in the comparisons shown in Chart 5. However, the IMF’s estimate for oil prices is sharply below our estimate, which was made last month assuming lower levels of EM oil demand. We expect Brent crude oil prices to average $39/bbl this year and $65/bbl next year, vs. the Fund’s estimate of $35.61/bbl in 2020 and $37.87/bbl in 2021. The EIA’s estimate of non-OECD demand is comparable to our, as seen in Chart 6, but its price forecasts for this year and next – $33/bbl and $46/bbl – also are below ours. 5 Please see US Storage Tightens, Pushing WTI Lower, where we outline OPEC 2.0’s cuts. 6 Please see our April 30 report entitled Stand By For Heavy Rolls: June WTI Could Go Below $0.00/bbl for additional discussion. 7 Please see The coronavirus has mutated and appears to be more contagious now, new study finds published by cnbc.com May 5, 2020. 8 Please see 'Like watching a train wreck': The coronavirus effect on North Dakota shale oilfields published by reuters.com May 4, 2020. 9 Please see #WWIII published by BCA Research’s Geopolitical Strategy May 1, 2020. It is available at gps.bcaresearch.com. Investment Views and Themes Recommendations Strategic Recommendations Tactical Trades Trade Recommendation Performance In 2020 Q1
First Metals Then Crude
First Metals Then Crude
Commodity Prices and Plays Reference Table Trades Closed In 2020 Summary of Closed Trades
First Metals Then Crude
First Metals Then Crude
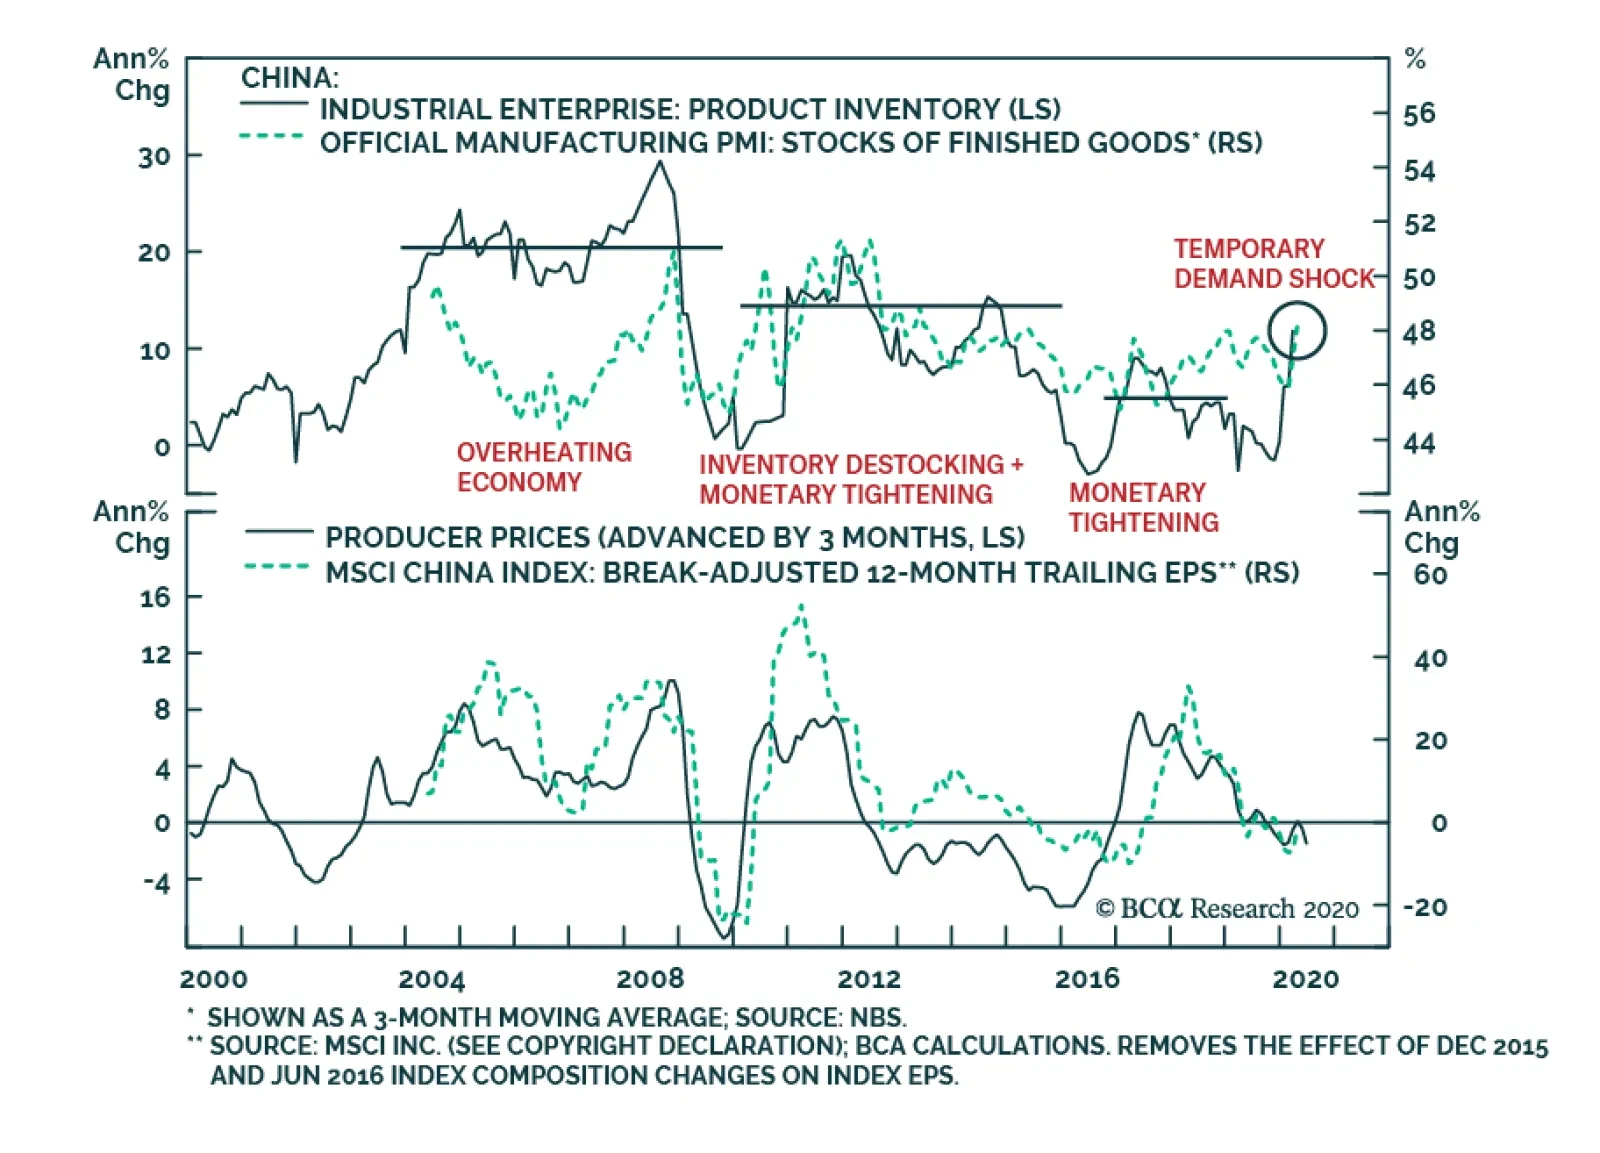
Yesterday, BCA Research's China Investment Strategy service concluded that the pressure on inventory should start to ease in the second half of this year. The imbalance in the recoveries of China’s supply and demand has led to a pileup in inventory, the…