China

Highlights The current pace in the recovery of China’s domestic demand has not been robust enough to fully offset the impact from the collapse in exports. The level of industrial inventory jumped to a five-year high, but it will likely be transitional. We expect the inventory overhang to subside when the recovery speed in demand catches up with supply in H2. While the gap is widening between stock prices and economic fundamentals in the US, Chinese equity prices have been more “well behaved” in the past month. We continue to overweight Chinese stocks in the next 6 to 12 months and favor Chinese onshore corporate bonds overall and SOEs in particular. Feature China’s Caixin and official PMIs in April highlighted the knock-on effects on the Chinese economy from a collapse in external demand. Although China’s domestic economy continued its rebound, the pace of the improvement has not been robust enough to offset rapidly weakening exports. This was evident in the widening gap between supply and demand in April. The sharp contraction in the global economy in Q1 will likely deepen in Q2 because the lockdowns in Europe and the US started in the later part of Q1 and have mostly remained in place through end-April. We expect global demand to significantly worsen in April and May, generating strong headwinds to China’s near-term recovery. Chinese authorities have been prompted to step up their stimulus efforts due to a fast deterioration in global growth. The government recently approved an additional 1-trillion yuan in local government special-purpose bond issuance, which is scheduled to be fully dispersed by the end of May. China’s stimulus, strongly focused on boosting investment and economic growth, should fuel Chinese stock and industrial metal prices in the next 6 to 12 months. Tables 1 and 2 below highlight key developments in China’s economic and financial market performance in the past month. Table 1China Macro Data Summary
China Macro And Market Review
China Macro And Market Review
Table 2China Financial Market Performance Summary
China Macro And Market Review
China Macro And Market Review
Chart 1Construction Sector Has Seen The Strongest Rebound
Construction Sector Has Seen The Strongest Rebound
Construction Sector Has Seen The Strongest Rebound
China’s domestic demand partially offset a collapse in exports in April. The official manufacturing PMI slipped to 50.8 in April from 52 in the previous month. The Caixin PMI survey, which is skewed towards smaller and more export-oriented firms, returned to contractionary territory in April following a brief rebound in March. The retreat in both PMI readings highlights how a worldwide lockdown of businesses has shaken China’s manufacturing sector (Chart 1, top panel). This exogenous negative impact will likely worsen in Q2. China's domestic economy continued its slow recovery through April. The official PMI’s new orders subcomponent declined by only 2 percentage points, despite a collapse of new export orders to 33.5. Moreover, the new orders subcomponent of the non-manufacturing PMI survey increased from 49.2 to 52.1, with the construction subcomponent reverting to its pre-pandemic level. The construction employment subcomponent also confirms that the industry has shown the strongest rebound among sectors in the Chinese economy (Chart 1, middle and bottom panels). Chart 2Home Sales Are Likely To Accelerate
Home Sales Are Likely To Accelerate
Home Sales Are Likely To Accelerate
China’s housing market also continued to improve in April. Chart 2 (top panel) shows that the demand for both residential housing and floor space started rebounding in March. The high frequency data indicate the year-over-year growth rate in home sales in China’s 30 large- and medium-sized cities turned positive in April (Chart 2, middle panel). The rapid expansion in home sales in the past weeks may be due to recent discount promotions, but we anticipate housing prices to remain stable this year in line with the Chinese leadership’s policy direction (“houses are for living, not for speculation”). We also expect that the number of home sales will accelerate. Local governments will significantly ramp up land sales this year to make up for their large revenue shortfalls. The central government will continue to gradually relax real estate purchase restrictions. The more property market-friendly policies, coupled with extremely accommodative monetary conditions, will encourage a healthy rally in property market investment and housing demand in H2 (Chart 2, bottom panel). So far most improvement in China’s domestic demand seems to be concentrated in the construction sector. The slow pace of manufacturers’ capacity utilization suggests that China’s industrial output growth is unlikely to return to its pre-pandemic rate in Q2. As of April 25, among the official PMI surveyed enterprises, the resumption rate of large- and medium-sized enterprises was 98.5%. However, only 77.3% of them reported that they were operating at 80% or higher of their usual capacity utilization rates.1 Chart 3Pressure On Inventory Should Start To Ease In H2
Pressure On Inventory Should Start To Ease In H2
Pressure On Inventory Should Start To Ease In H2
The imbalance in the recoveries of China’s supply and demand has led to a pileup in inventory, the highest level in five years (Chart 3). The combination of excessive inventory and low demand has weakened China’s factory pricing power and profit growth. However, in our view, the inventory overhang will be temporary, and the factory price contraction is unlikely to turn into a deep deflation such as the one in 2009 or the long-lasting deflationary cycle from 2012-2015. The level of industrial inventory has been much lower than it was during the four years leading to the 2008/2009 global financial crisis (GFC) and the 2015/2016 deep deflationary cycle. The deflation in factory prices also has been relatively mild compared with the two previous phases. Moreover, an extremely tight monetary policy and protracted inventory destocking period that contributed to the collapse in global raw material prices in 2012 are not present. Declines in China’s manufacturing, raw material and mining prices are synchronized, echoing the GFC when global demands nose-dived and pushed international oil and raw material prices into deep contractions. Our baseline scenario of an incremental re-opening of the global economy, a peak in the US dollar, and a recovery in the oil market in H2, all support our view that the deflation in China’s producer prices should not last beyond Q3. Given that exports’ share to China’s GDP is currently half of what it was in 2008, the weakness in global demand will be much less of a drag on China’s domestic manufacturing sector than during the GFC. Chart 4Logistics Bottleneck Still In Place
Logistics Bottleneck Still In Place
Logistics Bottleneck Still In Place
Additionally, the drawdown in April’s raw material inventory and an increase in the official PMI’s supplier delivery subcomponents suggest that some lingering logistical bottlenecks may be at play, preventing China’s domestic business operations from recuperating at full speed (Chart 4). We expect a further relaxation of intra- and inter-provincial travel restrictions following the National People’s Congress (NPC) on May 22 in Beijing. This easing should help to accelerate the normalization in both manufacturing activities and inventory levels. The outperformance of Chinese equity prices versus global stocks has eased significantly in the past month (Table 3 and Chart 5). The moderation suggests that investors may be starting to factor in a slower-than-expected economic recovery in China. Near-term risks are still high for further selloffs in both Chinese and global stocks. Nevertheless, we think the rapid advancement in global stock prices in the past month, particularly the SPX, means that Chinese stocks are not as overbought as in February and March. The widening gap between US equity prices and economic fundamentals makes the SPX more vulnerable to near-term uncertainties surrounding global economic recovery. We maintain our view that a combination of massive Chinese stimulus and the momentum in China’s economic recovery in H2 should support an outperformance in Chinese stocks in the next 6 to 12 months. Table 3Chinese Stocks Advanced Much Less Than SPX In April
China Macro And Market Review
China Macro And Market Review
Chart 5Chinese Stocks Less Overbought Now
Chinese Stocks Are Less Overbought Now
Chinese Stocks Are Less Overbought Now
The bull steepening in the government bond yield curve since March 23 flattened a bit in the last week of April, but it remains heightened with the short end of the yield curve falling much faster than the long end (Chart 6). This suggests that domestic investors expect China’s ultra-easy monetary policy to remain in place in the near term due to uncertainties surrounding the global pandemic and a slow economic upturn. At the same time, investors do not believe the weakness in the Chinese economy will persist long enough to warrant a sustained easy monetary policy regime. In addition, China’s 10-year government bond yield fell by 60bps so far this year, about half of the drop in the 10-year US Treasury bond yield (Chart 6, bottom panel). Even though we think the long end of the government bond yield curve has yet to bottom,2 the relatively stable return and RMB exchange rate make Chinese government bonds a safe bet for global investors seeking less risky assets. Chart 6Chinese 10-Year Government Bond Yield Has Not Capitulated
Chinese 10-Year Government Bond Yield Has Not Capitulated
Chinese 10-Year Government Bond Yield Has Not Capitulated
Chart 7Chinese Onshore Corporate Bonds Still Offer Solid Returns
Chinese Onshore Corporate Bonds Still Offer Solid Returns
Chinese Onshore Corporate Bonds Still Offer Solid Returns
Chart 7 highlights that the ChinaBond Corporate Bond total return index remains in a solid uptrend in both local currency and USD terms, despite the incredible strength in the USD since March. We continue to recommend onshore corporate bond positions in the coming 6-12 months.For domestic investors, we favor a diversified portfolio of SOE corporate bonds. Even though bond defaults will likely rise in the next 6-12 months, they will probably remain lower than what the market is currently pricing in. Qingyun Xu, CFA Senior Analyst qingyunx@bcaresearch.com Jing Sima China Strategist jings@bcaresearch.com Footnotes 1NBS’s interpretation of China April PMI. http://www.stats.gov.cn/tjsj/sjjd/202004/t20200430_1742576.html 2Please see China Investment Strategy Weekly Report "Three Questions Following The Coronacrisis," dated April 23, 2020, available at cis.bcaresearch.com Cyclical Investment Stance Equity Sector Recommendations
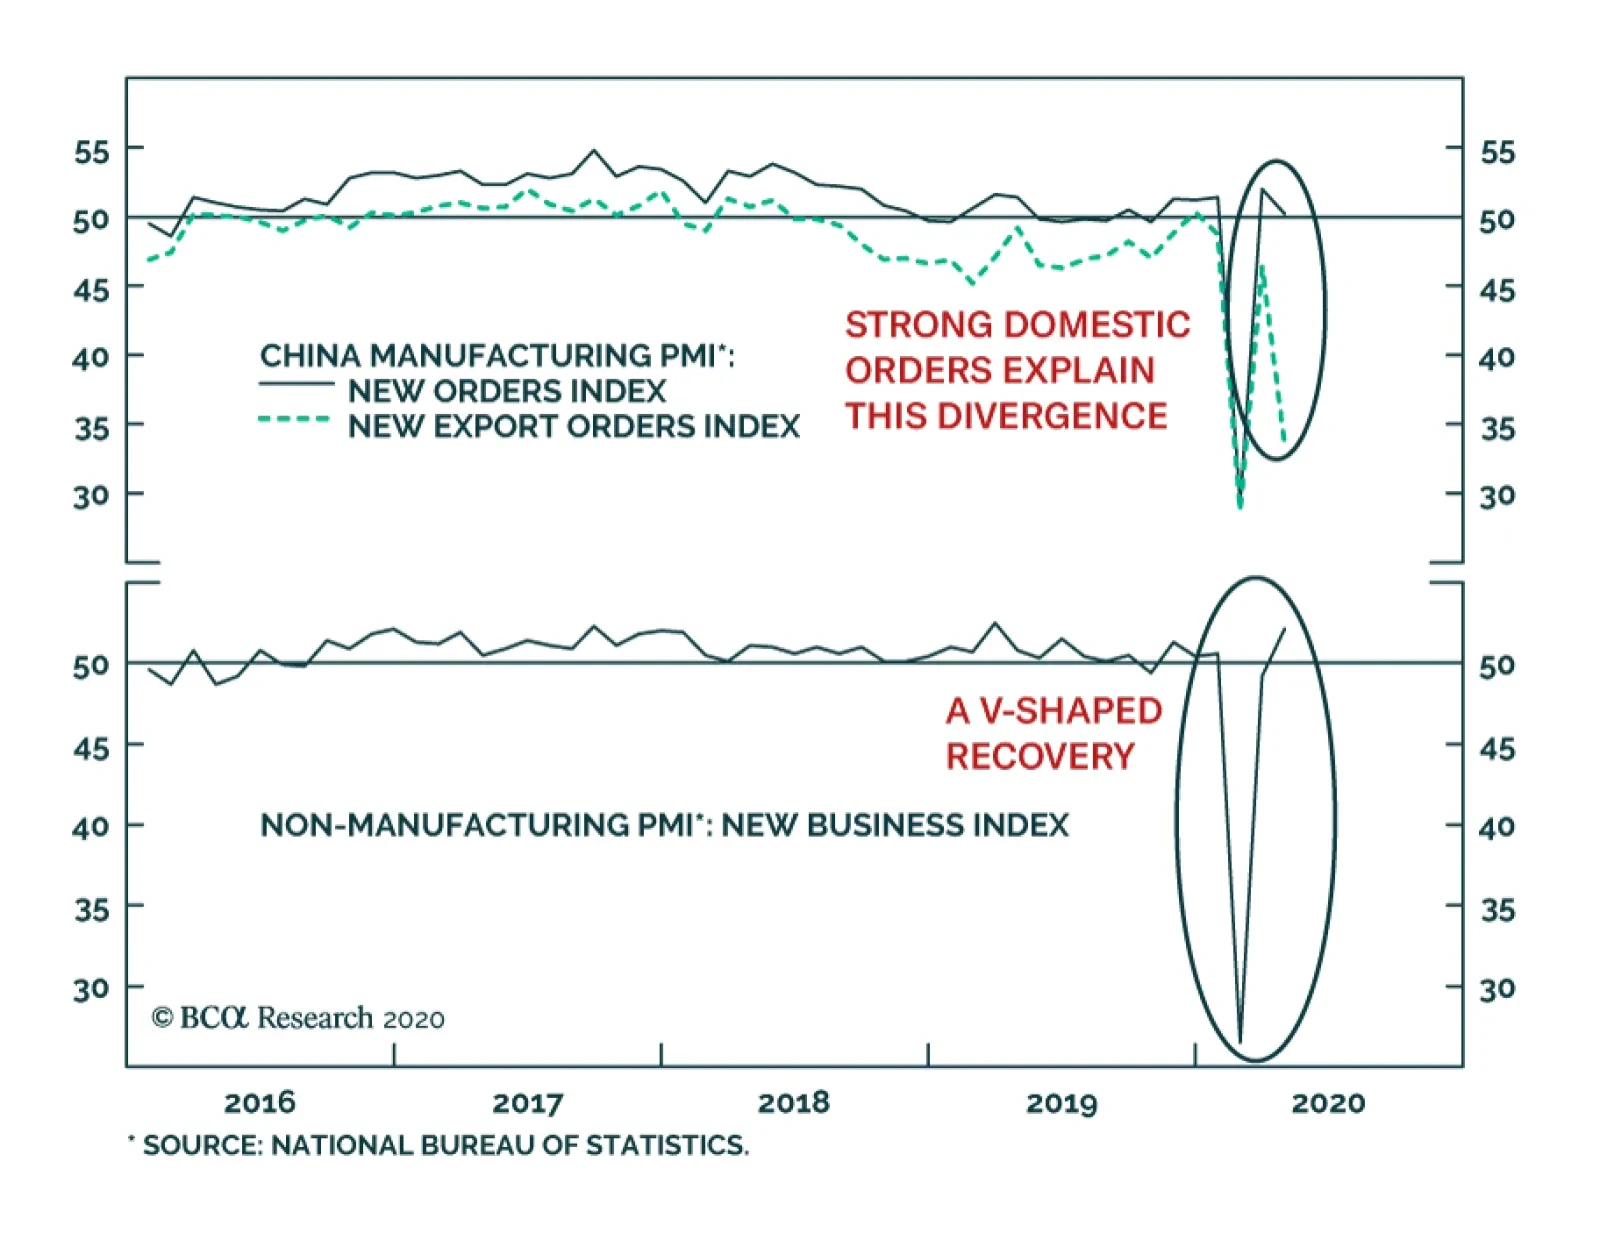
In sharp contrast to the US, the Chinese PMIs were soft. When looking at overall manufacturing activity, there is little redeeming feature. However, the details of the survey reveal that the export sector is a drag on activity, not the domestic economy. …
Highlights Over the past 24 hours the White House has taken several steps indicating that President Trump is adopting the “war president” posture in the run-up to the US election. The intensity of the US-China rivalry can escalate dramatically. We maintain our defensive tactical positioning and are going long US 10-year treasuries. Feature The phrase “World War III” or #WWIII went viral earlier this year in response to a skirmish between the US and Iran (Chart 1). Only four months later, the US and China are escalating a strategic rivalry that makes the Iran conflict look paltry by comparison (Chart 2). Chart 1US-Iran Tensions Were Just A Warm-Up
#WWIII
#WWIII
Chart 2The Thucydides Trap
The Thucydides Trap
The Thucydides Trap
Fortunately, the two great powers are constrained by the same mutually assured destruction that constrained the US and the Soviet Union during the Cold War. They are also constrained by the desire to prevent their economies from collapsing further. Unfortunately, the intensity of their rivalry can escalate dramatically before reaching anything truly analogous to the Berlin Airlift or Cuban Missile Crisis – and these kinds of scenarios are not out of the question. Safe haven assets will catch a bid and the recovery in US and global risk assets since the COVID selloff will be halted. We maintain our defensive tactical positioning and will close two strategic trades to book profits and manage risk. In the wake of the pandemic and recession, geopolitics is the next shoe to drop. The War President Over the past 24 hours the White House has taken several steps indicating that President Trump is adopting the “war president” posture in the run-up to the US election: Export controls: Trump has gone forward with new export controls on “dual-purpose” technologies – those that have military as well as civilian applications, in a delayed reaction to China’s policy of civil-military technological fusion. The Commerce Department has wide leeway in whether to grant export licenses under the rule – but it is a consequential rule and would be disruptive if enforced strictly. Supply chain de-risking: Trump is also going forward with new restrictions on the import of foreign parts for US power plants and electricity grid. The purpose is to remove risks from critical US infrastructure. COVID investigation: Trump has hinted that the novel coronavirus that causes the COVID-19 disease may have originated in the Wuhan Institute of Virology. The Director of National Intelligence issued a statement indicating that the Intelligence Community does not view the virus as man-made (not a bio-weapon), but is investigating the potential that the virus transferred to humans at the institute. The State Department had flagged the institute for risky practices long before COVID. Trump avoided the bio-weapon conspiracy theory and is focused on the hypothesis that the laboratory’s investigations into rare coronaviruses led to the outbreak. New tariffs instead of reparations: Director of the National Economic Council Larry Kudlow denied that the US would stop making interest and principal payments on some Chinese holdings of US treasuries. He said that the “full faith and credit of the United States’ debt obligation is sacrosanct. Absolutely sacrosanct.” Trump denied that this form of reparations, first floated by Republican Senator Marsha Blackburn of Tennessee, was under consideration. Instead he suggested that new tariffs would be much more effective, raising the threat for the first time since the Phase One trade deal was agreed in principle in December. Strategic disputes: Tensions have flared up in specific, concrete ways across the range of US-Chinese relations – in the cyber-realm, psychological warfare, Korean peninsula, Taiwan Strait, and South China Sea. These could lead to sanctions. The war president posture is one in which President Trump recognizes that reelection is extremely unlikely in an environment of worse than -4.8% economic growth and likely 16% unemployment. Therefore he shifts the basis of his reelection to an ongoing crisis and appeals to Americans’ patriotism and desire for continuity amid crisis. Bottom Line: Protectionism is not guaranteed to work, and therefore it was not ultimately the path Trump took last year when he still believed a short-term trade deal could boost the economy. Now the bar to protectionism has been lowered. The Decline Of US-China Relations President Trump may still be bluffing, China may take a conciliatory posture, and a massive cold war-style escalation may be avoided. However, it is imprudent to buy risk assets on these reasons today, when the S&P 500’s forward price-to-earnings ratio stands at 20.15. It is more prudent to prepare for a historic escalation of tensions first, buy insurance, then reassess. Why? Because the trajectory of US-China relations is empirically worsening over time. US household deleveraging and the Chinese shift away from export-manufacturing (Chart 3) broke the basis of strong relations during the US’s distractions in Iraq and Afghanistan and China’s “peaceful rise” in the early 2000s. US consumers grew thriftier while Chinese wages rose. Not only has China sought economic self-sufficiency as a strategic objective since General Secretary Xi Jinping took power in 2012, but the Great Recession, Trump trade war, and global pandemic have accelerated the process of decoupling between the two economies. Decoupling is an empirical phenomenon, and it has momentum, however debatable its ultimate destination (Chart 4). Obviously policy at the moment is accelerating decoupling. Chart 3The Great Economic Divorce
The Great Economic Divorce
The Great Economic Divorce
Chart 4Decoupling Is Empirical
Decoupling Is Empirical
Decoupling Is Empirical
The US threat to cease payments on some of China’s Treasury holdings is an inversion of the fear that prevailed in the wake of 2008, that China would sell its treasuries to diversify away from dependence on the US and the greenback. China did end up selling its treasuries, but the US was not punished with higher interest rates because other buyers appeared. The US remains the world’s preponderant power and ultimate safe haven (Chart 5). By the same token, Trump and Kudlow naturally poured water on the threat of arbitrarily stopping payments because that would jeopardize America’s position. Chart 5Treasuries Can't Be Weaponized By Either Side...
Treasuries Can't Be Weaponized By Either Side...
Treasuries Can't Be Weaponized By Either Side...
Chart 6... But Tariffs Can And Will Be
... But Tariffs Can And Will Be
... But Tariffs Can And Will Be
Instead Trump is threatening a new round of trade tariffs. Since the US runs a large trade deficit with China, and China is more exposed to trade generally, the US has the upper hand on this front. But it is important to notice that US tariff collections as a share of imports bottomed under President Obama (Chart 6). The US shift away from free trade toward protectionism occurred in the wake of the 2008 financial crisis. President Trump then popularized and accelerated this policy option in an aggressive and unorthodox way. Trade tariffs are a tool of American statecraft, not the whim of a single person, who may exit the White House in January 2021 anyway. The retreat from globalization is not a passing fancy. Today’s recession also marks the official conclusion of China’s historic 44 year economic boom – and hence a concrete blow to the legitimacy of the ruling Communist Party (Chart 7). The more insular, autarkic shift in the Communist Party’s thinking is not irreversible, but there are no clear signs that Xi Jinping is pivoting toward liberalism after eight years in power. Chart 7Recession Destabilizes The 'G2' Powers
Recession Destabilizes The 'G2' Powers
Recession Destabilizes The 'G2' Powers
China’s unemployment rate has been estimated as high as 20.5% by Zhongtai Securities, which then retracted the estimate (!). It is at least at 10%. Moreover 51 million migrant workers vanished from the job rolls in the first quarter of the year. Maximum employment is the imperative of East Asian governments, especially the Communist Party, which has not dealt with joblessness since the late 1990s. The threat to social and political stability is obvious. The party will take extraordinary measures to maintain stability – not only massive stimulus but also social repression and foreign policy distraction to ensure that people rally around the flag. Xi Jinping has tried to shift the legitimacy of the party from economic growth to nationalism and consumerism, the “China Dream.” But the transition to consumer growth was supposed to be smooth. Financial turmoil, the trade war, and now pandemic and recession have forced the Communist Party off the training wheels well before it intended. Xi’s communist ideology, economic mercantilism, and assertive foreign policy have created an international backlash. The US is obviously indulging in nationalism as well. A stark increase in inequality and political polarization exploded in President Trump’s surprise election on a nationalist and protectionist platform in 2016 (Chart 8). All candidates bashed China on the campaign trail, but Trump was an anti-establishment leader who disrupted corporate interests and followed through with his tariff threats. The result is that the share of Americans who see China’s power and influence as a “major threat” to the United States has grown from around 50% during the halcyon days of cooperation to over 60% today. Those who see it as a minor threat have shrunk to about a quarter of the population (Chart 9). Chart 8A Measure Of Inequality In The US
A Measure Of Inequality In The US
A Measure Of Inequality In The US
Chart 9US Nationalism On The Rise
#WWIII
#WWIII
Chart 10Broad-Based Anti-China Sentiment In US
#WWIII
#WWIII
As with US tariff policy, the bipartisan nature of US anger toward China is significant. More than 60% of Democrats and more than 50% of young people have an unfavorable view of China. College graduates have a more negative opinion than the much-discussed non-college-educated populace (Chart 10). Already it is clear, in Joe Biden’s attack ads against Trump, that this election is about who can sound tougher on China. The debate is over who has the better policy to put “America first,” not whether to put America first. Biden will try to steal back the protectionist thunder that enabled Trump to break the blue wall in the electorally pivotal Rust Belt in 2016 (Map 1). Biden will have to win over these voters by convincing them that he understands and empathizes with their Trumpian outlook on jobs, outsourcing, and China’s threats to national security. He will emphasize other crimes – carbon emissions, cyber attacks, human rights violations – but they will still be China’s crimes. He will return to the “Pivot to Asia” foreign policy of his most popular supporter, former President Barack Obama. Map 1US Election: Civil War Lite
#WWIII
#WWIII
Bottom Line: Economic slowdown and autocracy in China, unprecedented since the Cultural Revolution, is clashing with the United States. Broad social restlessness in the US that is resolving into bipartisan nationalism against a peer competitor, unprecedented since the struggle with the Soviets in the 1960s, is clashing with China. Now is not the time to assume global stability. Constraints Still Operate, But Buy Insurance The story outlined above is by this time pretty well known. But the “Phase One” trade deal allowed global investors to set aside this secular story at the beginning of the year. Now, as Trump threatens tariffs again, the question is whether he will resort to sweeping, concrete, punitive measures against China that will take on global significance – i.e. that will drive the financial markets this year. Trump is still attempting to restore his bull market and magnificent economy. As long as this is the case, a constraint on conflict operates this year. It is just not as firm or predictable. Therefore we are looking for three things. Chart 11Trump May Seek A Crisis ‘Bounce’ To Popularity
#WWIII
#WWIII
First, will President Trump’s approval rating benefit so much from his pressure tactics on China that he finds himself driven into greater pressure tactics? This raises the risk of policy mistakes. Second, will Trump’s approval rating fall into the doldrums, stuck beneath 43%, as the toll of the recession wears on him and popular support during the health crisis fades? “Lame duck” status would essentially condemn him to electoral loss and incentivize him to turn the tables by escalating the conflict with China. Presidents are not very popular these days, but a comparison with Trump’s two predecessors shows that while he can hardly obtain the popularity boost that Obama received just before the 2012 election, he could hope for something at least comparable to what George W. Bush received amid the invasion of Iraq (Chart 11). (Trump has generally been capped at 46% approval, the same as his share of the popular vote in 2016.) The reason this is a real risk, not a Shakespearean play, is outlined above: however cynical Trump’s political calculus, he would be reasserting US grand strategy in the face of a great power that is attempting to set up a regional empire from which, eventually, to mount a global challenge. Thus if he is convinced he cannot win the election anyway, this risk becomes material. Investors should take seriously any credible reports suggesting that Trump is growing increasingly frustrated with his trailing Biden in head-to-head polls in the swing states. Third, will China, under historic internal stress, react in a hostile way that drives Trump down the path of confrontation? China has so far resorted to propaganda, aircraft carrier drills around the island of Taiwan, and maritime encroachments in the South China Sea – none of which is intolerably provocative to Trump. A depreciation of the renminbi, a substantial change to the status quo in the East or South China Seas, or an attempt to vitiate US security guarantees regarding US allies in the region, could trigger a major geopolitical incident. A fourth Taiwan Strait crisis is fully within the realm of possibility, especially given that Taiwan’s “Silicon Shield” is fundamentally at stake. While we dismiss rumors of Kim Jong Un’s death in North Korea, any power vacuum or struggle for influence there is of great consequence in today’s geopolitical context. Aggressive use of tariffs always threatened to disrupt global trade and financial markets, but tariffs function differently in the context of a global economic expansion and bull market, as in 2018-19, than they do in the context of a deep and possibly protracted recession. Trump has a clear political incentive to be tough on China, but an equally clear financial and economic incentive to limit sweeping punitive measures and avoid devastating the stock market and economy. If events lower the economic hurdle, then the political incentive will prevail and financial markets will sell. Bottom Line: However small the risk of Trump enacting sweeping tariffs, the downside is larger than in the 2018-19. The stock market might fall by 40%-50% rather than 20% in an all-out trade war this year. Investment Takeaways Go tactically long US 10-year treasuries. Book a 9.7% profit on our long 30-year US TIPS trade. Close long global equities (relative to US) for a loss of 3.8%. Matt Gertken Vice President Geopolitical Strategist mattg@bcaresearch.com
Chinese automobile sales plunged 42% year-on-year over the first quarter of this year, due to the Covid-19 lockdowns (Chart II-1). We still expect auto sales in China to be flat or very mildly negative year-on-year over the period of April-December of this year. First, official data shows the growth rate for nominal disposable income was falling toward zero, but realistically it was probably negative in the first quarter (Chart II-2, top panel). Very sluggish household income growth – in combination with the still-elevated uncertainty of the job market (Chart II-2, bottom panel) – will restrain Chinese auto demand. Chart II-1Auto Sales In China: A Rate Of Change Recovery Ahead
Auto Sales In China: A Rate Of Change Recovery Ahead
Auto Sales In China: A Rate Of Change Recovery Ahead
Chart II-2Sluggish Household Income Growth Will Constrain Chinese Auto Demand
Sluggish Household Income Growth Will Constrain Chinese Auto Demand
Sluggish Household Income Growth Will Constrain Chinese Auto Demand
While household income growth will recover from current level later this year, it will likely remain much lower than the previous years’ 8-9% growth. Second, Chinese households are already quite leveraged. Their debt levels reached over 94% of annual disposable income, almost as high as in the US (Chart II-3). Third, peer-to-peer lending – an important source of auto loans in recent years – has shrunk considerably and is unlikely to pick up this year (Chart II-4). Chart II-3Chinese Household Debt Burden Is High
Chinese Household Debt Burden Is High
Chinese Household Debt Burden Is High
Chart II-4Auto Financing Has Become More Scarce
Auto Financing Is Becoming More Scarce
Auto Financing Is Becoming More Scarce
Bank lending rates for household consumption loans and peer-to-peer lending rates are currently about 5% and 10%, respectively. Such borrowing costs are restrictive given the tame growth of household income. Finally, the stimulus packages intended to boost automobile demand this year are no greater than they were last year. This entails that the net stimulus is close to zero. The focus of this year’s stimulus remains on the demand for new energy vehicles (NEV), which is in line with the central government’s strategic goal. Given that NEVs account for only 5% of auto sales, any boost to NEV demand is unlikely to make a huge difference in aggregate auto sales. Another boost to auto sales is the relaxation of license controls in the first-tier cities. The extent of these measures is so far considerably smaller than it was last year. About 60,0001 additional new license plates have so far been added, accounting for only 0.2% of Chinese auto sales. This number was 180,000 last year.2 This year local governments in 16 cities announced cash subsidies for auto buyers.3 Despite larger geographic coverage, the amount of cash subsidies is similar to what it was last year – at about 3% of the retail price. This is too small to make any meaningful impact on auto sales. Investment Implications The lack of considerable new stimulus for auto purchases and lower household income growth will make the recovery in passenger car sales halting and hesitant. Chinese auto stock prices in the domestic A-share market are breaking down (Chart II-5). Lingering demand contraction as well as possible price cuts will further curtail auto producers’ profits. Disappointing Chinese auto sales will lead to sluggish auto production and, consequently, to weak demand for metals like steel, aluminum and zinc. Chinese auto exports will outpace its imports (Chart II-6). As China accounts for about 30% of global auto sales and production, rising net exports of automobiles from China may diminish other global producers’ margins. Chart II-5Avoid Chinese Auto Stocks For Now
Avoid Chinese Auto Stocks For Now
Avoid Chinese Auto Stocks For Now
Chart II-6Rising Chinese Auto Net Exports Are Negative To Other Global Auto Producers
Rising Chinese Auto Net Exports Are Negative To Other Global Auto Producers
Rising Chinese Auto Net Exports Are Negative To Other Global Auto Producers
Ellen JingYuan He Associate Vice President ellenj@bcaresearch.com Footnotes 1Shanghai announced to add 40,000 new license plates this year while Hangzhou increased 20,000 new license plates. 2There were 100,000 additional license plates approved by Guangzhou province and an additional 80,000 by Shenzhen in 2019. 3The cash subsidies are about RMB1000-3000 for buying regular cars, RMB3000-5000 for car replacement (e.g., scrapping their autos with Emission Standard 3 and buying autos with new Emission Standard 6), and RMB5000-10,000 for NEV purchases.
Analyses on Chinese autos and Brazil are available below. Highlights The Fed’s aggressive monetization of public and some private debt has inspired investors to allocate cash to risk assets However, a number of cyclical indicators continue to flash red or amber, suggesting this rally is not about a cyclical economic recovery. Continue underweighting EM equities and credit markets versus their DM counterparts. We will wait for a correction to assess whether to maintain or close our shorts on EM currencies. Feature Neither the ongoing plunge in corporate profits nor a great deal of uncertainty about the economic outlook justify this rally. It seems the sole driver of the rally from March’s lows has been the Federal Reserve’s enormous purchases of various securities. These unprecedented actions are crowding out investors into riskier parts of fixed-income markets and persuading them to purchase equities. Neither the ongoing plunge in corporate profits nor a great deal of uncertainty about the economic outlook justify this rally. It Has Not Been About Profits And Valuations In the past two months, the S&P 500 index has experienced not only the fastest and steepest crash on record, but also the speediest rebound (Chart I-1). Investors have had to make swift investment decisions amid extremely low economic visibility. Chart I-1The S&P 500: The Fastest Crash And Speediest Recovery
The S&P 500: The Fastest Crash And Speediest Recovery
The S&P 500: The Fastest Crash And Speediest Recovery
Indeed, it is fair to say that during the mayhem and carnage many investors operated on a “sell now, think later” principle, and on the subsequent rebound with a “buy now, ask questions later” framework. Remarkably, the plunge and subsequent recovery in global share prices has been so rapid that even equity analysts’ forward earnings estimates cannot keep up. The top panel of Chart I-2 illustrates that the global forward EPS usually tracks the world equity index. When share prices rally, analysts upgrade their earning expectations; when equities sell off, analysts’ downgrade their earnings outlooks. In the past month, analysts have continued to slash forward EPS estimates despite the strong equity rebound. As a result, the 12-month forward P/E ratio for global stocks is back to its post-2008 highs (Chart I-2, bottom panel). Chart I-2Rising Share Prices Amid Collapsing Forward Earnings
Rising Share Prices Amid Collapsing Forward Earnings
Rising Share Prices Amid Collapsing Forward Earnings
Chart I-3China: A Decoupling Between Economy And Equities
China: A Decoupling Between Economy And Equities
China: A Decoupling Between Economy And Equities
Elsewhere, Chart I-3 illustrates China’s domestic orders for 5000 industrial enterprises historically correlated with the Shanghai Composite equity index. Since early this year, domestic orders have plummeted due to the country-wide lockdown. Yet equity prices in China have not fallen enough to reflect the downfall in economic activity and corporate profits. This underscores that investors’ purchases of global and Chinese stocks in the past month have been driven by factors other than the corporate profit outlook. This leaves two rationales for justifying roaring equity purchases in recent weeks: (1) liquidity overflows due to central banks’ balance sheet expansion, and (2) valuations. We examine the first argument in this report and will revisit the topic of equity valuations in forthcoming publications. In a nutshell, although equity valuations may be cheap in EM, Europe and Japan, they are expensive in the US. Nevertheless, the US stock market has been substantially outperforming EM and DM ex-US equities. Further, the most expensive stocks in the US – FAANGM – have by far outperformed the rest. Chart I-4China: A Decoupling Between New And Old Economy Stocks
China: A Decoupling Between New And Old Economy Stocks
China: A Decoupling Between New And Old Economy Stocks
In China, the ChiNext index – a Nasdaq proxy of the onshore market – has massively outperformed the Shanghai Composite index, which is dominated by “old” economy stocks (Chart I-4). The trailing P/E ratios on the ChiNext and Shanghai Composite indexes are 62 and 14, respectively. In short, the fact that most expensive equity segments/sectors have outperformed suggests that cheap valuation have not been the key driver of this rally. Bottom Line: Neither profits nor considerations of equity valuations have been the driving factor behind the recent equity rally. The Sole Driver Of This Rally The Fed’s aggressive monetization of public and some private debt has inspired investors to allocate cash to risk assets. The US broad money supply is surging at a record pace, both in nominal and real terms (Chart I-5). Is there too much money relative to the size of financial assets? Chart I-5US Broad Money Supply Is Booming
US Broad Money Supply Is Booming
US Broad Money Supply Is Booming
Today we explore how the level of US broad money supply (M2) relates to the market cap of all bonds and stocks denominated in US dollars. US broad money (M2) supply encompasses all deposits and cash of residents and non-residents in and outside the US. Chart I-6 exhibits the ratio of US broad money supply (M2) relative to the sum of: Chart I-6The US: Broad Money Supply Relative To Equity And Bond Market Capitalization
The US: Broad Money Supply Relative To Equity And Bond Market Capitalization
The US: Broad Money Supply Relative To Equity And Bond Market Capitalization
the US equity market capitalisation (the Wilshire 5000); the market cap values of all US-dollar bonds, including government, corporate, mortgage-backed securities, asset-backed securities and commercial mortgage backed securities (the Bloomberg Barclays US Aggregate Index); the market cap value of US dollar-denominated bonds issued by EM governments and corporations; minus the Fed’s and US commercial banks’ holdings of all types of securities. The higher this ratio is, the more US dollar deposits (liquidity) is available per one dollar of outstanding securities – excluding those held by the Fed and US commercial banks. Based on the past 25 years, the US M2-to-market value of securities ratio is somewhat elevated. This means liquidity is relatively abundant. However, this may not preclude the ratio from drifting higher like it did in 2008. This scenario would be consistent with a renewed selloff in equity and credit markets. Interestingly, back in January, the ratio was almost at a 20-year low – i.e., money supply (liquidity) was tight relative to the market value of outstanding US dollar-denominated securities. This was contrary to the prevalent perception in the global investment community that in 2019 the advances in share prices and credit markets were liquidity-driven. We discussed what constitutes pertinent liquidity for financial assets in our January 16 report titled, A Primer On Liquidity. The key takeaways of the report were: Money supply – not central bank assets – is the ultimate liquidity available to economic agents to purchase goods and services as well as invest in both real and financial assets. Changes in the velocity of money are as important as those in money supply. Yet forecasting changes in the velocity of money is a near-impossible task, as it entails foreseeing the behavior of economic agents. A large and expanding stock of money in and of itself does not guarantee greater liquidity for asset markets. Gauging liquidity flows to asset markets boils down to predicting investor behavior. Liquidity flows into financial assets when “animal spirits” among investors improve, and vice versa. Bottom Line: Even though the US money supply is expanding at a record pace, the key to financial asset price fluctuations is willingness among investors to purchase those assets. In turn, willingness to allocate cash to securities is generally driven by (1) the potential income and cash flow generation by securities issuers; (2) uncertainty related to future income (the risk premium); and (3) the opportunity cost of holding cash. Presently, the opportunity cost of holding cash is the sole reason to buy risky securities. Cash flow/income generation is currently impaired for the majority of equities and credit instruments. Further, there is a great deal of uncertainty about issuers’ ability to generate cash/income for investors – i.e., the required risk premium should be very high. All of these circumstances make the risk-reward profile of this rally poor. Reasons To Fade This Rally There are several market-based indicators that do not corroborate a further run-up in EM and DM equity prices. Our Risk-On / Safe-Haven Currency Ratio has struggled to gain traction (Chart I-7, top panel). It is not confirming the rebound in EM share prices. It is essential to emphasize that this indicator is agnostic to the direction of the US dollar, as it is calculated as the ratio of cyclical commodities currencies (AUD, NZD, CAD, ZAR, BRL, MXN, CLP, RUB, and IDR) versus safe-haven currencies such as the Swiss franc and Japanese yen on a total-return basis – i.e., all exchange rates include the cost of carry. Chart I-7Various Reflation Indicators Have Been Slugish
Various Reflation Indicators Have Been Slugish
Various Reflation Indicators Have Been Slugish
Our Reflation Confirming Indicator has not been sending a strong bullish reflation signal either (Chart I-7, bottom panel). This indicator is composed of an equally-weighted average of industrial metals, platinum and US lumber prices. The Global Cyclical-to-Defensive Equity Sectors Ratio has formed a classic head-and-shoulders pattern, and has broken down (Chart I-8, top panel). The latest rebound has not altered this pattern. Therefore, the path of least resistance for this ratio is still down, which entails underperformance of the global cyclical equity sector versus global defensives. The latter often occurs in selloffs. Similarly, the relative performance of Swedish versus Swiss non-financial stocks has failed to rebound, having experienced a major breakdown in March (Chart I-8, bottom panel). Swedish non-financial stocks are much more cyclical than Swiss ones. Finally, the global business cycle is experiencing its deepest recession in the post-World War II period, with the pace and nature of the recovery remaining highly uncertain. Chart I-9 portends global EPS in SDR, which is the proper measure given the greenback’s weight in SDR is 58%, the euro’s 39%, the yen’s 11%, and the yuan’s 1%. Chart I-8Global Cyclical Stocks Have Not Outperformed
Global Cyclical Stocks Have Not Outperformed
Global Cyclical Stocks Have Not Outperformed
Chart I-9Global Corporate EPS In Perspective
Global Corporate EPS In Perspective
Global Corporate EPS In Perspective
Global EPS shrank by 28% in 2001-2002 and by 40% in the 2008 recession. Given the current recession will be deeper, global EPS will likely shrink by about 50%. We do not think equity markets are discounting such a dire outcome after the recent rally. Bottom Line: A number of cyclical indicators continue to flash red or amber, suggesting this rally is not about a cyclical economic recovery. Investment Strategy We closed our short position in EM equities on March 19, and on the March 26 report we argued that it was too late to sell but still too early to buy. Given the rally in global equities is overstretched from a short-term perspective, we will wait for a correction to assess whether to maintain or close our shorts on EM currencies. Chart I-10EM Currencies And S&P 500
EM Currencies And S&P 500
EM Currencies And S&P 500
That said, we maintained our underweights in both EM stocks and credit versus their DM peers. Also, we have continued to short EM currencies versus the US dollar. Chart I-10 demonstrates that EM currencies have failed to rally despite the strong rebound in the S&P 500. Given the rally in global equities is overstretched from a short-term perspective, we will wait for a correction to assess whether to maintain or close our shorts on EM currencies. For dedicated EM equity managers, our recommended overweights are Korea, Thailand, Vietnam, Russia, central Europe, Mexico and Peru. Our underweights are Brazil, South Africa, Turkey, Indonesia, India and the Philippines. We are neutral on other bourses. Last week we published two reports for fixed-income investors: EM: Foreign Currency Debt Strains and EM Domestic Bonds And Currencies. In the first report we assessed individual EM countries' vulnerabilities to foreign debt and discussed strategies for EM sovereign and corporate credits. In the second report, we upgraded our stance on EM local markets from underweight to neutral. Before upgrading to a bullish stance, we would first need to upgrade our stance on EM currencies. Arthur Budaghyan Chief Emerging Markets Strategist arthurb@bcaresearch.com Chinese Auto Sales: Disappointments Ahead Chinese automobile sales plunged 42% year-on-year over the first quarter of this year, due to the Covid-19 lockdowns (Chart II-1). We still expect auto sales in China to be flat or very mildly negative year-on-year over the period of April-December of this year. First, official data shows the growth rate for nominal disposable income was falling toward zero, but realistically it was probably negative in the first quarter (Chart II-2, top panel). Very sluggish household income growth – in combination with the still-elevated uncertainty of the job market (Chart II-2, bottom panel) – will restrain Chinese auto demand. Chart II-1Auto Sales In China: A Rate Of Change Recovery Ahead
Auto Sales In China: A Rate Of Change Recovery Ahead
Auto Sales In China: A Rate Of Change Recovery Ahead
Chart II-2Sluggish Household Income Growth Will Constrain Chinese Auto Demand
Sluggish Household Income Growth Will Constrain Chinese Auto Demand
Sluggish Household Income Growth Will Constrain Chinese Auto Demand
While household income growth will recover from current level later this year, it will likely remain much lower than the previous years’ 8-9% growth. Second, Chinese households are already quite leveraged. Their debt levels reached over 94% of annual disposable income, almost as high as in the US (Chart II-3). Third, peer-to-peer lending – an important source of auto loans in recent years – has shrunk considerably and is unlikely to pick up this year (Chart II-4). Chart II-3Chinese Household Debt Burden Is High
Chinese Household Debt Burden Is High
Chinese Household Debt Burden Is High
Chart II-4Auto Financing Has Become More Scarce
Auto Financing Is Becoming More Scarce
Auto Financing Is Becoming More Scarce
Bank lending rates for household consumption loans and peer-to-peer lending rates are currently about 5% and 10%, respectively. Such borrowing costs are restrictive given the tame growth of household income. Finally, the stimulus packages intended to boost automobile demand this year are no greater than they were last year. This entails that the net stimulus is close to zero. The focus of this year’s stimulus remains on the demand for new energy vehicles (NEV), which is in line with the central government’s strategic goal. Given that NEVs account for only 5% of auto sales, any boost to NEV demand is unlikely to make a huge difference in aggregate auto sales. Another boost to auto sales is the relaxation of license controls in the first-tier cities. The extent of these measures is so far considerably smaller than it was last year. About 60,0001 additional new license plates have so far been added, accounting for only 0.2% of Chinese auto sales. This number was 180,000 last year.2 This year local governments in 16 cities announced cash subsidies for auto buyers.3 Despite larger geographic coverage, the amount of cash subsidies is similar to what it was last year – at about 3% of the retail price. This is too small to make any meaningful impact on auto sales. Investment Implications The lack of considerable new stimulus for auto purchases and lower household income growth will make the recovery in passenger car sales halting and hesitant. The lack of considerable new stimulus for auto purchases and lower household income growth will make the recovery in passenger car sales halting and hesitant. Chinese auto stock prices in the domestic A-share market are breaking down (Chart II-5). Lingering demand contraction as well as possible price cuts will further curtail auto producers’ profits. Disappointing Chinese auto sales will lead to sluggish auto production and, consequently, to weak demand for metals like steel, aluminum and zinc. Chinese auto exports will outpace its imports (Chart II-6). As China accounts for about 30% of global auto sales and production, rising net exports of automobiles from China may diminish other global producers’ margins. Chart II-5Avoid Chinese Auto Stocks For Now
Avoid Chinese Auto Stocks For Now
Avoid Chinese Auto Stocks For Now
Chart II-6Rising Chinese Auto Net Exports Are Negative To Other Global Auto Producers
Rising Chinese Auto Net Exports Are Negative To Other Global Auto Producers
Rising Chinese Auto Net Exports Are Negative To Other Global Auto Producers
Ellen JingYuan He Associate Vice President ellenj@bcaresearch.com Brazil: Not Out Of The Woods Yet We believe risks to Brazilian assets remain to the downside. Political infighting among various branches of power and state institutions will depress consumer and business confidence, lengthening the recession. Chart III-1Brazil: Recurring Crises
Brazil: Recurring Crises
Brazil: Recurring Crises
Political infighting among various branches of power and state institutions will depress consumer and business confidence, lengthening the recession (Chart III-1). Political turmoil also reduces the probability of structural reforms. This combined with a delayed economic recovery will further strain the already precarious public debt dynamics. First, the country is in a full-blown political crisis. The Supreme Court's decision to reject Bolsonaro's nomination for Director of the Federal Police manifests broad-based political infighting among Brazilian institutions. Further, the Supreme Court has started an investigation into the President as calls for impeachment intensify among both the public and the Congress. The rift between President Bolsonaro and Congressional President Maia is especially worrisome. Given Maia’s future political ambitions, we do not expect a truce between the two. On the contrary, they will continue to stand off in order to assert control over the fragmented Congress. As a result, structural reforms such as the national tax program and privatizations will be delayed. Second, Bolsonaro’s popularity is also plunging due to his slow and controversial response to the COVID-19 outbreak. This week, Bolsonaro’s disapproval ratings jumped above those of former president Lula da Silva, and public support for impeachment is now over 54%. Third, Congress has allowed the government to go over the limit of fiscal spending this year, which has resulted in almost 1.2 trillion reais in emergency fiscal spending, or about 16% of GDP. This will push the gross public debt-to-GDP ratio to well above 100% by the end of 2020. Chart III-2This Large Gap Makes Public Debt Dynamics Untenable
This Large Gap Makes Public Debt Dynamics Untenable
This Large Gap Makes Public Debt Dynamics Untenable
In order to stabilize its public debt-to-GDP ratio, a government’s borrowing costs should be below nominal GDP growth. Brazil fails to meet this condition. Local currency interest rates at 5.5% are well above nominal GDP growth, which will likely be negative in 2020 (Chart III-2). This assures unsustainable debt dynamics. Finally, in terms of monetary policy, the central bank’s policy rate cuts have not been efficiently transmitted to the real economy, as discussed in our March 31st Special Report. Borrowing costs for companies and households remain elevated relative to their nominal income growth. Overall, the sole feasible way for Brazil to stabilize its public debt-to-GDP ratio is to push nominal GDP growth above interest rates. Further, this is only possible with falling interest rates and further material currency depreciation. The continued currency devaluation represents a risk to foreign investors holding local assets. Investment Recommendations Continue to underweight Brazil within EM equity and credit portfolios. We reiterate our trade to short the BRL versus the US dollar. Even though the BRL is moderately cheap (Chart III-3), there is still considerable downward pressure on the currency. The BRL is tightly correlated with commodities prices (Chart III-4). Until these do not bottom out, the real will continue depreciating. Critically, the real needs to depreciate to lift nominal GDP growth above borrowing costs. The latter is essential to stabilize public debt dynamics. Chart III-3The BRL Is Only Modestly Cheap
The BRL Is Only Modestly Cheap
The BRL Is Only Modestly Cheap
Chart III-4The BRL Correlates With Commodities Prices
The BRL Correlates With Commodities Prices
The BRL Correlates With Commodities Prices
Finally, we are underweight both local currency and US$ denominated bonds in Brazil due to worrisome public debt dynamics and high foreign currency stress. Juan Egaña Research Associate juane@bcaresearch.com Arthur Budaghyan Chief Emerging Markets Strategist arthurb@bcaresearch.com Footnotes 1 Shanghai announced to add 40,000 new license plates this year while Hangzhou increased 20,000 new license plates. 2 There were 100,000 additional license plates approved by Guangzhou province and an additional 80,000 by Shenzhen in 2019. 3 The cash subsidies are about RMB1000-3000 for buying regular cars, RMB3000-5000 for car replacement (e.g., scrapping their autos with Emission Standard 3 and buying autos with new Emission Standard 6), and RMB5000-10,000 for NEV purchases. Equities Recommendations Currencies, Credit And Fixed-Income Recommendations
BCA Research's China Investment Strategy service expects the recovery in Chinese domestic demand to pick up momentum in the second half of this year. A modest recovery in oil prices in Q3 will not be enough to return China's PPI to positive territory. Even…
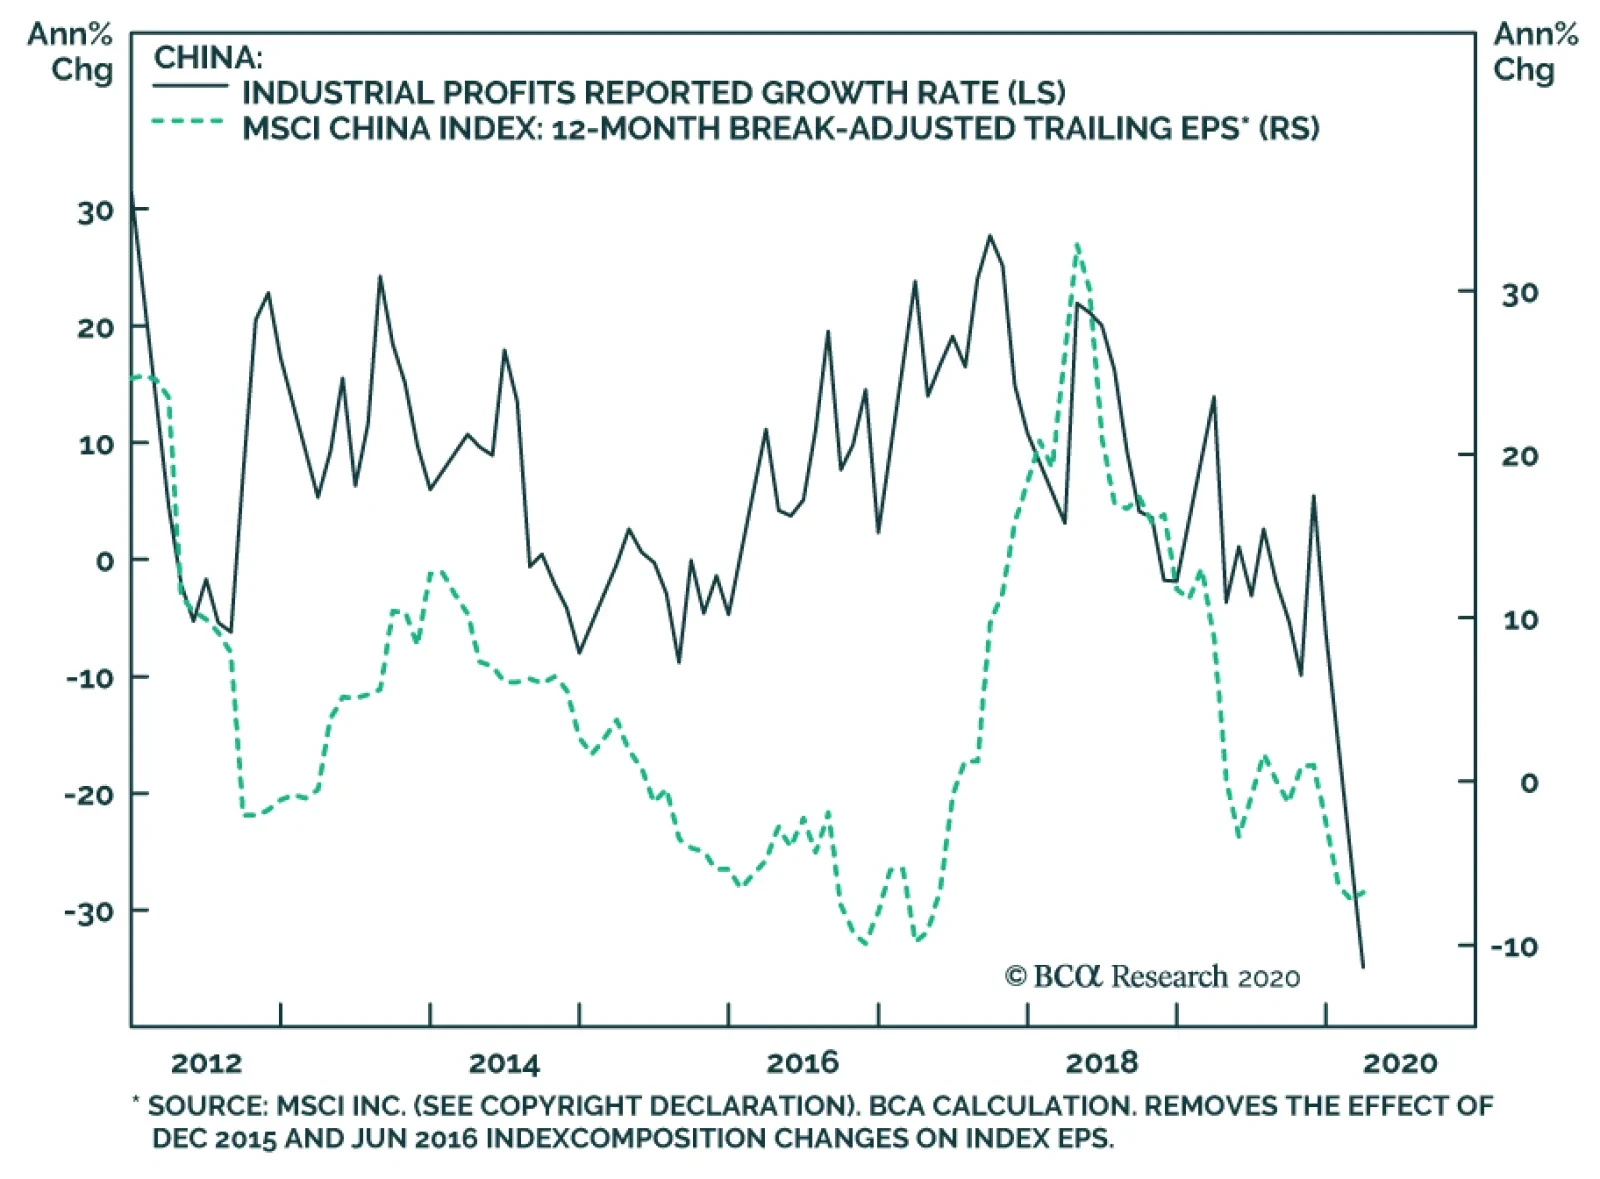
Highlights Even as a net oil importer, China loses more than it gains when oil prices collapse. An oil price collapse generates a formidable deflationary force, which will further depress China’s industrial pricing power and profit growth in Q2. There are early signs that demand in some sectors is gaining traction in the first three weeks of April. A full removal of travel restrictions in late May in China should help speed up the return of domestic business activities. We maintain our view that China’s economic recovery will pick up momentum in H2, underpinning our cyclical overweight stance on Chinese risk assets. Feature The nosedive in oil futures last week was a rude awakening of the enormous and unpredictable impact the pandemic has on the global economy and financial markets. WTI futures for May 2020 delivery fell to -$40.40 per barrel on April 20, an unprecedented event. The collapse in oil prices since March will generate substantial deflationary headwinds to China’s economy in the months ahead (Chart 1). Producer prices are already in contraction. An imported deflation from low oil prices will weaken industrial pricing power even more, pushing up real rates. China’s industrial profit growth also moves in lockstep with producer prices. A deepening in PPI contraction means industrial profit growth will remain underwater, underscoring our view that the near-term outlook for Chinese stocks is yet to turn sanguine (Chart 2). Chart 1Falling Oil Prices: A Substantial Deflationary Force
Falling Oil Prices: A Substantial Deflationary Force
Falling Oil Prices: A Substantial Deflationary Force
Chart 2Deflation Weakens Industrial Profit Growth
Deflation Weakens Industrial Profit Growth
Deflation Weakens Industrial Profit Growth
Oil prices will likely rebound in Q3 when the global economy re-opens, oil supply cuts take hold and the US dollar peaks. Our Commodity and Energy strategist estimates that WTI spot prices will reach $38/barrel by end-2020.1 A modest recovery in oil prices alone will not be enough to lift Chinese producer prices back to positive. The substantial reflationary efforts from China’s policymakers since Q1 should start to have an impact on the real economy in H2. The exponential credit growth should effectively prop up investment and consumption growth, and reduce inventory overhang in the industrial sector. We expect industrial producer prices and profits to turn slightly positive in Q3/Q4, underpinning our constructive view on Chinese stocks in the next 6- to 12-months. Oil Price Collapse: A Bane, Not A Boon China, as a net oil importer, stands to lose more than gain in an oil price war. This is contrary to commonly held economic theory that net oil importing countries are winners from cheaper oil. In theory falling oil prices reduces import prices, improves net oil importers’ term of trade, and in turn contributes positively to their GDP growth. In reality oil prices rarely fall in isolation. A precipitous fall in oil prices is almost always triggered by a sharp decline in global demand, accompanied with a spike in the US dollar, and results in a turmoil in the global financial markets (Chart 3). Therefore, depending on where an economy is positioned in the global value chain, a net oil importer may lose even more than a net oil exporter when oil prices collapse. Chart 3Global Trade Remains Under Pressure Until Dollar Peaks
Global Trade Remains Under Pressure Until Dollar Peaks
Global Trade Remains Under Pressure Until Dollar Peaks
Chart 4China Loses More From Falling Trade Than Gains From Falling Oil Prices
China Loses More From Falling Trade Than Gains From Falling Oil Prices
China Loses More From Falling Trade Than Gains From Falling Oil Prices
At only 14% of world oil consumption, China’s demand for oil alone is not enough to support a price recovery. But as a global manufacturing powerhouse, the benefits China has gained from cheaper oil in the past cycles were often more than offset by the economic and financial shocks from an oil price collapse (Chart 4). The small positive contribution to China’s GDP growth via savings on oil import bills is further discounted by losses from China’s own oil and oil-product exports (Chart 4, middle panel). China’s oil and gas sector does not necessarily benefit from collapsing oil prices. The country’s domestic oil exploration becomes deeply unprofitable when international oil prices collapse. Falling domestic demand for finished oil products and rising competition in the industry when prices are low squeeze out any extra profits for oil refineries (Chart 5). Chart 5China’s Energy Sector Suffers Too In An Oil Bear Market
China's Energy Sector Suffers Too In An Oil Bear Market
China's Energy Sector Suffers Too In An Oil Bear Market
Chart 6Energy Costs: A Small Part Of Chinese CPI
Energy Costs: A Small Part Of Chinese CPI
Energy Costs: A Small Part Of Chinese CPI
Chart 7US Consumers Benefit Much More From An Oil Price Decline Than Chinese Consumers
US Consumers Benefit Much More From An Oil Price Decline Than Chinese Consumers
US Consumers Benefit Much More From An Oil Price Decline Than Chinese Consumers
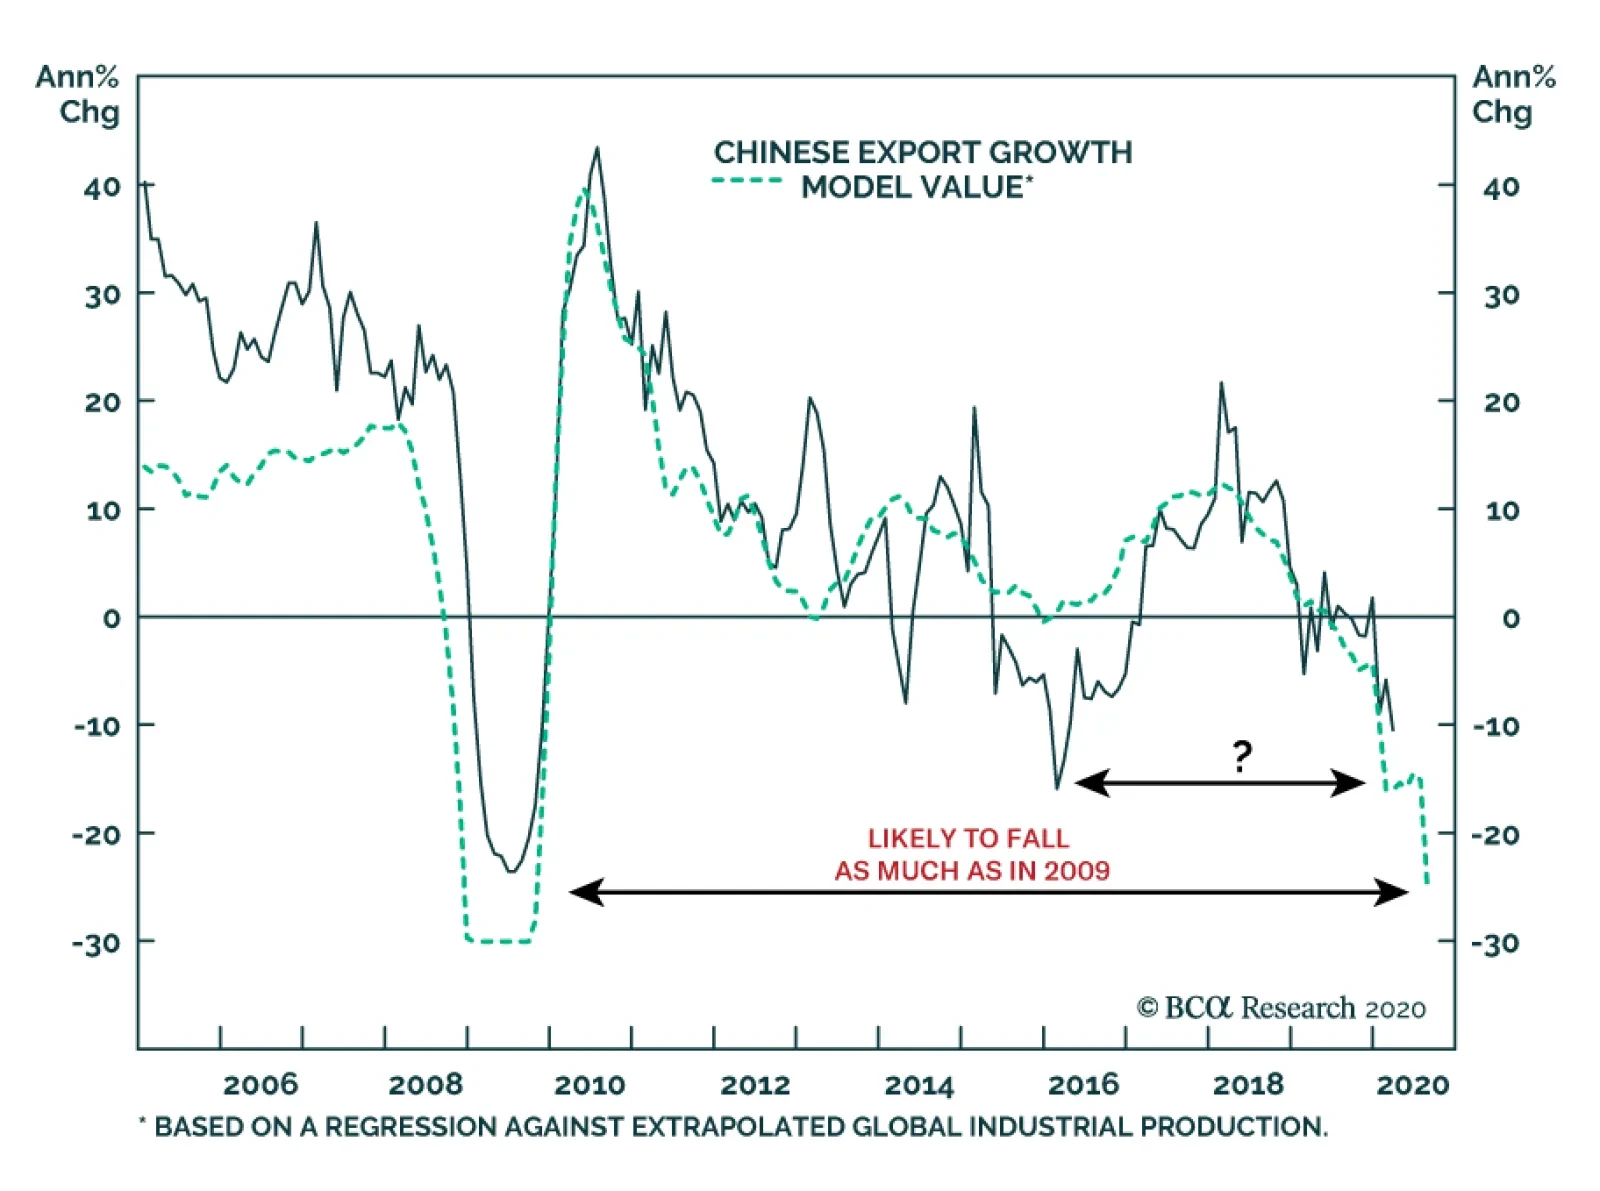
Furthermore, unlike the US, Chinese household consumption does not get a boost from cheaper oil. Food prices, rather than energy, drive the overall consumer price inflation in China (Chart 6). In addition, China’s domestic petrol market is heavily regulated and retail prices for energy are set by the Chinese government. China does not pass on the entire benefit of an energy price decline to its consumers, a rigid policy that has not been changed since 2016.2 As such, the current reduction in oil prices will not have the same “tax cut” benefit as it does for US consumers (Chart 7). Bottom Line: Low oil prices, accompanied by a strong dollar and depressed global trade, create a self-feeding deflationary feedback loop to China’s industrial sector, reducing the effects of the existing reflationary measures on its economy. Budding Signs Of Reflation A modest recovery in oil prices in Q3 will not be enough to return China's PPI to positive territory. Even when the global economy re-opens, the initial recovery in business activities and demand will likely be gradual, a situation China has experienced in the past two months (Chart 8). Thus, China’s domestic demand will bear most of the brunt to shore up inflation in produced goods, by propping up investment and consumption growth. We expect China’s substantial reflationary measures to start filtering into the real economy in H2. China’s industrial sector should get a boost from an acceleration in infrastructure investment and producer prices should turn moderately positive later in Q3 (Chart 9). Chart 8China’s Export Growth Set To Decline Further In Q2
China's Export Growth Set To Decline Further In Q2
China's Export Growth Set To Decline Further In Q2
Chart 9Huge Credit Wave Should Start Lifting Industrial Profits In H2
Huge Credit Wave Should Start Lifting Industrial Profits In H2
Huge Credit Wave Should Start Lifting Industrial Profits In H2
High-frequency data point to some early signs of a rebound in China’s domestic demand. The annual growth in the transaction volume of rebar steel rebounded from an 8% decline in March to 4% growth in the first three weeks in April.3 The contraction in passenger car sales also narrowed from -38% in March to -7.3% so far in April.4 China is ramping up its COVID-19 antibody testing to prevent a second-wave outbreak and is preparing for the National People’s Congress (NPC), which may take place in mid-May. Inter-provincial travel restrictions have limited the speed of recovery in business operations, but we expect such cautionary measures to be fully lifted in late May. The removal of logistic restrictions will help to accelerate a return to normal in both domestic production and demand. As we noted in our last week’s report,5 the April 17 Politburo meeting confirmed a policy shift to maximum reflation. President Xi’s new slogan, “The Six Stabilities and The Six Guarantees,” sets the tone that the government will increase investments to ensure that China’s post-pandemic economic growth is strong enough to stabilize employment. Bottom Line: Chinese business activities continue to inch up. The recovery in domestic demand should pick up momentum in H2 to offset imported deflationary pressures on China’s industrial profits. Investment Conclusions In the near term, a strong US dollar is a key risk to the recovery of China’s industrial profits. The greenback not only generates downward pressure on oil prices and global trade, but also puts the RMB in a poor position of depreciating against the dollar but at the same time appreciating against China’s export competitors (Chart 10). All are creating headwinds to China’s economic recovery. We recommend that investors stay on the sidelines in the near term until the dollar peaks and oil prices rebound, probably in Q3. However, on a cyclical time horizon, as the global economy re-opens and demands slowly recovers in H2, the flood of stimulus including China's own reflation efforts should help to restore investors’ risk appetite and lift the prices of risk assets. Although Chinese stocks have passively outperformed global stocks this year, the strong rebound in the SPX in recent weeks has made Chinese stocks slightly less overbought in relative terms (Chart 11). Chart 10A Tough Combination For The RMB
A Tough Combination For The RMB
A Tough Combination For The RMB
Chart 11Chinese Stocks: Slightly Less Overbought In Past Weeks
Chinese Stocks: Slightly Less Overbought In Past Weeks
Chinese Stocks: Slightly Less Overbought In Past Weeks
We expect China’s corporate profit growth to outpace global earnings growth this year, even as other economies re-open and start to recover. This warrants an overweight stance on Chinese stocks after near-term risks and market gyrations subside. Jing Sima China Strategist jings@bcaresearch.com Footnotes 1Please see Commodity & Energy Strategy Weekly Report "USD Strength Restrains Commodity Recovery," dated April 23, 2020, available at ces.bcaresearch.com 2The floor for retail fuel prices is set at $40 a barrel to limit losses at China’s state-owned oil companies, which generally have average production costs in the range of $40-$50 per barrel. http://english.www.gov.cn/news/top_news/2016/01/13/content_281475271410529.htm 3Based on daily data from MySteel. 4Based on weekly data from China Passenger Car Association. 5Please see China Investment Strategy Weekly Report "Three Questions Following The Coronacrisis," dated April 23, 2020, available at cis.bcaresearch.com Cyclical Investment Stance Equity Sector Recommendations
China reported predictably terrible numbers for industrial profits in Q1: CNY 781 billion, down 36.7% year-on-year. Of the 41 industry categories, 39 saw profit declines, with petroleum and coal making an outright loss year-to-date. Moreover, there was little…
Highlights Kim Jong Un’s sickness or death is a matter of speculation and it is best to remain skeptical for now. If Kim dies or is incapacitated, it is a serious concern for North Korean and hence regional stability – and not only in the medium and long term. A North Korean power vacuum could trigger a major relapse in US-China relations. Even if Kim is healthy, his negotiations with President Trump could affect US-China relations or Trump’s reelection chances this year. US-China tensions could also break down separately this year – watch for yuan depreciation or for Trump to lose public approval. The South China Sea and Taiwan Strait are also non-negligible risks that could derail US-China relations before the US election. Feature If North Korean leader Kim Jong Un dies, it is a risk to global stability. We have no insight on Kim’s health or whereabouts but we do know that North Korea is relevant to global investors – it is no longer a joke – because US-China relations are no longer stable. Korean political risk has been on an uptrend since the second summit between Kim and President Trump in Hanoi, Vietnam was cut short without any agreement (Chart 1). Chart 1Korean Political Risk Already On An Uptrend Due To Pandemic, Recession, US-China Tensions
Korean Political Risk Already On An Uptrend Due To Pandemic, Recession, US-China Tensions
Korean Political Risk Already On An Uptrend Due To Pandemic, Recession, US-China Tensions
A dispute over North Korea could trigger a relapse in US-China relations that threatens the global equity rebound. Remain Skeptical As we go to press it is still unknown whether Kim is sick, well, living, or dying. What is known is that Kim failed to make a public appearance on Kim Il Sung Day, April 15, a noteworthy absence. China has sent a group of officials from the Communist Party’s Liaison Department, including medical doctors, according to Reuters – the most objective sign yet that something in North Korea has gone amiss. Japan’s Shukan Gendai on April 26 quoted an unnamed Chinese official saying that Kim was in a “vegetative state” after having stents put in his arteries after a heart attack. This corroborates (or repeats) the story that originally broke in South Korean newspaper Daily NK on April 21, saying that Kim was in grave condition after complications from heart surgery. Neither the Daily NK nor the Shukan Gendai are premium papers and the Daily NK also had to correct its original story which it attributed to “multiple” North Korean sources when in fact it only had one source. The US think tank 38 North on April 26 identified Kim’s elite passenger train at Wonsan but neither 38 North nor Reuters can confirm that Kim is actually in Wonsan. Kim was last seen in public on April 11 in Pyongyang, the day before Kim’s alleged surgery on April 12, but North Korean state press has reported on him conducting a range of activities since that date, albeit without video footage or anything that would disprove his incapacity. South Korean officials at the highest levels have repeatedly denied that they have intelligence of anything “special” happening in North Korea. South Korean assets are untroubled by the rumors (Chart 2). US President Donald Trump, and Pentagon officials, have also cast doubt on rumors that Kim is sick or dying – although various White House officials and Senator Lindsey Graham of South Carolina have implied something is wrong. Frequently it occurs that a temporary absence of autocratic leaders like Kim or Chinese President Xi Jinping causes the global media to speculate about illness, death, or intrigue. The lack of transparency of such regimes gives rise to a cottage industry of political watchers who interpret a leader’s every movement. Usually these rumor cycles amount to nothing. Absence of evidence (a leader’s failure to appear at an event) is not evidence of absence (the leader’s death). Still, the longer North Korea goes without offering definitive proof that Kim is alive, the greater the concerns will mount. One thing that we find unusual is the positioning of Kim’s sister, Kim Yo Jong. Kim Yo Jong was removed from the Politburo of the Korean Worker’s Party shortly after the failed Hanoi summit last year. She was reinstated as an alternate member on April 11 this year, in what was probably Kim Jong Un’s last credible public appearance. This gave rise to a surge of interest in her as a rising star, reflected in Google searches on April 12. These searches have spiked much more dramatically now that Kim Jong Un’s health is in question (Chart 3). Chart 2Korean Assets Not Responding Much To Kim Rumors
Korean Assets Not Responding Much To Kim Rumors
Korean Assets Not Responding Much To Kim Rumors
Chart 3Why Was Kim Yo-Jong Rehabilitated Just Before Kim’s Alleged Surgery?
North Korean Rumors: Significant ... If True
North Korean Rumors: Significant ... If True
The timing of her reinstatement, promptly followed by rumors about Kim’s health, is strange. North Korea’s political legitimacy is based on the Kim family dynasty. Her political recovery and promotion would be necessary to prepare her for any heightened role in the event of Kim’s incapacity or death. The purpose of the Politburo meeting was apparently to address the COVID-19 pandemic and delay a meeting of the legislature, the Supreme People’s Assembly. While rumors have focused on Kim’s cardiac event, we would not rule out the possibility that he has contracted COVID-19. Global leaders certainly are not immune to the disease, as evidenced by UK Prime Minister Boris Johnson. Reports also cite Kim's past periods of illness in 2012-14, although it is doubtful that his previous troubles with gout have any connection to a heart attack this month. What Is At Stake If Kim Exits The Scene For investors, the important thing to recognize is that North Korea is no longer irrelevant, no longer a geopolitical “red herring,” as we outlined in a series of reports in 2016 and 2017. Rather it is a critical moving part in a growing strategic conflict between the US and China. North Korea is a nuclear-armed state and a personalized autocracy with no clear succession plan, a stability risk on China’s border, and a national security risk to the United States and its allies Japan and South Korea. Pyongyang is in the midst of a multi-year, high-stakes diplomatic negotiation with its Northeast Asian neighbors and the United States. Diplomacy has not, thus far, gone off the rails. While Pyongyang has pushed the envelope with minor nuclear and missile activities, and by contesting Trump’s claims of exchanging letters, it has not abandoned negotiations with President Trump since 2017 by testing nuclear devices or intercontinental ballistic missiles, or by threatening to attack the US. South Korea’s legislative election on April 15 reinforced the leadership of President Moon Jae In and his left-leaning Democratic Party, marking a rebound for Moon due to his handling of the pandemic. This marks a boost to his “Moonshine” policy of diplomacy and economic integration with the North, another factor conducive to the continuation of diplomacy (Chart 4). However, any instability now would occur at a time of extreme vulnerability both within North Korea and abroad. North Korean growth is already facing a historic downturn unlike anything since the collapse of the Soviet Union (Chart 5). Chart 4Peaceniks Still Winning In South Korea
North Korean Rumors: Significant ... If True
North Korean Rumors: Significant ... If True
Chart 5North Korean Instability Is Likely Regardless Of Kim's Health
North Korean Instability Is Likely Regardless Of Kim's Health
North Korean Instability Is Likely Regardless Of Kim's Health
President Trump’s policy of “maximum pressure” sanctions has the North’s economy in a vise (Chart 6). For the past few years China has enforced sanctions on the North to cooperate with the United States. Beijing has reduced fuel exports and coal imports, according to official statistics (Chart 7). Chart 6Sanctions Have Damaged The Regime
Sanctions Have Damaged The Regime
Sanctions Have Damaged The Regime
Chart 7China's Sanctions Enforcement Is Critical
China's Sanctions Enforcement Is Critical
China's Sanctions Enforcement Is Critical
Even if China were not enforcing sanctions, North Korea’s economic conditions would be drastically deteriorating due to the COVID-19 pandemic, which has pushed China into what may well be the first recession since the 1970s (Chart 8). Thus if North Korea does end up having a leadership problem, investors should not assume that the regime will remain stable, in the near, medium, or long term. A power struggle broke out in China immediately upon Chairman Mao’s death in 1976. And when Kim Jong Un took power in December 2011, he struggled to consolidate power over the party, state, and military at first. He notoriously executed his uncle in December 2013 amid these internal struggles, which may have involved insubordinate military actions. His older brother Kim Jong Chol, or his sister Kim Yo Jong, would have more trouble consolidating power given that they were not Kim Jong Il’s choice for successor and would enter the supreme office in an extremely unstable time both at home and abroad. A succession process could also lead to external risks relatively quickly. North Korea’s historic surprise attack on the South Korean corvette, the Chonan, occurred in March 2010. Kim Jong Il was known to be preparing for his exit and for Kim Jong Un’s succession, so the regime sought to demonstrate strength while the world was distracted with a global financial crisis. If US-China relations were stable, there would be at least one substantial basis for believing that a North Korean crisis could be prevented from causing a crisis in other foreign relations. But US-China relations are not stable – they have deteriorated since the global financial crisis, as symbolized here by China’s diversifying away from US treasury holdings (Chart 9). The average US tariff rate on Chinese imports has risen from 5% to 15% under President Trump, who is threatening to impose additional punitive measures on China, such as export controls, as the two sides quarrel over the pandemic and recession. Chart 8Chinese Slowdown A Threat To Pyongyang
Chinese Slowdown A Threat To Pyongyang
Chinese Slowdown A Threat To Pyongyang
President Trump’s signature foreign policy initiative – as opposed to trade initiative – has consisted of negotiations with North Korea over denuclearization and eventual peace. If these negotiations fall apart, President Trump will suffer in a substantial way that will at least marginally harm his reelection chances on November 3. Chart 9US-China Relations Fundamentally Unstable
US-China Relations Fundamentally Unstable
US-China Relations Fundamentally Unstable
If the negotiations result in a “magnificent” deal this year, they could help those chances. Negotiations could face a test before that time, if either side abandons negotiations or gets cold feet before agreeing to a deal. Chart 10Brinkmanship Results In US Shows Of Force
Brinkmanship Results In US Shows Of Force
Brinkmanship Results In US Shows Of Force
Testing periods in the current relationship involve shows of US military strength, as in the summer of “fire and fury” in 2017, and as the US also showed in a similar summer of fire and fury with Iran in 2019 (Chart 10). Shows of force typically are a source of passing volatility, at best, in global financial markets. But in this year’s context the risk of broader US-China strategic competition would amplify that impact, even if it is transient. Investment Takeaways For global investors, what matters is if a North Korean crisis destabilizes the region and if US-China relations destabilize for this or any other reason. If Kim dies, we expect instability to ensue in North Korea eventually, if not immediately, and this would entail some degree of instability among the major powers. The US and China would seek to shape the outcome on the peninsula – China has already sent a team of officials. Washington and Beijing have a shared interest in preventing regime collapse, but they have a high level of distrust and different aims for the regime that might emerge in the aftermath. Tensions would get extremely high amid a power vacuum in North Korea. To gauge the durability of the US-China détente, the phase one trade deal signed in January, we are monitoring the CNY-USD exchange rate and President Trump’s approval rating (Chart 11). Renminbi depreciation is possible to ease pressure on China’s weak economy, but it would break the deal entirely, given that most other elements of the deal are either interrupted by the recession (goods purchases) or unverifiable (intellectual property protections). Chart 11Yuan Depreciation Or Falling Trump Approval Threaten Global Equities
Yuan Depreciation Or Falling Trump Approval Threaten Global Equities
Yuan Depreciation Or Falling Trump Approval Threaten Global Equities
Meanwhile President Trump only has an incentive to refrain from punitive measures as long as he believes his economy and election chances are salvageable. If this changes, and he is stuck in the 42% approval range or below, he may become a “lame duck” and attempt to turn the tables. Aggressive scapegoating of China, which has attracted widespread American disfavor, is a possible tactic for him to outmaneuver his rival, former Vice President Joe Biden, who is allegedly soft on China. We have long argued that US-China tensions would spill over to strategic disputes in China’s periphery and cause a higher risk-premium in global equities and risk assets exposed to this relationship. The current fragile environment of pandemic and recession makes a risk-off more likely by rendering both the US and China more vulnerable. We have held that the Taiwan Strait was more likely than the Korean peninsula to be the site of a crisis this year, but Kim Jong Un’s death would change that calculation. Two final points. First, North Korea has a long and distinguished history of feigning weakness in order to get foreign aid. If the great powers think it is on the verge of collapse then they will offer aid and possibly sanctions relief. With the pandemic and recession, we could eventually learn that Kim is alive and well, but that North Korea wants assistance with the pandemic. As outlined above, it is still possible that Kim’s health is fine, and yet that a failure of diplomacy with President Trump results in significant saber-rattling this year. Second, all of the above demonstrates the seriousness of geopolitical risk in East Asia stemming from US-China competition. Distrust is growing on a secular level and is seeing a near-term spike due to COVID and the US election. As a consequence, we take any North Korean instability seriously. But we also see potential for conflicts to emerge in the Taiwan Strait or the South China Sea, where a standoff between China, its rival territorial claimants, and the US is already underway. We remain tactically defensive and continue to recommend the Japanese yen as a hedge. We are adding JPY-EUR to this mix. On a longer-term horizon we recommend investors remain long selective international equities and commodities. For now we remain overweight Korean equities relative to Taiwanese, but we will close this trade on any confirmation that Kim is dead or incapacitated. Matt Gertken Vice President Geopolitical Strategist mattg@bcaresearch.com
Highlights Yesterday we published a Special Report titled EM: Foreign Currency Debt Strains. We are upgrading our stance on EM local currency bonds from negative to neutral. Before upgrading to a bullish stance, we would first need to upgrade our stance on EM currencies. We recommend receiving long-term swap rates in Russia, Mexico, Colombia, China and India. EM central banks’ swap lines with the Fed could be used to fend off short-term speculative attacks on EM currencies. Nevertheless, they cannot prevent EM exchange rates from depreciation when fundamental pressures warrant weaker EM currencies. For the rampant expansion of US money supply to produce a lasting greenback depreciation, US dollars should be recycled abroad. This is not yet occurring. Domestic Bonds: A New Normal Chart I-1Performance Of EM Domestic Bonds In The Last Decade
Performance Of EM Domestic Bonds In The Last Decade
Performance Of EM Domestic Bonds In The Last Decade
In recent years, our strategy has favored the US dollar and, by extension, US Treasurys over EM domestic bonds. Chart I-1 demonstrates that the EM GBI local currency bond total return index in US dollar terms is at the same level as it was in 2011, and has massively underperformed 5-year US Treasurys. We are now upgrading our stance on EM local currency bonds from negative to neutral. Consistently, we recommend investors seek longer duration in EM domestic bonds while remaining cautious on the majority of EM currencies. Before upgrading to a bullish stance on EM local bonds, we would first need to upgrade our stance on EM currencies. Still, long-term investors who can tolerate volatility should begin accumulating EM local bonds on any further currency weakness. Our upgrade is based on the following reasons: First, there has been a fundamental shift in EM central banks’ policies. In past global downturns, many EM central banks hiked interest rates to defend their currencies. Presently, they are cutting rates aggressively despite large currency depreciation. This is the right policy action to fight the epic deflationary shock that EM economies are presently facing. There has been a fundamental shift in EM central banks’ policies. They are cutting rates aggressively despite large currency depreciation. Historically, EM local bond yields were often negatively correlated with exchange rates (Chart I-2, top panel). Similarly, when EM currencies began plunging two months ago, EM local bond yields initially spiked. However, following the brief spike, bond yields have begun dropping, even though EM currencies have not rallied (Chart I-2, bottom panel). This represents a new normal, which we discussed in detail in our October 24 report. Overall, even if EM currencies continue to depreciate, EM domestic bond yields will drop as they price in lower EM policy rates. Second, the monetary policy transmission mechanism in many EMs was broken before the COVID-19 outbreak. Even though central banks in many developing countries were reducing their policy rates before the pandemic, commercial banks’ corresponding lending rates were not dropping much (Chart I-3, top panel). Chart II-2EM Local Bond Yields And EM Currencies
EM Local Bond Yields And EM Currencies
EM Local Bond Yields And EM Currencies
Chart I-3EM ex-China: Monetary Transmission Has Been Impaired
EM ex-China: Monetary Transmission Has Been Impaired
EM ex-China: Monetary Transmission Has Been Impaired
Further, core inflation rates were at all time lows and prime lending rates in real terms were extremely high (Chart I-3, middle panels). Consequently, bank loan growth was slowing preceding the pandemic (Chart I-3, bottom panel). The reason was banks’ poor financial health. Saddled with a lot of NPLs, banks had been seeking wide interest rate margins to generate profit and recapitalize themselves. With the outburst of the pandemic and the sudden stop in domestic and global economic activity, EM banks’ willingness to lend has all but evaporated. Chart I-4 reveals EM ex-China bank stocks have plunged, despite considerable monetary policy easing in EM, which historically was bullish for bank share prices. This upholds the fact that the monetary policy transmission mechanism in EM is broken. Mounting bad loans due to the pandemic will only reinforce these dynamics. Swap lines with the Fed cannot prevent EM exchange rates from depreciation when fundamental pressures – global and domestic recessions – warrant weaker EM currencies. In brief, EM lower policy rates will not be transmitted to lower borrowing costs for companies and households anytime soon. Loan growth and domestic demand will remain in an air pocket for some time. Consequently, EM policy rates will have to drop much lower to have a meaningful impact on growth. Third, there is value in EM local yields. The yield differential between EM GBI local currency bonds and 5-year US Treasurys shot up back to 500 basis points, the upper end of its historical range (Chart I-5). Chart I-4EM ex-China: Bank Stocks Plunged Despite Rate Cuts
EM ex-China: Bank Stocks Plunged Despite Rate Cuts
EM ex-China: Bank Stocks Plunged Despite Rate Cuts
Chart I-5The EM Vs. US Yield Differential Is Attractive
The EM Vs. US Yield Differential Is Attractive
The EM Vs. US Yield Differential Is Attractive
Bottom Line: Odds favor further declines in EM local currency bond yields. Fixed-income investors should augment their duration exposure. We express this view by recommending receiving swap rates in the following markets: Russia, Mexico, Colombia, India and China. This is in addition to our existing receiver positions in Korean and Malaysian swap rates. For more detail, please refer to the Investment Recommendations section on page 8. Nevertheless, absolute-return investors should be cognizant of further EM currency depreciation. EM Currencies: At Mercy Of Global Growth Chart I-6EM Currencies Correlate With Commodities Prices
EM Currencies Correlate With Commodities Prices
EM Currencies Correlate With Commodities Prices
The key driver of EM currencies has been and remains global growth. The latter will remain very depressed for some time, warranting patience before turning bullish on EM exchange rates. We have long argued that EM exchange rates are driven not by US interest rates but by global growth. Industrial metals prices offer a reasonable pulse on global growth. Chart I-6 illustrates their tight correlation with EM currencies. Even though the S&P 500 has rebounded sharply in recent weeks, there are no signs of a meaningful improvement in industrial metals prices. Various raw materials prices in China are also sliding (Chart I-7). In a separate section below we lay out the case as to why there is more downside in iron ore and steel as well as coal prices in China. Finally, the ADXY – the emerging Asia currency index against the US dollar – has broken down below its 2008, 2016 and 2018-19 lows (Chart I-8). This is a very bearish technical profile, suggesting more downside ahead. This fits with our fundamental assessment that a recovery in global economic activity is not yet imminent. Chart I-7China: Commodities Prices Are Sliding
China: Commodities Prices Are Sliding
China: Commodities Prices Are Sliding
Chart I-8A Breakdown In Emerging Asian Currencies
A Breakdown In Emerging Asian Currencies
A Breakdown In Emerging Asian Currencies
What About The Fed’s Swap Lines? A pertinent question is whether EM central banks’ foreign currency reserves and the Federal Reserve’s swap lines with several of its EM counterparts are sufficient to prop up EM currencies prior to a pickup in global growth. The short answer is as follows: These swap lines will likely limit the downside but cannot preclude further depreciation. With the exception of Turkey and South Africa, virtually all mainstream EM banks have large foreign currency reserves. On top of this, several of them – Brazil, Mexico, South Korea and Singapore– have recently obtained access to Fed swap lines. Their own foreign exchange reserves and the swap lines with the Fed give them an option to defend their currencies from depreciation if they choose to do so. However, selling US dollars by EM central banks is not without cost. When central banks sell their FX reserves or dollars obtained from the Fed via swap lines, they withdraw local currency liquidity from the system. As a result, banking system liquidity shrinks, pushing up interbank rates. This is equivalent to hiking interest rates. The Fed’s outright money printing is the sole reason to buy EM risk assets and currencies at the moment. Yet, EM fundamentals – namely, its growth outlook – remain downbeat. Hence, the cost of defending the exchange rate by using FX reserves is both liquidity and credit tightening. In such a case, the currency could stabilize but the economy will take a beating. Since the currency depreciation was itself due to economic weakness, such a policy will in and of itself be self-defeating. The basis is that escalating domestic economic weakness will re-assert its dampening effect on the currency. Of course, EM central banks can offset such tightening by injecting new liquidity. However, this could also backfire and lead to renewed currency depreciation. Bottom Line: EM central banks’ swap lines with the Fed are primarily intended to instill confidence among investors in financial markets. They could be used to fend off short-term speculative attacks on EM currencies. Nevertheless, they cannot prevent EM exchange rates from depreciation when fundamental pressures – global and domestic recessions – warrant weaker EM currencies. What About The Fed’s Money Printing? Chart I-9The Fed Is Aggressively Printing Money
The Fed Is Aggressively Printing Money
The Fed Is Aggressively Printing Money
The Fed is printing money and monetising not only public debt but also substantial amounts of private debt. This will ultimately be very bearish for the US dollar. Chart I-9 illustrates that the Fed is printing money much more aggressively than during its quantitative easing (QE) policies post 2008. The key difference between the Fed’s liquidity provisions now and during its previous QEs is as follows: When the Fed purchases securities from or lends to commercial banks, it creates new reserves (banking system liquidity) but it does not create money supply. Banks’ reserves at the Fed are not a part of broad money supply. This was generally the case during previous QEs when the Fed was buying bonds mostly – but not exclusively – from banks, therefore increasing reserves without raising money supply by much. When the Fed lends to or purchases securities from non-banks, it creates both excess reserves for the banking system and money supply (deposits at banks) out of thin air. The fact that US money supply (M2) growth is now much stronger than during the 2010s QEs suggests the recent surge in US money supply is due to the Fed’s asset purchases from and lending to non-banks, which creates money/deposits outright. The rampant expansion of US money supply will eventually lead to the greenback’s depreciation. However, for the US dollar to depreciate against EM currencies, the following two conditions should be satisfied: 1. US imports should expand, reviving global growth, i.e., the US should send dollars to the rest of the world by buying goods and services. This is not yet happening as domestic demand in America has plunged and any demand recovery in the next three to six months will be tame and muted. 2. US investors should channel US dollars to EM to purchase EM financial assets. In recent weeks, foreign flows have been returning to EM due to the considerable improvement in EM asset valuations. However, the sustainability of these capital flows into EM remains questionable. The main reasons are two-fold: (A) there is huge uncertainty on how efficiently EM countries will be able handle the economic and health repercussions of the pandemic; and (B) global growth remains weak and, as we discussed above, it has historically been the main driver of EM risk assets and currencies. Bottom Line: The Fed’s outright money printing is the sole reason to buy EM risk assets and currencies at the moment. Yet, EM fundamentals – namely, its growth outlook – remain downbeat. Overall, we recommend investors to stay put on EM risk assets and currencies in the near-term. Investment Recommendations Chart I-10China: Bet On Lower Long-Term Yields
China: Bet On Lower Long-Term Yields
China: Bet On Lower Long-Term Yields
We have been recommending receiving rates in a few markets such as Korea and Malaysia. Now, we are widening this universe to include Russia, Mexico, Colombia, China, and India. In China, the long end of the yield curve offers value (Chart I-10, top panel). The People’s Bank of China has brought down short rates dramatically but the long end has so far lagged (Chart I-10, bottom panel). We recommend investors receive 10-year swap rates. Fixed-income investors could also bet on yield curve flattening. The recovery in China will be tame and the PBoC will keep interest rates lower for longer. Consequently, long-dated swap rates will gravitate toward short rates. We are closing three fixed-income trades: In Mexico, we are booking profits on our trade of receiving 2-year / paying 10-year swap rates – a bet on a steeper yield curve. This position has generated a 152 basis-point gain since its initiation on April 12, 2018. In Colombia, our bet on yield curve flattening has produced a loss of 28 basis points since January 17, 2019. We are closing it. In Chile, we are closing our long 3-year bonds / short 3-year inflation-linked bonds position. This trade has returned 2.0% since we recommended it on October 3, 2019. For dedicated EM domestic bond portfolios, our overweights are Russia, Mexico, Peru, Colombia, Korea, Malaysia, Thailand, India, China, Pakistan and Ukraine. Our underweights are South Africa, Turkey, Brazil, Indonesia and the Philippines. The remaining markets warrant a neutral allocation. Regarding EM currencies, we continue to recommend shorting a basket of the following currencies versus the US dollar: BRL, CLP, ZAR, IDR, PHP and KRW. Arthur Budaghyan Chief Emerging Markets Strategist arthurb@bcaresearch.com Chinese Steel, Iron Ore And Coal Markets: Heading South Chart II-1Steel, Iron Ore And Coal Prices: More Downside Ahead?
Steel, Iron Ore And Coal Prices: More Downside Ahead?
Steel, Iron Ore And Coal Prices: More Downside Ahead?
Odds are that iron ore, steel and coal prices will all continue heading south (Chart II-1). Lower prices will harm both Chinese and global producers of these commodities. Steel And Iron Ore The oversupplied conditions in the Chinese steel market will become even more aggravated over the next three to six months. First, Chinese output of steel products has not contracted even though demand plunged in the first three months of the year, creating oversupply. Despite falling steel prices and the demand breakdown resulting from the COVID-19 outbreak, Chinese crude steel output still grew at 1.5% and its steel products output only declined 0.6% between January and March from a year ago (Chart II-2). Chart II-2Steel Products Output In China: Still No Contraction
Steel Products Output In China: Still No Contraction
Steel Products Output In China: Still No Contraction
The profit margin of Chinese steel producers has compressed but not enough to herald a sizable cut in mainland steel production. Despite oversupply, Chinese steel producers are reluctant to curtail output to prevent layoffs. This year, there will be 62 million tons of new steel production capacity while 82 million tons of obsolete capacity will be shut down. As the capacity-utilization rate (CUR) of the new advanced production capacity will be much higher than the CUR on those soon-to-be-removed capacities in previous years, this will help lift steel output. Second, Chinese steel demand has plummeted, and any revival will be mild and gradual over the next three to six months. Construction accounts for about 55% of Chinese steel demand, with about 35% coming from the property market and 20% from infrastructure. Additionally, the automobile industry contributes about 10% of demand. All three sectors are currently in deep contraction (Chart II-3). Looking ahead, we expect that the demand for steel from property construction and automobile production will revive only gradually. Overall, it will continue contracting on a year-on-year basis, albeit at a diminishing rate than now. While we projected a 6-8% rise in Chinese infrastructure investment for this year, most of that will be back-loaded to the second half of the year. In addition, modest and gradual steel demand increases from this source will not be able to offset the loss of demand from the property and automobile sectors. The oversupplied conditions in the Chinese steel market will become even more aggravated over the next three to six months. Reflecting the disparity between weak demand and resilient supply, steel inventories in the hands of producers and traders are surging, which also warrants much lower prices (Chart II-4). Chart II-3Deep Contraction In Steel Demand From Major Users
Deep Contraction In Steel Demand From Major Users
Deep Contraction In Steel Demand From Major Users
Chart II-4Significant Build-Up In Steel Inventories
Significant Build-Up In Steel Inventories
Significant Build-Up In Steel Inventories
Chart II-5Chinese Iron Ore Imports Will Likely Decline In 2020
Chinese Iron Ore Imports Will Likely Decline In 2020
Chinese Iron Ore Imports Will Likely Decline In 2020
Regarding iron ore, mushrooming steel inventories in China and lower steel prices will eventually lead to steel output cutbacks in the country. This will be compounded by shrinking steel production outside of China, dampening global demand for iron ore. Besides, in China, scrap steel prices have fallen more sharply than iron ore prices have. This makes the use of scrap steel more appealing than iron ore in steel production. Chinese iron ore imports will likely drop this year (Chart II-5). Finally, the global output of iron ore is likely to increase in 2020. The top three producers (Vale, Rio Tinto and BHP) have all set their 2020 guidelines above their 2019 production levels. This will further weigh on iron ore prices. Coal Although Chinese coal prices will also face downward pressure, we believe that the downside will be much less than that for steel and iron ore prices. Coal prices have already declined nearly 27% from their 2019 peak. They recently declined below 500 RMB per ton – the lower end of a range that the government generally tries to maintain. Prices had not dropped below this level since September 2016. In the near term, prices could go down by another 5-10%, given that record-high domestic coal production and imports have overwhelmed the market (Chart II-6). Coal prices have already declined nearly 27% from their 2019 peak. They recently declined below 500 RMB per ton – the lower end of a range that the government generally tries to maintain. However, there are emerging supportive forces. China Coal Transport & Distribution Association (CCTD), the nation’s leading industry group, on April 18, called on the industry to slash production (of both thermal and coking coal) in May by 10%. It also proposed that the government should restrict imports. The CCTD stated that about 42% of the producers are losing money at current coal prices. The government had demanded producers make similar cuts for a much longer time duration in 2016, which pushed coal to sky-high prices. The outlook for a revival in the consumption of electricity and, thereby, in the demand for coal is more certain than it is for steel and iron ore. About 60% of Chinese coal is used to generate thermal power. Finally, odds are rising that the government will temporarily impose restrictions on coal imports as it did last December – when coal imports to China fell by 70% as a result. Investment Implications Companies and countries producing these commodities will be hurt by the reduction of Chinese purchases. These include, but are not limited to, producers in Indonesia, Australia, Brazil and South Africa. Iron ore and coal make up 10% of total exports in Brazil, 6% in South Africa, 18% in Indonesia and 32% in Australia. Investors should avoid global steel and mining stocks (Chart II-7). Chart II-6Chinese Coal Output And Imports Are At Record Highs
Chinese Coal Output And Imports Are At Record Highs
Chinese Coal Output And Imports Are At Record Highs
Chart II-7Avoid Global Steel And Mining Stocks For Now
Avoid Global Steel And Mining Stocks For Now
Avoid Global Steel And Mining Stocks For Now
We continue to recommend shorting BRL, ZAR and IDR versus the US dollar. Ellen JingYuan He Associate Vice President ellenj@bcaresearch.com Footnotes Equities Recommendations Currencies, Credit And Fixed-Income Recommendations