China

Highlights The Chinese economy is recovering at a slower rate than the equity market has priced in. There is a high likelihood of negative revisions to Q2 EPS estimates and an elevated risk of a near-term price correction in Chinese stocks. We expect a meaningful pickup in credit growth in H1 to improve domestic demand gain tractions in H2. This supports our overweight stance on Chinese stocks in the next 6-12 months, in both absolute and relative terms. There is still a strong probability that the yield curve will flatten, and the 10-year government bond yield may even dip below 2% in the wake of disappointing economic data in Q2. But our baseline scenario suggests the 10-year government bond yield should bottom no later than Q3 of this year. Feature This week’s report addresses pressing concerns from clients in China’s post-Covid-19 environment. China’s economy contracted by 6.8% in Q1, the largest GDP growth slump since 1976. Furthermore, the IMF’s baseline scenario projects a 3% contraction in global economic growth in 2020, with the Chinese economy growing at a mere 1.2%.1 This dim annual growth outlook means that the contraction in China’s economy will likely extend to Q2, dragging down corporate profit growth. In our April 1st report2 we recommended that investors maintain a neutral stance on Chinese stocks in the next three months due to uncertainties surrounding the pandemic, the oversized passive outperformance in Chinese stocks, and heightened risks for further risk-asset selloffs. On a 6- to 12-month horizon, however, we have a higher conviction that Chinese stocks will outperform global benchmarks. Our view is based on a decisive shift by policymakers to a “whatever it takes” approach to boost the economy. We believe that the speed of China’s economic recovery in the second half of 2020 will outpace other major economies. Q: China’s economy is recovering ahead of other major economies. Why did you recently downgrade your tactical call on Chinese equities from overweight to neutral relative to global stocks? A: China’s economy is recovering, but it is recovering at a slower rate than the equity market has fully priced in (Chart 1A and 1B). We believe the likelihood of negative revisions to Q2 EPS estimates is high, and the risk of a near-term price correction in Chinese stocks remains elevated. Chart 1AElevated Chinese Equity Outperformance Relative To Global Stocks
Elevated Chinese Equity Outperformance Relative To Global Stocks
Elevated Chinese Equity Outperformance Relative To Global Stocks
Chart 1BChinese Stocks Largely Ignored Weakness In Domestic Economy
Chinese Stocks Largely Ignored Weakness In Domestic Economy
Chinese Stocks Largely Ignored Weakness In Domestic Economy
The lackluster March data suggests that the pace of China’s economic recovery in April and even May will likely disappoint, weighing on the growth prospects for Q2’s corporate earnings (Chart 2). Chart 2EPS Growth Estimates Likely To Capitulate In Q2
EPS Growth Estimates Likely To Capitulate In Q2
EPS Growth Estimates Likely To Capitulate In Q2
The work resumption rate in China’s 36 provinces jumped sharply between mid-February and mid-March. However, since that time, the resumption rate among large enterprises has hovered around 80% of normal capacity (Chart 3). Chart 3Work Resumption Hardly Improved Since Mid-March
Three Questions Following The Coronacrisis
Three Questions Following The Coronacrisis
The flattening of the work resumption rate curve is due to a lack of strong recovery in demand. Chart 4So Far No Strong Recovery In Domestic Demand
So Far No Strong Recovery In Domestic Demand
So Far No Strong Recovery In Domestic Demand
The flattening of the resumption rate curve is due to a lack of strong recovery in demand. Although there was a surge in Chinese imports in crude oil and raw materials, the increase was the result of China taking advantage of low commodity prices. This surge cannot be sustained without a pickup in domestic demand. The March bounce back in domestic demand from the manufacturing, construction, and household sectors has all been lackluster (Chart 4). External demand, which growth remained in contraction through March, will likely worsen in Q2 (Chart 5). Exports shrunk by 6.6% in March, up from a deep contraction of 17.2% in January-February. Export orders can take more than a month to be processed, therefore, March’s data reflects pent-up orders from the first two months of the year. The US and European economies started their lockdowns in March, so Chinese exports will only feel the full impact of the collapse in demand from its trading partners in April and May. The work resumption rate will advance only if the momentum in domestic demand recovery increases to fully offset the collapse in external demand. The current 83% rate of work resumption implies that industrial output growth in April will remain in contraction on a year-over-year basis (Chart 6). Chart 5External Demand Will Worsen In Q2
External Demand Will Worsen In Q2
External Demand Will Worsen In Q2
Chart 6Will Q2 Industrial Output Growth Remain In Contraction?
Will Q2 Industrial Output Growth Remain In Contraction?
Will Q2 Industrial Output Growth Remain In Contraction?
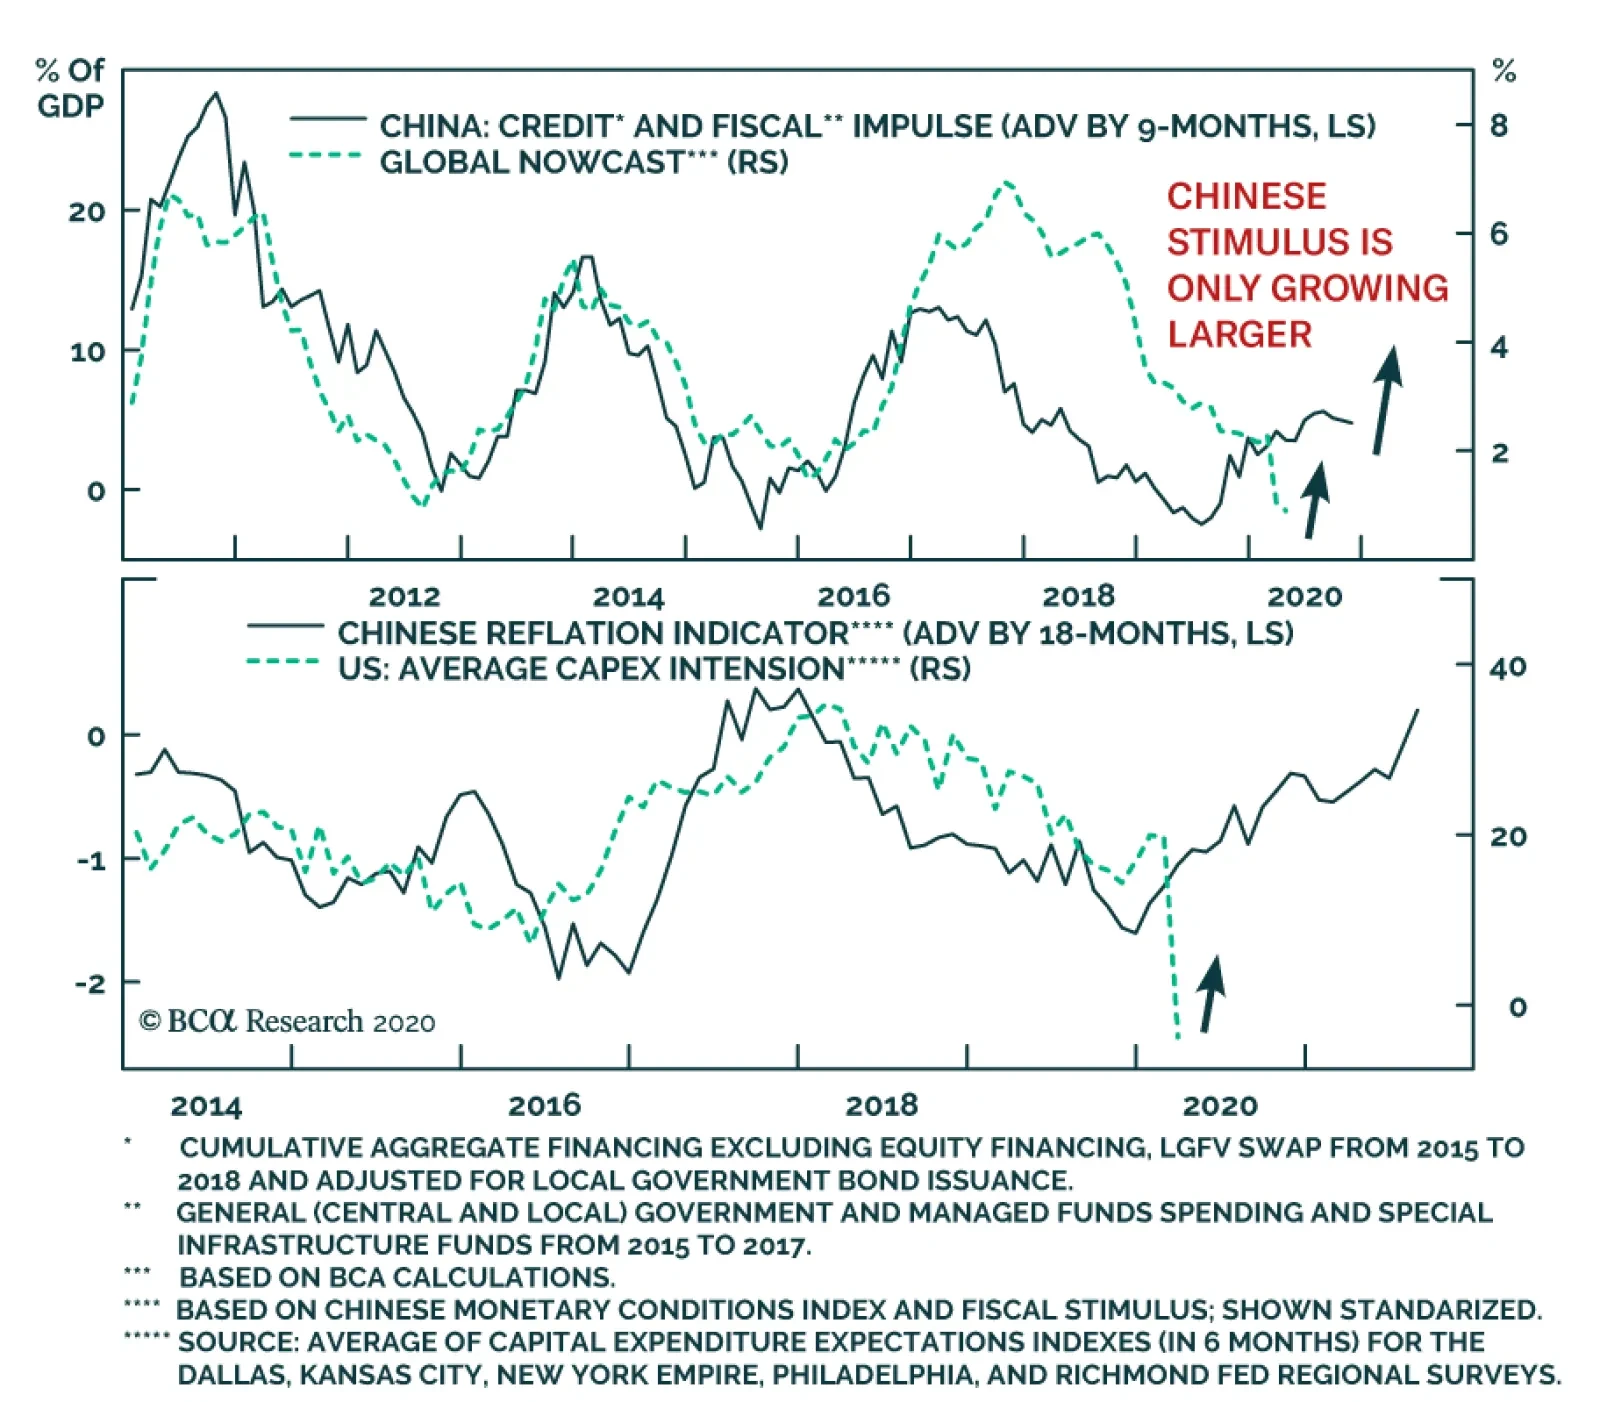
Although we maintain a constructive outlook on Chinese risk assets in the next 6 to 12 months, the short-term picture remains volatile in view of the emerging economic data. As such, we recommend investors to maintain short-term hedges for risk asset positions. Q: China’s policy response to mitigate the economic blow from COVID-19 has been noticeably smaller than programs rolled out in key developed economies, especially the US. Why do you think such measured stimulus from China warrants an overweight stance on Chinese stocks in the next 6-12 months relative to global benchmarks? A: It is true that the size of existing Chinese stimulus, as a percentage of the Chinese economy, is smaller than that has been announced in the US. But this is due to a different approach China is taking in stimulating its economy. In addition, both the recent policy rhetoric and PBoC actions suggest a large credit expansion is in the works. This will likely overcompensate the damage on China’s aggregate economy, and generate an outperformance in both Chinese economic growth and returns on Chinese risk assets in the next 6 to 12 months. China’s policy responses have an overarching focus on stimulating new demand and investment, which is a different approach from the programs offered by its Western counterparts. In the US, the combination of fiscal and monetary stimulus amounts to 11% of GDP as of April 16, with almost all policy support targeted at keeping companies and individuals afloat. In comparison, China’s policy response accounts for a mere 1.2% of its GDP.3 However, this direct comparison understates the enormous firepower in the Chinese stimulus toolkit, specifically a credit boom. As noted in our February 26 report,4 China has largely resorted to its “old economic playbook” by generating a huge credit wave to ride out the economic turmoil. Our prediction of the policy shift towards a significant escalation in stimulus was confirmed at the March 27 Politburo meeting. Moreover, the April 17 Politburo meeting reinforced a “whatever it takes” policy shift with direct calls on more forceful central bank policy actions, a first since the global financial crisis in 2008.5 Since 2008, the overnight repo rate’s breaking into the IORR-IOER corridor has been a reliable indicator leading to impressive credit upcycles. The PBoC’s recent aggressive easing measures have pushed down the interbank repo rate below the central bank’s interest rate on required reserves (IORR). The price for interbank borrowing is now near the lower range of the rate corridor, between the IORR and the interest rate on excess reserves (IOER). Since 2008, the overnight repo rate’s breaking into the IORR-IOER corridor has been a reliable indicator leading to impressive credit upcycles (Chart 7). Such credit super cycles, in turn, have led to both economic booms and an outperformance in Chinese stocks. Chart 7Another Credit Super Cycle Is In The Works
Another Credit Super Cycle Is In The Works
Another Credit Super Cycle Is In The Works
Chart 8Financial Conditions Were Extremely Tight In 2011-2014
Financial Conditions Were Extremely Tight In 2011-2014
Financial Conditions Were Extremely Tight In 2011-2014
The 2012-2015 cycle was an exception to the relationship between the overnight interbank repo rate, credit growth and Chinese stock performance. A steep pickup in credit growth in 2012 coincided with a leap in the overnight interbank repo rate, and the credit boom did not help boost demand in the real economy or improve Chinese stock performance. This is because corporate borrowing was severely curtailed by high lending rates during a four-year monetary tightening cycle from 2011 to 2014 (Chart 8). The credit boom during that cycle was largely driven by explosive growth in short-term shadow-bank lending and wealth management products (WMP), and did not channel into the real economy.6 We do not think such an extreme phenomena will replay under the current circumstances. Monetary stance will likely remain tremendously accommodative through the end of the year to facilitate a continuous rollout of medium- to long-term bank loans and local government bonds. Chinese financial institutions’ “animal spirits” may have been unleashed. But under the scrutiny of the Macro-Prudential Assessment Framework and the New Asset Management Rules,7 the "animal spirits" are unlikely to run up enough risks to prompt the PBoC to prematurely tighten liquidity conditions in the interbank market. Marginal propensity in China is pro-cyclical, which tends to lag credit cycles by 6 months. Chart 9Marginal Propensity In China Is Pro-Cyclical
Marginal Propensity In China Is Pro-Cyclical
Marginal Propensity In China Is Pro-Cyclical
Both corporate and household marginal propensity, a measure of the willingness to spend, will pick up as well. Marginal propensity is pro-cyclical, which tends to lag credit cycles by 6 months (Chart 9). In other words, when interest rates are low and credit growth improves, corporates and households tend to spend more. The meaningful expansion in credit growth, which started in Q1 and will sustain in the coming two to three quarters, will help corporate and household spending gain tractions in H2. This constructive view on Chinese stimulus and economic recovery supports our overweight stance on Chinese stocks in the next 6-12 months, in both absolute and relative terms. Q: The yield curve in Chinese government bonds has steepened following PBoC’s aggressive monetary easing announcements. Has the Chinese 10-year bond yield bottomed? A: No, we do not think the 10-year bond yield has bottomed. There is probability the 10-year government bond yield may briefly dip below 2% in Q2. However, barring a multi-year global economic recession, we think the 10-year government bond yield will bottom no later than Q3 this year. Chart 10A Wide Gap Between The Long and Short
A Wide Gap Between The Long and Short
A Wide Gap Between The Long and Short
The short end of the yield curve dropped disproportionally compared with the long end, following the PBoC’s announcement to place its first IOER cut since 2008 (Chart 10). This led to a rapid steepening in the yield curve. While our view supports a flattening of the yield curve in Q2 and even a 50bps drop in the 10-year government bond yield, we think that the capitulation will be brief. In order for the 10-year government bond yield to remain below 2% for an extended period of time, the market needs to believe one or more of the following will happen: The pandemic will cause a multi-year global economic recession, preventing the PBoC from normalizing its policy stance in the foreseeable future. The duration and depth of the economic impact from the pandemic are still moving targets. Our baseline scenario suggests that the Chinese economic recovery will pick up momentum in H2 this year. The PBoC will not normalize its policy stance even when the economy has stabilized. The PBoC has a track record as a reactive central bank rather than a proactive one. Still, during each of the past three economic and credit cycles, the PBoC has started to normalize its interest rate on average nine months following a bottom in the business cycle (Chart 11). The tightening of interest rate even applied to the prolonged economic downturn and deep deflationary cycle in 2015/16 (Chart 12). Chart 11The 'Old Faithful' PBoC Policy Normalization Pattern
The 'Old Faithful' PBoC Policy Normalization Pattern
The 'Old Faithful' PBoC Policy Normalization Pattern
Chart 12Policy Normalized Even After A Long Economic Downturn
Policy Normalized Even After A Long Economic Downturn
Policy Normalized Even After A Long Economic Downturn
Chart 132008 Or 2015?
2008 Or 2015?
2008 Or 2015?
How the yield curve has historically behaved also depended on the market’s expectations on the speed of the economic recovery, and the timing of the subsequent monetary policy normalization. The yield curved spiked in the wake of substantial monetary easing and pickup in credit growth, in both 2008 and 2015 (Chart 13). While in 2008 the yield curve moved in lockstep with the 3-month SHIBOR with a perfect reverse correlation, in the 2015/16 cycle the yield curve spiked initially but quickly flattened. The long end of the yield curve capitulated as soon as the market realized the economic slowdown was a prolonged one. The 10-year government bond yield, after trending sideways in early 2016, only truly bottomed after the nominal output growth troughed in Q1 2016 (Chart 13, bottom panel). Will the yield curve behave like in 2008, or more like in 2015 in this cycle? We think it will be somewhere in between. The current economic cycle bottomed in Q1, but the economy is only recovering slowly and we expect a U-shaped economic recovery rather than a 2008-style V-shaped one. At the same time, our baseline scenario does not suggest the current environment will evolve into a 4-year deflationary cycle as in the 2012-2016 period. Therefore, we expect the low interest rate environment to endure for another two to three quarters before the PBoC starts to reverse its policy stance back to the pre-COVID-19 range. As such, the yield on 10-year government bonds will fall, possibly by as much as 50bps, when the economic data disappoint in Q2 and more rate cuts are forthcoming. But it will bottom when the economic recovery starts to gain traction in H22020 and the market starts to price in a subsequent monetary policy normalization. When growth slows and debt rises sharply, the PBoC will need to join its western counterparts to permanently maintain an ultra-low interest rate policy to accommodate its high debt level. We acknowledge the fact that China’s potential output growth is trending down (Chart 14). But it has been trending downwards since 2011. A structurally slowing rate of economic growth has not prevented the PBoC from cyclically raising its policy rate. Hence, unless we see evidence that the pandemic is meaningfully lowering China’s potential growth on par with growth rates in the DMs, our baseline scenario does not support a structural ultra-low interest rate environment in China. China’s debt-to-GDP ratio will most likely rise substantially this year, given that the credit impulse will gain momentum and GDP will grow very modestly. However, this rapid rise in the debt-to-GDP ratio will most likely not be sustained beyond this year. Even if we assume that credit impulse will account for 40% of GDP in 2020 (the same magnitude as in 2008/09), a sharp reversal in the output gap in 2021, as predicted by IMF,8 will flatten the debt-to-GDP ratio curve (Chart 15). Moreover, following every credit super cycle in the past, Chinese authorities have put a brake on the debt-to-GDP ratio. Chart 14China's Potential Growth Is Likely To Trend Lower...
China's Potential Growth Is Likely To Trend Lower...
China's Potential Growth Is Likely To Trend Lower...
Chart 15...But Has Not Stopped PBoC From Flattening The Debt Curve
...But Has Not Stopped PBoC From Flattening The Debt Curve
...But Has Not Stopped PBoC From Flattening The Debt Curve
All in all, while we see a high possibility for the 10-year government bond yield to fall in Q2, the decline will be limited in terms of duration. Jing Sima China Strategist jings@bcaresearch.com Footnotes 1IMF World Economic Outlook, April 2020 2Please see China Investment Strategy Weekly Report "Investing During A Global Pandemic," dated April 1, 2020, available at cis.bcaresearch.com 3IMF, Policy Responses To COVID-19 https://www.imf.org/en/Topics/imf-and-covid19/Policy-Responses-to-COVID-19#U 4Please see China Investment Strategy Weekly Report "China: Back To Its Old Economic Playbook?" dated February 26, 2020, available at cis.bcaresearch.com 5“Stable monetary policy must become more flexible” and “use RRR reductions, lower interest rates, re-lending and other measures to preserve adequate liquidity and guide the loan prime rate downwards.” Statements from Xi Jinping, April 17, 2020 Politburo Meeting. http://www.gov.cn/xinwen/2020-04/17/content_5503621.htm 6 Bankers’ acceptances - short-term debt instruments guaranteed by commercial banks - swelled by 887% between end-2008 and 2012. The outstanding amount of WMPs jumped from 1.7 trillion RMB in 2009 to more than 9 trillion RMB by H12013. In contrast, the amount of RMB-denominated bank loans increased by only 67% during the same period. 7The Macro-Prudential Assessment Framework and the New Asset Management Rules were implemented in 2016 and 2018, respectively. They are designed to create additional restrictions to curb shadow-bank lending and broaden the PBoC’s oversight on banks’ WMP holdings. 8The April IMF World Economic Outlook predicts a 1.2% Chinese GDP growth in 2020 and a 9.2% GDP growth in 2021. Cyclical Investment Stance Equity Sector Recommendations
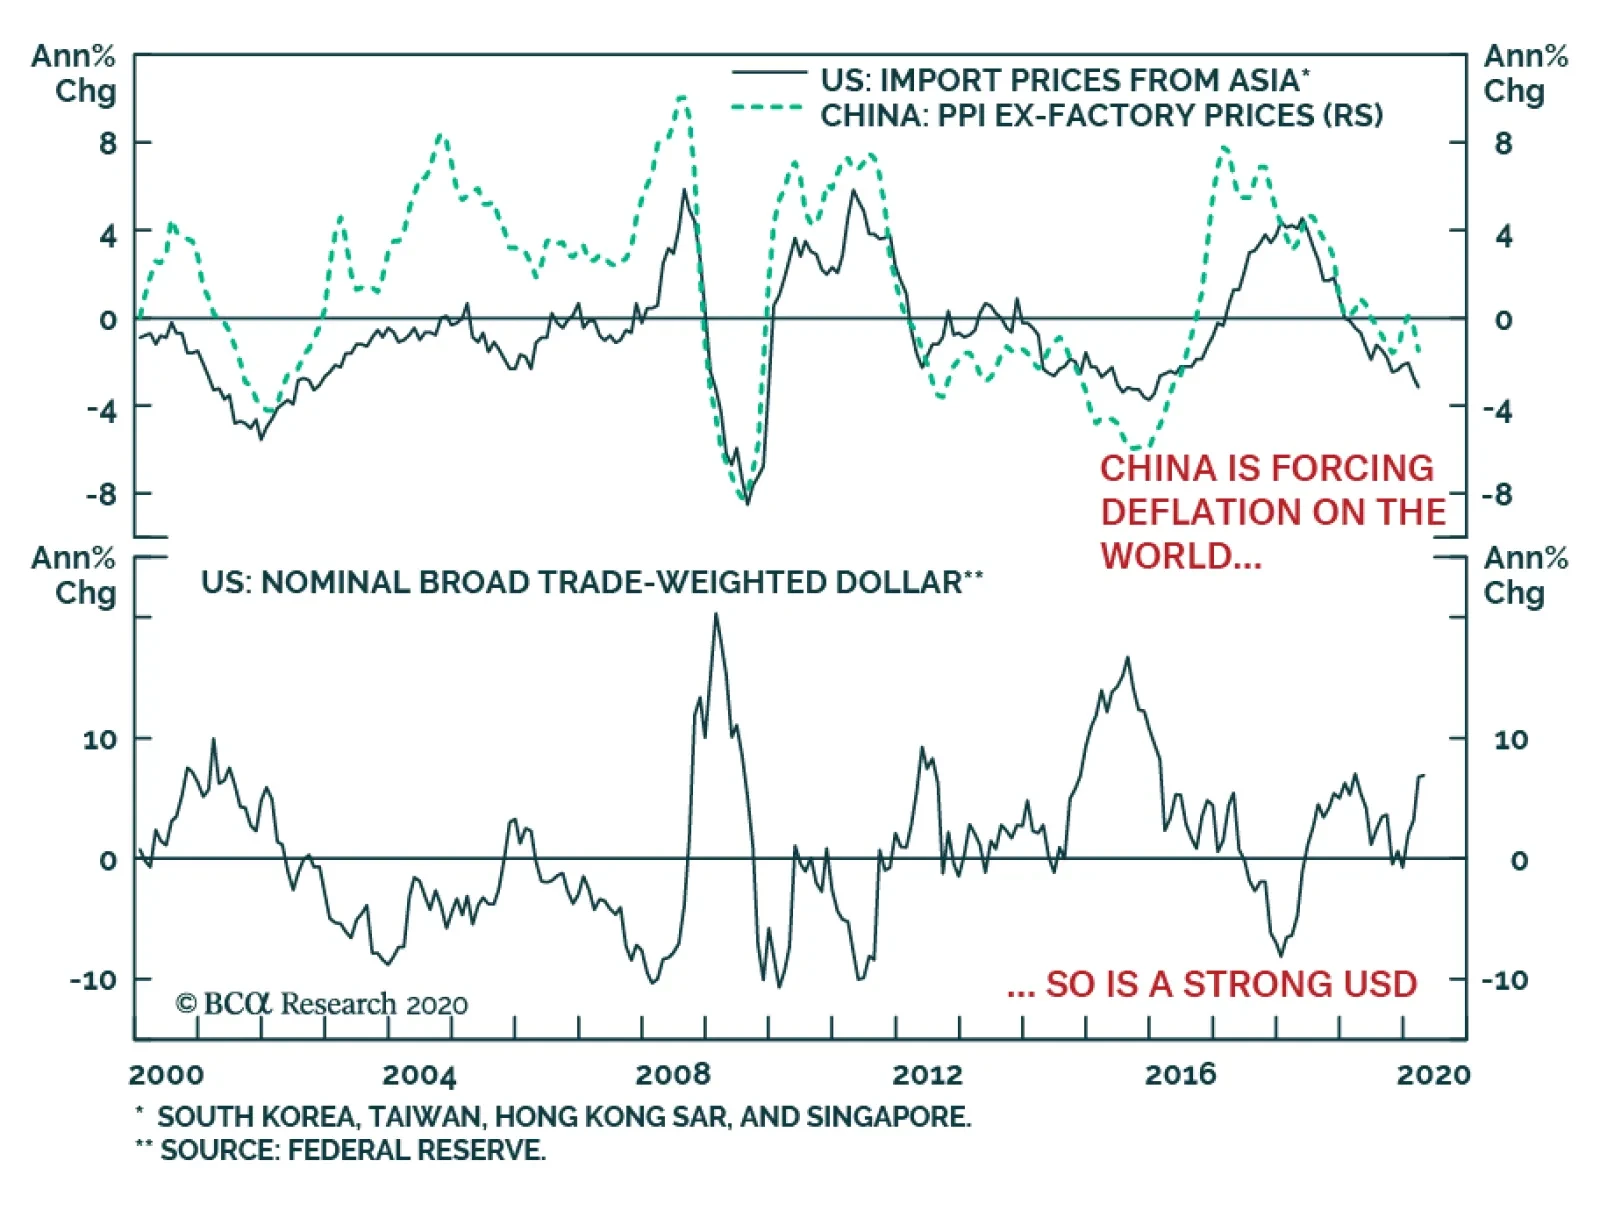
When COVID-19 first emerged and closed the Chinese economy in Late January and February, many commentators worried that it would be an inflationary shock as it would result in an (albeit temporary) inward shift in the global supply curve. This risk did not…
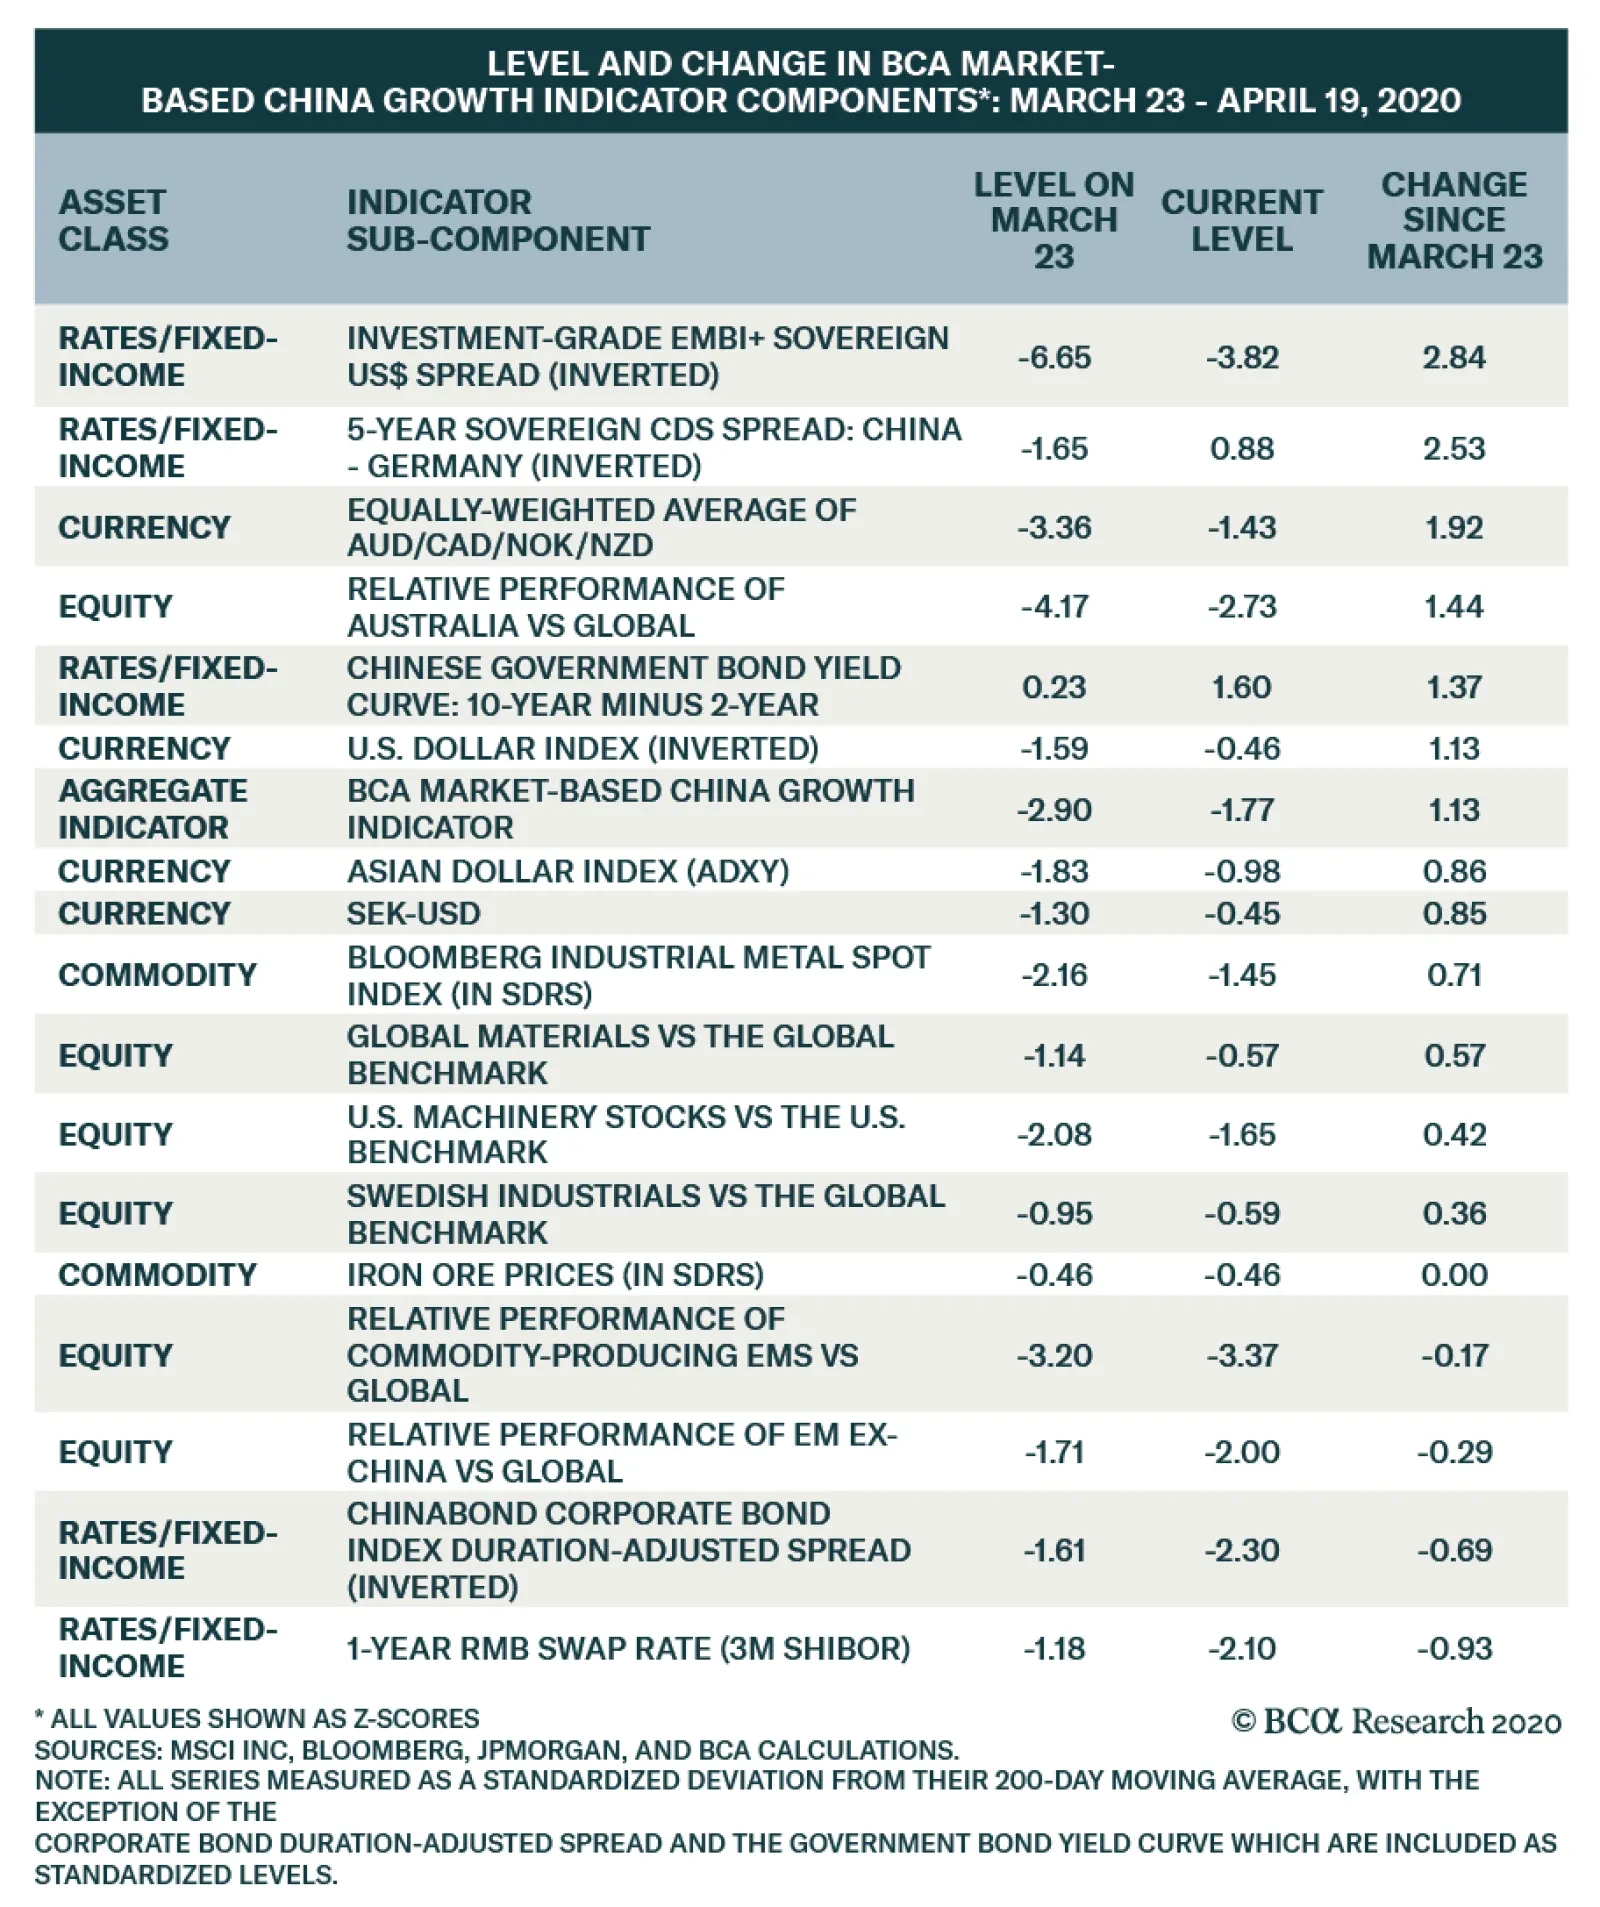
The above table presents a breakdown of the subcomponents of our BCA Market-Based China Growth Indicator. The indicator has rebounded since March 23 alongside the US and global stock prices, and the table highlights the change in each subcomponent during this…
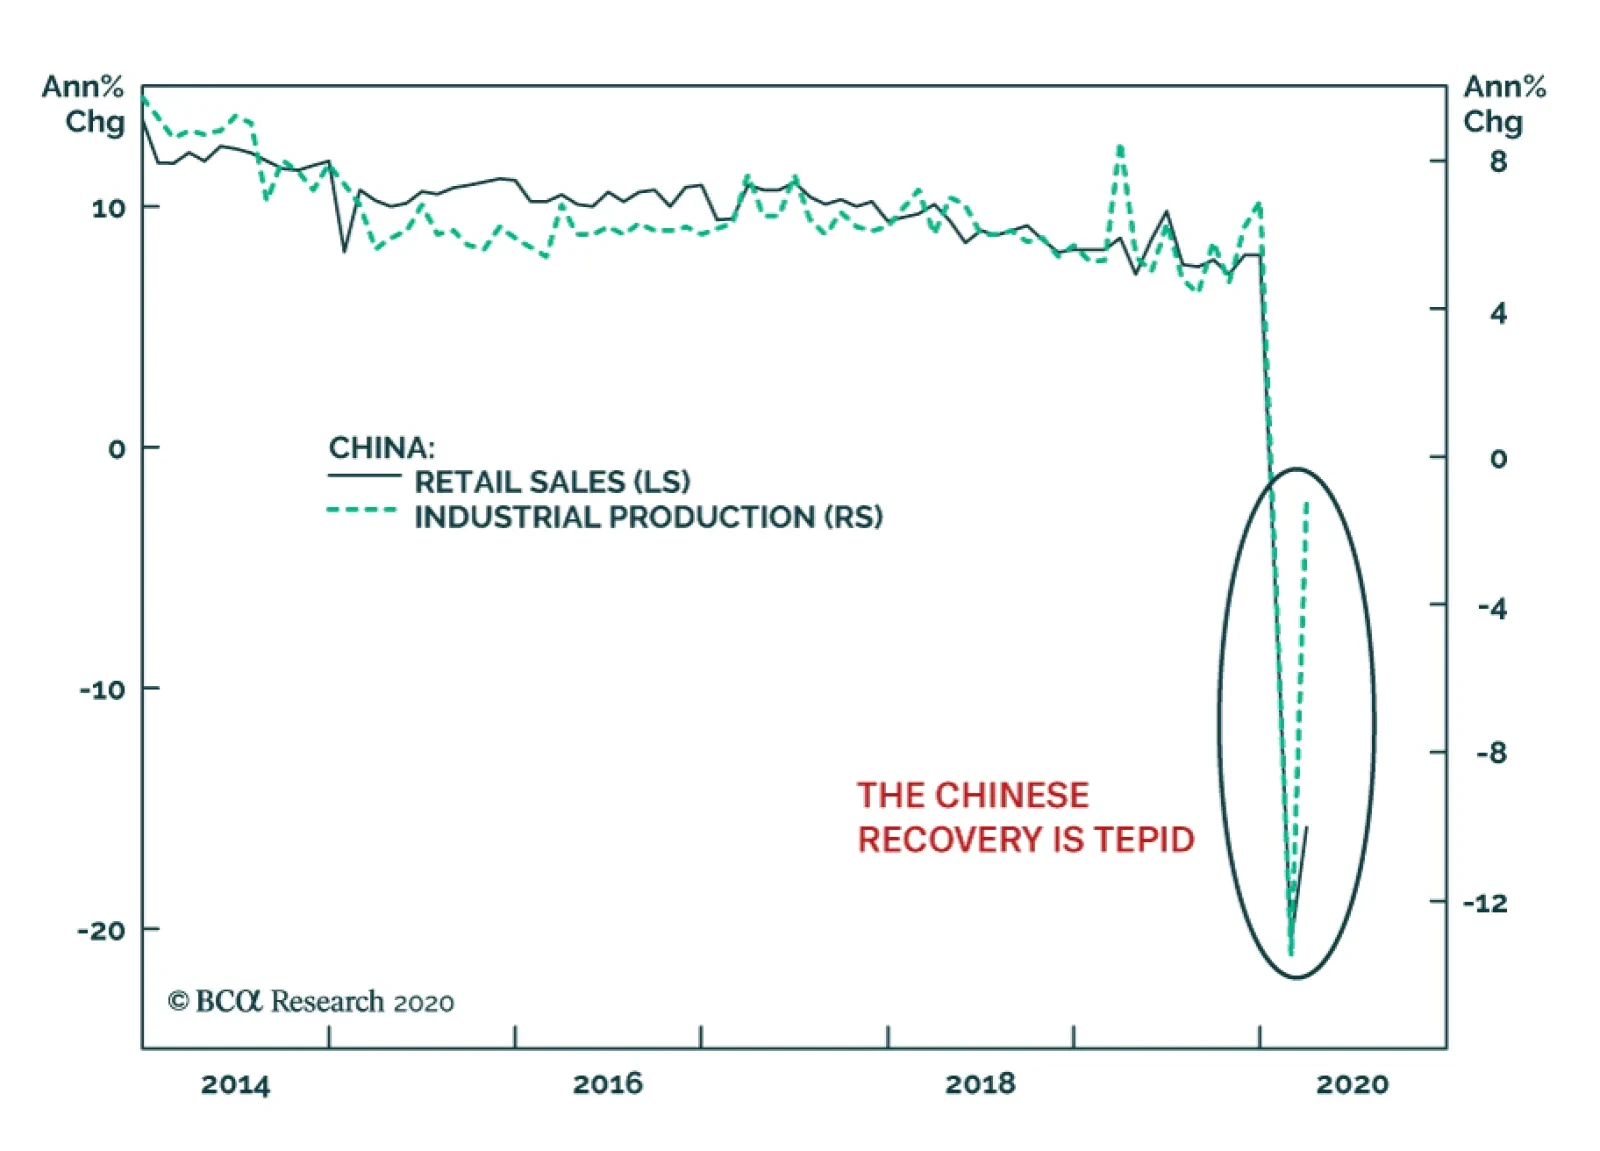
China’s real Q1 GDP growth was, unsurprisingly, weak. Year-on-year growth came in at -6.8%, and seasonally-adjusted quarterly growth was -9.8%. The true surprise was the weakness of the March industrial production and retail sales data. Industrial…
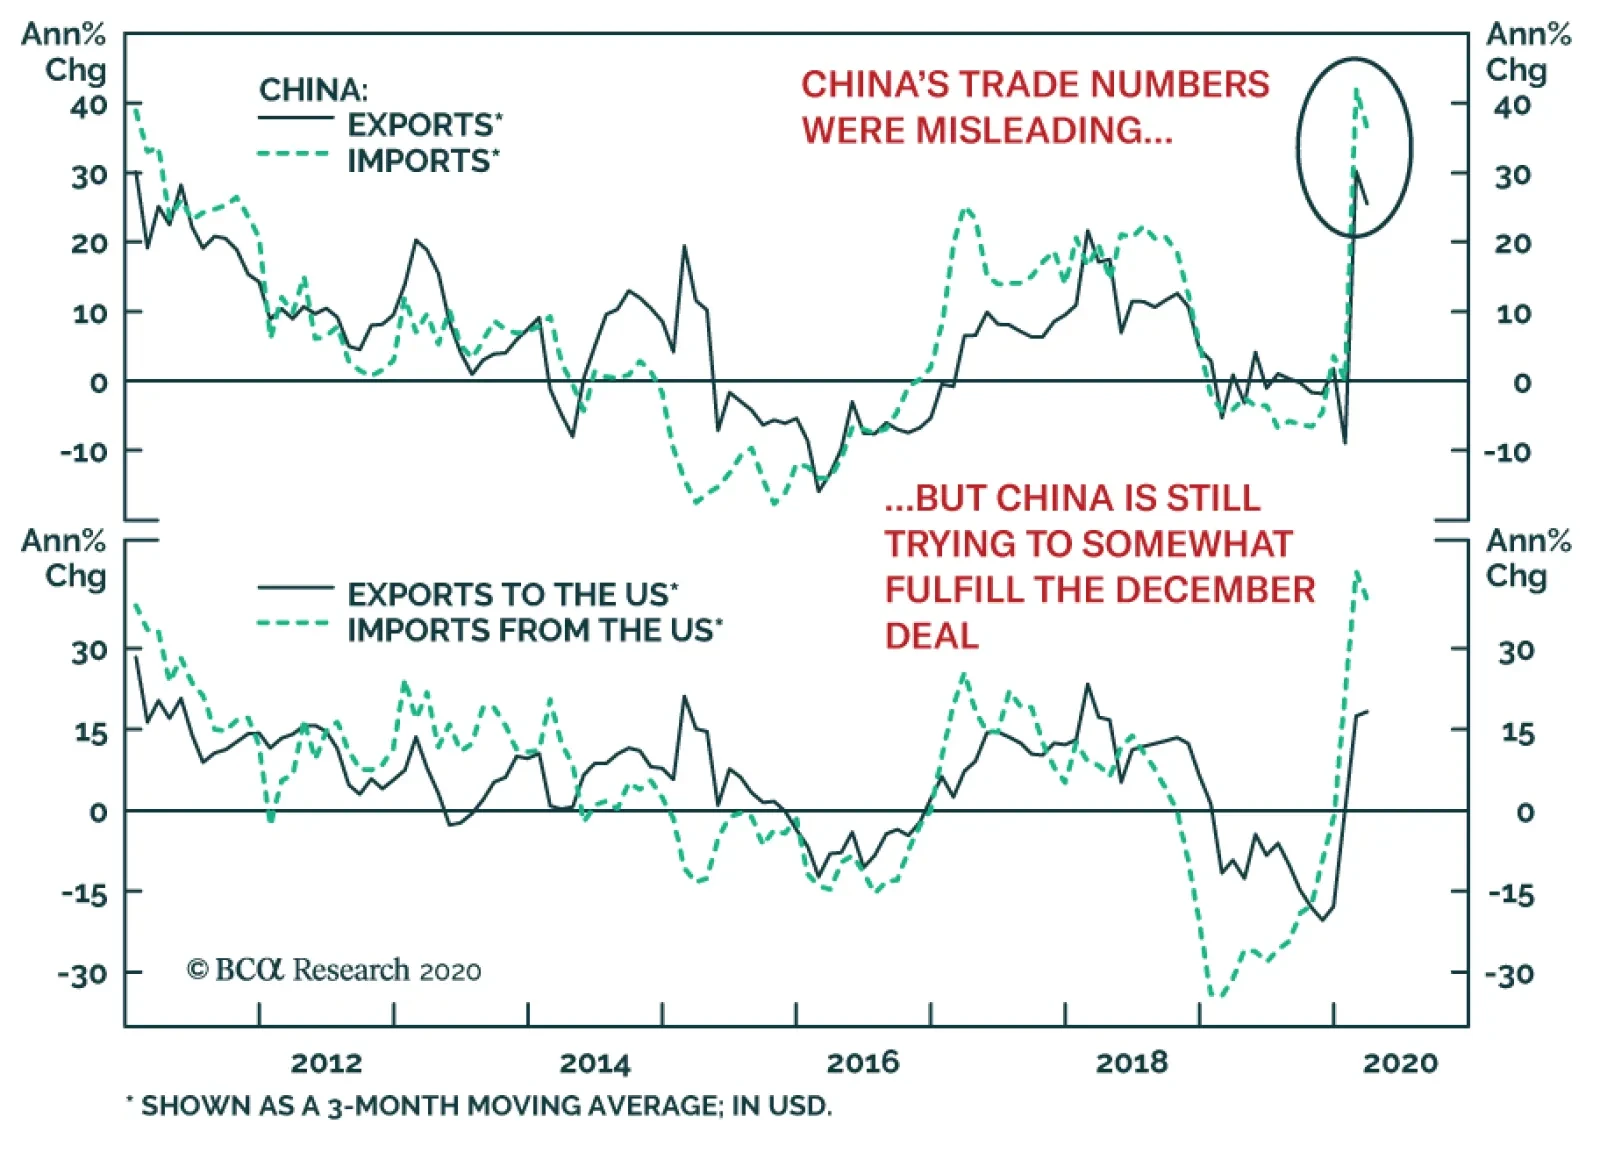
At first, China’s March trade numbers represented a positive surprise for the global economy. In USD terms, Chinese exports only contracted 6.6% on the year (versus expectations of -13.9%) and imports contracted by a mere 0.9% (versus an anticipated -9.8%). …
After the recent update to China’s credit and money numbers, it is clear that Beijing is working increasingly hard to support domestic activity, as the cut in the interest rate on excess reserves forewarned. In March, the country’s economy slowly…
Last Friday, BCA Research's Geopolitical Strategy service assessed that the risk of another major Sino-US clash has risen. As President Trump comes to realize he is losing his grip on power, he will have an incentive to retaliate against China for its…
Highlights The near-term is fraught with risk for US equities and global risk assets. Investors concerned over uncertainty, a slow recovery, and economic aftershocks must also guard against geopolitics. COVID-19 is not a victory for dictatorship over democracies. Democracies face voters and will ultimately improve government effectiveness. President Trump is likely to lose the US election. As this becomes increasingly likely, his policy will turn more aggressive, increasing geopolitical risks – particularly in US-China relations. Stay short CNY-USD. Stay long defense stocks. Feature Chart 1Another Downdraft Is Likely
Geopolitics Is The Next Shoe To Drop
Geopolitics Is The Next Shoe To Drop
US equity prices have risen 26% since their March 23 low point, but our review of systemic global crises suggests that a re-test of the bottom would not be surprising (Chart 1). A range of mitigating health policies – plus still-growing policy stimulus – will most likely prevent a depression. But a longer than expected economic trough, due to some persistent level of social distancing pre-vaccine, and negative second-order effects, such as emerging market crises, could trigger another wave of selling. Moreover we expect another shoe to drop: geopolitics. A Light At The End Of The Tunnel Governments are starting to get a handle on the COVID-19 pandemic. The number of daily new cases in the European Union, which is most clearly correlated with global equities, has subsided (Chart 2). Chart 2Any Setbacks Will Hit Equity Market Hard
Any Setbacks Will Hit Equity Market Hard
Any Setbacks Will Hit Equity Market Hard
The US is also seeing new cases crest. To be safe one should count on a subsidiary spike that could easily set back US equities after a notable stock market rally (Chart 2, second panel). But Europe has shown that social distancing works, which US investors will recognize. Italy’s Prime Minister Giuseppe Conte is expected to begin the gradual loosening of social controls to restart the economy. Since Italy is the hardest hit of the western nations (second only to Spain), its leaders will not relax lockdown measures unless they are sure they can do so safely (Chart 2, bottom panel). Still, if governments loosen controls too soon, they may have to tighten them again. Uncertainty will therefore persist regarding the pace of economic normalization, which is bound to be slow due to the fact that discretionary spending will remain suppressed, as it is today in China, and the special precautions that at-risk populations like the elderly will have to take. Economic stimulus measures are still growing in size. Japan’s stimulus, which we count at 16% of GDP, is smaller than the headline 20% but still very large. We have long argued that Japan was on the forefront of the move toward debt monetization among developed markets, but COVID-19 has accelerated the paradigm shift. The United Kingdom has now explicitly stated that the Bank of England will directly finance government debt. The Spanish government is proposing Universal Basic Income (UBI), which it hopes to make permanent, rather than merely for the duration of the pandemic. The jury is still out on whether the weak Pedro Sanchez government will be able to pass it but the current is in favor of “whatever it takes.” Italy’s Five Star Movement has long advocated universal basic income and is part of a ruling coalition that has received a wave of popular support to combat the crisis. At present only a more limited “income of emergency” is being legislated, in keeping with the more centrist Democratic Party, a coalition partner. But Italy’s devastation creates the impetus for bolder moves, either by this government or a subsequent government in 2021 or after. The European institutions are backstopping these states, at least for now, so any deeper disagreements about climbing down from stimulus will have to wait until the coming years. The EU itself is likely to announce additional fiscal measures, via the European Stability Mechanism, whose austerity requirements will be waived, and the European Investment Bank. We can see a token agreement on “coronabonds” (joint debt issuance by the Euro Area), but investors should not fixate on the eurobond debate. These would require a new mechanism, which is inexpedient, whereas the existing mechanisms are already sufficient to bankroll the huge deficit spending plans that the member states are already rolling out. The United States is negotiating an additional “phase four” package that could range between $500 billion and $2 trillion, meaning anywhere from 2.5% to 10% of GDP in new measures (Chart 3). Our estimate would err on the high side because it will largely consist of the same key elements as the “phase three” $2.3 trillion package: unemployment benefits and cash to households, plus a larger dollop for local governments than in the last package. Chart 3Fiscal Tsunami Is Still Building
Geopolitics Is The Next Shoe To Drop
Geopolitics Is The Next Shoe To Drop
Congress is scheduled to return to vote the week of April 20, but an early return is entirely possible if the pandemic worsens. If the infection curve is flattening, then Republican Senators may hold out longer in negotiations. Squabbling would cause temporary agitation in equity markets. The Democrats and the Republicans still have a mutual interest in spending profusely: the Republicans to try to salvage their seats through economic improvement by November; the Democrats to prove their election proposition that a larger role for government is necessary. Finally, China is preparing to announce more stimulus. So far Chinese measures amount to only 3% of GDP but this is insufficient given the weakness in China’s economic rebound thus far. The expansion in quasi-fiscal spending (government-controlled credit expansion) is an open question, but we would guesstimate a minimum of 3% of GDP. Dramatic measures should be expected because China is undergoing the first recessionary environment since the Cultural Revolution and President Xi Jinping risks a monumental economic destabilization if he hesitates to shore up aggregate demand, which would ultimately threaten single-party rule. We see little chance of him making this mistake. The problem is that animal spirits and external demand will remain weak regardless, an occasion for disappointments among bullish equity investors. Moreover US-China geopolitical risks are rising again, as discussed below. Our updated list of fiscal measures for 25 countries can be found in the Appendix. Bottom Line: The pandemic is peaking in the US and EU, while more stimulus is coming. This is positive for equity investors with a 12-month time frame but the near-term remains vulnerable to another selloff. Democracies Are Not Less Effective Than Dictatorships The pandemic has given rise to wildly misleading narratives in the financial community and mainstream media about the political ramifications for different nations. Getting these narratives right is important for one’s investment strategy. The most popular is that China “won” – is expanding its global influence – while the United States “lost” – is failing at global leadership. More broadly the authoritarian eastern model is said to be triumphing over the western democratic model. The real distinction among states is whether they were familiar with pandemics emanating from China, the unreliability of China’s transparency and communications, and the need to track and trace infections from the beginning. Thus South Korea, Taiwan, Singapore, Vietnam, and Japan have all had relatively benign experiences and all but Vietnam are democracies, with varying degrees of representation and contestation. Nor is COVID-19 an “eastern” versus “western” thing. Germany did an effective job testing, tracking, and tracing infections as well. Germans are relatively law-abiding and trust Chancellor Angela Merkel and the state governments to “do the right thing.” Canada, with its experience of SARS, has also reacted effectively. Denmark, Austria, and the Czech Republic are already tentatively reopening their economies. Yet the number of new confirmed cases per million people shows that Germany is not wildly different from the US and Italy (Chart 4). The truth is that Italy’s bad fortune alerted the US and G7 states to take the threat more seriously – the US has had good outcomes in Washington State but bad outcomes in highly populated New York. Nor is it true that the American health care system is uniquely terrible in treating patients, as is so widely claimed. US deaths per million are worse than Germany but better than Italy (Chart 5) – and Italy’s health system is also not to blame. Failure of ruling parties to spring into decisive action is the main differentiator. Chart 4US In Line With Italy In New Cases …
Geopolitics Is The Next Shoe To Drop
Geopolitics Is The Next Shoe To Drop
Chart 5… But Better In Limiting Deaths
Geopolitics Is The Next Shoe To Drop
Geopolitics Is The Next Shoe To Drop
Chart 6Dictatorships Good At Halting Freedoms
Geopolitics Is The Next Shoe To Drop
Geopolitics Is The Next Shoe To Drop
Dictatorships have had fewer cases and deaths, if their statistics can be trusted – which is a big if.1 This does not suggest that their governance model is better, but rather that they are better at halting freedoms, such as free movement (Chart 6). North Korea has zero cases of COVID-19. People were already under lockdown. Variation within the dictatorships stems from their policy responses and experience fighting pandemics. China, the origin of several recent outbreaks, has extensive experience. It also has a functional health system, fiscal resources, and a heavily centralized power structure. Iran, however, has less experience and capability. The question now is Russia, which was slow to react and has a growing outbreak, yet has a heavily centralized power structure to flatten the curve. Incidentally domestic risk is an important reason for Russia to cooperate with OPEC on oil production cuts, as we have argued. These points can be demonstrated by comparing COVID-19 deaths per million to each nation’s health capabilities and underlying vulnerability to the disease. Note that our intention is to highlight the role of policy in outcomes, not to attempt a full explanation of an epidemiological phenomenon. In Chart 7A, we judge health capacity by health spending per head and life expectancy at the age of 60. Nations that spend a lot per person, and whose people live longer, have better health systems. Yet many of these states are seeing the highest number of deaths because they are European and Europe was the epicenter of the outbreak. Chart 7ARich, Healthy Countries Got Hit Hardest Because Unprepared
Geopolitics Is The Next Shoe To Drop
Geopolitics Is The Next Shoe To Drop
The US ranks right along with Germany and Sweden.2 Policy responses – early testing, tracking, and tracing – explain why South Korea has far fewer deaths than Italy and Spain on a population-weighted basis. However, the underlying conditions still matter, as the US’s health system, travel bans, and distance from the crisis produced better outcomes than its other policy responses would have implied. These data will be more accurate once the infection curve has flattened across the world. The situation is changing rapidly. If the US rises up in deaths per capita, it will be because of its slow responses, or subsequent policies. The same goes for emerging market economies that are ranking low in deaths but either have not seen the full effect of the pandemic, or had more time to adjust policy due to the crisis in Europe. Emerging market economies have lower health capacity, but also younger and hence healthier populations. The older the society, and the higher proportion of severe illnesses like heart and lung disease, the more susceptible to COVID-19 deaths, as Chart 7B shows. But yet again, the policy response still proves decisive. China has more deaths than some countries that are more vulnerable, because it got hit first. If Brazil and Turkey rise higher and higher above China in deaths, as is likely, it is because of policy failure, not basic vulnerability. Chart 7BEurope And US: Vulnerable Populations, Governments Slow To React
Geopolitics Is The Next Shoe To Drop
Geopolitics Is The Next Shoe To Drop
Russia stands out as especially vulnerable in this Chart 7B. Here is where authoritarian measures may pay off, as with China, but only in the short term – since Russia will still be left with an elderly population highly prone to severe illness and a creaking health system. As mentioned above, the risk to Russian stability is a factor pushing for geopolitical cooperation in oil market cartel behavior to push prices up and improve the fiscal outlook to enable better domestic stability management. Bottom Line: Government policy, particularly preparedness and rapid action, have been the decisive factors in containing COVID-19, not dictatorial or democratic government types. The richest countries have the most freedoms and the most vulnerable elderly demographics. Within the rich countries, southern Europe reacted slowly and got hit hardest, with some exceptions. The US’s incompetence has been overrated, based on deaths, probably because of President Trump’s general unpopularity. These results are preliminary but they suggest that the US and EU will experience political change to address their lack of rapid action. Non-democracies will still have to deal with the recession and the consequences on social stability. Democracies Face Voter Blowback Democracies will face the wrath of voters once the immediate crisis dies down. The crisis has driven people to rally around the flag, creating polling bounces for national leaders and ruling parties. In some cases the trough-to-peak increase in popular support is remarkable – President Trump's approval reached 10 percentage points briefly, and he rose over 50% approval in some polls for the first time in his presidency (Chart 8A). Yet these initial bounces are already subsiding, as in Trump’s case (Chart 8B). Chart 8ADemocracies Are Accountable To Voters
Geopolitics Is The Next Shoe To Drop
Geopolitics Is The Next Shoe To Drop
Chart 8BAnd Polling Bounces Are Fading
Geopolitics Is The Next Shoe To Drop
Geopolitics Is The Next Shoe To Drop
By this measure, the US, Italy, France, and Spain all face serious political reckonings going forward. Trump is the first in the firing line. Our quantitative election model relies on state-level leading economic indicators that are lagging and show him still winning with 273 Electoral College votes (Chart 9A). However, if we introduce a 2008-magnitude economic shock to these indexes, the Democrats flip Michigan, Wisconsin, Pennsylvania, and New Hampshire, yielding 334 Electoral College votes for former Vice President Joe Biden (Chart 9B). This is assuming Trump’s approval rating stays the same, which, at 46%, is strong relative to the whole term in office. Chart 9AOur Quant Election Model Will Turn Against Trump When Data Catches Up
Geopolitics Is The Next Shoe To Drop
Geopolitics Is The Next Shoe To Drop
Chart 9BA 2008-Style Shock To States Gives Democrats The White House
Geopolitics Is The Next Shoe To Drop
Geopolitics Is The Next Shoe To Drop
Our qualitative judgement reinforces our election model. Historically, US elections are referendums on the ruling party. An incumbent president helps the party win reelection. But a recession is usually insurmountable. George Bush Sr lost in 1992 despite a shallow recession that ended the year before. While Joe Biden is a flawed candidate in numerous ways, the question voters face in November is whether they are better off than they were four years ago. With thousands of deaths and an unemployment rate at or above 20%, it is hard to see swing state voters answering “yes.” Not impossible, but we subjectively put the odds at 35%, and that could easily be revised downward if Trump’s polling falls back down to the 42% range. Trump will also be responsible for the handling of the pandemic itself. His administration obviously made several policy mistakes. A paper trail will highlight intelligence warnings as early as November, and warnings from his inner circle as early as January, that will hurt him.3 Objectively, the Republican Party’s greatest policy flaw, prior to COVID-19, was health care – and this will connect with COVID-19 even if the Affordable Care Act (Obamacare) has little to do with crisis response. Bottom Line: The first and most important political casualty of the pandemic will be Trump’s presidency. Not because the US is uniquely incompetent in the face of the pandemic – although it obviously could have done better, judging by several of the other democracies – but because this year happens to be an election year and democracies hold governments accountable. Major Risk Of Clash With China Chart 10China Likely To Depreciate The Renminbi
China Likely To Depreciate The Renminbi
China Likely To Depreciate The Renminbi
There are two downside geopolitical risks that follow directly from the above. First, while the Democratic candidate Joe Biden is a “centrist,” his position will move to the left of the political spectrum. This is to energize the progressive faction of the party – which is already energized. The market will be taken aback if Biden produces major leftward shifts, in the direction of Senator Bernie Sanders, on taxes, regulation, health care, pharmaceuticals, banks, energy, or tech. This is not a problem when the market is down 36%, but as the market rallies, it becomes more relevant. While US taxes and regulation will go up, Biden will still have to win over the Midwestern Rust Belt voter through trade protectionism, a la Trump and Bernie. This will be exacerbated by the pandemic, which has supercharged American popular enmity toward China and fear of supply chain vulnerability toward China. When Biden reveals that he is protectionist too, US equities will react negatively. Second, more immediately, the clash with China may happen much sooner. As President Trump comes to realize he is losing his grip on power, he will have an incentive to retaliate against China for its mishandling of the pandemic, shift the blame, and achieve long-term strategic objectives as well. This makes Trump’s approval rating a critical indicator – not only of his reelection odds, but of whether he determines he has lost and therefore adopts more belligerent foreign or trade policy. We view the danger zone as anything less than 43%. If Trump becomes a lame duck, he could target China, or other countries, such as Venezuela. The advantage of the latter is that it could have the desired political effect without threatening the economic restart. A conflict with Iran would have bigger consequences – particularly negative for Europe. But in the COVID-19 context, Venezuela and Iran are not relevant to American voters. A conflict with North Korea, however, is part of the strategic conflict with China and would be hard to keep separate from broader tensions. This is only likely if Kim Jong Un stages a major provocation. At present, Washington and Beijing are keeping a lid on tensions. Presidents Trump and Xi are in communication. Beijing has rebuked the foreign minister who accused the US military of bringing COVID-19 to Wuhan. Trump has stopped using inflammatory rhetoric about the “Chinese virus.” China is not depreciating the renminbi, it is upholding other aspects of the trade deal, and it is sending face masks and ventilators to assist the US with the health crisis. But this could change. With its economy under extreme pressure, Beijing must take greater moves to stimulate. An obvious victim will be the renminbi, which is arguably stronger than it should be, especially if China cuts interest rates further, no doubt in great part because of the “phase one” trade deal with the United States (Chart 10). If and when Beijing decides that it must ease the downward pressure on exports and the economy, the renminbi will slide. This will provoke Trump. If he is convinced he cannot salvage the economy anyway, then he has an incentive to channel American anger toward China into new punitive measures over currency manipulation. Finally, the ingredients for our “Taiwan black swan” scenario are falling into place. Taiwan has long attempted to gain representation in the World Health Organization but has been blocked by Beijing’s assertion of the One China principle. However, Taiwan is now caught in an escalating tussle with the WHO leadership that involves both Washington and Beijing. Taipei warned the WHO as early as December that COVID-19 could be transmitted by humans and that the pandemic risk was high.4 Both China and the WHO leadership are simultaneously under pressure from the Trump administration for failing to share information and sound the alarm to prepare other nations. Bottom Line: If President Trump decides to prosecute China for its handling of the virus, and/or promote US-Taiwan relations in a way that aggravates China, then the trigger for a major geopolitical incident will have arrived. Investment Implications It is impossible to predict the precise catalyst or timing of such a crisis. We observe that the US and China are each experiencing historic economic dislocation, their strategic relationship has broken down over the past decade, and their populations are incensed at each other over grievances relating to the trade war, COVID-19, and various disinformation campaigns. Taiwan is at the epicenter of this conflict, due to its defense relationship with the United States and renewed political tensions with China under Xi Jinping. But the Chinese tech sector, North Korea, the South and East China Seas, Xinjiang, and Iran are also potential catalysts. Geopolitics is the other shoe to drop in the wake of COVID-19. Presidents Trump and Xi Jinping are the biggest sources of geopolitical risk, as we outlined in our 2020 forecast. They are cooperating in the immediate crisis, but in the aftermath there will be recriminations. A worsening domestic situation, a loss of prestige for either leader, or a foreign policy provocation could trigger punitive measures, saber rattling, or even military incidents. Risk assets are rallying on the light at the end of the tunnel. We are reaching and in some countries passing the peak intensity of the (first wave of the) pandemic. But the economic aftermath is extremely uncertain and the political fallout has hardly begun. In the US, the implication is clearly negative for Trump. But if that implication is realized, it points to much higher geopolitical risks within 2020 than are currently being considered as the world focuses on the virus. If President Trump chooses to wag the dog with Venezuela, that is obviously a much more positive outcome for global risk assets than if he attempts to achieve American strategic objectives of curbing China’s global assertiveness. Tactically, we remain defensive and recommend defensive US equity sectors and the Japanese yen. On a 12-month and beyond time frame we are more bullish on global growth and are long gold and oil. We remain strategically short CNY-USD and short Taiwanese equities relative to Korean. Matt Gertken Vice President Geopolitical Strategist mattg@bcaresearch.com Appendix Appendix TableThe Global Fiscal Stimulus Response To COVID-19
Geopolitics Is The Next Shoe To Drop
Geopolitics Is The Next Shoe To Drop
Footnotes 1 Given that one of Iran’s top health officials has criticized China for its questionable data and lack of transparency, one does not need to trust the US Intelligence Community’s assessment that China misled the world in the early days of the outbreak. See Matthew Petti, "Even Iran Doesn't Believe China's Coronavirus Stats," April 6, 2020. 2 Readers accustomed to the apocalyptic view of the US health system may wonder that the US comes out looking very well on health capacity. This is because we combine and standardize the scores for per capita spending and longevity. However our data also show that the US is inefficient on health: its life expectancy scores are slightly lower than those of the Europeans, yet it spends more per head. 3 See Josh Margolin and James Gordon Meek, "Intelligence report warned of coronavirus crisis as early as November: Sources," ABC News, April 8, 2020, and Maggie Haberman, "Trade Adviser Warned White House in January of Risks of a Pandemic," New York Times, April 6, 2020. 4 See "Taiwan says WHO failed to act on coronavirus transmission warning," Financial Times, March 19, 2020.
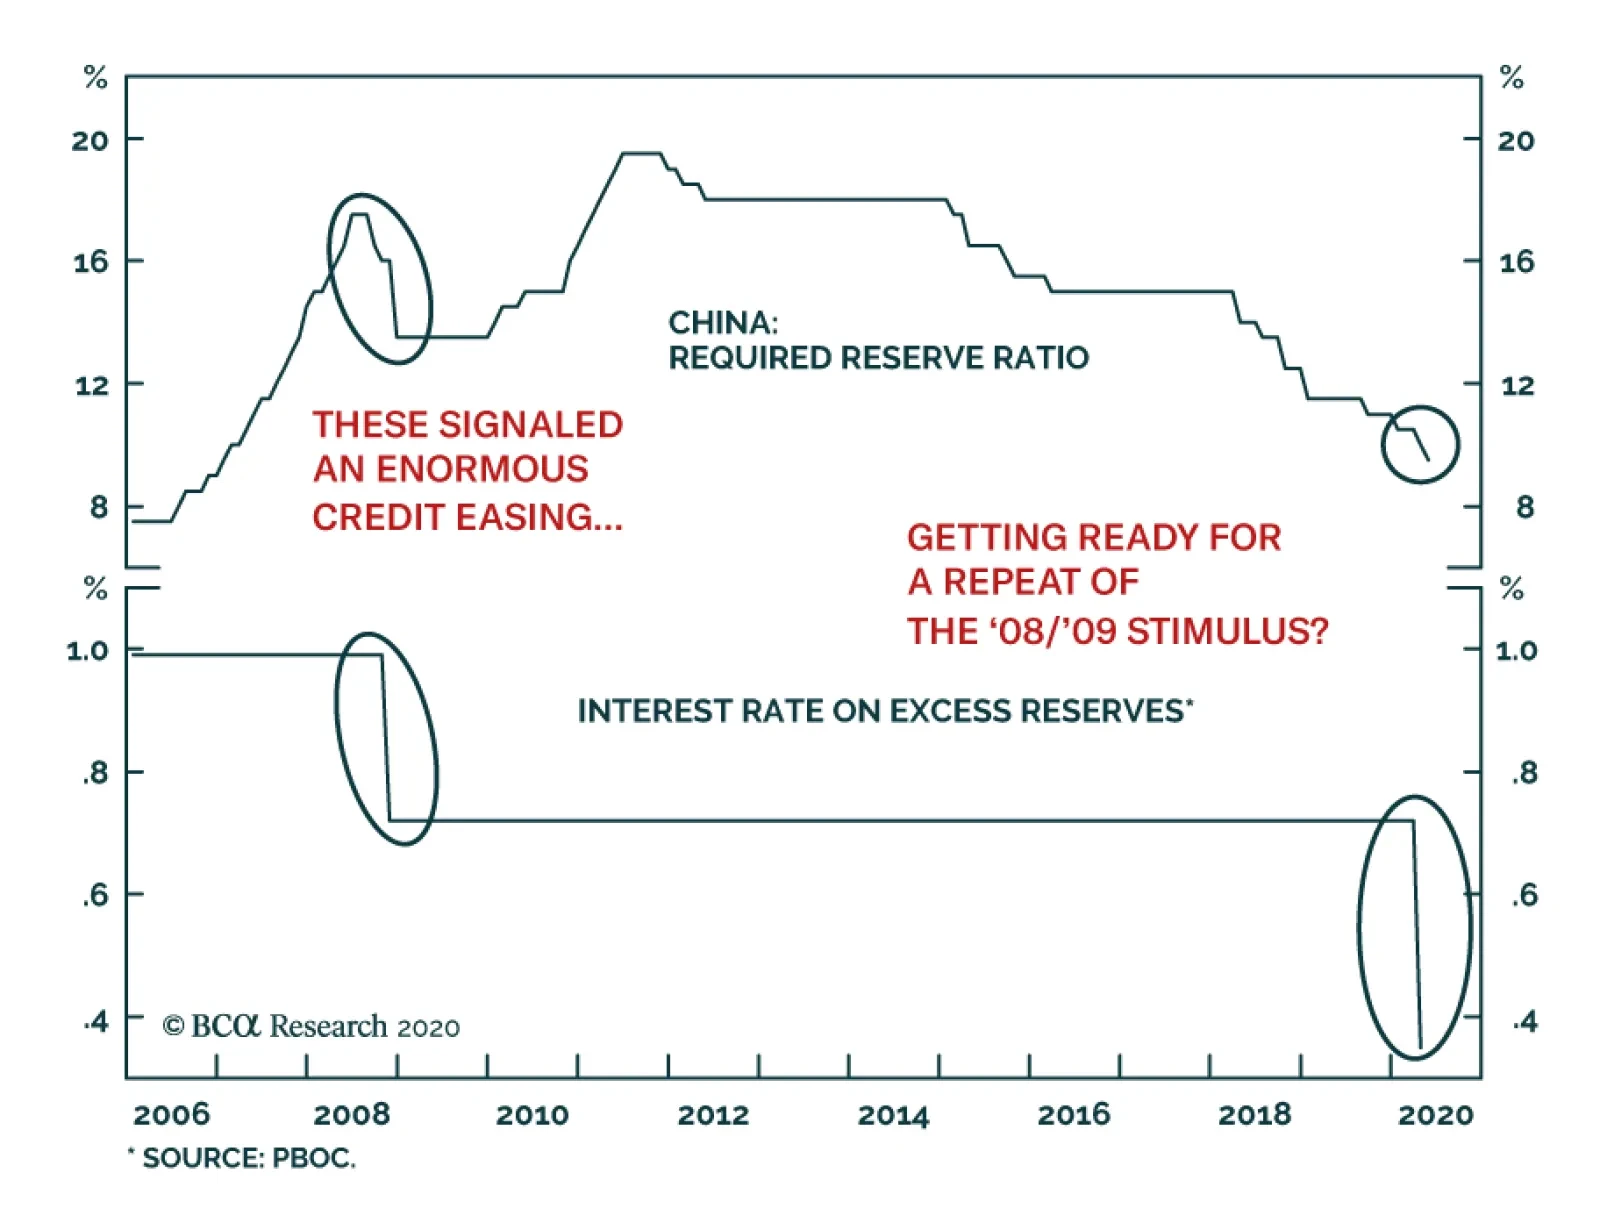
Despite the magnitude of the COVID-19 crisis, China’s stimulus has so far been tepid. However, this will soon change. Chinese policymakers are sending two clear signals that they will aggressively reflate their economy. They have pushed down the reserve…
Dear Client, Next week, we will send you a special report published by our Geopolitical Strategy service, authored by my colleague Roukaya Ibrahim. Roukaya will provide her insights on the global shortages of medical equipment as well as the risk of food shortages. A significant portion of the special report focuses on China. We trust you will find her report very useful. Additionally, I will be having three webcasts next week, discussing the economic and financial implications of the COVID-19 pandemic on China. The webcasts will be in both English and Mandarin. Please check out the dates and time on our website. Best regards, Jing Sima China Strategist Highlights China’s official and Caixin manufacturing PMIs in March were weak at best. The indexes underscore that a quick recovery of Chinese and global economic growth is unlikely. A recent re-lockdown of a Chinese county, along with tightened containment measures in other key Asian economies, illustrates the risk of a second wave of infections and a precarious economic “return to normalcy”. Further policy supports announced in the past week suggest that Chinese authorities may be willing to match the size of stimulus from other major economies. In the next three months, risks to Chinese stock prices are still elevated barring a peak in the global pandemic. We maintain a neutral position in both Chinese investable and domestic stocks. Feature Global financial markets are unlikely to sustainably move higher in an environment where it is uncertain whether the COVID-19 virus is abating and business activities can start resuming (Chart 1). China’s economy and stock prices are not insulated from a deep global recession. Price volatility will remain high in Chinese stocks in the next three months and, therefore, we maintain a neutral position in Chinese investable and domestic stocks. Chart 1Close To A Peak In New Cases?
China Macro And Market Review
China Macro And Market Review
In financial markets, cyclical stocks have underperformed defensives since early March. In particular, information technology, materials, industrials and consumer discretionary, all have underperformed the broad market. This reflects a delayed recovery in China’s economic fundamentals. Tables 1 and 2 highlight key developments in China’s economic and financial market performance in the past month. On the growth front, both the official and Caixin PMIs rebounded to above the 50% boom-bust threshold from historic lows in February. However, the indexes suggest that headwinds to China’s economic recovery are not yet subsiding. Table 1China Macro Data Summary
China Macro And Market Review
China Macro And Market Review
Table 2China Financial Market Performance Summary
China Macro And Market Review
China Macro And Market Review
Chart 2Supply Shock Meets A Collapse In Demand
Supply Shock Meets A Collapse In Demand
Supply Shock Meets A Collapse In Demand
The methodology in calculating PMI indexes reflects the net reported improvement in activity relative to the previous month; a reading of 50 represents no month-over-month change. As such, a 52 reading in March’s official PMI suggests that manufacturing activity in China barely ticked up over February. This is concerning given the extremely depressed level of manufacturing activity in February (Chart 2). Furthermore, two important subcomponents of the PMI remained in contractionary territory even after February’s plunge. While the new orders subcomponent modestly improved in line with the overall index, new export orders and the imports index continued to contract (Chart 2, middle panel). The latter is particularly important for investors who focus on global growth because a modest improvement in Chinese domestic demand that does not translate into import growth is of limited benefit to China's trade partners and global economic activity. In our view, China's March PMI reflects a return to normalcy for the supply side, but it also indicates that domestic demand remains very weak (Chart 2, bottom panel). This is a discouraging result. While March’s economic data in the developed world will likely be uniformly negative, China’s weak PMI readings suggest that its economy may have been impacted by “second-round effects”. This aspect is an ominous sign for developed economies, particularly the US, where the number of new cases continues to escalate. A second wave of infections in China and other Asian nations also underlines the fragility of the rebound, both on the social and economic fronts. Although the pandemic in Asia was largely contained domestically by early March, there is now an increasing number of both imported and domestically transmitted cases. China recently locked down a county of about 600,000 residents and Singapore closed schools and workplaces last week due to a re-emergence of domestic cases.1 There are some encouraging signs in China’s housing market. The monthly real estate sector indicators in Table 1 show the severe impact of the pandemic on China’s property market in the first two months of the year. However, the seasonally adjusted daily data indicate that home sales in China’s 30 large- and medium-sized cities steadily picked up in March (Chart 3). By the end of March, the amount of floor space sold in those cities surpassed the same period of the previous year. A return to normal in housing demand and activity will be crucial for easing property developers’ cash constraints and a recovery in China’s construction sector. On the policy response front, monetary and fiscal stimulus measures continue to roll out. The PBoC chopped its 7-day reverse repo rate by 20bps on March 30, which was the third rate cut in 5 months. It helped to push the 3-month interbank repo rate back to its early-2010 low. We noted in a previous report2 that the 3-month repo rate is China's de facto short-term policy rate and that changes in the rate are strongly linked to average lending rates in the economy (Chart 4). A lowering in the repo rate will help to ease financial conditions and support an eventual rebound in China’s economic activity. Chart 3Signs Of A Gradual Revival In The Housing Market
China Macro And Market Review
China Macro And Market Review
Chart 4Lending Rates Bound To Drop Further
Lending Rates Bound To Drop Further
Lending Rates Bound To Drop Further
Further monetary and fiscal stimulus are also pending. The timing and magnitude of these measures suggest that Chinese policymakers may be willing to step up their efforts to match the size of stimulus from other major economies, such as the US.3 If so, it will support our cyclical (i.e. 6-12 months) overweight investment call on Chinese stocks relative to global benchmarks, even though we believe that the short-term risks to Chinese stock prices are still quite elevated. The PBoC adjusted down the interest rate on financial institutions’ central bank excess reserves from 0.72% to 0.35%, effective April 7. The move is significant: the last time that the PBoC reduced the excess reserve rate was in November 2008 during the global financial crisis. The excess reserve rate drop of 0.37% is also larger than the 0.27% dip in 2008. The cut in excess reserves will free up more liquidity for commercial banks and encourage them to lend to businesses. More importantly, the decrease will lower the floor of PBoC’s “interest rate corridor” and pave the way for further reduction in the MLF (the ceiling of the corridor), LPR, and even the benchmark deposit rate which has remained unchanged for the past five years (Chart 5). Last week’s Politburo meeting approved an increase in this year’s quota of local government special purpose bonds (SPBs) along with a bigger fiscal deficit, and the issuance of special treasury bonds (first time since 2007). We believe the fiscal support will help facilitate double-digit growth in infrastructure spending this year. The exact quantity of the SPB quota will be approved at the upcoming National People’s Congress (NPC), but we think the quota will be close to 4 trillion yuan. This amount, which is equivalent of 4% of China’s GDP, will almost double the 2.15 trillion yuan SPBs issued in 2019. Chart 5Lowering The Floor Opens The Door
Lowering The Floor Opens The Door
Lowering The Floor Opens The Door
Chinese stocks have lost more than 10% of their value year-to-date. In addition, cyclical stocks have underperformed defensives in the past month (Chart 6). We noted in our October 30 Special Report4 that historically these cyclical sectors have been positively correlated with pro-cyclical macroeconomic and equity market variables. Therefore, a return to outperformance in both the aggregate Chinese stocks and cyclical sectors will likely require strong evidence of an upturn in China’s business cycle. Chart 6Cyclicals Vs. Defensives Performance Has Reversed Course
Cyclicals Vs. Defensives Performance Has Reversed Course
Cyclicals Vs. Defensives Performance Has Reversed Course
Chart 7RMB Depreciated Due To A Dollar Rally...
RMB Depreciated Due To A Dollar Rally...
RMB Depreciated Due To A Dollar Rally...
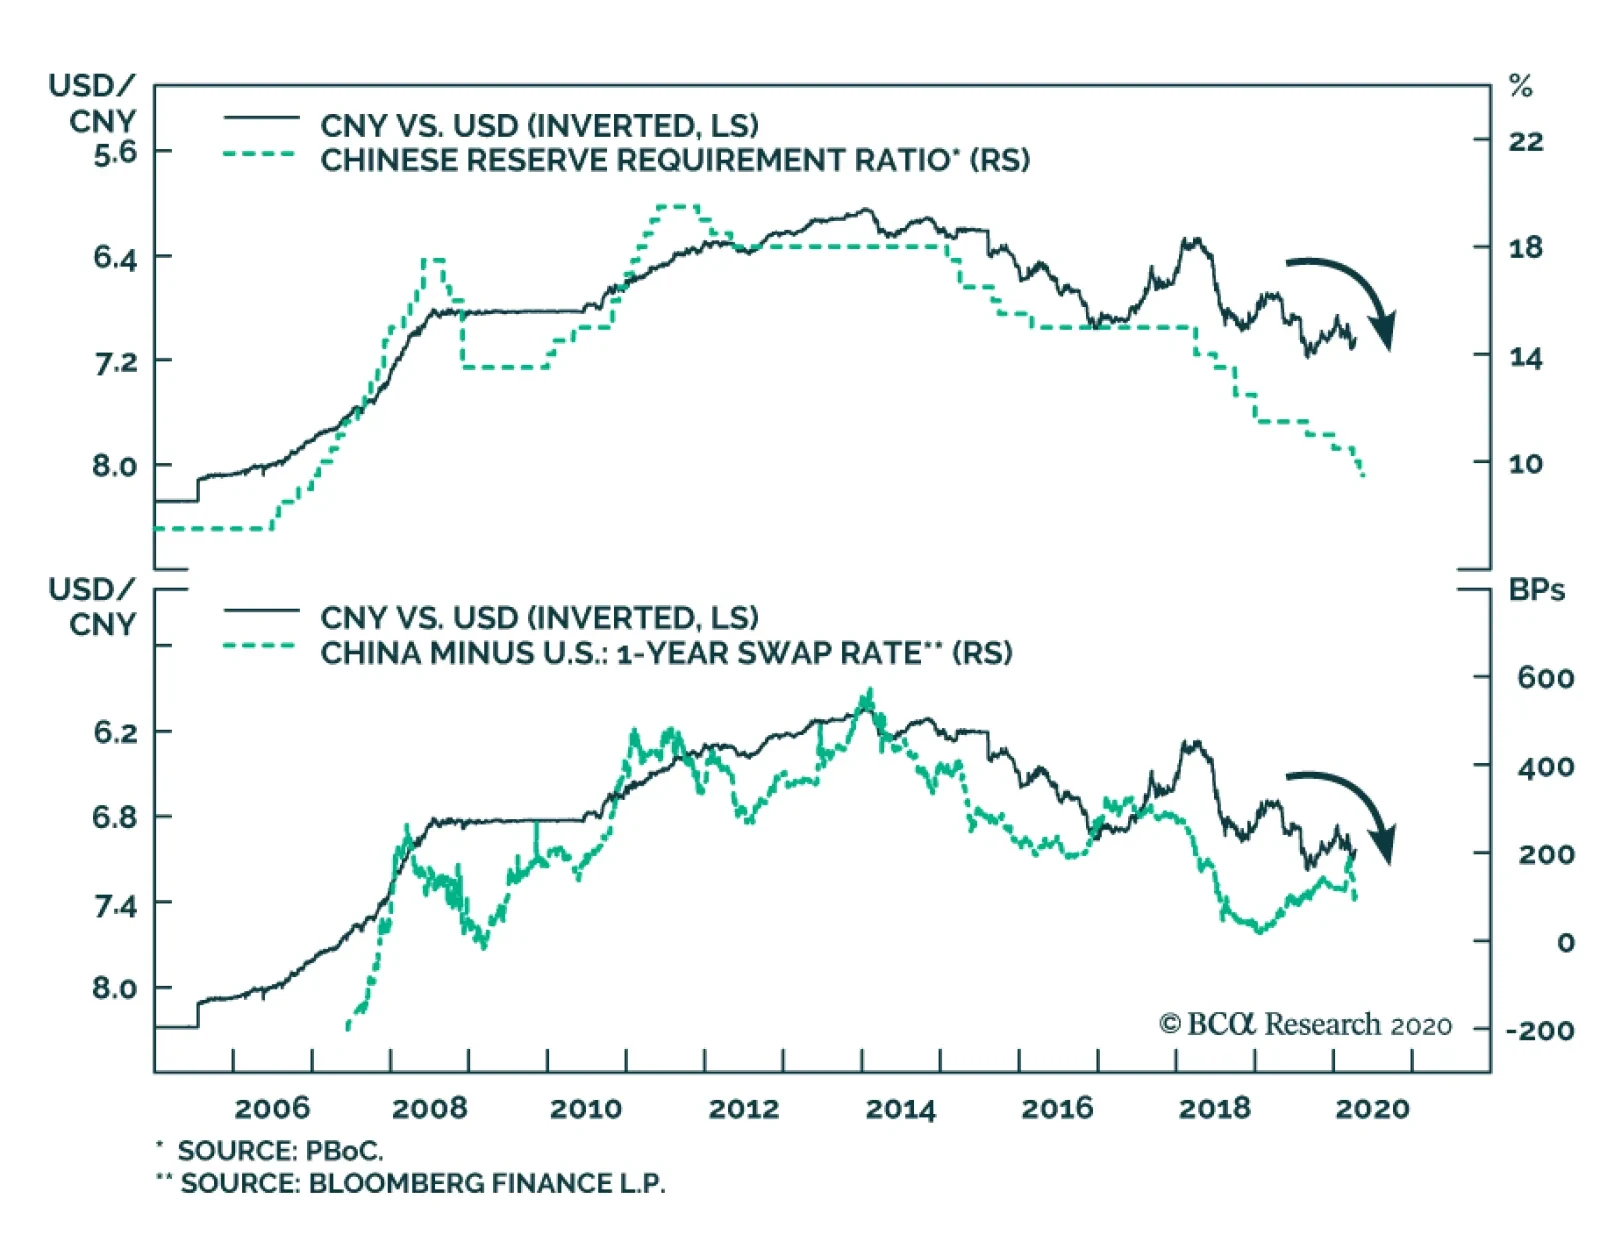
The recent devaluation in the RMB against the USD is linked to the dollar’s strength. In the near term, the downward pressure on the RMB against the greenback will persist because the dollar will strengthen from signs that the global economy is entering a more protracted slowdown5 (Chart 7). We think it is unlikely that the PBoC will intervene in the exchange rate market to prop up the RMB; the weakness in the RMB has been benign and limited compared with a collapse in EM currencies (Chart 8). A strong RMB does not bode well either for China’s export price competitiveness or corporate profits (Chart 9). As such, we think that the PBoC will allow the RMB’s value to remain weak against the dollar. The ongoing race-to-the-bottom in interest rates and competitive currency devaluations have indeed provided a window for the PBoC to cut interest rates even more. Chart 8...But Appreciated Against EM Currencies
...But Appreciated Against EM Currencies
...But Appreciated Against EM Currencies
Chart 9A Strong RMB Is Not Desired In The Current Environment
A Strong RMB Is Not Desired In The Current Environment
A Strong RMB Is Not Desired In The Current Environment
Qingyun Xu, CFA Senior Analyst qingyunx@bcaresearch.com Jing Sima China Strategist jings@bcaresearch.com Footnotes 1 https://www.bloomberg.com/news/articles/2020-04-02/chinese-county-back-under-lockdown-after-infection-re-emerges?mc_cid=e33ef3872b&mc_eid=9da16a4859 https://www.scmp.com/week-asia/health-environment/article/3078297/singapore-close-schools-most-workplaces-next-week 2Please see China Investment Strategy Special Report "How To Analyze And Position Towards Chinese Government Bonds," dated January 29, 2020, available at cis.bcaresearch.com 3China has deployed bank re-lending programs and supplementary funds totaling about 1.5% of its 2019 GDP. A 4 trillion yuan local government SPBs will add more than 4% of GDP in fiscal spending. Fiscal deficit is likely to be augmented by 2% of GDP, and the issuance of special treasury bonds and local government general purpose bonds should amount to more than 2% of GDP. 4Please see China Investment Strategy Special Report "A Guide To Chinese Investable Equity Sector Performance," dated October 30, 2019, available at cis.bcaresearch.com 5Please see Foreign Exchange Strategy Weekly Report "Which Are The Most Attractive G10 Currencies?" dated March 27, 2020, available at fes.bcaresearch.com Cyclical Investment Stance Equity Sector Recommendations