China
Yesterday, BCA Research's Emerging Markets Strategy service's analysis concluded that increased special bond issuance, loosening public-private-partnerships (PPP) restrictions, and possible Pledged Supplementary Lending (PSL) injections should enable local…

Highlights China’s capital spending is likely to gradually recover in the second half of 2020. We project 6-8% growth in Chinese traditional infrastructure investment and a 30-50% increase in tech-related infrastructure investment by the end of 2020. There will not be much stimulus to boost housing demand. Commodities and related global equity sectors as well as global industrial stocks are approaching buy territory in absolute terms. Semiconductor stocks are attractive on a 12-month time horizon but still face near-term risks. Chinese property developer stocks remain at risk. Feature Chart I-1Chinese Growth Is Worse Now Than In 2008
Chinese Growth Is Worse Now Than In 2008
Chinese Growth Is Worse Now Than In 2008
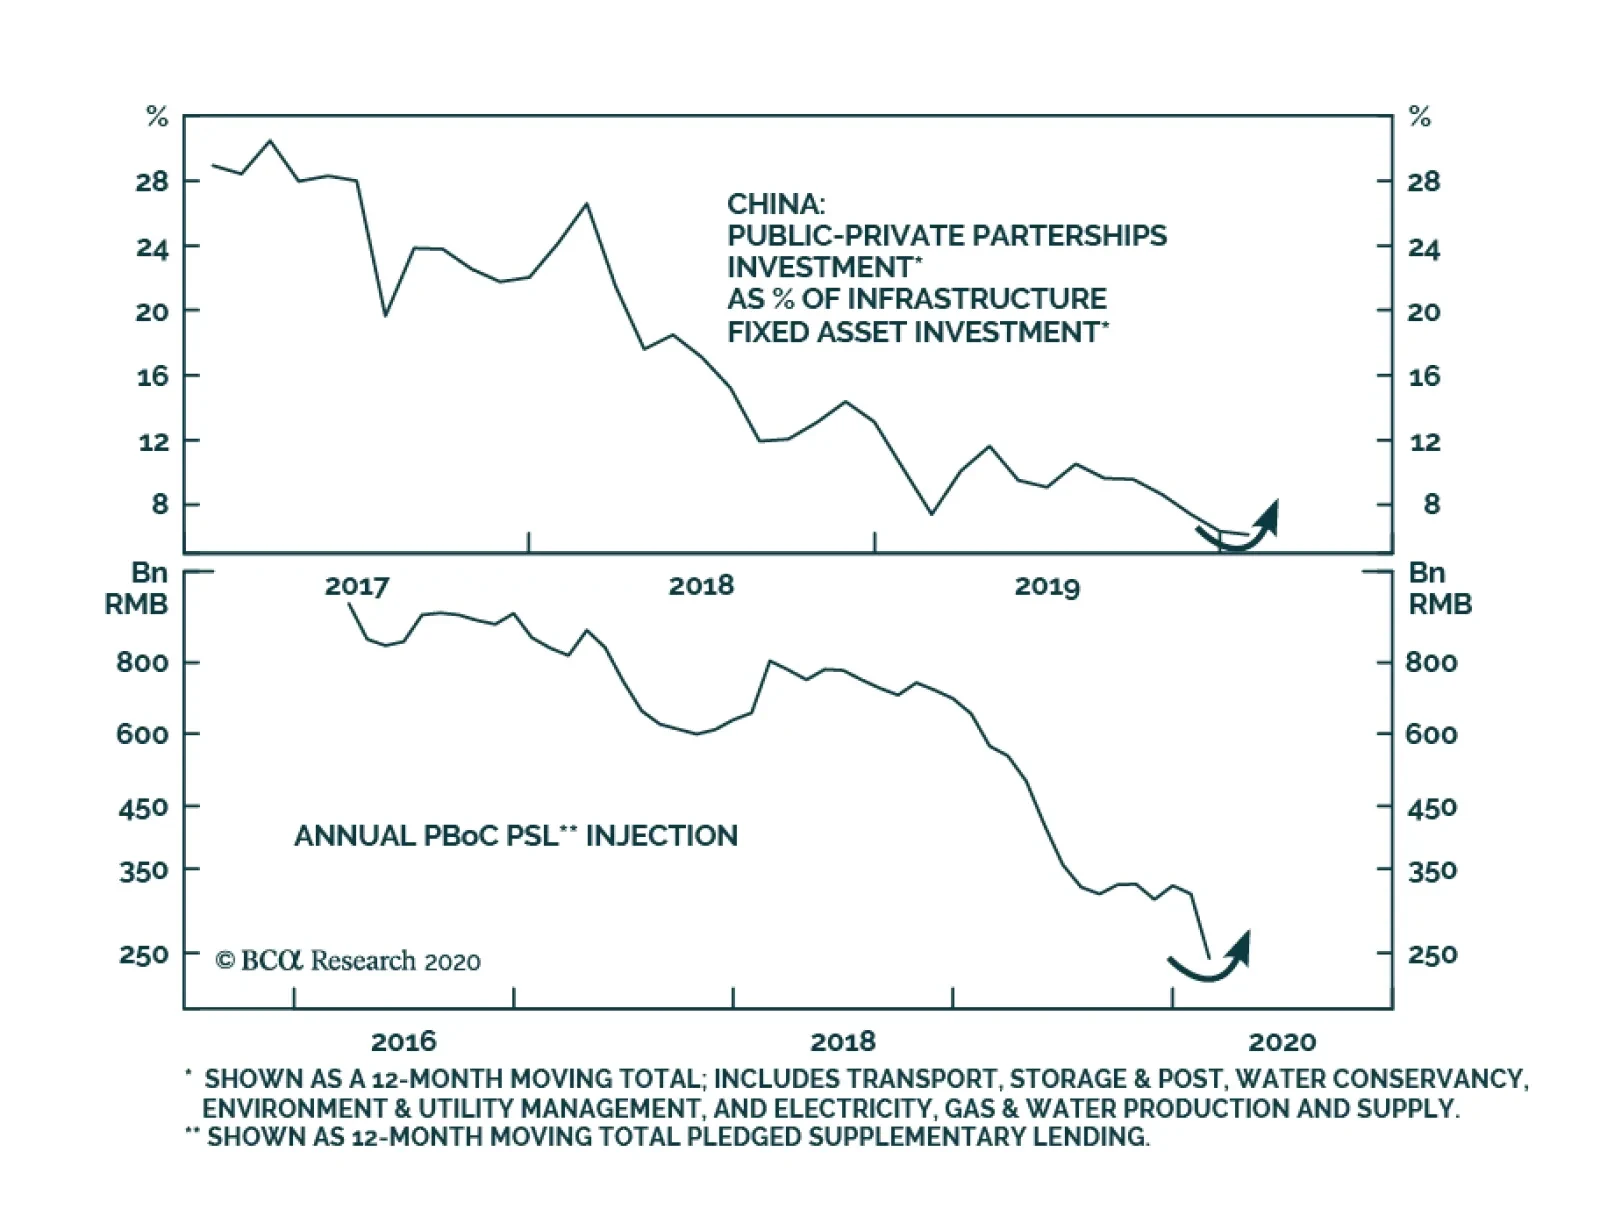
Lockdowns during the Covid-19 outbreak have already caused much larger and more widespread damage to the Chinese economy than what occurred both in 2008 and in 2015 (Chart 1). Even though the spread of Covid-19 looks to be largely under control, China’s domestic economy is only in gradual recovery mode, and Chinese authorities are preparing to inject more stimulus to reinvigorate growth. The important questions are where and how large the stimulus will likely be. Infrastructure development will be the major focus this year, including both traditional and tech-related infrastructure. The former includes three categories: (1) Transport, Storage and Postal Services, (2) Water Conservancy, Environment & Utility Management, and (3) Electricity, Gas and Water Production and Supply. The latter encompasses Information Transmission, Software and Information Technology Services, such as 5G networks, industrial internet, and data centers. The current emphasis of stimulus differs from the 2009 one which was more broad-based and spanned across not only infrastructure but also the property and auto sectors. It also differs from the 2016 stimulus measures, which had a heavy emphasis on the property market. Overall, the scale of combined traditional infrastructure and property market stimulus in 2020 will be smaller than what was put forward in 2009, 2012 and 2015-‘16. We estimate Chinese traditional infrastructure investment will increase by about RMB1 trillion to RMB1.5 trillion (6-8% year-on-year), while tech-related new infrastructure investment will be boosted by RMB 240 billion to RMB400 billion (30-50% year-on-year) (Chart 2). Together, the infrastructure stimulus will be about RMB1.3 trillion to 1.9 trillion, amounting to 3.2-4.5% of nominal gross fixed capital formation (GFCF) and 1.3-1.9% of nominal GDP (Table 1). The Chinese property market is unlikely to receive much stimulus on the demand side this time as, “houses are for living in, not for speculation,” will remain the main policy mantra. That said, there will be some support for developers, helping somewhat ease extremely tight financing conditions. Chart 2Chinese Infrastructure Investment: A Boost Ahead
Chinese Infrastructure Investment: A Boost Ahead
Chinese Infrastructure Investment: A Boost Ahead
Table 1Projections Of Traditional And Tech Infrastructure Investment In 2020
Chinese Economic Stimulus: How Much For Infrastructure And The Property Market?
Chinese Economic Stimulus: How Much For Infrastructure And The Property Market?
Restarting The Infrastructure Engine Tech Infrastructure: The authorities recently repeatedly emphasized the importance of “new infrastructure”1 development. This includes 5G networks, the industrial internet, inter-city transit systems, vehicle charging stations, and data centers. Strategic investment in indigenously produced leading technologies, the ongoing geopolitical confrontation with the US and the need to boost growth are behind the government’s aim for an acceleration in “new infrastructure” investment this year. China will significantly boost the pace of its strategic 5G network deployment as well as other tech-related investment. The growth of total tech infrastructure investment was 30-40% during the 4G-network development ramp-up in 2014. As the 5G network is much more costly to build than 4G, we expect growth within tech infrastructure investment to be 30-50% this year. This translates to an increase of RMB 240 billion to RMB400 billion in tech infrastructure investment in 2020, equaling around 0.2% to 0.4% of the country’s 2019 GDP (Table 1 on page 3). Chart 3Components Of Traditional Infrastructure Investment
Components Of Traditional Infrastructure Investment
Components Of Traditional Infrastructure Investment
Traditional Infrastructure: Growth in traditional infrastructure has been weak at around 3% year-on-year in 2019, in line with our analysis last August. However, we are now expecting growth to accelerate to 6-8% by the end of this year, across all three categories of traditional infrastructure (Chart 3). In the past two months, the central government has clearly sped up the pace in reviewing and approving infrastructure projects related to power generation and distribution, transportation (railways, highways, waterways, airports, subways, etc.), and new energy. As the central government enforces increasingly stringent rules on environmental protection, investment in environmental management is likely to accelerate. Public utility management investment, which accounts for a massive 45% of overall infrastructure investment, includes sewer systems, sewer treatment facilities, waste treatment and disposal, streetlights, city roads construction, parks, bridges and tunnels. As the country’s urbanization process continues and more townships and city suburbs are developed, public utility management investment will register solid growth. The 6-8% year-on-year growth in traditional infrastructure investments by the end of this year equals to an increase of RMB1 trillion to RMB1.5 trillion in 2020. Adding up the increase of RMB 240 billion to RMB400 billion for tech-related infrastructure investment, total infrastructure spending will be RMB1.3 trillion to RMB1.9 trillion, or 1.3-1.9% of GDP (Table 1 on page 3). Bottom Line: We project 6-8% year-on-year growth in Chinese traditional infrastructure investment and a 30-50% year-on-year increase in tech-related infrastructure investment. Sources Of Infrastructure Financing Significant increases in special bond issuance, loosening public-private-partnerships (PPP) restrictions and possible Pledged Supplementary Lending (PSL) injections should enable local governments to provide sufficient funding for planned infrastructure investment projects. Net Special Bond Issuance Local government net special bond issuance, which is mainly used to fund infrastructure projects, has been one main source of financing. Last year, the amount of net special bond issuance was about RMB 2 trillion,2 accounting for about 11% of total infrastructure investment (both tech-related and traditional). This year, the annual quota on local government special bonds is still unknown, as the NPC meeting has been postponed due to the Covid-19 outbreak. Given that last year’s quota was RMB2.15 trillion, RMB 800 billion higher than in the previous year (25% growth over 2018), it is reasonable to expect the quota for 2020 will be set at RMB 3.15-3.65 trillion, a 30-35% increase from 2019. This increase alone will be able to finance 70-80% of the RMB1.3 trillion to RMB1.9 trillion additional funding required for the infrastructure investments planned for this year. Consequently, the share of special bonds in total infrastructure spending in 2020, if these projections materialize, will rise to 15-17% from 11% in 2019. Chart 4Public-Private-Partnerships Financing Will Recover This Year
Public-Private-Partnerships Financing Will Recover This Year
Public-Private-Partnerships Financing Will Recover This Year
Public-Private-Partnerships (PPP) PPPs involve a collaboration between local governments and private companies. The PPP establishment can allow the local governments to reduce local governments’ burden of financing infrastructure. Due to tightened regulations on PPP projects since late 2017, PPP financing plunged 75% from about RMB 5 trillion in 2017 to RMB 1.2 trillion in 2019. Its share of total infrastructure investment had also tumbled from nearly 30% in early 2017 to 6% in 2019 (Chart 4). However, in recent months, the Chinese government has started to loosen up the restrictions on PPP projects, by releasing three announcements within a month (Box 1). We believe recent government actions will lead to a pickup in PPP financing. Box 1 The Authorities: Loosening Up of PPP-Related Policies On February 12, the Finance Ministry released a notice demanding local governments “accelerate and strengthen PPP projects’ reserve management.” On February 28, the Finance Ministry released a contract sample of sewage water and garbage disposal projects, aiming to help local governments to more effectively proceed with such projects. On March 10, the website of the National Development and Reform Commission demanded local governments utilize the national PPP project information management and monitoring platform, actively attracting private capital and starting the projects as soon as possible. In addition, the government will likely make efforts to reduce financial and operating costs of some infrastructure projects in order to increase the risk-to-return attractiveness of such projects for private investors. The authorities may order both policy banks and commercial banks to give preferential loans to certain infrastructure projects (i.e., low-interest and long-term loans from policy banks). Moreover, the government can also provide tax breaks, offer land at a reduced cost, and other supportive policies to certain infrastructure projects. Putting it all together, we expect PPP financing to grow 10-20% and provide additional funding of RMB120 billion to RMB240 billion to China’s infrastructure development in 2020. Pledged Supplementary Lending Chart 5Possible Pledged Supplementary Lending Injections In Infrastructure Projects
Possible Pledged Supplementary Lending Injections In Infrastructure Projects
Possible Pledged Supplementary Lending Injections In Infrastructure Projects
Some Chinese government officials have hinted that policy banks may start using PSL injections to boost domestic infrastructure investment.3 Speculation among China watchers is that the scale of PSL injections will be RMB600 billion this year (Chart 5). In comparison, PSL net lending for the property market ranged from RMB 630 to 980 billion in the years 2015-2018. Bottom Line: Odds are that a significant increase in special bond issuance, loosening PPP restrictions and possible PSL injections will be sufficient to offset the decline in other funding sources. Consequently, a moderate acceleration in traditional infrastructure investment and very strong growth in tech-related infrastructure expenditures is likely. What About Stimulus In The Property Sector? Stimulus for the property sector this time will be less forceful than the ones in both 2009 and 2016. In addition, structural property demand in China has already entered a saturation phase, drastically different from previous episodes when demand still had strong underlying growth. Altogether, the outlook for property sales in China is not promising. “Houses are for living in, not for speculation” will remain the main policy focus in the Chinese property market. That said, authorities will help ease developers’ extremely tight financing conditions. No stimulus on demand: Three cities (Zhumadian, Baoji, Guangzhou) that had released policies to loosen up restrictions on the demand side (e.g., cutting down payment from 30% to 20%, allowing larger amounts of borrowing for homebuyers) were ordered to retract their announcements within a week. There will be very little PSL lending into the property market in 2020, in line with the government’s goal of curbing speculation in the property market. Some supportive polices for developers: Over 60 cities have released policies on the supply side (e.g., delaying developers’ land transaction payments, waiving fines for breaches of start and completion dates, etc.), mainly helping property developers overcome their extreme funding shortages. Given housing unaffordability and lack of demand, we expect floor space sold to contract slightly in 2020 (Chart 6, top panel). In the meantime, we expect a slight pickup in property starts (Chart 6, middle panel). In order to stay afloat, property developers have to maintain rising floor space starts for presales to gain some funding – a fund-raising scheme for Chinese real estate developers that we discussed in detail in prior reports. In addition, we also expect moderate growth in property completions in the commodity buildings market (Chart 6, bottom panel). The pace of property completion has to be accelerated as property developers are currently under increased pressure to deliver units that were pre-sold about two years ago. This will lift construction activity in the commodity buildings market (Chart 7). Chart 6Commodity Buildings: Divergences Among Sales, Starts And Completions
Commodity Buildings: Divergences Among Sales, Starts And Completions
Commodity Buildings: Divergences Among Sales, Starts And Completions
Chart 7Commodity Buildings: Construction Activities
Commodity Buildings: Construction Activities
Commodity Buildings: Construction Activities
Please note that commodity buildings are a small subset of total constructed buildings in China, and as a subset do not provide a full picture of construction activity. The official data show that commodity buildings account for only 24% of total constructed buildings in terms of floor space area completed. In terms of a broader measure of the Chinese property market, we still expect a continuing contraction – albeit less than last year – in “building construction” floor area started and completed (Chart 8). Bottom Line: There will not be much stimulus to boost housing demand. Yet authorities will ease financial constraints on property developers that will allow them to complete housing currently under construction. Chart 8Building Construction Versus Commodity Housing
Building Construction Versus Commodity Housing
Building Construction Versus Commodity Housing
Chart 9Commodities And Related Equity Sectors Are Approaching A Bottom
Commodities And Related Equity Sectors Are Approaching A Bottom
Commodities And Related Equity Sectors Are Approaching A Bottom
Investment Implications Traditional infrastructure spending in China will post a moderate recovery in 2020, with most gains occurring in the second half of the year. Consistently, we believe the segments of Chinese and global markets leveraged to the infrastructure cycle – commodities and related equity sectors as well as industrial stocks – are approaching buying territory in absolute terms. Prices of segments have collapsed, creating a good entry point in the coming weeks (Chart 9, 10 and 11). Chart 10A Buying Time May Be Not Far For Industrial Stocks…
A Buying Time May Be Not Far For Industrial Stocks...
A Buying Time May Be Not Far For Industrial Stocks...
Chart 11…And Machinery Stocks
...And Machinery Stocks
...And Machinery Stocks
China’s spending on itech-related infrastructure will post very strong growth in 2020. Even though global semiconductor stocks have sold off considerably, they have not underperformed the global equity benchmark. In the near term, we believe risks are still to the downside for technology and semi stocks (Chart 12). However, this down-leg will create a good buying opportunity. We are watching for signs of capitulation in this sector to buy. Finally, concerning Chinese property developers, their share prices will likely underperform their respective Chinese equity benchmarks in the next nine months (Chart 13). Meanwhile, the absolute performance of property stocks listed on the domestic A-share market remains at risk (Chart 13, bottom panel). Chart 12Semi Stocks: Final Down-leg Is Possible
Semi Stocks: Final Down-leg Is Possible
Semi Stocks: Final Down-leg Is Possible
Chart 13Chinese Property Developers Are Still At Risk
Chinese Property Developers Are Still At Risk
Chinese Property Developers Are Still At Risk
Ellen JingYuan He Associate Vice President ellenj@bcaresearch.com Footnotes 1 To gauge the scale of the “new infrastructure”, we are using the National Bureau of Statistics data of “investment in information transmission, software and information technology service”. This tech-related infrastructure investment measure includes 5G networks, industrial internet, and data centers, while inter-city transit systems and vehicle charging stations may be included in the transportation investment. 2 Please note that the amount of net special bond issuance was the actual amount of funding used in infrastructure projects. It was smaller than the RMB 2.15 trillion quota because a small proportion of issuance were used to repay some existing special bonds due in the year. 3 http://www.xinhuanet.com/money/2020-02/19/c_1125593807.htm
Highlights The global pandemic is quickening the decline in globalization. Democracies can manage the virus, but it will be painful. European integration just got a major boost from Germany’s fiscal turn. Stay long the German consumer relative to the exporter. The US and UK are shifting to a “big government” approach for the first time in forty years. Go long TIPS versus equivalent-maturity nominal Treasuries. The US-China cold war is back on, after a fleeting hiatus. Stay short CNY-USD. Stay strategically long gold but go tactically long Brent crude oil relative to gold. Feature The global pandemic blindsided us this year, but it is catalyzing the past decade’s worth of Geopolitical Strategy’s themes. This week’s report is dedicated to our founder and consulting editor, Marko Papic, who spearheaded the following themes, which should be considered in light of this month’s extraordinary developments: The Apex Of Globalization: Borders are closing and the US is quarreling with both Europe and China over vulnerabilities in its medical supply chain. European Integration: Germany is embracing expansive fiscal policy and is softening its line on euro bonds. The End of Anglo-Saxon Laissez-Faire: Senate Republicans in the US are considering “helicopter money” – deficit-financed cash handouts to the public. US-China Conflict: Pandemic, recession, and the US election are combining to make a dangerous geopolitical cocktail. In this report we discuss how the coronavirus crisis is supercharging these themes, making them salient for investors in the near term. New themes will also develop from the crucible of this pandemic and global recession. Households Can’t Spend Helicopter Money Under Quarantine The global financial meltdown continues despite massive monetary and fiscal stimulus by governments across the world (Chart 1). The reason is intuitive: putting cash in people’s hands offers little solace if people are in quarantine or self-isolation and can’t spend it. Stimulus is essential and necessary to defray the costs of a collapsing economy, but doesn’t give any certainty regarding the depth and duration of the recession or the outlook for corporate earnings. Government health policy, rather than fiscal or monetary policy, will provide the critical signals in the near term. Once the market is satisfied that the West is capable of managing the pandemic, then the unprecedented stimulus has the potential to supercharge the rebound. The most important measure is still the number of new daily cases of the novel coronavirus across the world (Chart 2). Once this number peaks and descends, investors will believe the global pandemic is getting under control. It will herald a moment when consumers can emerge from their hovels and begin spending again. Chart 1Monetary/Fiscal Stimulus Not Enough To Calm Markets
De-Globalization Confirmed
De-Globalization Confirmed
Chart 2Keep Watching New Daily Cases Of COVID-19
De-Globalization Confirmed
De-Globalization Confirmed
It is critical to see this number fall in Italy, proving that even in cases of government failure, the contagion will eventually calm down (Chart 3). This is essential because it is possible that an Italian-sized crisis could develop in the US or another European country, especially given that unlike Iran, these countries have large elderly populations highly susceptible to the virus. Financial markets are susceptible to more panic until the US and EU show the virus is under control. At the same time the other western democracies still need to prove they are capable of delaying and mitigating the virus now that they are fully mobilized. They should be able to – social distancing works. The province of Lodi, Italy offers an example of successful non-pharmaceutical measures (isolation). It enacted stricter policies earlier than its neighbors and succeeded in turning down the number of daily new cases (Chart 4).1 But it may also be testing less than its wealthier neighbor Bergamo, where the military has recently been deployed to remove corpses. Chart 3Market Needs Italy Contagion To Subside
De-Globalization Confirmed
De-Globalization Confirmed
Chart 4Lodi Suggests Social Distancing Works
De-Globalization Confirmed
De-Globalization Confirmed
More stringent measures, including lockdowns, are necessary in “hot zones” where the outbreak gets out of control. It is typical of democracies to mobilize slowly, in war or other crises. Italy brought the crisis home for the G7 nations, jolting them into unified action under Mario Draghi’s debt-crisis slogan of “whatever it takes.” Borders are now closed, schools and gatherings are canceled, policy and military forces are deploying, and emergency production of supplies is under way. Populations are responding to their leaders. Self-preservation is a powerful motivator once the danger is clearly demonstrated. Still, in the near term, Spain, Germany, France, the UK, and the United States have painful battles to fight to ensure they do not become the next Italy, with an overloaded medical system leading to a vicious spiral of infections and deaths (Chart 5). Chart 5Painful Battles Ahead For US And EU
De-Globalization Confirmed
De-Globalization Confirmed
Until financial markets verify that current measures are working, they are susceptible to panics and selling. In the United States, testing kits were delayed by more than a month because the Center for Disease Control bungled the process and failed to adopt the successful World Health Organization protocol. Some materials for testing kits are still missing. Many states will not begin testing en masse for another two weeks. This means that big spikes in new cases will occur not only now but in subsequent weeks as testing exposes more infections. Over the next month there are numerous such trigger points for markets to panic and give away whatever gains they may have made from previous attempts at a rally. Pure geopolitical risks, outlined below, reinforce this reasoning. Volatility will continue to be the dominant theme. Governments must demonstrate successes in health crisis management before monetary and fiscal measures can have their full effect. There is no amount of stimulus that can compensate for the collapse of consumer spending in advanced consumer societies (Chart 6), so consumers’ health must be put on a better trajectory first. Thus in place of economic and financial data streams, we are watching our Health Policy Checklist (Table 1) to determine if policy measures can provide reassurance to the economy and financial markets. Chart 6No Stimulus Can Offset Collapse Of Consumer
No Stimulus Can Offset Collapse Of Consumer
No Stimulus Can Offset Collapse Of Consumer
Table 1Markets Need To See Health Policy Succeeding
De-Globalization Confirmed
De-Globalization Confirmed
Bottom Line: For financial markets to regain confidence durably, governments must show they can manage the outbreak. This can be done but the worst is yet to come and markets will not be able to recover sustainably over the next month or two during that process. There is more upside for the US dollar and more downside for global equities ahead. The Great Fiscal Blowout Global central banks were not entirely out of options when this crisis hit – the Fed has cut rates to zero, increased asset purchases, and extended US dollar swap lines, while central banks already at the zero bound, like the ECB, have still been able to expand asset purchases radically (Table 2). Table 2Central Banks Still Had Some Options When Crisis Hit
De-Globalization Confirmed
De-Globalization Confirmed
Chart 7ECB Still The Lender Of Last Resort
ECB Still The Lender Of Last Resort
ECB Still The Lender Of Last Resort
The ECB’s new 750 billion euro Pandemic Emergency Purchase Program (PEPP) has led to a marked improvement in peripheral bond spreads which were blowing out, guaranteeing that the lender of last resort function remains in place even in the face of a collapse of the Italian economy that will require a massive fiscal response in the future (Chart 7). Nevertheless with rates so low, and government bond yields and yield curves heavily suppressed, investors do not have faith in monetary policy to make a drastic change to the macro backdrop for developed market economies. Fiscal policy was the missing piece. It has remained restrained due to government concerns about excessive public debt. Now the “fiscal turn” in policy has arrived with the pandemic and massive stimulus responses (Table 3). Table 3Massive Stimulus In Response To Pandemic
De-Globalization Confirmed
De-Globalization Confirmed
The Anglo-Saxon world had already rejected budgetary “austerity” in 2016 with Brexit and Trump. Few Republicans dare oppose spending measures to combat a pandemic and deep recession after having voted to slash corporate taxes at the height of the business cycle in 2017.2 The Trump administration is currently vying with the Democratic leadership to see who can propose a bigger third and fourth phase to the current spending plans – $750 billion versus $1.2 trillion? Both presidential candidates are proposing $1 trillion-plus infrastructure plans that are not yet being put to Congress to consider. The Trump administration agrees with its chief Republican enemy, Mitt Romney, as well as former Obama administration adviser Jason Furman, in proposing direct cash handouts to households (“helicopter money”). The size of the US stimulus is at 7% of GDP and rising, larger than in 2008- 10. In the UK, the Conservative Party has changed fiscal course since the EU referendum. Prime Minister Boris Johnson's government had proposed an “infrastructure revolution” and the most expansive British budget in decades – and that was before the virus outbreak. Robert Chote, the head of the Office for Budget Responsibility, captured the zeitgeist by saying, “Now is not a time to be squeamish about public sector debt. We ran during the Second World War budget deficits in excess of 20% of GDP five years on the trot and that was the right thing to do.”3 Now Germany and the EU are joining the ranks of the fiscally accommodative – and in a way that will have lasting effects beyond the virus crisis. Chart 8Coalition Loosened Belt Amid Succession Crisis
Coalition Loosened Belt Amid Succession Crisis
Coalition Loosened Belt Amid Succession Crisis
On March 13 Germany pulled out a fiscal “bazooka” of government support. Finance Minister Olaf Scholz announced that the state bank, KfW, will be able to lend 550bn euros to any business, great or small, suffering amid the pandemic. KfW’s lending capacity was increased from 12% to 15% of GDP. But Scholz, of the SPD, and Economy Minister Peter Altmaier, of the CDU, both insist that there is “no upward limit.” This shift in German policy was the next logical step in a policy evolution that began with the European sovereign debt crisis and took several strides over the past year. The German public, battered by the Syrian refugee crisis, China’s slowdown, and the trade war, voted against the traditional ruling parties, the Christian Democratic Union (CDU) and the Social Democratic Party (SPD). Smaller parties have been stealing their votes, namely the Greens but also (less so) the right-wing populist Alternative for Germany (Chart 8). This competition has thrown the traditional parties into crisis, as it is entirely unclear how they will fare in the federal election in 2021 when long-ruling Chancellor Angela Merkel passes the baton to her as yet unknown successor. To counteract this trend, the ruling coalition began loosening its belt last year with a small stimulus package. But a true game changer always required a crisis or impetus – and the coronavirus has provided that. Germany’s shift is ultimately rooted in geopolitical constraints: Germany is a net beneficiary of the European single market and stands to suffer both economically and strategically if it breaks apart. Integration requires not only the ECB as lender of last resort but also, ultimately, fiscal transfers to keep weaker, less productive peripheral economies from abandoning the euro and devaluing their national currencies. When Germany loosens its belt, it gives license to the rest of Europe to do the same: The European Commission was obviously going to be extremely permissive toward deficits, but it has now made this explicit. Spain announced a massive 20% of GDP stimulus package, half of which is new spending, and is now rolling back the austere structural reforms of 2012. Italy is devastated by the health crisis and is rolling out new spending measures. The right-wing, big spending populist Matteo Salvini is waiting in the wings, having clashed with Brussels over deficits repeatedly in 2018-19 only to see Brussels now coming around to the need for more fiscal action. In addition to spending more, Germany is also sounding more supportive toward the idea of issuing emergency “pandemic bonds” and “euro bonds,” opening the door for a new source of EMU-wide financing. True, the crisis will bring out the self-interest of the various EU member states. For example, Germany initially imposed a cap on medical exports so that critical items would be reserved for Germans, while Italy would be deprived of badly needed supplies. But European Commission President Ursula von der Leyen promptly put a stop to this, declaring, “We are all Italians now.” Fiscal policy is now a tailwind instead of a headwind. Von der Leyen is representative of the German ruling elite, but her position is in line with the median German voter, who approves of the European project and an ever closer union. Chart 9DM Budget Deficits Set To Widen
DM Budget Deficits Set To Widen
DM Budget Deficits Set To Widen
Separately, it should be pointed that Japan is also going to loosen fiscal policy further. Prime Minister Shinzo Abe was supposed to have already done this according to his reflationary economic policy. His decision to hike the consumer tax in 2014-15 and 2019, despite global manufacturing recessions, ran against the aim of whipping the country’s deflationary mindset. While Abe’s term will end in 2021, Abenomics will continue and evolve by a different name. His successor is much more likely now to follow through with the “second arrow” of Abenomics, government spending. Across the developed markets budget deficits are set to widen and public debt to rise, enabled by low interest rates, surging output gaps, and radical policy shifts that were long in coming (Chart 9). Bottom Line: Ultra-dovish fiscal policy is now complementing ultra-dovish monetary policy throughout the West. This was clear in the US and UK, but now Europe has joined in. Germany’s “bazooka” is the culmination of a policy evolution that began with the European debt crisis. This is an essential step to ensuring that Germany rebalances its economy and that Europe sticks together during and after the pandemic. Europe still faces enormous challenges, but now fiscal policy is a tailwind instead of a headwind. US-China: The Cold War Is Back On US-China tensions are heating back up and could provide the source of another crisis event that exacerbates the “risk off” mode in global financial markets. The underlying strategic conflict never went away – it is rooted in China’s rising geopolitical power relative to the United States. The “phase one” trade deal agreed last fall was a manifestly short-term, superficial deal meant to staunch the bleeding in China’s manufacturing sector and deliver President Trump a victory to take to the 2020 election. Beijing was never going to deliver the exorbitant promises of imports and was not likely to implement the difficult structural provisions until Trump achieved a second electoral mandate. Trump always had the option of accusing China of insufficient compliance, particularly if he won re-election. Now, however, both governments are faced with a global recession and are seeking scapegoats for the COVID-19 crisis. Xi Jinping doesn’t have an electoral constraint but he does have to maintain control of the party and rebuild popular confidence and legitimacy in the wake of the crisis. China’s private sector has suffered a series of blows since Xi took power. China’s trend growth is slowing, it is sitting on an historic debt pile, and it is now facing the deepest recession in modern memory. The protectionist threat from the United States and other nations is likely to intensify amid a global recession. Former Vice President Joe Biden has clinched the Democratic nomination and does not offer a more attractive option for China than President Trump. On the US side, Trump’s economic-electoral constraint is vanishing. Trump’s chances of reelection have been obliterated unless he manages to recreate himself as a successful “crisis president” and convince Americans not to change horses in mid-stream. Primarily this means he will focus on managing the pandemic. Yet it also gives Trump reason to try to change the subject and adopt an aggressive foreign or trade policy, particularly if the virus panic subsides. The economic downside has been removed but there could be political upside to a confrontation with China. The US public increasingly views China unfavorably and is now particularly concerned about medical supply chain vulnerabilities. A diplomatic crisis is already unfolding. China’s propaganda machine has gone into overdrive to distract its populace from the health crisis and recession. The main thrust of this campaign is to praise China’s success in halting the virus’s spread through draconian measures while criticizing the West’s ineffectual response, symbolized by Italy and the United States. This disinformation campaign escalated when Zhao Lijian, spokesman for the Ministry of Foreign Affairs, tweeted that COVID-19 originated in the United States. The conspiracy theory holds that it brought or deployed the coronavirus in China while a military unit visited for a friendly competition in Wuhan in October. A Hong Kong doctor who wrote an editorial exposing this thesis was forced to retract the article. President Trump responded by deliberately referring to COVID-19 as the “Chinese virus.” He defended these comments as a way of emphasizing the origin although China and others have criticized the president for dog-whistle racism. Secretary of State Mike Pompeo and Yang Jiechi, a top Chinese diplomat, met to address the dispute, but relations have only gotten worse. After the meeting China revoked the licenses of several prominent American journalists.4 The fact that conspiracy theories are being spouted by official and semi-official sources in the US and China reflects the dangerous combination of populism, nationalism, and jingoism flaring up in both countries – and the global recession has hardly begun.5 The phase one trade deal may collapse. Investors must now take seriously the possibility that the phase one trade deal will collapse. While China obviously will not meet its promised purchases for the year due to the recession, neither side has abandoned the deal. The CNY-USD exchange rate is still rising (Chart 10). President Trump presumably wants to maintain the deal as a feather in his cap for the election. This means that any failure would come from the China side, as an attack on Trump, or from Trump deciding he is a lame duck and has nothing to lose. These are substantial risks that would blindside the market and trigger more selling. Chart 10US And China Could Abandon Trade Deal
US And China Could Abandon Trade Deal
US And China Could Abandon Trade Deal
Military and strategic tensions could also flare up in the South and East China Seas, the Korean peninsula, or the Taiwan Strait. While we have argued that Korea is an overstated geopolitical risk while Taiwan is understated, at this point both risks are completely off the radar and therefore vastly understated by financial markets. A “fourth Taiwan Strait crisis” could emerge from American deterrence or from Chinese encroachments on Taiwanese security. What is clear is that the US and China are growing more competitive, not more cooperative, as a result of the global pandemic. This is not a “G2” arrangement of global governance but a clash of nationalisms. Another risk is that President Trump would look elsewhere when he looks abroad: conflict with Iran-backed militias in Iraq is ongoing, and both Iran and Venezuela are on the verge of collapse, which could invite American action. A conflict or revolution in Iran would push up the oil price due to regional instability and would have major market-negative implications for Europe. Bottom Line: The US-China trade conflict had only been suspended momentarily. The economic collapse removes the primary constraint on conflict, and the US election is hanging in the balance, so Trump could try to cement his legacy as the president who confronted China. This is a major downside risk for markets even at current crisis lows. Investment Implications What are the market implications of the themes reviewed in this report? First, the virus will precipitate another leg down in globalization, which was already collapsing (Chart 11). Chart 11Globalization Has Peaked
Globalization Has Peaked
Globalization Has Peaked
The US dollar will remain strong in the near term. It is too soon to go long commodities and emerging market currencies and risk assets, though it is notable that our Emerging Markets Strategy has booked profits on its short emerging market equity trade (Chart 12). Chart 12Too Soon To Go Long EM/Commodities
Too Soon To Go Long EM/Commodities
Too Soon To Go Long EM/Commodities
Second, the Anglo-Saxon shift away from laissez faire leads toward dirigisme, an active state role in the economy. US stocks can outperform global stocks amid the global recession, but the rising odds that Trump will lose the election herald a generational anti-corporate turn in US policy. We are strategically long international stocks, which are far more heavily discounted. The combination of de-globalization and dirigisme is ultimately inflationary so we recommend that investors with a long-term horizon go long TIPS versus equivalent-maturity nominal Treasuries, following our US Bond Strategy. Third, Germany, the EU, and the ECB are taking dramatic steps to reinforce our theme of continued European integration. We are strategically long German consumers versus exporters and believe that recommendation should benefit once the virus outbreak is brought under control. There is more downside for EUR-USD in the near term although we remain long on a strategic (one-to-three year) horizon. Fourth, China will not come out the “winner” from the pandemic. It is suffering the first recession in modern memory and is beset by simultaneous internal and external economic challenges. It is also becoming the focus of negative attention globally due to its lack of integration into global standards. Economic decoupling is back on the table as the US may take advantage of the downturn to take protective actions. The US stimulus package in the works should be watched closely for “buy America” provisions and requirements for companies to move onshore. A Biden victory will not remove American “containment policy” directed toward China. Stay strategically long USD-CNY. The chief geopolitical insight from all of the above is that the market turmoil can be prolonged by geopolitical conflict, especially with Trump likely to be a lame duck president. With nations under extreme stress, and every nation fending for itself, the probability of conflicts is rising. We do however see the potential for collapsing oil prices to force Russia and Saudi Arabia back to the negotiating table, so we are initiating a tactical long Brent crude oil / short gold trade. Moreover we remain skeptical toward companies and assets exposed to the US-China relationship, particularly Chinese tech. Matt Gertken Vice President Geopolitical Strategist mattg@bcaresearch.com Footnotes 1 See Margherita Stancati, "Lockdown of Recovering Italian Town Shows Effectiveness of Early Action," Wall Street Journal, March 16, 2020. 2 The conservatives Stephen Moore, Art Laffer, and Steve Forbes are virtually isolated in opposing the emergency fiscal measures – and will live in infamy for this, their “Mellon Doctrine” moment. 3 Costas Pitas and Andy Bruce, “UK unveils $420 billion lifeline for firms hit by coronavirus,” Reuters, March 17, 2020. 4 China retaliated against The Wall Street Journal for calling China “the sick man of Asia.” The United States responded by reducing the number of Chinese journalists licensed in the US. (Washington had earlier designated China state press as foreign government actors, which limited their permissible actions.) Beijing then ordered reporters from The Wall Street Journal, New York Times, and Washington Post whose licenses were set to expire in 2020 not to return. 5 Inflicting an epidemic on one’s own people is a very roundabout way to cause a global pandemic and harm the United States – obviously that is not what happened in China. It is also absurd to think that the US has essentially initiated World War III by committing an act of bioterrorism against China.
Dear Client, Next week we will be publishing a joint Special Report on the Chinese infrastructure investment outlook with our Emerging Markets Strategy service, authored by my colleague Ellen JingYuan He. Best regards, Jing Sima, China Strategist Feature Chart I-1Chinese Non-Financial Corporations Are Heavily Indebted
Chinese Non-Financial Corporations Are Heavily Indebted
Chinese Non-Financial Corporations Are Heavily Indebted
There are fears that the two-month hiatus in China’s business activities due to the COVID-19 epidemic has sparked acute cash shortages among Chinese companies. In turn, this has increased the danger that the highly leveraged Chinese corporate sector may be pushed into widespread insolvency (Chart I-1). The number of bankruptcies will undoubtedly climb, but small and micro firms are most at risk versus larger companies that have deeper cash reserves and easier access to financing. Our analysis shows that, before the outbreak hit China in January, companies listed in China’s onshore and offshore equity markets exhibited relatively healthy financial statements with adequate operating cash flows to cover debt obligations. This increases the probability that Chinese listed companies will survive the economic and financial shocks from the epidemic, and that their stock prices will rebound along with the expectations of a recovery in the Chinese economy. Chart I-2Both Chinese Economy And Corporate Profits Are Largely Driven By Domestic Demand
Both Chinese Economy And Corporate Profits Are Largely Driven By Domestic Demand
Both Chinese Economy And Corporate Profits Are Largely Driven By Domestic Demand
It also appears that China’s domestic economy is relatively insulated from the global financial market turmoil and impending global recession. China’s corporate profit outlook is dominated by domestic economic conditions rather than external demands. This view is also reflected in the relative performance of Chinese onshore and offshore stocks (Chart I-2). Moreover, the charts in the Appendix illustrate that corporate financial ratios in almost all sectors of China’s onshore and offshore equity markets have somewhat improved from the previous economic down cycle that began in 2014. This underscores our view that if reflationary measures overcompensate for the economic slowdown, as in the 2015/2016 easing cycle, then Chinese stocks will likely rally in absolute terms, as well as outperform global benchmarks. We selected three categories of financial ratios to monitor profitability, leverage and operating cash flow conditions of Chinese domestic and investable listed non-financial companies (Table I-1).1 The financial data in our exercise are from Refinitiv Datastream Worldscope. Its corresponding stock price indexes for China’s overall market and sectors most closely resemble the MSCI China Index and the MSCI China Onshore index. Table I-1
Monitoring Cash Flow Conditions In Chinese Listed Companies
Monitoring Cash Flow Conditions In Chinese Listed Companies
It is also noted that the Chinese investable index, excluding financial companies, is dominated by large technology companies such as Alibaba, Tencent, and Baidu.2 These tech companies generally have more adequate cash flows and lower debt ratios than the more capital intensive sectors such as industrial and energy. The analysis we present in this report on non-financial companies in the offshore market, therefore, is not indicative of China’s overall corporate financial health. Rather, our findings are indicative of how investors should view the listed companies and their sector performance within China’s investable market. Several observations from our analysis of the listed companies’ financial ratios are noteworthy: Chinese non-financial corporations are highly leveraged, and have not de-levered much despite the financial deleverage campaign that began in late 2017. Contrary to the belief that Chinese corporates’ financial health is significantly weaker than that in developed economies, the leverage ratio, profit margins, and debt-servicing ability among Chinese domestic and investable non-financial companies are actually in the range of their global peers (Chart I-3). Yet, Chinese companies trade at substantial discounts to global benchmarks. This is particularly evident in the offshore market, whereas domestic Chinese stocks were priced at a discount until the recent global market selloffs (Chart I-4). This underpins our view that, when China’s economy and corporate profits recover, Chinese stocks should outperform their global benchmarks on a cyclical time horizon. Importantly, with a stronger aggregate corporate financial health and a large price discount. Chinese investable non-financial stocks have more upside potential than their domestic counterparts. Chart I-3Financial Health Among Listed Chinese Companies Comparable With DMs
Financial Health Among Listed Chinese Companies Comparable With DMs
Financial Health Among Listed Chinese Companies Comparable With DMs
Chart I-4Chinese Investable Stock Prices Remain Deeply Discounted Relative To Global Benchmarks
Chinese Investable Stock Prices Remain Deeply Discounted Relative To Global Benchmarks
Chinese Investable Stock Prices Remain Deeply Discounted Relative To Global Benchmarks
Utilities, machinery, industrials and construction materials are among the sectors with the lowest cash flow-to-interest expense ratios, in both China’s domestic and investable markets. In particular, machinery, industrials and construction materials are pro-cyclical sectors and their profit growth is positively correlated with economic growth. Their low profitability and high leverage contribute to their poor cash flows. Those sectors have been severely impacted by the stoppages in manufacturing and construction activities due to the COVID-19 epidemic in China, making them vulnerable to cash shortages. However, there is a low risk of a broad-based default among these firms, because state-owned enterprises (SOEs) dominate these sectors in the Chinese equity market. The stock performance in these sectors is also extremely sensitive to shifts in China’s monetary and policy stance, and thus should benefit from the recent loosening in monetary conditions and the push for a substantial increase in infrastructure investment this year. Chart I-5Small Property Developers In China Are Much More Vulnerable To Cash Shortages Than Large Ones
Small Property Developers In China Are Much More Vulnerable To Cash Shortages Than Large Ones
Small Property Developers In China Are Much More Vulnerable To Cash Shortages Than Large Ones
The leverage ratio in the real estate sector has doubled in the past 10 years. The sector’s cash flow-to-total liabilities ratio has also declined sharply since 2017, when the authorities tightened lending standards to property developers. However, the sector’s aggregate cash flow situation is still an improvement from its lowest point in 2014, in both China’s domestic and investable markets. The countrywide lockdowns in January and February will undoubtedly have severe impacts on Chinese property developers’ cash flows. But the real estate sector is perhaps the best example in exhibiting a pronounced divergence in cash flow conditions between larger and smaller firms. Chart I-5 shows that, while the median ratio of cash-to-total liabilities tuned negative among 76 domestic listed real estate developers, the average ratio from total companies in the same sector suggests that the cash situation has actually improved since mid-2018. This divergence indicates that larger developers have more solid financial fundamentals and easier access to liquidity compared with their smaller counterparts, even before the lockdowns. We expect the divergence in cash flow conditions to widen in the coming months, and smaller property developers will face intensifying pressure to consolidate. China’s domestic healthcare companies have a much better cash balance than the investable healthcare sector, which has the lowest ratio of cash-to-interest expenses among all sectors. The poor cash flow conditions in investable healthcare companies are due to high leverage and low profitability, as well as high operating costs and R&D expenses. Chinese domestic healthcare sector has outperformed the broad market since the epidemic broke out in January. While we think the overall Chinese investable stocks have more upside than their domestic peers, domestic healthcare companies’ lower leverage ratio, stronger cash flows, and much higher profit margin make the sector a better bet than investable healthcare stocks on a cyclical time horizon (Chart I-6). Chart I-6Domestic Healthcare Sector Likely To Continue Outperforming The Broad Market
Domestic Healthcare Sector Likely To Continue Outperforming The Broad Market
Domestic Healthcare Sector Likely To Continue Outperforming The Broad Market
Chart I-7Energy Stocks Will Remain Depressed Until Oil Prices Rebound
Energy Stocks Will Remain Depressed Until Oil Prices Rebound
Energy Stocks Will Remain Depressed Until Oil Prices Rebound
Historically, there has been a strong positive correlation between the energy sector’s profitability, cash flow conditions, stock performance and crude oil prices (Chart I-7). In the past two years, the sector’s leverage ratio has risen, profit margins have thinned and the cash flow situation has sharply deteriorated to the same level as in 2014 when oil prices collapsed. The ongoing oil price rout will generate powerful deflationary forces in the energy sector and will likely further deteriorate energy firms’ profitability and cash flow. While we stay long cyclical stocks versus defensives on both a 0-3 month and a 6-12 month view, we recommend a cautious stance towards energy stocks until the evolving oil price war situation is clarified. Qingyun Xu, CFA Senior Analyst qingyunx@bcaresearch.com Jing Sima China Strategist jings@bcaresearch.com Appendix Overall Markets Excluding Financials
Overall Markets Excluding Financials Sector
Overall Markets Excluding Financials Sector
Consumer Discretionary Sector
Consumer Discretionary Sector
Consumer Discretionary Sector
Consumer Staples Sector
Consumer Staples Sector
Consumer Staples Sector
Real Estate Sector
Real Estate Sector
Real Estate Sector
Automobile Sector
Small Property Developers In China Are Much More Vulnerable To Cash Shortages Than Large Ones
Small Property Developers In China Are Much More Vulnerable To Cash Shortages Than Large Ones
Machinery Sector
Machinery Sector
Machinery Sector
Industrials Sector
Industrials Sector
Industrials Sector
Construction Materials Sector
Construction Materials Sector
Construction Materials Sector
Telecommunications Sector
Telecommunications Sector
Telecommunications Sector
Technology Sector
Technology Sector
Technology Sector
Healthcare Sector
Healthcare Sector
Healthcare Sector
Energy Sector
Energy Sector
Energy Sector
Utilities Sector
Utilities Sector
Utilities Sector
Footnotes 1 We exclude banks and financial institutions from this analysis, due to discrepancy in Chinese banks’ accounting measures from those of non-financial corporations’. 2 Alibaba, Tencent, Baidu, and JD together account for nearly 40% of the non-financial market cap in Chinese investable index. Cyclical Investment Stance Equity Sector Recommendations
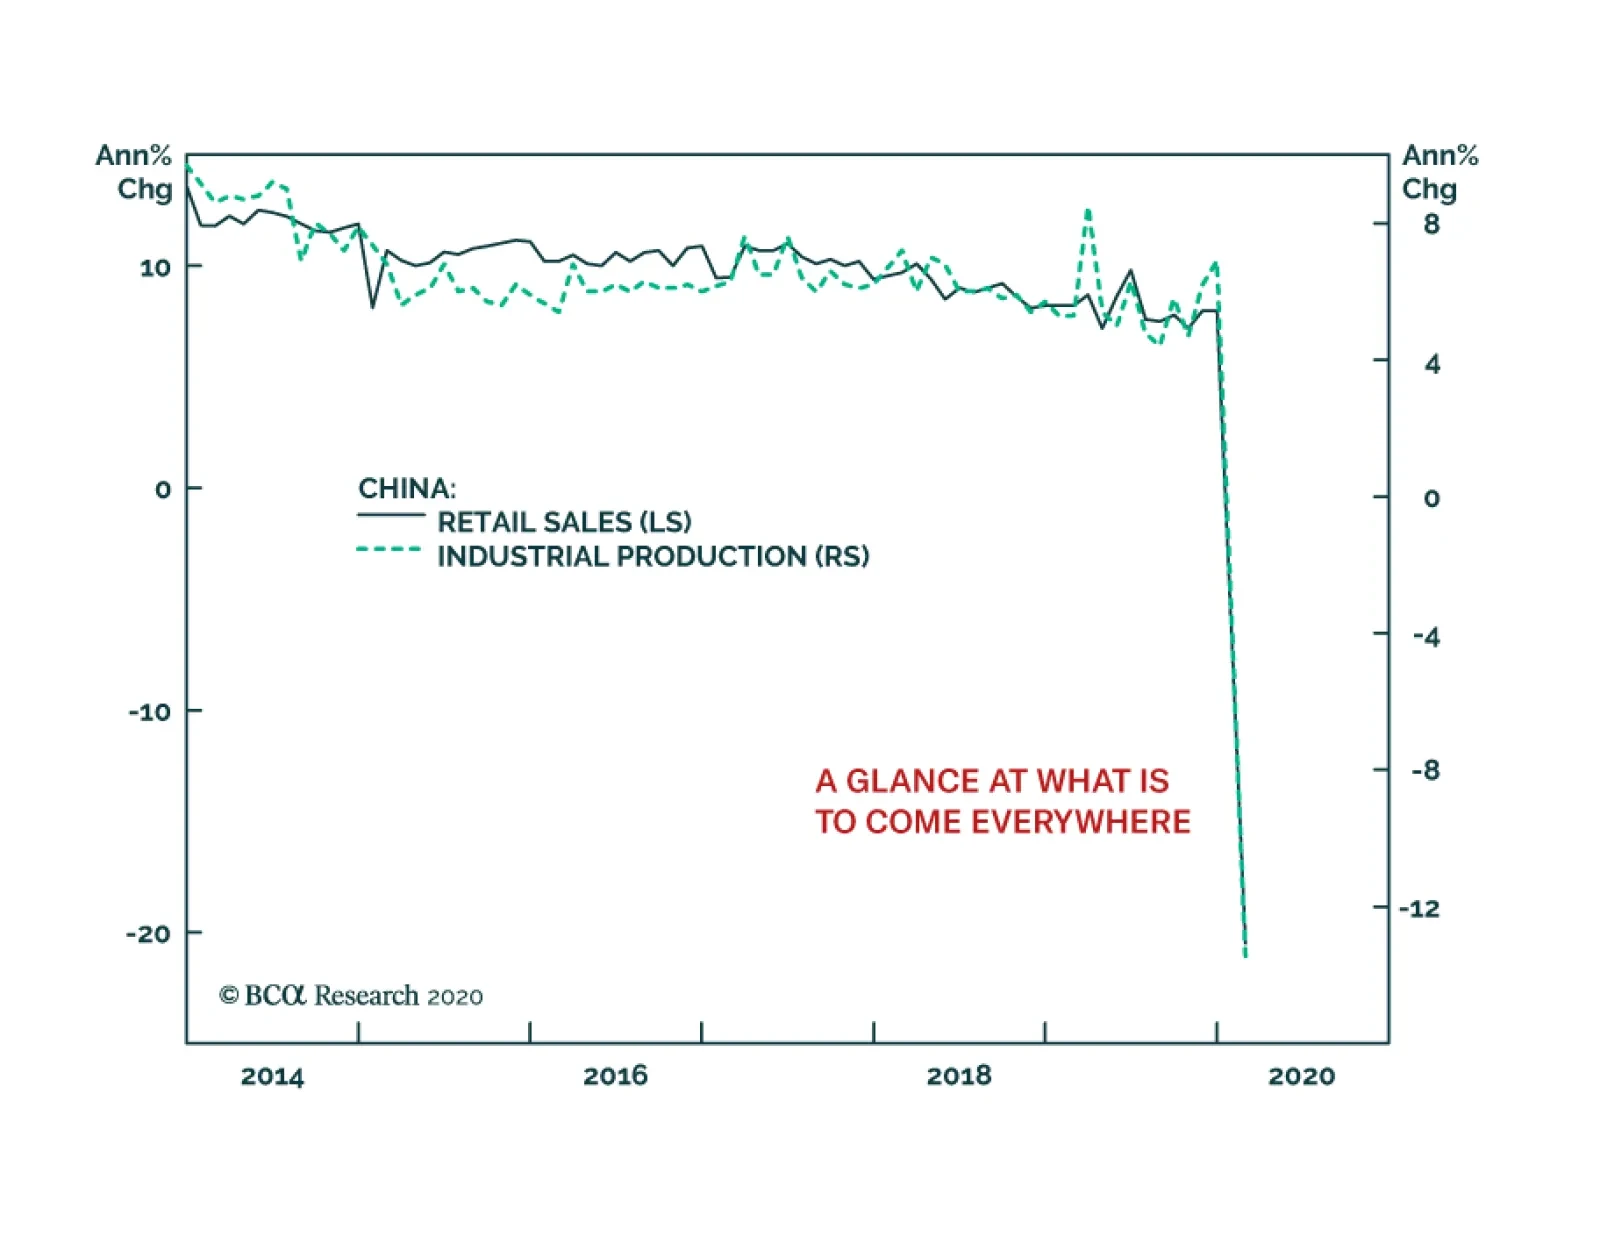
Overnight, China gave us a taste of what is in store for economies implementing quarantine measures. Industrial production contracted 13.5% on an annual basis and retail sales plunged by 20.5%. As dismal as these numbers may be, they are likely to rebound…
Highlights China is moving from virus containment to normalization and economic stimulus. The full weight of the virus panic is only now hitting the US public and has not yet peaked. The US – and western democracies in general – have the raw capabilities to manage the virus outbreak. The profile of global political risk is shifting as a result of the economic shock stemming from the virus. This implies that while equity markets are close to their bottom, they face more volatility. Feature Chart 1No Peak In New Cases Outside China
Can Democracies Manage The Virus?
Can Democracies Manage The Virus?
China’s President Xi Jinping visited Wuhan, the epicenter of the coronavirus breakout that has triggered a global bear market, on March 10. While he did not declare outright victory over the virus, his symbolic visit reinforced the fact that China has drastically reduced the number of new daily cases both within and without Hubei province. Meanwhile the virus is spreading rapidly across the rest of the world (Chart 1). It is not clear if the outbreak and emergency response in the United States will follow the Italian or South Korean trajectory. The initial US response is not encouraging, but the US has latent institutional strengths. Either way the US is facing a tsunami of new cases in the very near term. Hence the panic among the American population can still escalate from here (Chart 2). Panic among households translates to a drop in economic activity that will ensure financial markets remain volatile, even if US equities are close to their bottom. Chart 2US Public Panic Has Not Peaked Yet
Can Democracies Manage The Virus?
Can Democracies Manage The Virus?
Can Democracies Manage The Crisis? Chart 3Developed Economies Have Better Health
Can Democracies Manage The Virus?
Can Democracies Manage The Virus?
The question has become salient because of the poorly managed cordon sanitaire in Italy and the slow and halting initial reaction of the United States. Moreover, to distract from China’s domestic crisis, the Communist Party has turned up the volume of its propaganda organs, advertising the success of China’s draconian containment measures and warning that the virus cannot be contained if the rest of the world does not follow suit. However, it is not the case that the pandemic can only be managed through absolutist policies. To date, developed economies and democracies – including westernized countries like Japan – have the best record in the world of improving public health and reducing mortality from infectious diseases. This is apparent simply by looking at life expectancy for those aged 60. Europe and Japan have the longest lives beyond 60, including extension of life when dealing with late-life health problems, while other regions lag, including Asia. The United States is on the low end of the developed countries but still considerably better than emerging market economies at prolonging life, even for unhealthy elderly folks (Chart 3). Chart 4US Has Reduced Flu/Pneumonia Deaths Dramatically
Can Democracies Manage The Virus?
Can Democracies Manage The Virus?
The United States, like other countries, has done battle with a range of infectious diseases over the course of its history – in which it was the leader in economic, scientific, and technological advancement. These include cholera and viral epidemics like smallpox, Yellow Fever, the Spanish Flu, and SARS. The death rate for influenza and pneumonia has generally declined since the 1950s, although a counter-trend increase is conceivable given what occurred in the 1980s-90s (Chart 4). The strategy that the US and developed economies have used, embodied in documents like the World Health Organization’s interim protocol for rapid operations to contain pandemics, is one of creating a containment zone with movement restrictions and a closely watched buffer zone in which a combination of anti-viral treatment and non-pharmaceutical treatment (e.g. social distancing) is employed. “Containment and isolation” strategies are generally successful even though they often fail to establish an impenetrable geographic cordon sanitaire, must rely on voluntary behavior, and will never receive total compliance. The survival instinct and social pressure are powerful enough to convince most individuals and households to keep their distance from others once they are informed of the risks. Targeted government measures by credible regimes with a monopoly on the use of force – in cases where strong restrictions are necessary – are effective. And in democracies they are kept in place only as long as necessary (the incubation period of the virus plus a few more weeks). Developed economies and democracies have the best record of improving public health and reducing mortality from infectious diseases. The overall effect is to “flatten the curve,” e.g. to slow the spread of the virus, and delay and reduce the peak intensity of the number of cases and burden on hospitals and doctors.1 Of course, nations need institutional capacity and leadership to deal with a pandemic and the indirect impacts on their economies, trade, and supply chains. When businesses grind to a halt, will households be able to get what they need? If not, civic order could break down. Supply security is a fundamental national interest and governments that cannot provide it risk a loss of legitimacy and control. Major nations devote extensive resources to building and maintaining internal lines of communication so that neither natural nor man-made disasters can stop them from ensuring security and essential goods and services. Europe and North America will ultimately deal with the crisis successfully. A look at some basic indicators and indexes of national capabilities shows which nations are best and worst positioned to meet the logistical and supply challenges of the virus’s economic shock: The US ranks close to Japan in logistical capabilities, while Italy ranks between these two and Iran, which is woefully lacking (Chart 5). Chart 5Italy Suffers From Logistic Weaknesses
Can Democracies Manage The Virus?
Can Democracies Manage The Virus?
Italy resembles China in having significant supply chain vulnerabilities (Chart 6), including quality of infrastructure (Chart 7). Obviously China has made leaps and bounds, but interior regions are still underserviced. Clearly China has benefited from greater government authority and capacity relative to Italy. Chart 6US Supply Chains Are Resilient
Can Democracies Manage The Virus?
Can Democracies Manage The Virus?
Chart 7US Infrastructure Is High-Quality
Can Democracies Manage The Virus?
Can Democracies Manage The Virus?
Even when it comes to basic food security, Italy and China are more vulnerable than others (Chart 8). Yet China has kept food shortages to a minimum throughout the crisis. The US is large enough that different regions will have greater vulnerabilities when it comes to the health crisis. The National Health Security Preparedness Index shows California, Florida, Georgia, Texas, and Michigan are below the national average in the ability to execute countermeasures to health crises (Chart 9). Chart 8Food Security Risks Under Control In China
Can Democracies Manage The Virus?
Can Democracies Manage The Virus?
Chart 9US: Regional Differences In Health Preparedness
Can Democracies Manage The Virus?
Can Democracies Manage The Virus?
These institutional factors suggest that Europe and North America will ultimately deal with the crisis successfully, although in the near term the consequences are unpredictable. Italy’s experience has made it apparent to all nations that if the reproduction rate is not suppressed through containment and isolation, then the health system will be overwhelmed and the death rate will go up. But clearly this has nothing to do with Italy’s being a democracy, as neither Japan nor South Korea have had the same experience. Investment Conclusions The United States is moving more aggressively to mitigate the problem, beginning with President Trump’s ban on travel with continental Europe and declaration of a national emergency. With a bear market having occurred, and a recession likely, President Trump is losing the primary pillar of his reelection campaign. He will continue to make reflationary efforts to salvage the economy. He has announced $50 billion in emergency spending and a waiver on student debt loan payments worth as much as $85 billion. But he has also become a “crisis president.” This means that he may take dramatic, surprise actions that are market-negative in the short term in order to delay the spread of the virus. Emergency powers are extensive and he will utilize them not only to combat the pandemic but also to double down on the narrative that got him elected: closing off America’s borders and reducing its exposure to the risks of globalization. This can include the movement of people, from places other than China and continental Europe (already halted), and even capital flows. This is another reason to expect greater volatility in the near term despite the huge discounts on offer. We are not bottom-feeding yet. The profile of global political risk is shifting as a result of the virus and its economic shock. If Trump is seen as having mishandled the health and wellbeing of the nation, then he loses the election regardless of whether stimulus measures help the economy rebound by November. Whereas if he takes drastic, economically painful measures now to control the virus, and ultimately the virus subsides, there is still a slim chance he can win election. His approval rating, at an average of 45%, has lost its upward momentum but has not yet collapsed. Regardless of the election, the financial bloodbath should not obfuscate for investors the fact that the US is the world’s most advanced economy and longest continuously running constitutional republic. It has survived a total Civil War, two World Wars, a Great Depression, and countless outbreaks of disease. It has the ability to take emergency action and mitigate pandemics. This means that a great buying opportunity is just around the corner. The profile of global political risk is shifting as a result of the virus and its economic shock. The above should make it clear that the US and Italy face the most immediate ramifications – both are much more likely to see changes in ruling party over the next year than they were. Policy, however, will remain counter-cyclical (reflationary) regardless. Rogue regimes like Iran, Venezuela, and North Korea face renewed risks of regime failure and/or military confrontation with the US and its allies beginning in the immediate term, especially if President Trump becomes a clear “lame duck” in the coming months. Down the line, the Japanese, German, and French elections will be affected by the economic fallout of the virus scare. China and Russia face medium-term risks due to new difficulties in improving their populations’ quality of life. Their leaders and ruling parties have an authoritarian grip, but political risk will increase as a result of slower growth. China retains the ability to stimulate aggressively – which it is doing – but that will slow the reform and rebalancing process. Russia, meanwhile, faces another wave of internal devaluation if it does not call off its emerging market-share war with Saudi Arabia. Presidents Vladimir Putin and Xi Jinping are likely to re-consolidate power by 2022, but they face much greater risks of domestic instability than they did before this year’s turmoil. Matt Gertken Vice President Geopolitical Strategist mattg@bcaresearch.com Footnotes 1 Martin S. Cetron, “Quarantine, Isolation and Community Mitigation: Battling 21st Century Pandemics with a 14th Century Toolbox,” September 20, 2006, available at nationalacademies.org.
Dear Client, In addition to this week’s report, BCA Research will hold webcasts over the coming days to discuss the economic and financial outlook amid the myriad of uncertainties gripping global markets. I will take part in a roundtable discussion alongside my fellow BCA Strategists Arthur Budaghyan, Mathieu Savary, and Caroline Miller for a live webcast on Friday, March 13 at 8:00 AM EDT (12:00 PM GMT, 1:00 PM CET, 8:00 PM HKT). In addition, I will hold a webcast on Monday, March 16 at 12:00 PM EDT (4:00 PM GMT). Best regards, Peter Berezin, Chief Global Strategist Highlights A global recession is now a fait accompli. The only question is whether there will be a technical recession lasting a couple of quarters, or a more prolonged downturn that produces a sizeable increase in unemployment rates. We lean towards the former outcome. Unlike during most recessions, the decrease in labor demand will be mitigated by a decline in labor supply, as potentially millions of workers are confined to their homes. This will limit the rise in unemployment, at least initially. The pandemic is likely to prompt firms to increase inventory levels for fear of further disruptions to their supply chains. This should provide a short-term boost to output. While it is possible that spending will remain broadly depressed even after the panic subsides, this seems unlikely. Private-sector finances were reasonably strong going into the crisis, while ultra-low government bond yields will incentivize increased fiscal outlays. Spending on leisure travel and public entertainment will remain subdued well into 2021, but much of this demand will be redirected to other categories of discretionary consumer purchases, particularly in the online realm. Health care expenditures will also increase. The collapse in oil prices following the breakdown of OPEC 2.0 represents a positive supply shock for the global economy, albeit one that will have negative consequences for oil-extraction sectors. We tactically upgraded stocks on the morning of Friday, February 28. That was obviously a major mistake: While global equities did rally 7% higher after our upgrade, they have since given up all their gains (and then some). For now, we are maintaining a modest overweight recommendation to equities. However, this is a low-conviction view, and we would not dissuade more conservative investors from reducing risk exposure. We would only consider upgrading stocks to a high-conviction overweight if the S&P 500 dropped to 2250, or the number of new infections outside of China peaked. In the meantime, we are downgrading high-yield credit tactically, as the odds of earnings weakness prompting a near-term rise in default expectations warrant caution. What A Way To Start The Decade So far, the 2020s may not be roaring, but they are certainly not boring. At the outset of the crisis, there were three scenarios for the COVID-19 outbreak: 1) A regional epidemic largely confined to China; 2) a series of global outbreaks, successfully short-circuited by a combination of government intervention and voluntary “personal distancing” measures; 3) A full-blown pandemic that exposes a significant proportion of the planet to the virus. Unfortunately, the first scenario has been ruled out. Policymakers are now trying to achieve the second scenario. Successful containment would “flatten the curve” of new infections, while allowing the sick to receive better treatment than they would otherwise. It would also buy precious time to develop a vaccine and increase the output of face masks, hand sanitizers, and other products that could slow the spread of the disease. Health Versus Growth Ironically, while the second scenario is clearly preferable to a full-blown pandemic from a health perspective, it may be more damaging from the very narrow, technical perspective of GDP accounting. It all depends on how severe the measures to quash each outbreak need to be. If simple hygiene measures and social distancing turn out to be enough, the economic fallout will be minimal. If ongoing mass quarantines and business closures are necessary, the damage will be severe. History suggests that containment efforts can work. During the Spanish flu, US cities such as St. Louis, which took early action to slow the spread of the disease, ended up with far fewer deaths than cities such as Philadelphia which did not (Chart 1). Western Samoa did not impose any travel restrictions and lost a quarter of its population. American Samoa closed its border and suffered no deaths. Chart 1Containment Efforts Can Be Effective: The Case Of The Spanish Flu
Contagion
Contagion
Recent experience suggests that COVID-19 can be stopped, even after community contagion has set in. The number of new Chinese cases has fallen from 3,892 on February 5 to 31 on March 11. South Korea seems to be getting the virus under control. The number of new cases there has declined from 813 on February 29 to 242 (Chart 2). Japan and Singapore also appear to be succeeding in preventing the virus from spreading rapidly. Chart 2Coronavirus: The Authorities In East Asia Seem To Be In Control Of The Situation
Contagion
Contagion
What remains unclear is whether other countries can replicate East Asia’s experience. A recent Chinese study estimated that R-naught – the average number of people someone with the virus ends up infecting – fell from 3.86 at the outset of the outbreak to 0.32 following interventions (Chart 3).1 In other words, China was able to lower R-naught to one-third of what was necessary to stabilize the number of new infections. If one wanted to be optimistic, one could argue that other countries could get away with less heavy-handed measures, even if it is at the expense of a somewhat slower decline in the infection rate. Chart 3Severe Containment Measures Have Changed The Course Of The Wuhan Outbreak
Contagion
Contagion
Unfortunately, given how contagious the virus appears to be, it is unlikely that simple measures such as regularly washing one’s hands, avoiding large gatherings, and wearing a face mask in public when sick will suffice. Trade-offs will have to be made between growth and health. Moreover, if the virus becomes endemic in a few countries that do not have the institutional capacity to contain it, this could create a viral reservoir that produces repeated outbreaks in the wider world. The result could feel like a ghastly game of whack-a-mole. The Fatality Rate The degree to which countries pursue costly containment measures depends on how deadly the virus turns out to be. On the one hand, there is some evidence that the fatality rate from COVID-19 is lower than the 2%-to-3% that has been widely reported once mild or asymptomatic cases, which often go undetected, are taken into account. This may explain why South Korea, which has arguably done a better job of testing suspected patients than any other country, has reported a fatality rate of only 0.7%. Like the seasonal flu, the death rate from COVID-19 appears to be heavily tilted towards the elderly. In Italy, 89% of COVID-19 deaths have occurred among those who are 70 and older. On the ill-fated Diamond Princess cruise liner, not a single person under the age of 70 has died. The fatality rate for passengers on the ship older than 70 is 2.4%. The seasonal flu kills about 1% of those it infects over the age of 70. Based on this simple calculation, COVID-19 is more lethal, but not light-years more lethal, than the typical flu (and possibly less lethal than the flu is for young children). Unfortunately, these optimistic estimates assume that patients with COVID-19 can continue to receive appropriate care. As we saw in Wuhan, where the official death rate stands at 4.5% compared to 0.9% in the rest of China, and as we are now seeing in Italy, once the health care system becomes overwhelmed, death rates can rise sharply. Bottom Line: Containing the virus will be economically costly, but given the potentially large death toll from a full-blown pandemic, most countries will be willing to pay the price. A Global Recession Even before the virus became endemic outside China, we estimated that global growth would fall to zero on a quarter-over-quarter basis in Q1. As we cautioned back then, the risk to our forecast was tilted to the downside, and that has proven to be the case. We now expect the global economy to shrink not just in the first quarter but in the second quarter as well, as country after country experiences a surge in new infections. Two consecutive quarters of negative growth constitute a technical recession. Despite the drop in new cases in China over the past two weeks, most high-frequency measures of economic activity such as property sales, railway-loaded coal volumes, and traffic congestion have yet to return anywhere close to normal levels (Chart 4). In the US, hotel occupancy rates, movie ticket sales, and attendance at sporting events were all close to normal levels as of last week. However, that is changing quickly. Already, automobile traffic in Seattle, one of the cities most hard-hit by the virus, has fallen sharply (Chart 5). Chart 4China: It Will Take Time For Life To Return To Normal
Contagion
Contagion
Chart 5US: Staying Home More In Seattle Due To The Virus?
Contagion
Contagion
Qualitatively Different While a recession in the first half of 2020 is now unavoidable, the nature of this recession is likely to be quite different than in the past. To understand why, it is useful to review what causes most recessions. A typical recession involves a prolonged loss of aggregate demand. Such a loss of demand can result from either financial market overheating or economic overheating. Financial market overheating can occur if a credit-fueled asset bubble bursts, leaving people with less wealth struggling to pay off debt. For example, US residential investment fell from 6.6% of GDP in 2005 to 2.5% of 2010. Thus, even after the credit markets thawed, there was still a large hole in aggregate demand that needed to be filled. A similar, though less severe, loss of demand occurred when the bursting of the dotcom bubble led to severe cutbacks in IT spending. Economic overheating occurs when a lack of spare capacity puts upward pressure on inflation. Wary of accelerating prices, central banks slam on the brakes, raising interest rates into restrictive territory. This often results in a recession. In both types of recessions, there are usually second-round effects that can swamp the initial shock to aggregate demand. As spending falls, firms start to lay off workers. The resulting loss in household income leads to less spending. Even those who retain their jobs are apt to feel less confident, leading to an increase in precautionary savings. For their part, businesses tend to cut production as inventory levels swell. Things only return to normal once enough pent-up demand has accumulated and/or policy has become sufficiently stimulative to revive spending. Framed in this way, one can see that the current downturn differs from past downturns in at least three important respects. First, unlike during most recessions, the decrease in labor demand this time around will be partly mitigated by a decline in labor supply, as potentially millions of workers are confined to their homes. While this will not prevent many workers from temporarily losing income, it will limit the increase in unemployment, at least initially. We have already seen this in China, where GDP growth collapsed but companies are complaining about a shortage of migrant labor. Second, rather than falling, inventory levels may actually rise. Since companies will have to deal with pervasive supply shocks of unknown frequency, duration, and magnitude, their natural inclination will be to increase inventory levels for fear that they will not be able to access their supply chains when they need them. If recent reports of hoarding of toilet paper and bottled water are any guide, the same sort of behavior will show up among consumers. Again, in the short term, this additional demand will help to keep unemployment from rising as much as it would otherwise. Third, and perhaps most importantly, the ongoing crisis is the result of an exogenous shock rather than an endogenous slowdown. In fact, a variety of economic indicators such as US payrolls, the Chinese PMI, and German factory orders were all pointing to an acceleration in global growth before the crisis began. This suggests that growth could recover quickly once the panic subsides. While it is impossible to say with any degree of certainty how long it will take for the panic to end, it may not last as long as many fear. Investors should particularly pay attention to the situation in Italy. If the number of new cases peaks there, it could create a sense that other western countries will be able to get the virus under control. Second-Round Effects? Although it is possible that economies will remain depressed even after the panic subsides, this seems unlikely. Private-sector finances were reasonably strong going into the crisis. The private-sector financial balance – the difference between what companies and households earn and spend – is in surplus in most countries, including China (Chart 6). Chart 6The Private Sector Spends Less Than It Earns In Most Economies
Contagion
Contagion
Chart 7Lower Oil Prices Eventually Lead To Higher Growth
Lower Oil Prices Eventually Lead To Higher Growth
Lower Oil Prices Eventually Lead To Higher Growth
Granted, not all sectors are likely to prove equally resilient. Spending on leisure travel and public entertainment will remain subdued well into 2021. The collapse in oil prices following the breakdown of OPEC 2.0 will also wreak havoc on oil producers. In both cases, however, there will be offsetting benefits. Much of the demand for travel and entertainment will be redirected to other categories of discretionary consumer purchases, particularly in the online realm. And while lower oil prices will hurt producers, they represent a boon for consumers and companies that use petroleum as an input. In general, as Chart 7 illustrates, global growth usually accelerates following declines in oil prices. Fiscal Policy Will Turn More Stimulative Even before the crisis began, we argued that most governments should permanently increase fiscal deficits in order to raise the neutral rate of interest. At the current juncture, with a recession upon us and government bond yields at ultra-low levels, the failure to enact meaningful fiscal stimulus would be economic malpractice of the highest order. In addition to easing measures being rolled out by central bankers, our sense is that we will get a lot of fiscal stimulus, sooner rather than later. During most recessions, there is always a chorus of voices from people whose own jobs are secure about how a downturn is necessary to cleanse the system. This time around, it is obvious that the victims are not to blame. Politicians will not endear themselves to voters by denying the need for fiscal support to households struggling with medical bills and lost time from work and businesses facing bankruptcy. President Trump’s pledge this week to cut payroll taxes and increase transfers to those affected by the virus is just a taste of what’s to come. Investment Conclusions Chart 8Stock-To-Bond Ratio: A Lot Of The Bad News Has Already Been Priced In
Stock-To-Bond Ratio: A Lot Of The Bad News Has Already Been Priced In
Stock-To-Bond Ratio: A Lot Of The Bad News Has Already Been Priced In
We tactically upgraded stocks on the morning of Friday, February 28. That was obviously a major mistake: While global equities did rally 7% higher after our upgrade, they have since given up all their gains (and then some). In retrospect, we should have paid more attention to our own analysis in our report “Markets Too Complacent About The Coronavirus.” For now, we are maintaining a modest overweight recommendation to equities. The total return ratio between stocks and bonds has fallen by a similar magnitude as in the run-up to prior recessions, suggesting that much of the bad news has already been priced in (Chart 8). Nevertheless, significant downside risks remain, which is why we would characterize our equity overweight as a fairly low-conviction view. We would not dissuade more conservative investors from reducing risk exposure. As discussed above, containing the virus could lead to significant economic disruptions. We would only consider upgrading stocks to a high-conviction overweight if the S&P 500 dropped to 2250, or the number of new infections outside of China peaked. In the meantime, we are downgrading high-yield credit tactically, as the odds of earnings weakness prompting a near-term rise in default expectations warrant caution. Safe-haven government bond yields will probably not rise much from current levels, at least in the near term. The Fed cut rates by 50 basis points last week and will cut rates by another 50 basis points next week. Looking further out, however, bonds are massively overvalued and will suffer mightily as life returns to normal. Peter Berezin Chief Global Strategist peterb@bcaresearch.com Footnotes 1Chaolong Wang, Li Liu, Xingjie Hao, Huan Guo, Qi Wang, Jiao Huang, Na He, Hongjie Yu, Xihong Lin, Sheng Wei, and Tangchun Wu, “Evolving Epidemiology and Impact of Non-pharmaceutical Interventions on the Outbreak of Coronavirus Disease 2019 in Wuhan, China,”medrxiv.org, March 6, 2020. Global Investment Strategy View Matrix
Contagion
Contagion
MacroQuant Model And Current Subjective Scores
Contagion
Contagion
Strategic Recommendations Closed Trades
Highlights China should fare a global recession better than most G20 economies, given its large domestic market and powerful policy response. China is likely to frontload a large portion of its multi-year infrastructure investment projects to this year. We project a near 10% increase in infrastructure investments in 2020. While at the moment we do not have high conviction in the absolute trend in Chinese stock prices, we think Chinese equities will still passively outperform global benchmarks in a global recession. Feature Chart 1A Black Monday Triggered By A "Perfect Storm"
A Black Monday Triggered By A "Perfect Storm"
A Black Monday Triggered By A "Perfect Storm"
Investors are now pricing in a global recession, triggered by a worsening COVID-19 epidemic outside of China and a full-blown price war in the oil market. Global stocks tumbled by 7% on Monday March 9 while the US 10-year Treasury yield dropped to a record low (Chart 1). This extreme volatility reflects investors’ inability to predict how the epidemic will evolve or how long the oil price war will persist. If growth in the US and other major economies turns negative, then China’s disrupted supply side in Q1 will be met with weaker global demand in Q2 and even Q3. While our visibility is limited on the predominantly medically- or politically-oriented crisis, what we have conviction in forecasting at this point is that the Chinese economy will weather the storm better than most G20 economies. China’s policy response and the recovery in domestic demand will more than offset weaknesses from external demand. Thus Chinese stocks will likely outperform global benchmarks in the next 3 months and over a 6-12 month span, even though the absolute trend in both Chinese and global stock prices remains unclear over both these time horizons. A One-Two Punch In a recessionary scenario affecting the entire global economy, China would receive a one-two punch through shocks to both supply and demand tied to the COVID-19 outbreak and shrinking global demand. However, while a global recession would impact China’s export growth, it would not have the kind of bearing on China’s aggregate economy as it did in either 2008/2009 or 2015/2016. The reason is that the Chinese economy is less reliant on exports than it was in 2015 and considerably less than in 2008 (Chart 2). Domestic demand is now dominant, accounting for more than 80% of China’s economy, meaning that the country is less vulnerable to reductions in global demand. Chart 2The Chinese Economy Is Much Less Reliant On Exports
The Chinese Economy Is Much Less Reliant On Exports
The Chinese Economy Is Much Less Reliant On Exports
Chart 3Global Economy Showing Reflation Signs Before COVID-19
Global Economy Showing Reflation Signs Before COVID-19
Global Economy Showing Reflation Signs Before COVID-19
Our current assessment is that the shocks from the virus epidemic and oil price rout on global demand will be brief.Global manufacturing and trade were on a path to recovery prior to the crisis (Chart 3). China’s external and domestic demand rebounded sharply in December and likely have improved even further until late January when the COVID-19 outbreak took hold in China (Chart 4). Even though China’s trade figures in the first two months of 2020 were distorted by COVID-19 (Chart 5),1 a budding recovery in both China’s domestic and global demand before the outbreak suggests the epidemic should disrupt rather than completely derail the global economy. Moreover, a rebound in trade following the crisis will likely be powerful, as the short-term disruption in business activities will lead to a sizable buildup in manufacturing orders. A rebound in trade following the crisis will likely be powerful. Chart 4Chinese Exports Likely To Have Improved Further Until COVID-19 Hit
Chinese Exports Likely To Have Improved Further Until COVID-19 Hit
Chinese Exports Likely To Have Improved Further Until COVID-19 Hit
Chart 5Chinese Demand Likely To Pick Up Sharply In Q2
Chinese Demand Likely To Pick Up Sharply In Q2
Chinese Demand Likely To Pick Up Sharply In Q2
Bottom Line: China’s export growth will moderate if the virus outbreak prolongs and substantively weakens the global economy. However, the demand shock should have a relatively minor impact on China’s aggregate economy and the subsequent recovery should be robust. Infrastructure Investment Comes To Rescue, Again Chart 6Substantial Acceleration In Infrastructure Investment Likely In 2020
Substantial Acceleration In Infrastructure Investment Likely In 2020
Substantial Acceleration In Infrastructure Investment Likely In 2020
Infrastructure investment in China will likely ramp up significantly in 2020, which will mitigate the influence on the domestic economy from both COVID-19 and slowing global growth. The message from the March 4th Politburo Standing Committee2 chaired by President Xi Jinping further supports our view, that Chinese policymakers are committed to a major increase in infrastructure investment in 2020. Our baseline projection suggests a near 10% increase in infrastructure investment growth in 2020 (Chart 6). Local governments’ infrastructure investment plans for the next several years amount to about 34 trillion yuan.3 While local government budget and bond issuance will be approved at the annual National People’s Congress, which is delayed due to the epidemic, we have high conviction that a significant portion of the planned spending will be frontloaded this year. A significant portion of the multi-year infrastructure projects will likely be moved up to this year. In the first two months, local governments have frontloaded 1.2 trillion yuan worth of bonds, including nearly 1 trillion yuan of special-purpose bonds (SPBs). The consensus forecasts a total of 3-3.5 trillion yuan of SPBs to be issued in 2020, a 30% jump from 2019. Given tightened restrictions on the use of SPBs, we expect that 50% of the bonds will be invested in infrastructure projects, up from about 25% from 2019. This should contribute to about 10-15% of infrastructure spending in 2020. We are likely to also see significant additional funding channels to support infrastructure spending this year: Debt-swap program: With the aggressive easing by the PBoC in recent weeks, there is a high probability that another round of debt-swap program will materialize this year – a form of fiscal stimulus similar to the debt-to-bond swap program that the Chinese government initiated during the 2015-2016 cycle (Chart 7). As we pointed out in our report dated July 24, 2019, the Chinese authorities were formulating another round of local government off-balance-sheet debt swaps, which we estimated would be about 3-4 trillion.4 What was absent back then was a concerted effort from the PBoC to equip commercial banks with the required liquidity and further lower policy rate (Chart 8). Both monetary and policy conditions are now ripe for such a program to be rolled out. Chart 7Money Supply Likely To Pick Up Strongly At The Onset Of Substantial Stimulus
Money Supply Likely To Pick Up Strongly At The Onset Of Substantial Stimulus
Money Supply Likely To Pick Up Strongly At The Onset Of Substantial Stimulus
Chart 8Monetary Conditions Are Ripe For Major Money Base Expansion
Monetary Conditions Are Ripe For Major Money Base Expansion
Monetary Conditions Are Ripe For Major Money Base Expansion
Construction bond issuance: Borrowing through local government financing vehicles (LGFV) has climbed since the second half of last year. This follows two years of tightened regulations on local government borrowing. Net issuance of urban construction investment bonds (UCIB) reached 1.2 trillion in 2019, nearly doubling the amount from a year earlier. A total of 457 billion yuan in UCB has already been issued in the first two months of 2020, which indicates that the authorities are further relaxing LGFV borrowing. We think that net UCIB issuance could reach 1.5 trillion this year, a 25% increase compared with last year. Chart 9More Room To Widen Government Budget Deficit
More Room To Widen Government Budget Deficit
More Room To Widen Government Budget Deficit
Government budget: Funding from the central and local governments budgets accounts for about 15% of overall infrastructure financing. We think that the government budget deficit will likely expand by about 2% of GDP in 2020. As Chart 9 shows, this figure is a conservative estimate compared with the 3%+ widening in the budget deficit during the 2008 and 2015 easing cycles. Bottom Line: Fiscal efforts to support the economy will significantly escalate this year. Monetary conditions and policy directions have already paved the way for a 2015-2016 style credit expansion. We expect infrastructure investment to rise to about 10% in 2020 compared with 2019. Will The RMB Join The Devaluation Club? The RMB appreciated by more than 1% against the USD in the past week, fanned by the expectation that China will have a faster recovery than other countries. The latest round of interest rate cuts by central banks around the world also pushed yield-seeking investors to RMB assets (Chart 10). Still, it is highly unlikely that the PBoC will allow the RMB to continue to appreciate at this rate. When other economies are in a competitive currency devaluation cycle, a strong RMB will generate deflationary headwinds for China’s economy and will partially offset the PBoC’s easing efforts (Chart 11). Chart 10Too Much Too Fast?
Too Much Too Fast?
Too Much Too Fast?
Chart 11A Strong RMB Will Choke Off PBoC's Easing Efforts
A Strong RMB Will Choke Off PBoC's Easing Efforts
A Strong RMB Will Choke Off PBoC's Easing Efforts
If the upward pressure in the RMB persists, then Chinese policymakers will be more inclined to expand the money base. Chart 12PBoC Likely To Rapidly Expand Its Balance Sheet Again
PBoC Likely To Rapidly Expand Its Balance Sheet Again
PBoC Likely To Rapidly Expand Its Balance Sheet Again
We do not expect the PBoC to follow the US Federal Reserve and chase its policy rate even lower. However, if the upward pressure in the RMB persists, then Chinese policymakers will be more inclined to expand the money base. This further raises the probability that local government debt-swap programs will develop this year (Chart 12). The government may allow financial institutions to extend or swap maturing local government off-balance sheet debt with bank loans that carry lower interest rates and longer maturities. Or, it will simply move the debt to the PBoC’s balance sheet. Bottom Line: If upward pressure in the RMB endures, the PBoC will likely expand its balance sheet and make more room to buy local government debt, but it is unlikely to aggressively cut interest rates. Investment Conclusions Chart 13Chinese Stocks Will Likely Continue To Outperform, Even In A Global Recession
Chinese Stocks Will Likely Continue To Outperform, Even In A Global Recession
Chinese Stocks Will Likely Continue To Outperform, Even In A Global Recession
Our recent change in view5 concerning the willingness of Chinese authorities to “stimulate the economy at all costs” meant that Chinese stocks were likely to outperform the global benchmarks in a rising equity market. In a global recessionary, which is now a fait accompli, Chinese leadership’s willingness to stimulate the economy will only intensify. China’s large domestic economy also makes the country less vulnerable to a global demand shock. At this point in time we do not have high conviction in the absolute trend in either Chinese or global stock prices, as their near-term performance is predominantly driven by a medically- and politically-oriented crisis. However, as we expect the Chinese economy to outperform in a global recession, our overweight call on Chinese equities remains intact on both a 3-month and 12-month horizon, in relative terms (Chart 13). Jing Sima China Strategist jings@bcaresearch.com Footnotes 1 China had postponed January’s data release and instead, has combined the first two months of the year. 2 “We should select investment projects; strengthen policy support for land use, energy use, and capital; and accelerate the construction of major projects and infrastructure that have been clearly identified in the national plan.” http://cpc.people.com.cn/n1/2020/0305/c64094-31617516.html?mc_cid=2a979… 3 https://m.21jingji.com/article/20200306/504edc15217322ab37337da2ca35a49e.html?[id]=20200306/nw.D44010021sjjjbd_20200306_9-01.json 4 Please see China Investment Strategy Weekly Report " Threading A Stimulus Needle (Part 2): Will Proactive Fiscal Policy Lose Steam?," dated July 24, 2019, available at cis.bcaresearch.com 5 Please see China Investment Strategy Weekly Report "China: Back To Its Old Economic Playbook?," dated February 26, 2020, available at cis.bcaresearch.com Cyclical Investment Stance Equity Sector Recommendations
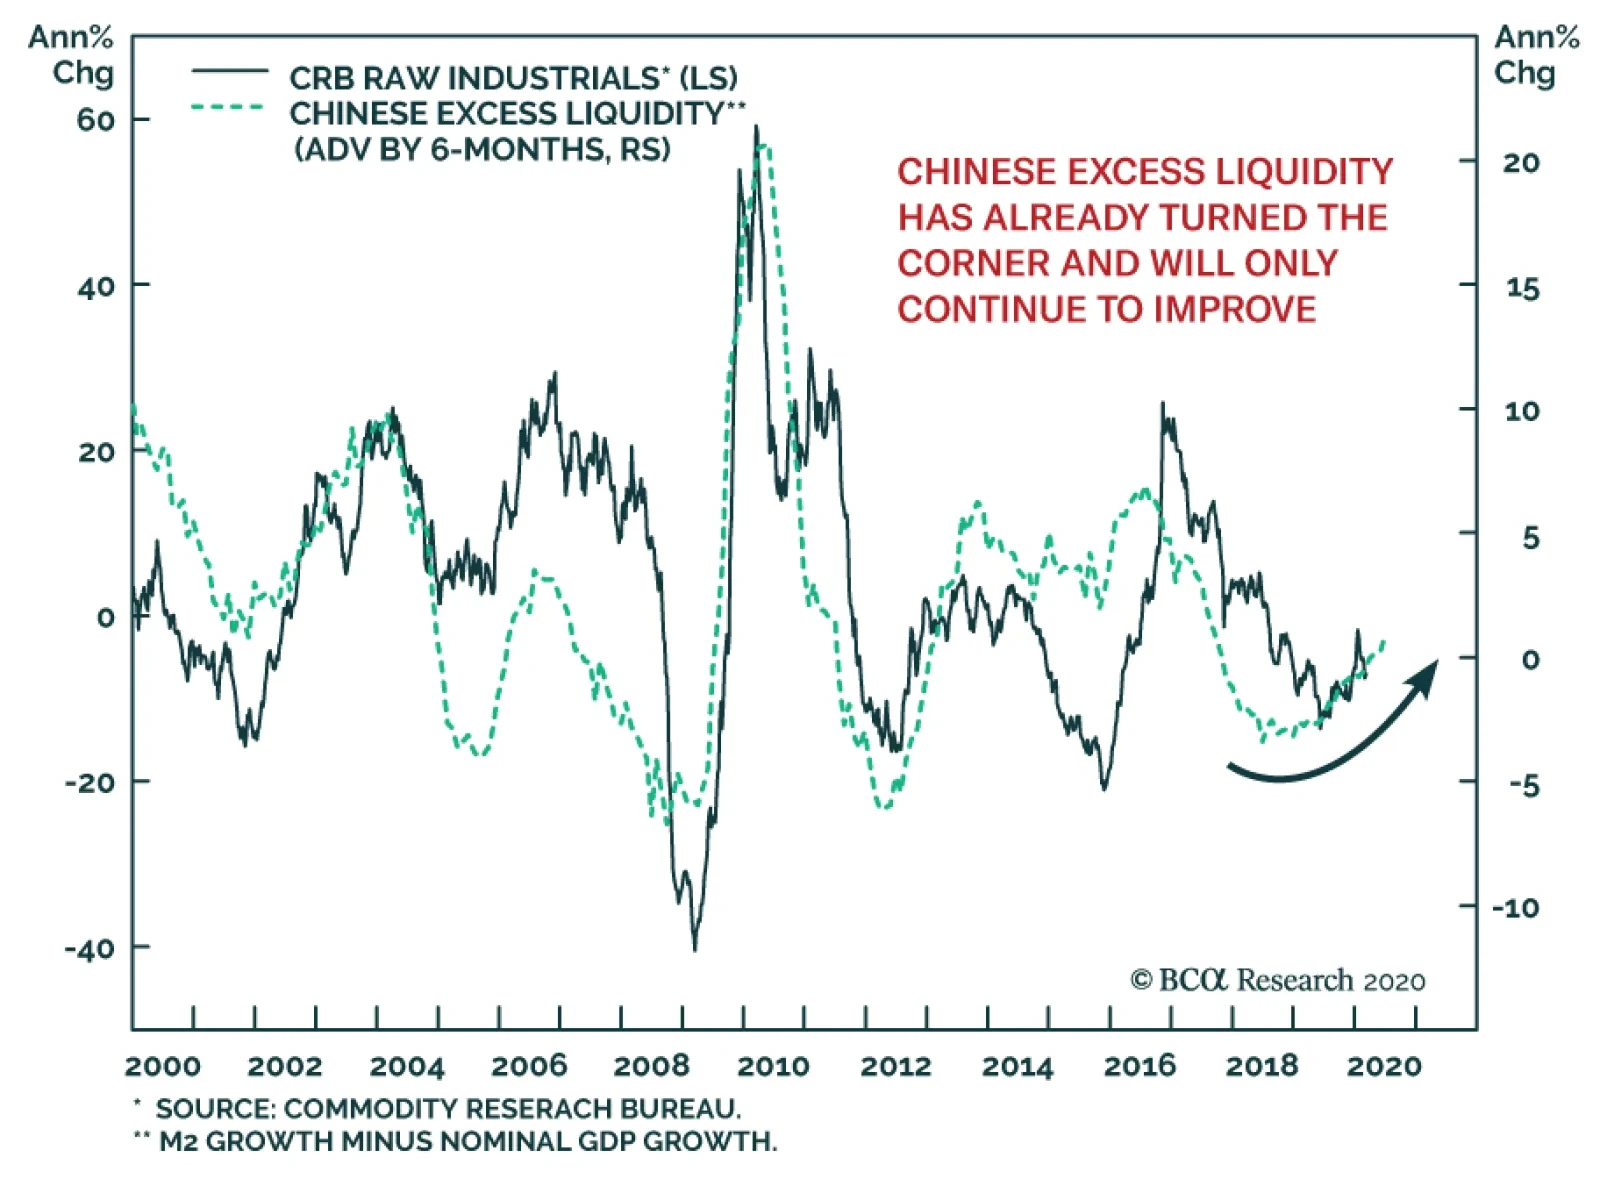
Even before COVID-19 became a market relevant issue, Chinese excess liquidity growth (defined as money growth relative to nominal GDP) was picking up. Now that Chinese policymakers are ramping up both their rhetoric and their efforts to boost domestic growth,…
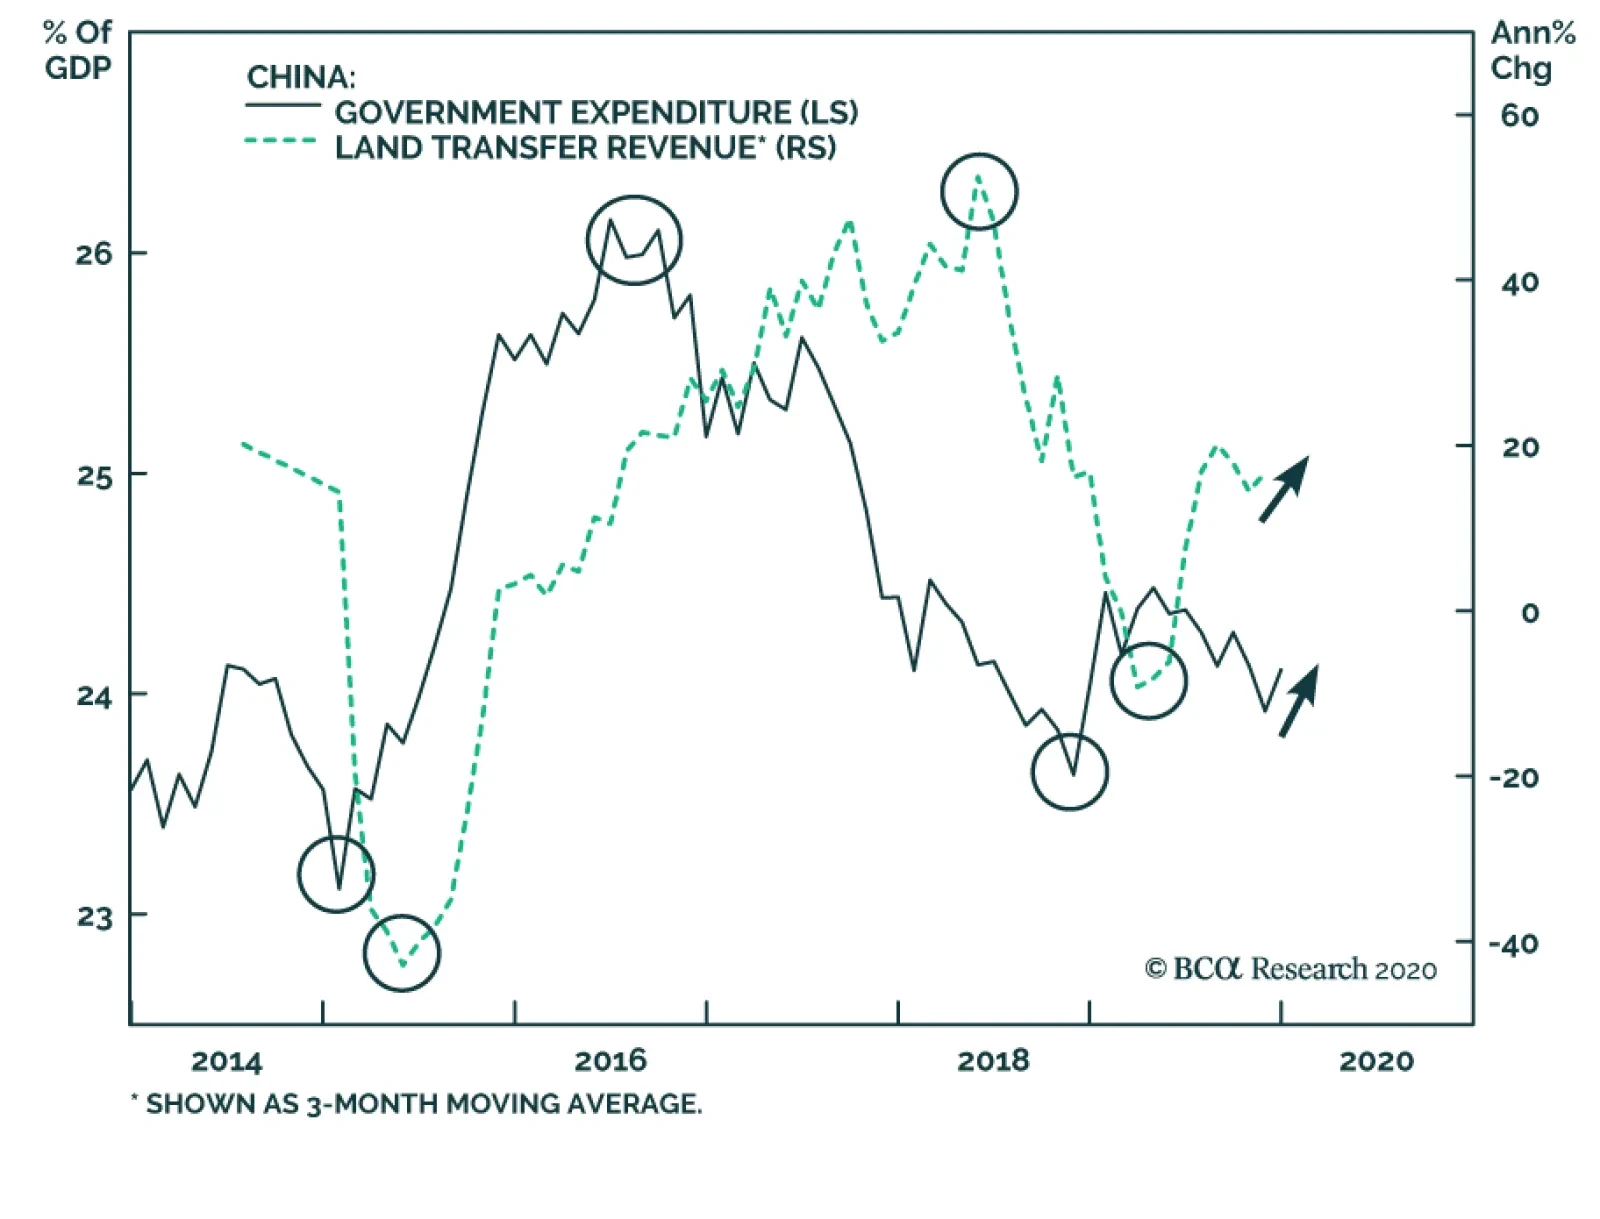
Yesterday, BCA Research's China Investment Strategy service concluded that land and home sales are likely to pick up in 2020 thanks to government expenditure. Investors should not expect large fluctuations in housing prices, but growth in home sales…