China

Highlights Why did S&P 500 profit margins fall in 2019?: Compensation gains, trade tensions and spotty growth were the most likely culprits, though the absence of standardized disclosure hinders full attribution. Was it a one-off, or the beginning of a trend?: We believe that profit margins have likely peaked, though we expect that they will contract only modestly this year. The outcome of the election could have a significant margin impact going forward. The coronavirus outbreak may be worsening around Wuhan, but it does not appear to be metastasizing elsewhere: Our China strategists foresee an extended lockdown of Hubei province, but expect that the rest of the Chinese economy will be able to overcome it. They are cautiously optimistic about the prospects for containment. Sustainability What a difference a year makes. Last President’s Day, the S&P 500 was more than 5% below its September 2018 peak (18% below its current level), amidst widespread fears that the Fed may have tightened into a recession. The month-long government shutdown was an embarrassing own goal, and trade tensions loomed as a threat to corporate earnings and global growth. It would take another two months before the S&P 500 fully recovered, only to have the yield curve invert soon thereafter. The coronavirus epidemic (COVID-19) has the curve flirting with inversion again, but stocks have shrugged off the growth risks. They continue to scale the wall of worry as self-appointed bubble spotters’ blood pressure soars, leaving them sputtering like Judge Smails or the bank official overseeing Charles Foster Kane’s trust. While we acknowledge that COVID-19 and Bernie Sanders’ post-Iowa-and-New Hampshire position at the head of the Democratic pack could yet become problematic for markets and the economy, our take aligns much more closely with Fed Chair Powell’s House testimony last week. “There’s nothing about this expansion that is unstable or unsustainable.” COVID-19 Update Chart 1What Happens In Hubei
What Next For Profit Margins?
What Next For Profit Margins?
Our China Investment Strategy colleagues were encouraged by the latest Chinese data on the outbreak. Although they foresee that Wuhan, and quite possibly all of Hubei province, will be shut down through the end of March, they do not think the action will thwart China’s nascent growth recovery. In their estimation, domestic companies will be able to reroute their supply chains with minimal disruption. If the equity market avoids a virus-related plunge, as they expect, the economy may dodge the deleterious impact on confidence that might otherwise emerge. Our sanguine China outlook encountered some resistance from clients, who have been surprised at how swiftly markets seemed to put the outbreak aside, and skeptical of official reports that seemed a little too good to be true. We suggested that they employ a trust-but-verify approach similar to ours. We are taking official data as given, while using other countries’ data as a reasonableness check. We are monitoring the magnitude of PRC policy efforts to mitigate the virus’ drag and remaining vigilant for any signs of global supply chain disruptions. Bottom Line: Our China strategists were heartened by official reports indicating that the coronavirus has been mostly contained in Hubei province (Chart 1), but are actively seeking out other evidence for corroboration before concluding that the worst is over. Making Sense Of Declining Profit Margins As we showed last week, S&P 500 profit margins narrowed across 2019, with 2% EPS growth lagging 5% growth in per-share revenue. Margins do not remain fixed over time, but the contraction represented a notable shift after several years of steady margin expansion. Even when EPS declined on a year-over-year basis for four straight quarters across 2015 and 2016, margins mainly held their own as revenues, which contracted year-over-year for six consecutive quarters, had it worse (Chart 2). Chart 2Fun While It Lasted
What Next For Profit Margins?
What Next For Profit Margins?
We primarily attribute last year’s decline to gains in labor’s share of income. Although average hourly earnings growth decelerated from 2018 to 2019, real unit labor cost growth flipped from negative to positive. Tariffs also likely detracted from income, as domestic businesses were surely not able to pass through all of their increased cost of goods sold to their customers against a backdrop of persistently low inflation and limited pricing power. Decelerating US and global growth was also a drag (Chart 3). Chart 3Growth Decelerated Everywhere In 2019
What Next For Profit Margins?
What Next For Profit Margins?
Have Profit Margins Peaked? Excepting meaningful structural changes, profit margins are a mean-reverting series. Following steady margin expansion over three business cycle expansions spanning nearly three decades, mean reversion is an unappealing prospect for equity investors (Chart 4). Unless corporate tax rates are raised, though, the mean going forward will be higher than the mean established when federal taxation was more onerous. Additionally, an in-depth Bank Credit Analyst study argued that profit margins have not grown as much as it would appear to the naked eye,1 but they are elevated, and their future direction will influence prospective equity returns. Chart 4Margins Have Thrived In The Last Three Expansions
Margins Have Thrived In The Last Three Expansions
Margins Have Thrived In The Last Three Expansions
A definitive analysis of S&P 500 margins would compile detailed revenue and expense data for each constituent in the index, but compiling the bottom-up data would repeatedly bump up against inconsistent disclosure conventions across companies and industries. For now, we will have to content ourselves with what we can glean from top-down analysis. Margins shrank in 2019 because of rising real unit labor costs, increased tariffs and global growth deceleration. Employee compensation is far and away the single biggest expense item for businesses as a whole. Changes in compensation are therefore the most consistently critical driver of changes in margins. Other key factors include: overall economic growth, growth relative to capacity, globalization, competitive intensity, and growth of the capital stock. GDP Growth Over time, growth in a company’s revenues should converge with the weighted average of economic growth in the countries in which it operates. The sensitivity of any given company’s net income to changes in sales revenue depends on its operating leverage, but any company with at least some fixed costs will see its margins expand as sales rise. We expect that US GDP growth will moderate going forward, given that hoped-for increases in economic capacity do not appear to have offset the growth overhang from the stimulus package’s increased deficits.2 For the current year, however, we expect that an acceleration in non-US growth may largely offset moderating US growth for the aggregate S&P 500. (Chart 5) Chart 5Sales Growth Feeds Operating Leverage
Sales Growth Feeds Operating Leverage
Sales Growth Feeds Operating Leverage
The Output Gap The degree of excess capacity in the economy is most easily proxied by the output gap, the difference between the economy’s actual output and its long-run potential output, which is a function of productivity and labor force growth. Pricing power is directly related to the output gap; it’s weak when the gap is negative, and robust when the gap is positive. Excess capacity is the enemy of profits, and margins benefit when it is worked off, even if positive output gaps can’t persist indefinitely (Chart 6). With the economy continuing to grow at close to its estimated trend rate, the output gap isn’t likely to have an impact this year. Globalization allows US companies to tap lower-cost inputs in the developing world. Chart 6Excess Capacity Erodes Pricing Power
Excess Capacity Erodes Pricing Power
Excess Capacity Erodes Pricing Power
Globalization Globalization has been a major force promoting margin expansion over the last 20 to 30 years, granting US-domiciled businesses access to the developing world’s lower-cost inputs. Outsourcing saves money and global supply chains have significantly reduced product costs. Tariffs and other trade barriers are an obstacle to outsourcing, and it is our in-house geopolitical strategists’ view that the US will continue to backtrack from globalization no matter which party captures the White House in November. Changes in the sum of exports and imports as a share of GDP provide a simple proxy for changes in the intensity of globalization (Chart 7). Chart 7More Open Borders = Higher Margins
More Open Borders = Higher Margins
More Open Borders = Higher Margins
Competitiveness Margins are directly related to the intensity of globalization, but they are inversely related to the intensity of competition, which is itself inversely related to the degree of industry concentration. The laissez-faire approach to anti-trust enforcement which has generally prevailed since the Reagan administration has promoted concentration. Businesses gain pricing power as their industries move along the spectrum from perfect competition toward monopoly, just as they gain increasing power to set wages as individual labor markets move toward monopsony. Pressure for federal action to reverse the four-decade trend toward concentration will rise if the Democrats win the White House, especially as our Geopolitical Strategy service holds that the party that takes the presidency will also take the Senate. Productivity Changes in margins are directly related to the pace of productivity gains. Workers are able to do more in a given period of time when they’re endowed with more and/or better tools, and investment provides those tools. Increases in the size of the capital stock lead to productivity gains. The NFIB survey suggests that small businesses are poised to increase capital expenditures, and the capex intentions components of the regional Fed manufacturing surveys have begun pointing in that direction as well, but investment has consistently disappointed since the crisis (Chart 8), and productivity growth has been tepid for an extended period of time as a result. Chart 8Investment Pays Off In Higher Margins
Investment Pays Off In Higher Margins
Investment Pays Off In Higher Margins
Unit Labor Costs Rising labor costs by themselves do not necessarily mean that margins will contract. If output increases more than rising wages, margins will expand. We therefore watch unit labor costs, which measure output-adjusted changes in compensation. Growth in real unit labor costs is our preferred measure for their additional insight into profitability, given that changes in the overall price level are a solid proxy for changes in sales prices. When real unit labor costs are falling, corporate margins are likely expanding as revenue gains can be expected to outpace employees’ compensation per unit of output. Given the especially tight labor market, we expect real unit labor costs to continue to rise, chipping away at profit margins (Chart 9). Chart 9Persistently Negative Real Unit Labor Costs Have Boosted Margins
Persistently Negative Real Unit Labor Costs Have Boosted Margins
Persistently Negative Real Unit Labor Costs Have Boosted Margins
Taxes, Interest Rates And The Dollar The biggest driver of after-tax margins in recent years has been the 40% reduction in the top marginal federal corporate income tax rate from 35% to 21% beginning in 2018. We expect no material corporate tax changes if the president wins re-election, while we would expect that an incoming Democratic administration, fortified by House and Senate majorities, would prioritize increasing corporate tax revenues. We expect a modest rise in interest rates over the year, which is unlikely to materially impact firms’ interest expense. We expect that the dollar will weaken in 2020, as incremental growth in the rest of the world exceeds incremental growth in the US, providing the S&P 500 with a modest margin tailwind. Bottom Line: On balance, we expect that the S&P 500 will face modest margin headwinds in 2020. If the Democrats assume control of the White House and both houses of Congress next January, downward pressure on margins could intensify. Investment Implications Falling margins against a backdrop of tepid revenue growth suggest that 2020 S&P 500 earnings growth will be nothing to write home about. Stocks will have to get an assist from multiple expansion if they are to continue producing double-digit annual returns. We do not think multiple expansion is much of a stretch – it would be consistent with the latter stages of previous bull markets – but equities do not need to generate double-digit returns to top the prospective returns on offer from Treasuries, credit-sensitive fixed income or cash. As long as the margin compression unfolds slowly, equities will merit at least an equal-weight allocation in balanced portfolios as will spread product in dedicated fixed income portfolios. Corporate profit margins would quickly feel the burn in a Sanders administration. We expect that profit margins will compress slowly, as it remains our base case (albeit with limited conviction) that the president will win re-election. Under a Democratic regime, however, corporate tax rates would likely rise, anti-trust enforcement would likely unwind some of the buildup in industry concentration, and organized labor would gain a more sympathetic ear in Washington. If Bernie Sanders were to win the presidency instead of one of the Democratic moderates, margin compression would likely unfold much more rapidly (and multiples would be at immediate risk, to boot). The upcoming election is thus approaching something of a binary outcome for equities. We still see monetary policy as the swing factor for the ongoing expansion, and financial market returns, and we therefore remain constructive on the economy and risk assets. The election could upend that framework, however, passing the baton from the Fed to elected officials. We will be tracking the primary and general election ups and downs closely. Doug Peta, CFA Chief US Investment Strategist dougp@bcaresearch.com Footnotes 1 Please see the October 2012 Bank Credit Analyst Special Report, "Are US Corporate Profit Margins Really All That High?" available at www.bcaresearch.com. 2 The economic case for the stimulus package rested on the expectation that it would promote investment in the capital stock that would not otherwise occur (via immediate expensing of investments and repatriation of capital held overseas) and facilitate labor force participation. A capex burst that followed its passage quickly fizzled, and we are of the opinion that the minor provisions intended to expand labor force participation have had little effect.
Last week, BCA Research's Emerging Markets Strategy discussed the impact of potential Chinese stimulus. While it is certain that Chinese authorities will inject more fiscal and monetary stimulus into the system, its size is unknown. Moreover, stimulus does…
Yesterday, BCA Research's China Investment Strategy service wrote that Hubei’s protracted but isolated lockdown would have a minor impact on China’s overall financial market. Within the MSCI China Onshore Index, there are 16 Hubei-based companies…
Highlights Bulk commodity markets – chiefly iron ore and steel – could see sharp rallies once Chinese authorities give the all-clear on COVID-19 (the WHO’s official name for the coronavirus). These markets rallied sharply Tuesday, as President Xi vowed China would achieve its growth targets this year, which, all else equal, likely will require additional monetary and fiscal stimulus. China accounts for ~ 70% of the global trade in iron ore, and ~ 50% of global steel supply and demand. COVID-19-induced losses have hit Chinese demand for steel hard, forcing blast furnaces to sharply reduce output. However, this partly is being countered by transitory weather- and COVID-19-related disruptions that are reducing iron ore exports from Brazil and delaying Australian shipments. Iron ore inventories could be drawn hard in 2Q and 2H20 to meet demand as steelmakers rebuild stocks and construction and infrastructure projects restart (Chart of the Week). The Chinese Communist Party celebrates its 100th anniversary next year. To offset the COVID-19-induced drag on domestic growth this year, which could take GDP growth below 5%, and a weak GDP performance next year additional stimulus is an all-but-foregone conclusion. Feature When policymakers really want to jumpstart GDP growth, their playbook typically turns to the real economy via policies that encourage construction, infrastructure development and manufacturing. There is a compelling case a strong rally in iron ore and steel will accompany the containment of COVID-19, reversing the 14% and 4% declines in both since the start of the year (Chart 2). Chief among the drivers of the rally will be the increase in fiscal and monetary stimulus required to restore Chinese GDP growth disrupted by the COVID-19 outbreak, which could reduce annual growth closer to 5% than the ~ 6% rate policymakers were targeting. Chart of the WeekLow Iron Ore Stocks Setting Up A Rally
Low Iron Ore Stocks Setting Up A Rally
Low Iron Ore Stocks Setting Up A Rally
Chart 2Policy Stimulus Will Reverse Declines In Iron Ore And Steel Prices
Policy Stimulus Will Reverse Declines In Iron Ore And Steel Prices
Policy Stimulus Will Reverse Declines In Iron Ore And Steel Prices
There are a number of reasons for expecting this. 2020 marks the terminus of the decade-long policy evolution that was supposed to end with the realization of the “Chinese Dream.” Chief among the goals that were to be realized by the end of this year – which will usher in the 100th anniversary of the founding of the Chinese Communist Party in 2021 – are a doubling of per capita income and of GDP.1 The Communist Party in China has numerous policy levers it can pull to respond to worse-than-expected growth and economic shocks. These policies consume a lot of bulk commodities and base metals. When policymakers really want to jump-start GDP growth, their playbook typically turns to the real economy via policies that encourage construction, infrastructure development and manufacturing. This was clearly seen following the Global Financial Crisis (GFC) in 2008-09 (Chart 3). Even before the COVID-19 outbreak, policymakers made it clear they wanted to stabilize growth following the Sino-US trade war at the conclusion of the Central Economic Work Conference (CEWC) in December. Nominal wages and per capita income growth had been falling since 3Q18, imperilling one of the principal goals of the “Chinese Dream.” Chart 3Policy Stimulus Will Lift GDP And Iron Ore And Steel Prices
Policy Stimulus Will Lift GDP And Iron Ore And Steel Prices
Policy Stimulus Will Lift GDP And Iron Ore And Steel Prices
Policymakers will aim for annualized quarterly growth of ~ 6.5% in 2Q- 4Q20 if their goal is simply to achieve 6% p.a. growth this year. Following that CEWC meeting, our colleagues at BCA’s China Investment Strategy (CIS) anticipated policymakers would announce growth targets at the National People’s Congress (NPC) meeting next month in the range of 5.8 and 6.2% p.a. growth, noting, “the Chinese economy needs to increase by 6% in 2020 to double its size from the 2010 level in real terms.”2 The growth rate required to put the economy on track to deliver on the “Chinese Dream” is now much higher following the COVID-19 outbreak, which could shave ~1% or more off China’s growth this year alone. This suggests policymakers will aim for annualized quarterly growth of ~ 6.5% in 2Q-4Q20 if their goal is simply to achieve 6% p.a. growth this year. This predisposes us to expect significant monetary and fiscal stimulus this year after the all-clear is sounded and the economy can return to its day-to-day activities. In addition – and by no means least of the concerns driving policymakers’ decisions – the 100th anniversary of the founding of the CCP will be celebrated next year, something policymakers at all levels have been looking forward to showcase the success of their revolution. A Boon For Bulks As monetary policy eases, the construction growth trajectory should pick up smartly. China accounts for ~ 70% of the global trade in iron ore. It is expected to import ~ 1.1 billion MT this year and next, based on estimates published by the Australian government’s Department of Industry, Innovation and Science in its December 2019 quarterly assessment (Chart 4). China will account for ~ 50% of global steel supply and demand, or roughly 900mm MT/yr in 2020 and 2021. The COVID-19 outbreak reduced utilization rates at the close to 250 steel mills monitored by Mysteel Global in China to 78%, a drop of 2.3pp.3 Platts estimates refined steel production could fall by 43mm MT by the end of February.4 Most of China’s steel output goes into commercial and residential construction (~ 35%), infrastructure (~20%), machinery (~ 20%), and automobile production (~ 7%), based on S&P Global Platts estimates.5 Residential construction began to recover last year, and residential housing inventories were declining relative to sales (Chart 5). In our view, once the COVID-19 infection rate falls outside Hubei Province – the epicenter of the outbreak – markets will begin pricing in a revival of commercial and residential construction in China. As monetary policy eases, the construction growth trajectory should pick up smartly (Chart 6). Chart 4China Dominates Iron Ore, Steel Markets
Iron Ore, Steel Poised For Rally
Iron Ore, Steel Poised For Rally
Chart 5Resumption Of Construction Will Lift Demand For Bulks
Resumption Of Construction Will Lift Demand For Bulks
Resumption Of Construction Will Lift Demand For Bulks
Chart 6Easier Money And Credit Policy Will Revive Construction
Easier Money And Credit Policy Will Revive Construction
Easier Money And Credit Policy Will Revive Construction
Infrastructure spending already was on track to increase prior to the COVID-19 outbreak, based on our CIS colleagues’ reading of the CEWC statement issued in December, which “suggests fiscal support to the economy will mainly focus on infrastructure, and listed transportation, urban and rural development, and the 5G networks to be the government’s main investment projects next year.”6 This fiscal push will be supported by additional spending at the local government level, and by the issuance of special-purpose bonds by these governments with proceeds earmarked for infrastructure development (Chart 7). “A bigger fiscal push by the central government, coupled with a frontloading of 2020 local government special-purpose bond issuance, will likely boost infrastructure spending to around 10% in the first two quarters, doubling the growth in the first eleven months of 2019,” according to our CIS colleagues. Chart 7Pump Priming Will Boost Infrastructure Spending
Pump Priming Will Boost Infrastructure Spending
Pump Priming Will Boost Infrastructure Spending
Bottom Line: Infrastructure fixed asset investment will be supported by easier credit and fiscal policy in China. Whether it rises at double-digit growth rates remains to be seen, however. Expect Chinese Consumers To Come Out Spending Infrastructure fixed asset investment will be supported by easier credit and fiscal policy in China. Prior to the outbreak of COVID-19, consumer confidence was running high (Chart 8), and employment prospects have bottomed and turned higher, although they still indicate contraction. (Chart 9). This boded well for consumer-spending expectations, particularly for autos (Chart 10). Chart 8Consumer Confidence Was High Prior to COVID-19 Outbreak ...
Consumer Confidence Was High Prior to COVID-19 Outbreak ...
Consumer Confidence Was High Prior to COVID-19 Outbreak ...
Chart 9... And Job Prospects Were Improving ...
... And Job Prospects Were Improving ...
... And Job Prospects Were Improving ...
At ~ 7%, China’s automobile production remains a marginal contributor to overall steel consumption. Nonetheless, a meaningful pickup in automobile production following the depressed growth rate of the past 15 months would move steel demand upward. China’s share of world auto sales is ~30% (Chart 11). Chart 10... Thus Lifting Prospects For Chinese Auto Sales
... Thus Lifting Prospects For Chinese Auto Sales
... Thus Lifting Prospects For Chinese Auto Sales
Chart 11Policy Stimulus Will Revive Chinese Auto Sector
Policy Stimulus Will Revive Chinese Auto Sector
Policy Stimulus Will Revive Chinese Auto Sector
Accommodative monetary and fiscal policies in China point toward higher growth for the auto sector. However, it is important to note the revival in auto production needs to be driven by consumer demand – if it is led simply by restocking, the rebound will not be sustainable. The recovery we are expecting will support steel and metal consumption at the margin, but the outlook for infrastructure and construction remains key due to their higher weight in total steel consumption. Bottom Line: Auto consumption and production were recovering in late 2019; however, the strength of the recovery did not match previous stimulus programs (2009 and 2016). The recovery we are expecting this year will support steel and metal consumption at the margin, but the outlook for infrastructure and construction remains key due to their higher weight in total steel consumption. If these other sectors remain constructive for metal demand (or at least are not contracting or slowing drastically), the boost from the auto sector will meaningfully contribute to higher iron ore and steel prices. Robert P. Ryan Chief Commodity & Energy Strategist rryan@bcaresearch.com Hugo Bélanger Associate Editor Commodity & Energy Strategy HugoB@bcaresearch.com Commodities Round-Up Energy: Overweight Oil prices halted their decline and rose 1% on Tuesday as the number of daily confirmed cases of the Wuhan coronavirus decelerated in China. As of Tuesday, the daily growth in cases dropped to 5%, down from 6% the previous day. Investors will closely monitor this number for any sign of a durable slowdown in daily confirmed cases. Separately, the US Energy Information Administration revised down its global demand growth estimates for 2020 to 1.0mm b/d from 1.3mm b/d last month, reflecting the effects of the coronavirus and warmer-than-expected January temperatures in the northern hemisphere. We will be updating our global oil balances next week. Base Metals: Neutral Iron ore prices fell 14% since the COVID-2019 outbreak in January. Investors are assessing how the iron ore market will balance weaker demand expectations in China amid lower supply – largely a result of falling Brazilian ore exports. Brazil’s total iron ore exports fell ~19% y/y in January due to heavy rainfall and lower production at Brazilian miner Vale. The company’s output never fully recovered from the 2019 dam incident and remains a risk to iron ore supply in 1Q20. Vale lowered its March sales guidance by 2mm MT. Low Chinese port inventories raise prices’ vulnerability to supply disruptions (Chart 12). Precious Metals: Neutral Gold remains well bid despite a strong US dollar, fueled by safe-haven demand. The yellow metal’s price fell slightly on Tuesday as investors’ concerns over the coronavirus eased. Based on our fair-value model, prices averaged $55/oz above our estimate in January. Investors – i.e. global ETF holders and net speculative positions reported by the US CFTC – have been important contributors to the latest gold rally. Investors’ total holding of gold reached a record high 113mm oz last week. Nonetheless, we believe there is still opportunity for this group to further support prices: the share of gold allocation vs. world equity-market capitalization is still low at 0.24%, vs. its peak of 0.42% in 2012 (Chart 13). Ags/Softs: Underweight March wheat futures were down 1.8% at Tuesday’s close, settling at the lowest level of the year after the USDA called for ‘stable supplies’ of the grain for the 2019/2020 U.S. marketing year. For corn, ending stocks were unchanged relative to the January projection, while world production was revised slightly upwards. March corn futures finished 2¢ lower at $3.7975/bu. The USDA also estimated higher soybean exports on the back of increased sales to China. However, soybean price gains were limited by higher production and ending stocks abroad. Chart 12Low Iron Ore Inventory Raises Exposure To Supply Disruptions
Low Iron Ore Inventory Raises Exposure To Supply Disruptions
Low Iron Ore Inventory Raises Exposure To Supply Disruptions
Chart 13A Higher Share Of Gold Holdings Could Support Prices Further
A Higher Share Of Gold Holdings Could Support Prices Further
A Higher Share Of Gold Holdings Could Support Prices Further
Footnotes 1 The “Chinese Dream” is a phrase coined by President Xi Jinping, following the 18th Party Congress of the Chinese Communist Party in 2012, when the overarching goal of transforming China into a “moderately well-off society” was memorialized in writing. These goals were crystalized in terms of progress expected in per capita income and GDP, both of which were to be doubled in the decade ending this year. Please see Why 2020 Is a Make-or-Break Year for China published by thediplomat.com February 13, 2015. 2 Please see A Year-End Tactical Upgrade, published by BCA Research’s China Investment Strategy December 18, 2019, for an in-depth analysis of policy guidance coming out of the Economic Work Conference last December. It is available at cis.bcaresearch.com. 3 Please see WEEKLY: China’s blast furnace capacity use drops to 78% published by Mysteel Global February 10, 2020. 4 Please see China steel consumption to plunge by up to 43 mil mt in February due to coronavirus published February 6, 2020, by S&P Global Platts. 5 Please see China Macro & Metals: Steel output falls, but property creates bright spots published by S&P Global Platts December 6, 2019. 6 Please see footnote 2 above. Investment Views and Themes Recommendations Strategic Recommendations Tactical Trades TRADE RECOMMENDATION PERFORMANCE IN 2019 Q4
Iron Ore, Steel Poised For Rally
Iron Ore, Steel Poised For Rally
Commodity Prices and Plays Reference Table Trades Closed in 2020 Summary of Closed Trades
Iron Ore, Steel Poised For Rally
Iron Ore, Steel Poised For Rally
Highlights An analysis on Turkey is available on page 10. In the short term, EM share prices will likely continue searching for a direction as visibility is extremely low. Beyond the near term, an appropriate strategy for EM equity investors is buying breakouts and selling breakdowns. The forthcoming stimulus from China is not a surefire guarantee of an immediate cyclical recovery. Low and falling willingness to spend among Chinese consumers and enterprises could overwhelm the positive boost from the stimulus. Forecasting changes in willingness to spend is not straightforward. Elsewhere, we are recommending a new trade: Short Turkish banks / long Russian banks. Feature Chart I-1EM Vs DM Equities: The Path Of Least Resistance Is Down
EM Vs DM Equities: The Path Of Least Resistance Is Down
EM Vs DM Equities: The Path Of Least Resistance Is Down
EM risk assets and currencies as well as China-related financial markets are facing higher than usual uncertainty. Not only are the magnitude and duration of the coronavirus shock to the mainland’s economy unknown, but also both the scale of China’s forthcoming stimulus and its multiplier are highly uncertain. How should investors navigate through such uncertainty? For EM equity investors, an appropriate strategy is buying breakouts and selling breakdowns. Presently, we maintain a neutral stance on the absolute performance of EM stocks. We initiated a long position on December 19 and closed it on January 30 to manage risks amid the coronavirus outbreak. For asset allocators, we continue to recommend underweighting EM within global equity and credit portfolios (Chart I-1). As to exchange rates, investors should stay short a basket of EM currencies versus the US dollar. The EM equity index and EM currencies have been in a trading range in the past 12 months (Chart I-2). In the short term, markets will likely continue searching for a direction as visibility is extremely low. Beyond the near term, however, EM share prices and currencies are unlikely to remain in a narrow trading range. They will either break out or break down. Which way the market swings is contingent on corporate profits and the business cycle. A Framework To Assess Shocks What framework should investors use to gauge economic and financial market outcomes? We recommend the following: When a system – in this case the Chinese economy – is hit by an external shock, its most likely trajectory depends on the duration and magnitude of the shock as well as the initial health of the system. If the system is balanced and robust, a moderate shock can certainly shake it, but will not knock it over. A V-shaped recovery is most likely in this case. By contrast, if the system is unbalanced and precarious, a measured tremor could produce an outsized negative impact. As a result, this economy is more likely to experience a U-shaped recovery. No one can gauge with any precision the impact of the coronavirus outbreak on China’s economy. The only thing we can assess is the health of the mainland economy prior to this exogenous shock. Beyond the near term, EM share prices and currencies are unlikely to remain in a narrow trading range. Which way the market swings is contingent on corporate profits and the business cycle. In this regard, we present the following analysis on both the economy’s cyclical condition and structural vitality: 1. Cyclically, China’s growth was ostensibly bottoming when the coronavirus outbreak occurred. The top panel of Chart I-3 illustrates that – at that time – the Chinese broad money impulse foreshadowed a revival in nominal industrial output from late 2019 until mid-2020. In the second half of this year, however, the same indicator projected renewed growth deterioration. Chart I-2EM Stocks And Currencies Are In A Trading Range: How Long Will It Last?
EM Stocks And Currencies Are In A Trading Range: How Long Will It Last?
EM Stocks And Currencies Are In A Trading Range: How Long Will It Last?
Chart I-3Without The Coronavirus Outbreak, Chinese Recovery Would Have Been Muted And Short-Lived
Without The Coronavirus Outbreak, Chinese Recovery Would Have Been Muted And Short-Lived
Without The Coronavirus Outbreak, Chinese Recovery Would Have Been Muted And Short-Lived
Notably, the broad money impulse has often led the credit and fiscal spending impulse, and it currently signals a rollover in the latter sometime in the first half of 2020 (Chart I-3, bottom panel). Chart I-4EM Corporate Profits: Modest And Temporary Improvement
EM Corporate Profits: Modest And Temporary Improvement
EM Corporate Profits: Modest And Temporary Improvement
Consistently, China’s narrow money growth had been projecting a muted and only temporary rebound in EM corporate profits – which are often driven by the Middle Kingdom’s business cycle – from late 2019 until the middle of 2020 (Chart I-4). Thereafter, EM profit growth was set to relapse anew. In short, even prior to the coronavirus outbreak, our indicators were signaling that any economic improvement on the back of the Chinese government’s 2018-19 stimulus would have been muted and short-lived from late 2019 until mid-2020. Hence, the negative shock from the public health emergency could end up nullifying the pending recovery. 2. Structurally, as we have written extensively, China has enormous credit and money excesses. The economy has become addicted to rampant money and credit creation. This, along with the misallocation of capital and the resulting growth in the number of zombie companies, makes the system vulnerable, even to moderate shocks. It is reasonable to assume that there are some companies that enjoy great financial health, some zombies that are unable to service their debt at all, and a certain number of enterprises that generate just enough cash flow to service their debt. While the coronavirus-induced downtrend in the economy will not materially change the financial status of healthy or zombie businesses, it will likely alter the financial standings of debtors that were on the proverbial edge. Assuming the unavoidable drop in cash flows due to the country’s sudden shutdowns, these debtors will struggle to service their debt. This will likely alter their short-to-midterm decision making. For example, if they were planning to expand their operations and hire more employees, these plans are likely to be shelved for now. Low and falling willingness among households to consume and among enterprises to invest and hire could overwhelm the positive boost from the stimulus. In short, the coronavirus-induced shutdowns are cutting into cash flows, but they do not in any way reduce debt burdens. Chart I-5 illustrates that debt servicing costs as a share of income for companies and households in China are among the highest in the world. Chart I-5China Has A High Debt Service-To-Income Ratio
China Has A High Debt Service-To-Income Ratio
China Has A High Debt Service-To-Income Ratio
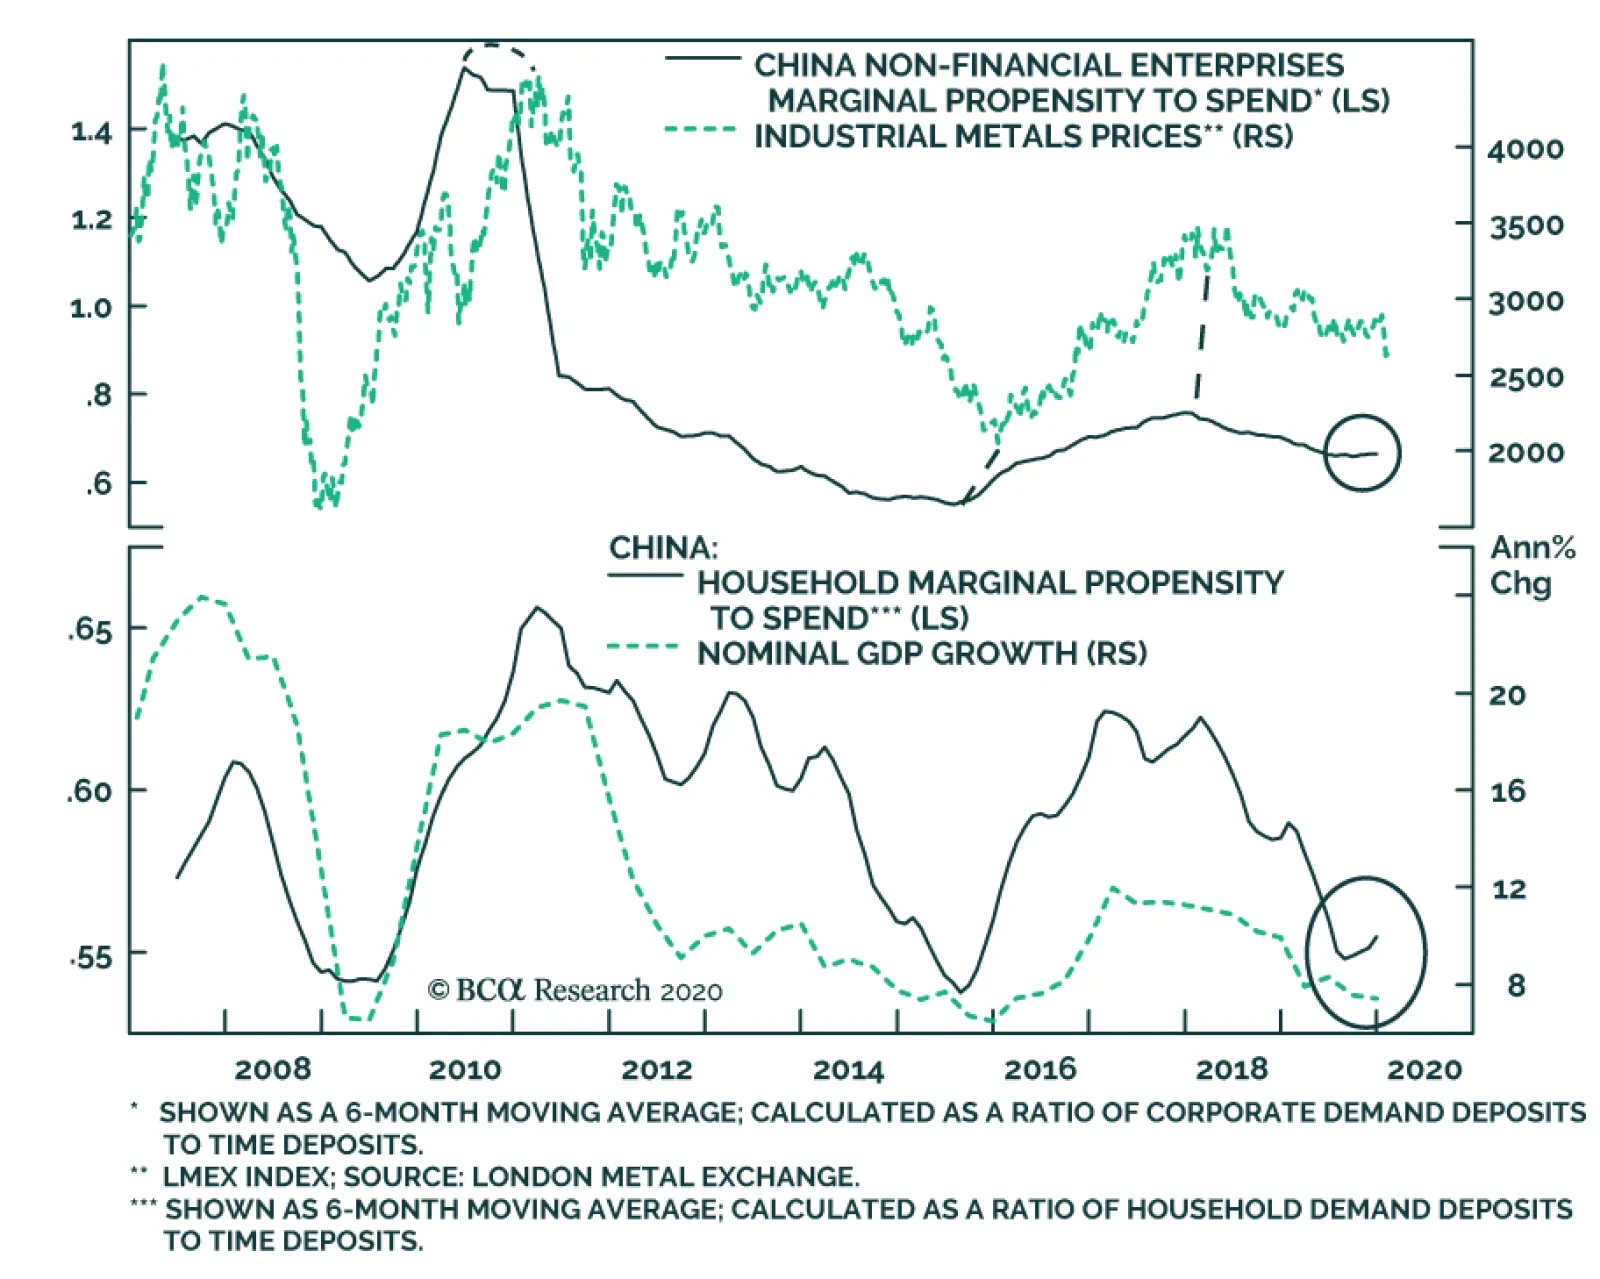
Notably, this measure for China is relative to nominal GDP while for other countries it is relative to disposable income. Disposable income is smaller than GDP as it takes into account taxes paid. Therefore, on a comparable basis, this ratio for China will be meaningfully higher than the one shown on Chart I-5. Bottom Line: Provided the Chinese economy is highly leveraged, it is reasonable to conjecture that the recovery following the adverse shock from the coronavirus will be U- rather than V-shaped. Stimulus: Yes. Multiplier: Unknown. It is a given that the Chinese authorities will inject more fiscal and monetary stimulus into the system. Nevertheless, the ultimate size of stimulus is unknown. So far, the following has been announced: On the monetary and credit side: A RMB300 billion re-lending quota to supply special low-cost funds to assist national commercial banks and local banks to provide preferential interest rate loans to key enterprises for epidemic prevention and control; On February 3, open market operation rates were cut by 10 basis points, and the key 7-day repo rate fell by 45 basis points; The People’s Bank of China injected liquidity1 via open market operations; The People’s Bank of China encouraged banks to lower lending costs for small and medium enterprises by 10% in some provinces. Critically, the banking regulatory authority has indicated it will allow an extension of the transition period for the implementation of the New Asset Management Regulation beyond 2020. Chart I-6Marginal Propensity To Spend Varies From Cycle To Cycle
Marginal Propensity To Spend Varies From Cycle To Cycle
Marginal Propensity To Spend Varies From Cycle To Cycle
On the fiscal side: Additional local government debt quotas of RMB848 billion have been approved, on top of the previously authorized quota of RMB1 trillion in November 2019; the front-loaded debt quota will offer local governments more flexibility with their budgets and support growth via public investment; Cumulatively about RMB66 billion in supplementary funds has been deployed to support local governments and businesses, according to the Ministry of Finance; The authorities have delayed or partially waived taxes, social security fees, and government-owned rents for affected businesses; The government has instituted refunds of unemployment insurance premiums to enterprises who retain most employees in some cities; The central government will provide temporary interest rate relief (equivalent to 50% of the re-lending policy rate) on loans to key enterprises involved in the fight against the epidemic. However, stimulus in and of itself is not a sufficient condition on which to bet on a V-shaped recovery. Stimulus (or in the opposite scenario, tightening) does not always immediately entail an economic recovery (or on the flip side, a downturn). For one, policy stimuli always work with a time lag. In addition, the size of stimulus is still unknown. What’s more, the multiplier of the stimulus varies from cycle to cycle. Chart I-7Chinese Households Are Indebted
Chinese Households Are Indebted
Chinese Households Are Indebted
We gauge the magnitude of any stimulus in China by observing money, credit and fiscal spending impulses. The multiplier is in turn contingent on economic agents’ (households and enterprises) propensity to spend. The impact of a large amount of stimulus can be offset by a low/falling marginal willingness to spend (a lower multiplier). Before the coronavirus outbreak, the marginal propensity to spend in China had improved slightly for households and had barely stabilized in the case of companies (Chart I-6). It is plausible to assume that a negative shock to confidence will likely dent both households’ and companies’ marginal propensity to consume. This is especially true since both economic agents are highly leveraged, as discussed above (Chart I-7). Finally, the leads and lags between the measures of stimulus like money impulses or credit and fiscal spending impulses and EM stocks in general and Chinese share prices in particular are not constant, as illustrated in Chart I-8 and Chart I-9. Chart I-8China: Share Prices And Money Impulse
China: Share Prices And Money Impulse
China: Share Prices And Money Impulse
Chart I-9EM Stock Prices And China Credit And Fiscal Impulse
EM Stock Prices And China Credit And Fiscal Impulse
EM Stock Prices And China Credit And Fiscal Impulse
Bottom Line: Forthcoming stimulus is not a surefire guarantee of an immediate cyclical rally – neither for EM risk assets and currencies, nor for other China-related plays. This does not mean that a rally will not occur. Rather, gauging the timing and potential drawdown that precede it are almost impossible. The basis is that low and falling willingness among households to consume and among enterprises to invest and hire could overwhelm the positive boost from the stimulus. Unfortunately, forecasting changes in willingness to spend is not straightforward. Investment Strategy Chart I-10An Inconclusive Message From This Reliable Indicator
An Inconclusive Message From This Reliable Indicator
An Inconclusive Message From This Reliable Indicator
We are currently neutral on EM stocks in absolute terms. We will be watching for market-based indicators to signal a breakout or breakdown and will adjust our strategy accordingly. One of our favorite indicators – the Risk-On /Safe-Haven currency ratio – is presently inconclusive (Chart I-10). Relative to DM, EM share prices broke to new lows last week as illustrated in Chart I-1 on page 1. We continue recommending an underweight position in EM within a global equity portfolio. Consistently, we are reiterating our long-standing short EM / long S&P 500 strategy. The US dollar’s technical profile is bullish (Chart I-11), which entails that its bull market is not yet over. We continue shorting an equally-weighted basket of BRL, CLP, COP, ZAR, KRW, IDR and PHP against the US dollar. We are also short the CNY versus the greenback on a structural basis. Within the EM currency space, we favor the MXN, RUB, CZK, THB and TWD. Finally, EM exchange rates hold the key to the performance of both EM local currency and US dollar bonds. Given our negative view on the currency, we are reluctant to chase the decline in domestic bond yields and narrowing spreads in the sovereign credit space (Chart I-12). Chart I-11The US Dollar Rally Is Intact
The US Dollar Rally Is Intact
The US Dollar Rally Is Intact
Chart I-12EM: Local Bond Yields And Sovereign Spreads Are Too Low
EM: Local Bond Yields And Sovereign Spreads Are Too Low
EM: Local Bond Yields And Sovereign Spreads Are Too Low
Arthur Budaghyan Chief Emerging Markets Strategist arthurb@bcaresearch.com Turkey: Doubling Down On Unsound Policies Despite the steep drop in oil prices, Turkish stocks have failed to outperform the EM equity benchmark (Chart II-1). When a market fails to outperform amid a historically bullish backdrop, it is often a sign of trouble ahead. The basis for the decoupling between Turkey’s relative performance and oil prices is President Erdogan’s doubling down on populist and unorthodox macro policies. He is eager to boost growth at any cost. As a litmus test of aggressive expansionist policies, local currency broad money growth has already surged to 24% (Chart II-2). In brief, these overly expansionary policies will undermine the currency, lift inflation and lead to a further exodus of investors from the country’s financial markets. Chart II-1A Bearish Sign For Turkish Equities
A Bearish Sign For Turkish Equities
A Bearish Sign For Turkish Equities
Chart II-2Turkey: Rampant Money Creation
Turkey: Rampant Money Creation
Turkey: Rampant Money Creation
Chart II-3Turkey: Booming Fiscal Spending
Turkey: Booming Fiscal Spending
Turkey: Booming Fiscal Spending
First, the central bank has cut interest rates to below inflation. The outcome is negative policy rates in real terms. Moreover, the central bank has resumed plentiful liquidity provisioning to banks to prevent interbank rates from rising. Second, government expenditures are surging (Chart II-3). Ballooning government borrowing is largely being financed by commercial banks – i.e., the latter are involved in outright monetization of public debt (Chart II-4, top panel). Chart II-4Public Debt Monetization By Commercial Banks
Public Debt Monetization By Commercial Banks
Public Debt Monetization By Commercial Banks
In the past two years, banks have purchased some TRY 250 billion of government bonds. This has boosted their share of holdings of government local currency bonds from 45% to 58% (Chart II-4, bottom panel). This has not only capped local bond yields, but also enormously expanded money supply. When a commercial bank purchases a bond from a non-bank entity, it creates a new deposit (broad money supply), as we discussed in November 29, 2018 report. The authorities have also announced tax cuts on various consumer goods in order to boost consumption. This is leading to a resurgence in consumer goods imports. In short, the trade balance is bound to widen again as domestic consumption resumes. Third, the government is forcing both state-owned and private banks to substantially boost credit flows to the economy. Last week, the AKP proposed a new banking bill that could force banks to fund large-scale projects. Further, the banking regulator is penalizing banks that fail to meet a “credit volume criteria’ by lowering the interest rate banks receive on their required reserves at the central bank. Crucially, the authorities are forcing banks to cut lending rates. Banks’ net interest rate margins have declined to all-time lows (Chart II-5). It will narrow further as they continue to cut lending rates, while holding deposit rates high to avoid flight from local currency deposits into US dollars. Banks, especially public ones, have dramatically accelerated their credit origination. This will lead to capital misallocation and potentially to non-performing loans (NPLs). On banks’ balance sheets, NPLs have been, and will remain, artificially suppressed. Neither banks nor regulators are incentivized to provision for potential loan losses. Insolvent banks can operate indefinitely so long as their shareholders and regulators allow it, and the central bank provides sufficient liquidity. This will most certainly be the case in Turkey in the years to come. Constraints in such a scenario are surging inflation and currency devaluation. Turkish authorities have whole-heartedly opted for these lax fiscal, monetary and bank regulatory policies. This entails that inflation and currency devaluation are unavoidable. Overly expansionary policies will undermine the currency, lift inflation and lead to a further exodus of foreign investors from the country’s financial markets. Lastly, surging wages and unit labor costs corroborate that inflationary pressures are genuine and rampant (Chart II-6). The minimum wage is set to increase by another 15% this year. Chart II-5Banks' Net Interest Margins At All Time Lows
Banks' Net Interest Margins At All Time Lows
Banks' Net Interest Margins At All Time Lows
Chart II-6Turkey: Wages Are Surging
Turkey: Wages Are Surging
Turkey: Wages Are Surging
The government has been trying to regulate prices in the consumer sector by putting administrative price caps in place. Yet inflation remains persistently high in both goods and services sectors. Investment Recommendation Chart II-7Excessive Stimulus Is Bearish For The Lira
Excessive Stimulus Is Bearish For The Lira
Excessive Stimulus Is Bearish For The Lira
The Turkish lira is again on a precipice. Only government intervention can temporarily prevent a major down leg. We are reiterating our underweight call on Turkish stocks within an EM equity portfolio. As a new trade, we are recommending a short Turkish banks / long Russian banks position. In contrast to Turkey, Russia’s macro policies have been, and remain, extremely orthodox. The new Russian government is poised to boost fiscal stimulus and the economy will accelerate with low inflation. We will discuss Russia in next week’s report. Finally, a surging fiscal and credit impulse in Turkey often leads to higher inflation and downward pressure on the currency (Chart II-7). As such, local currency government yields offer little protection at these levels against a depreciating currency. Therefore, investors should underweight the Turkish currency, local fixed-income and sovereign credit relative to their respective EM benchmarks. Andrija Vesic Research Analyst andrijav@bcaresearch.com Footnotes 1 We published A Primer On Liquidity on January 16, 2020 illustrating that the linkages from liquidity provisions by central banks and both increased spending in the real economy and higher asset prices are ambiguous. Equities Recommendations Currencies, Credit And Fixed-Income Recommendations
Highlights Global Growth & Market Volatility: Fears over global growth have pushed government bond yields lower as markets discount dovish monetary policy responses to the China viral outbreak. That combination may, perversely, be helping keep risk assets stable, even as investors try to assess the potential hit to global growth from a sharp China demand shock, through lower interest rate and currency volatility. Tactical Trade Overlay: We are in the process of revamping our Tactical Trade Overlay framework, thus we are closing all our recommended current positions this week. We will begin unveiling the new trade selection process - with more specific rules on idea development, holding period, security selection and performance measurement - in the coming weeks. Feature Chart of the WeekLow Inflation Sustaining The Low Volatility Backdrop
Low Inflation Sustaining The Low Volatility Backdrop
Low Inflation Sustaining The Low Volatility Backdrop
The timing of the coronavirus outbreak in China has introduced uncertainty into what was looking like a true bottom in global growth after the 2019 slowdown. The epicenter of that improvement seen in measures like the global PMI was China, where not only was there a visible pickup in soft data like the manufacturing PMI about also hard data like import growth. The coronavirus outbreak - and the severe actions to contain its spread via widespread quarantines, factory shutdowns, supply chain disruptions and travel bans – has most likely triggered a “sudden stop” in Chinese economic growth in the first quarter of the year that will spill over beyond China’s borders. This could potentially snuff out the nascent 2020 global growth recovery if the virus is not soon contained. Global government bond markets, however, have already discounted a fairly sharp slowdown in global activity. 10-year US Treasury yields are back below 1.6%. Inflation expectations across the developed economies remain well below central bank targets and short-term interest markets are discounting additional rate cuts to varying degrees. This has created a backdrop of relative tranquility in interest rate and currency markets, with option implied volatilities for the latter back to post-crisis lows (Chart of the Week). Perversely, the shorter-term uncertainty surrounding the coronavirus outbreak may have created a backdrop for risk assets to stay resilient, by reducing the more longer-lasting uncertainty that comes from interest rate and currency market volatility. Perversely, the shorter-term uncertainty surrounding the coronavirus outbreak may have created a backdrop for risk assets to stay resilient, by reducing the more longer-lasting uncertainty that comes from interest rate and currency market volatility. If the virus is contained and the hit to the world economy limited to just the first quarter of the year, then our underlying thesis of faster growth underpinning another year of global corporate bond market outperformance versus government bonds will remain intact. Extending The “Sweet Spot” For Global Risk Assets Chart 2How Low Will These Go?
How Low Will These Go?
How Low Will These Go?
Investors are right to be worried about the potential hit to the global economy from China. Prior to the outbreak of the coronavirus, a modest improvement in Chinese import demand was underway that was finally starting to put a floor under global trade activity after the sharp 2019 downturn (Chart 2). Without that boost from Chinese demand, the world economy will be far less likely to recover in 2020. BCA Research’s Chief Investment Strategist, Peter Berezin, has attempted some back-of-the-envelope calculations to determine the potential hit to global growth from a “sudden stop” of China’s economy from the coronavirus.1 Assuming that real GDP growth will essentially be zero in the first quarter of 2020, Peter calculates that global growth will slow to 1.7% in Q1 – or one-half the IMF’s expected average growth rate for 2020 of 3.4%. The bulk of that effect comes from the direct impact of Chinese growth slowing from a trend pace of 5.5% in Q1, but that also includes spillover effects to the rest of the world from weaker Chinese spending on imported goods and tourism (Chart 3). Chart 3Chinese GDP Growth Will Plunge In Q1, But Should Recover In The Remainder Of 2020 - Provided The Coronavirus Outbreak Is Contained
Slow & Steady Wins The Race
Slow & Steady Wins The Race
Importantly, Peter sees Chinese and global growth recovering during the rest of 2020, if the virus is contained by the end of March. The potential hit to overall global growth this year would only be 0.3 percentage points under that scenario. There is obviously a lot of uncertainty involved in making such estimates, from the timing of the spread of the virus to the potential monetary and fiscal policy responses from China (and other nations) to boost growth. Yet a total hit to global growth of only 0.3 percentage points would be fairly modest and may not end up derailing the signs of an economic rebound seen in indicators like the ZEW economic sentiment surveys. The individual country expectations component of the ZEW survey have shown solid improvements for the US, the UK, the euro area and even Japan over the past few months (Chart 4). Also, the current conditions component of the ZEW survey was just starting to bottom out in the most recent readings in the US, the UK and euro area. We have found that the spread between those two measures (ZEW current conditions minus expectations) is a reliable coincident indicator of year-over-year real GDP growth in the countries surveyed. Chart 4Will The Coronavirus Delay, Or Derail, The Recovery Process?
Will The Coronavirus Delay, Or Derail, The Recovery Process?
Will The Coronavirus Delay, Or Derail, The Recovery Process?
As of the latest read of the data from mid-January – importantly, before the start of the more widespread media coverage of the viral outbreak in China – the “current conditions minus expectations gap” from the ZEW survey was still trending downward (Chart 5). Chart 5The ZEW "Current Vs Expected" Gap Is Still Signaling Soft Global Growth
The ZEW "Current Vs Expected" Gap Is Still Signaling Soft Global Growth
The ZEW "Current Vs Expected" Gap Is Still Signaling Soft Global Growth
In other words, the boost in expectations had not yet translated into in a larger pickup in current economic activity. The risk now is that the turnaround in that gap, and in global GDP growth, will be delayed by a severe pullback in Chinese demand. The response of global business confidence to the virus is critical. According to the Duke University CFO Global Business Outlook survey taken at the end of 2019, more than half (52%) of US CFOs believe the US will be in an economic recession by the end of 2020, and 76% predict a recession by mid-2021. These numbers are similar to the 2018 survey, where 49% of CFOs thought a recession was likely by the end of 2019 and 82% predicted a recession by the end of 2020. The “CFO recession odds” are even larger outside the US, particularly in Asia and Latin America (Chart 6). Chart 6Duke/CFO Survey Respondents' 1-Year-Ahead Probability Of A Recession
Slow & Steady Wins The Race
Slow & Steady Wins The Race
The Duke CFO survey also asks a question on CFO optimism about the outlook for their own businesses. That data, measured on a scale of 0 to 100, shows that companies remain relatively optimistic about their own companies (Chart 7). The levels of optimism at the end of 2019 were roughly the same as at the end of 2018, except for the US where CFO optimism has soared above the highs seen prior to the 2008 financial crisis (Chart 8). Chart 7Duke/CFO Survey Respondents’ Own Company Optimism Level
Slow & Steady Wins The Race
Slow & Steady Wins The Race
Chart 8US Companies Are Thinking Globally, But Acting Locally
US Companies Are Thinking Globally, But Acting Locally
US Companies Are Thinking Globally, But Acting Locally
The interesting implication of this data is that a considerable number of global companies has believed that recession was “only a year or two away” since the end of 2018, but have not expressed similar pessimism when it comes to their own businesses. The extreme financial market volatility at the end of 2018 likely explains why investors thought a recession was likely in 2019 or 2020, while the US-China trade war last year meant those recession fears were “extended” into 2020 and 2021. Yet one big variable changed over that period since the end of 2018 – global monetary policy was eased significantly and bond yields (i.e. borrowing costs) fell sharply for both governments and companies. Looking ahead, the likely policy response to the sharp fall in Chinese growth in Q1/2020 will be continued dovishness from global central bankers. With the US dollar now firming again, in what is shaping up to be a typical response of the greenback to slower global growth expectations, the reflation narrative that was brewing for 2020 has been postponed (Chart 9). With the US dollar now firming again, in what is shaping up to be a typical response of the greenback to slower global growth expectations, the reflation narrative that was brewing for 2020 has been postponed. A softer US dollar is a necessary ingredient for that reflation. Thus, a stable-to-firmer dollar will keep global inflation pressures muted, allowing central banks to maintain their current dovish policy biases. This will help keep market volatility for bonds, currencies and equities subdued – if the China demand shock to global growth is contained to the first quarter. From a fixed income investment perspective, an extended period of low rates/currency volatility, combined with very low government yields already reflecting a sharp global growth slowdown that is not yet assured, is an ideal “sweet spot” backdrop for corporate credit spreads to remain relatively stable. From a fixed income investment perspective, an extended period of low rates/currency volatility, combined with very low government yields already reflecting a sharp global growth slowdown that is not yet assured, is an ideal “sweet spot” backdrop for corporate credit spreads to remain relatively stable (Chart 10). Chart 9Renewed USD Strength Would Delay Global Reflation
Renewed USD Strength Would Delay Global Reflation
Renewed USD Strength Would Delay Global Reflation
We continue to recommend a strategic (6-12 months) overweight allocation to corporate credit versus government bonds for global fixed income investors, focused on high-yield credit in the US. Chart 10Still A Sweet Spot For Global Credit
Still A Sweet Spot For Global Credit
Still A Sweet Spot For Global Credit
Bottom Line: Fears over global growth have pushed government bond yields lower as markets discount dovish monetary policy responses to the China viral outbreak. That combination may, perversely, be helping keep risk assets stable, even as investors try to assess the potential hit to global growth from a sharp China demand shock, through lower interest rate and currency volatility. A Quick Note: Rebooting Our Tactical Trade Overlay Framework Back in 2016, we introduced a part of our service that was separate from our main framework which emphasized medium-term (6-12 month) investment recommendations.2 We called this piece our Tactical Trade Overlay and it was intended to focus on ideas with shorter-term horizons (less than 6-months) with specific “exit strategies”. The majority of past trades included in the Overlay did fit that description. The current list of open positions, however, has drifted away from the original mandate with recommendations now being held far longer than six months. We are in the process of developing a new framework for the Tactical Trade Overlay, with more specific rules on idea development, holding period, security selection and performance measurement. Thus, this week, we are closing out all the recommendations currently in the Overlay (see the table on page 12). The goal is to create a list of trade suggestions for our clients with the capability and/or mandate to seek out “quicker” ideas that can also be implemented in more liquid instruments whenever possible. The new Overlay will also include ideas from smaller fixed income markets not included in our Model Bond Portfolio (i.e. New Zealand or Sweden), but with the same focus on holding periods of six months or less. We will be introducing the new Tactical Overlay framework over the next few months. We plan on publishing separate reports covering the new process for selecting ideas for different types of fixed income trades, similar to the current groupings in the Overlay (rates trades, yield curve trades, relative value trades, inflation trades). The first such report, to be published by the end of February, will introduce a methodology for identifying yield curve trades in global government bond markets. Robert Robis, CFA Chief Fixed Income Strategist rrobis@bcaresearch.com Footnotes 1 Please see BCA Research Global Investment Strategy Weekly Report, "From China To Iowa", dated February 7, 2020, available at gis.bcaresearch.com. 2 Please see BCA Research Global Fixed Income Strategy Special Report, "GFIS Overlay Trades Review", dated October 4, 2016, available at gfis.bcaresearch.com. Recommendations The GFIS Recommended Portfolio Vs. The Custom Benchmark Index
Slow & Steady Wins The Race
Slow & Steady Wins The Race
Duration Regional Allocation Spread Product Tactical Trades Yields & Returns Global Bond Yields Historical Returns
Yesterday, BCA Research's US Investment Strategy service analyzed the coronavirus outbreak. For now, our base case is that the global growth recovery will be delayed, though we expect growth will pick up later this year, provided that the outbreak begins to…
The latest Chinese CPI number was emblematic of the issues faced by Beijing. While CPI excluding food remains at a tame 1.6%, surging food prices have pushed the headline CPI number to 5.4%. Slow growth, elevated food inflation, and now a public health crisis…
Highlights The coronavirus is a real threat for the global economy and financial markets: We expect that the epidemic will be contained before it takes too much of a bite out of global output, but it has become the biggest market wild card. We are watching for a peak in new infections as a tell for when markets may move on from it. Earnings season was once again a ho-hum affair: S&P 500 earnings per share are on track to post 2% growth in 4Q19, about three percentage points above downwardly revised estimates. Profit margin contraction was in line with the previous three quarters. The biggest banks don’t see any immediate signs of credit problems, … : Net charge-off and non-performing loan ratios remain very low and the banks don’t see borrower performance worsening any time soon. … and think an uptick in business confidence is overdue: The banks’ calls occurred before the coronavirus broke out, but every management team saw the easing of trade tensions as a prelude to a pickup in corporate confidence. While We Were Out Chart 1Risk Off, Everywhere But Stocks
Risk Off, Everywhere But Stocks
Risk Off, Everywhere But Stocks
We last published a Weekly Report on January 6th, and the ensuing five weeks have been anything but boring. The US assassinated Iran’s foremost military leader, escalating the two nations’ conflict; and the coronavirus burst forth in China’s ninth-largest city, sparking worldwide concerns. The VIX awakened, Treasury yields slid, crude oil swooned and the dollar surged, but the S&P 500 only declined 3% trough to peak, and now sits 2-3% above its January 6th close (Chart 1). The coronavirus is a significant threat to the global economy and global markets, and geopolitical tensions have escalated, but the underpinning of our market views has not changed. We continue to view monetary policy as the critical swing factor for financial markets and the macro cycles that influence them. Assuming the coronavirus or another exogenous event does not tip over the US economy, the next recession will not begin until monetary policy settings turn restrictive. Nothing that has happened since the beginning of year has changed our view that the Fed is almost certain not to hike rates before its November meeting, and we think it is unlikely that it will do so at all in 2020. As long as monetary policy remains accommodative, the economy will keep expanding, the equity bull market will roll on, and spread product will continue to generate excess returns over Treasuries and cash. When China Gets Locked Down It has long been said that when the US sneezes, the rest of the world catches a cold. Conversely, challenges in the rest of the world often fail to leave much of a mark on the US. Should US investors really be that concerned about a virus outbreak in China? The answer is yes, despite the S&P 500’s surge last week. There is no such thing as full-on decoupling, even for the US. The US may respond to global events with a longer lag than more export-oriented economies, but they eventually have an impact. Investors should bear in mind that the S&P 500 is considerably more attuned to global conditions than the domestic economy, given that more than a third of its revenues come from abroad. The coronavirus outbreak has turned into the main source of market uncertainty and is the largest risk to our bullish view on global growth and risk assets. For now, our base case is that the global growth recovery will be delayed, though we expect growth will pick up later this year, provided that the outbreak begins to recede by the end of March. That base case is heavily data-dependent, however, subject to the disease’s course and the Chinese government’s response. From a market perspective, tracking the number of new infections may provide a window on investor sentiment. In 2003, the bottom in equities coincided with the peak in the number of new SARS infections (Chart 2). However, a direct analogy between 2003 and 2020 may underplay the impact on growth. China exerts a lot more influence on the global economy than it did at the turn of the millennium (Table 1). A turn in investor sentiment may not be enough to support risk assets in the face of a significant growth headwind. Chart 2Infections Peak, Market Troughs
Infections Peak, Market Troughs
Infections Peak, Market Troughs
Table 1China’s Importance Now And In 2003
Back To The Grind
Back To The Grind
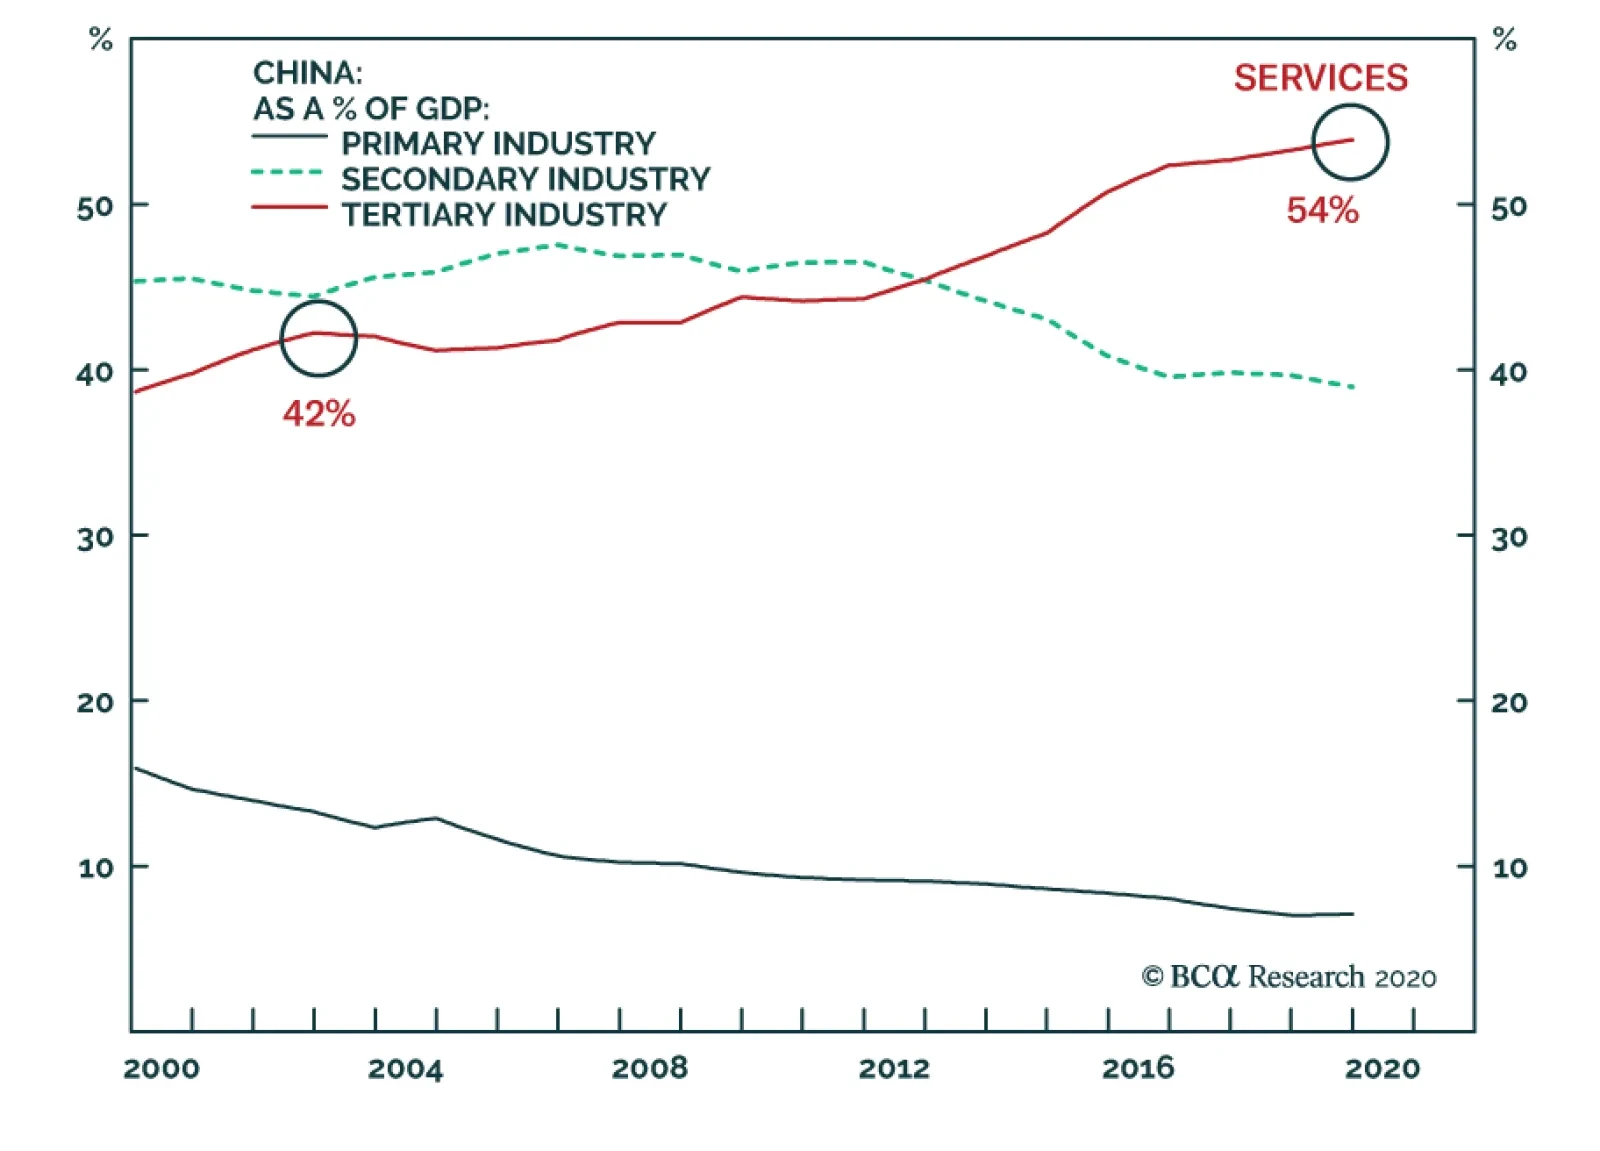
Since it entered the World Trade Organization in 2001, China has grown from being the sixth-largest economy to the second, trailing only the US. It now accounts for 16% of global GDP in dollar terms. Its total imports of goods and services – the main growth transmission mechanism from China to the rest of the world – currently account for 13.5% of global trade, three times its 2002 share. The scale of the Chinese government response is also very different. While the SARS epidemic caused relatively mild disruptions to the travel and retail sectors, quarantines have put some areas in total lockdown, placing meaningful elements of the country’s overall production on indefinite hold. That’s bad enough from a domestic perspective, but it could swiftly lead to a sharp reduction in global manufacturing output if it derails global supply chains that depend on Chinese-produced components. Last week, Hyundai idled a production line in South Korea for lack of essential China-sourced parts, and Fiat Chrysler has warned that it might have to close a European factory in two to four weeks if critical Chinese suppliers are not able to operate. China exerts considerably more influence on the global economy today than it did in 2003. Extended quarantines will have a readily observable impact. Chart 3Services Now Account For A Majority Of Chinese Output
Services Now Account For A Majority Of Chinese Output
Services Now Account For A Majority Of Chinese Output
Moreover, this time around the outbreak coincided with the Lunar New Year celebration, when spending on services is usually elevated. Services engender less pent-up demand than durable goods; while demand for durables may merely be deferred until the epidemic is contained, demand for services is much more likely to be destroyed. Nonmanufacturing sectors’ increasing importance in the Chinese economy (Chart 3) implies that relative to 2003, less "lost" spending will be made up later. Using SARS’ impact on Chinese GDP to support a back-of-the-envelope estimate, our Global Investment Strategy colleagues judge that the coronavirus could zero out Chinese growth in the first quarter. Our Global Fixed Income Strategy service estimates that major country sovereign bonds are pricing in two months of lost Chinese growth. The prospect of a stagnant two to three months could well force policymakers to focus exclusively on encouraging growth. They have already signaled they will pull forward some scheduled infrastructure investments, and our China strategists note that 2020 is policymakers’ deadline for meeting their target to double GDP over the decade. Bottom Line: The coronavirus outbreak is a serious threat to the global economy and financial markets, but we do not expect that it will induce a US recession or S&P 500 bear market. The Same Old Earnings Song-And-Dance Chart 4A Typical Quarter
Back To The Grind
Back To The Grind
With 305 of the companies in the S&P 500 having reported earnings through last Thursday’s open, the fourth quarter appears to be nearly exactly like the first three quarters. Earnings growth was nothing to write home about, but it’s tracking to be a few percentage points better than expected when the big banks kicked off reporting season (Chart 4). Revenue growth continues to be in step with nominal global GDP growth, but profit margins are contracting at about the same rate that they did in the first three quarters (Chart 5). The source of the margin contraction remains a mystery, and unraveling it is near the top of our research to-do list. Chart 5The Incredible Shrinking Profit Margin
Back To The Grind
Back To The Grind
Earnings don't matter much in the near term, but they've been good enough to allay the undercurrent of worry that was a prominent feature of the equity market all of last year. We have previously written about earnings’ limited effect on equity prices.1 In the near term, moves in the S&P 500 exhibit little to no correlation with either earnings growth or the magnitude of earnings beats. Earnings do matter in the long term, and the uneventful 4Q19 reports at least suggest that stocks give no indication of falling off their currently projected path. As has been the case throughout 2019, the bears’ worst fears failed to come to pass in the fourth quarter. Once the coronavirus is contained, accommodative monetary conditions should help keep them at bay in 2020, as well. Follow The Money The big banks reported their fourth quarter earnings in mid-January, and the market reaction suggested their torrid fourth quarter run has fully played out, at least until long yields perk up again. Our review of their earnings calls is not meant to tell us anything about bank stocks, however. We review the calls to gain some insight into the lending market and where it might be headed, seeking color on banks’ willingness to lend, consumers’ and businesses’ appetite for credit, borrower performance, and the banks’ bottom-up perspective on the economy. This time around, we also wanted to hear if the brand-new CECL (Current Expected Credit Loss) loan-loss provisioning standard could constrain lending. 4Q19 Big Bank Beige Book As a group, the banks were constructive on the economy.2 They agree that the consumer is in fine fettle, and they see signs that corporate confidence is returning as trade tensions recede. Overall loan growth has dipped to 4% on a year-over-year basis (Chart 6), while corporate and industrial (C&I) loan growth has contracted on a thirteen-week basis (Chart 7). The C&I contraction is not a sign that corporations are circling the wagons, however, it’s simply that they’ve turned to the corporate bond market instead (Chart 8). Businesses seeking credit generally have access to all they want at tight spreads, given the paucity of yield in the ZIRP/NIRP era. Chart 6Overall Bank Lending Is Decelerating, ...
Overall Bank Lending Is Decelerating, ...
Overall Bank Lending Is Decelerating, ...
Chart 7... And C&I Lending Is Contracting, ...
... And C&I Lending Is Contracting, ...
... And C&I Lending Is Contracting, ...
Chart 8... But The Bond Market Is Capable Of Picking Up The Slack
... But The Bond Market Is Capable Of Picking Up The Slack
... But The Bond Market Is Capable Of Picking Up The Slack
Positive operating leverage was a mantra that all of the management teams recited. Branch footprints are being rationalized, and the biggest banks are successfully automating manual tasks and driving mundane activity to websites and apps and away from branches and ATMs. Shrinking branch counts could intensify the pressure at the margin for retail landlords, and automation could squeeze bank head counts. Every bank grew deposits faster than loans, furnishing them with dry powder for future lending, and padding their holdings of Treasury and agency securities in the meantime. Households And Businesses [S]entiment on the corporate side appears to be looking better. We’re going to be signing [the Phase I] trade agreement with China today, … and the US-Mexico-Canada agreement is well on its way. So I think that some of that uncertainty that might have been impacting discretionary spend on the commercial side of the equation has been alleviated. [W]e feel pretty good. (Dolan, USB CFO) Every bank cited trade tensions as a drag on corporate confidence last year, and pointed to USMCA and the Phase 1 agreement with China as a sign that it will rebound. [T]he US consumer remains in very strong shape, … from a credit perspective, sentiment, [and] spending, [and] obviously [the] labor market is very strong[.] [C]apital spending is still a bit soft, but sentiment is … certainly better than it was six months ago. [B]roadly speaking, [we have a] constructive outlook as we’re heading into 2020[.] (Piepszak, JPM CFO) [T]hroughout the year, we saw … a lot of things out there that [were] driving uncertainty, be it the lack of the China trade deal, USMCA, Brexit, Hong Kong and … now … the horizon looks like some of those things may clear[,] … and we [may] get a bit more action out of the C-suite. [T]he [capital markets] backlog looks pretty good[,] … [a]nd the forward calendar [does, too]. (Corbat, C CEO) [C]ustomers [in our consumer business] are coming off a strong [spending] finish in 2019. In addition, there’s good loan demand, … result[ing] from good employment levels and growing wages. We saw solid loan demand in our commercial client base throughout the year, [though it] moderated in the second half of the year as worries about global economic uncertainty … dragged on. Today we see some resolution of those issues and that combined with continued consumer strength leads us to expect to see businesses continue their solid activity and we’re hearing more optimism. All this provides a great backdrop[.] (Moynihan, BAC CEO) Borrower Performance Overall credit quality indicators in our commercial portfolio remained strong with our fourth quarter internal credit grades at their strongest levels in two years. Non-accrual loans … in the fourth quarter [were at] their lowest level in over ten years. (Shrewsberry, WFC CFO) [Credit quality metrics] show … that asset quality remained strong in [consumer and commercial] categories. (Donofrio, BAC CFO) [C]redit quality was stable in the fourth quarter. … The ratio of non-performing assets … improved linked quarter and year-over-year. (Dolan, USB) [CLO is] still an asset class that we feel comfortable with the risk/reward … in spite of where we are in the cycle[.] (Shrewsberry, WFC) [There’s nothing] we’re overly concerned about [in our own loan portfolio], given how [conservatively] we manage [lending], but we’re certainly paying attention to leveraged lending. We’re certainly paying attention to energy with respect to natural gas prices, we’re certainly looking at retail … malls. (Donofrio, BAC) CECL Impacts We would expect provisions to be a little higher than net charge-offs in 2020 due to CECL. … All else equal, [the new increased provision] would lower our Common Equity Tier 1 capital ratio by roughly 20 basis points[, but we have a sizable capital buffer, and the capital charge] is phased in … evenly through 2023. (Donofrio, BAC CFO) [I]t’s fair to say, under CECL, [that] you could have incremental volatility [of provisioning expenses]. [But] incremental volatility would [not] be material for us. … It’s just timing [of expense recognition, not any increase in expenses.] (Piepszak, JPM) [A]t this point, it’s not likely that [CECL would] change our appetite for longer-duration consumer loans[.] … [I]t hasn’t caused anything to drop below a hurdle level that says to us, we need to either meaningfully reprice it or … [consider] whether [we want to be] in the business. (Shrewsberry, WFC) Investment Implications Chart 9US Data Have Also Weighed On Yields
US Data Have Also Weighed On Yields
US Data Have Also Weighed On Yields
The coronavirus outbreak is a serious threat, but its very seriousness is likely to provoke Chinese policy responses that may better ensure a turnaround once it can be brought under control. Our view is subject to the real-time course of events on the ground, but our base case is that the business cycle and the bull markets in risk assets remain intact, even if they may sputter here and there until the epidemic is brought to heel. While we acknowledge that economic data have been spotty, and the decline in Treasury yields has not solely been a function of coronavirus fears (Chart 9), we think that yields are near the bottom of their likely 2020 range and have more scope to rise than fall from current levels. We continue to recommend below-benchmark duration positioning. We also continue to recommend that investors remain at least equal weight equities in balanced portfolios and at least equal weight spread product within bond portfolios. We would relish the chance to buy an S&P 500 dip to 3,000 if it were to occur when the coronavirus threat appeared to be manageable. Doug Peta, CFA Chief US Investment Strategist dougp@bcaresearch.com Jennifer Lacombe Senior Analyst JenniferL@bcaresearch.com Footnotes 1 Please see the November 11, 2019 US Investment Strategy Weekly Report, "Why Bother With Earnings?" available at usis.bcaresearch.com. 2 The calls were all held before the coronavirus outbreak.
Highlights The coronavirus is likely to cut global growth in half (from 3.3% to 1.7%) during the first quarter of 2020. Investors should brace for a slew of profit warnings over the coming weeks from companies with significant operations in China. The near-term economic data is also likely to disappoint. Provided the virus is contained (admittedly a big if), economic activity should recover quickly in the second quarter, leaving global growth about 0.3 percentage points lower for the year as a whole. We should have a better sense of who the Democratic presidential candidate will be by mid-March, by which time more than 60% of the delegates will have been awarded. We continue to recommend an overweight stance on global equities over a 12-month horizon, but do not have a strong conviction about the near-term direction of global bourses given the risks around the virus and the Democratic nomination. Green Shoots Delayed Coming into 2020, we expected global growth to accelerate thanks to the lagged effects of last year’s decline in bond yields, an improvement in the global manufacturing inventory cycle, diminished Brexit and trade war risks, and ongoing policy stimulus out of China. Consistent with this prediction, the manufacturing ISM surged this week, with the forward-looking new orders-to-inventories ratio rising to the highest level in 10 months. The non-manufacturing ISM also surprised on the upside, as did factory orders in December. To top it off, ADP employment rose by 291k in January, well above the consensus estimate of 157k. In the euro area, the manufacturing and services PMIs were both revised higher in January. The future output component of the euro area manufacturing PMI rose to 59.8, the highest level since August 2018. The Swedbank Swedish manufacturing PMI jumped to 51.5, easily topping the consensus estimate of 47.6. We have generally found that the Swedish manufacturing PMI leads the global PMI by one or two months. Meanwhile, the UK composite PMI hit a 16-month high. The Coronavirus: Gauging The Economic Impact Unfortunately, the outbreak of the coronavirus is likely to depress global growth over the next couple of months, and possibly longer if the brewing crisis is not contained. During the SARS epidemic in 2003, Chinese growth fell from 10.8% in Q1 to 5.5% in Q2 on a seasonally-adjusted quarter-over-quarter annualized basis – a decline of 5.3 percentage points – only to snap back to 14.7% in Q3. Given that trend growth in China is currently about 5%-to-6%, growth could grind to a halt in the first quarter of this year, if the SARS experience is any guide. This would bring the year-over-year GDP growth rate down to 4%-to-4.5%. While zero growth on a quarter-over-quarter basis in Q1 may sound dire, keep in mind that this would simply leave real output at the same level as in Q4 of last year. Considering the disruptions presently facing the Chinese economy, a prediction of zero quarterly growth could actually prove to be too optimistic. The outbreak of the coronavirus is likely to depress global growth over the next couple of months, and possibly longer if the brewing crisis is not contained. China now accounts for 16% of global GDP on a US dollar basis, compared to 4% in 2003. Thus, a 5.5 percentage-point decline in Chinese growth would arithmetically shave about 0.16*5.5=0.9 percentage points off of global growth. In addition, there will be spillovers from weaker Chinese growth to the rest of the world. Global goods exports to China stand at about 2.5% of world GDP compared to 0.9% of GDP in 2003 (Chart 1). Chinese import growth is about twice as volatile as GDP growth (Chart 2). Thus, a 5.5 percentage-point decline in Chinese GDP in Q1 would reduce global exports to China by 2*0.055*2.5=0.27% of GDP. Chart 1Chinese Demand Has Expanded Over The Years
Chinese Demand Has Expanded Over The Years
Chinese Demand Has Expanded Over The Years
Chart 2Imports Are More Volatile Than Domestic Production
Imports Are More Volatile Than Domestic Production
Imports Are More Volatile Than Domestic Production
China’s service imports will also decline, mainly due to a sharp drop in Chinese tourists travelling abroad. Overseas spending by Chinese residents rose from 0.05% of world GDP in 2007 to 0.33% of GDP in 2018. If tourist arrivals end up falling by 70% during the first quarter, this would shave a further 0.7*0.33=0.23 percentage points from global growth. On top of all this, there will probably be some multiplier effects from weaker Chinese growth on domestic spending. For example, a decline in Chinese tourism will reduce the income of hotel proprietors and their employees, leading to lower outlays by local residents. For an economy such as Thailand, where Chinese tourist spending accounts for over 3% of GDP, this effect is likely to be substantial. We subjectively pencil in an additional 0.2 percentage-point hit to Q1 global growth from this multiplier effect. As Chart 3 shows, this gives a total hit to growth of 1.6% in Q1. Going into this year, the IMF expected global growth to average 3.3% in 2020. This implies that growth could fall by half the IMF’s projected pace in the first quarter before recovering during the rest of the year. Chart 3Chinese GDP Growth Will Plunge In Q1, But Should Recover In The Remainder Of 2020 Provided The Coronavirus Outbreak Is Contained
From China To Iowa
From China To Iowa
Uncertainties Abound These estimates are subject to a large margin of error. On the positive side, the impact on global growth might be mitigated by the fact that most of the categories (aside from tourism) in which the Chinese are cutting back spending are in the service sector, and hence have relatively low import content. In addition, China is likely to further bolster policy stimulus in response to the crisis. The People’s Bank of China has injected additional liquidity into money markets, cut the 7-day repo rate, and indicated that it will further lower lending rates. Regulators have delayed the introduction of new rules and regulations in the financial sector. We also expect the authorities to boost fiscal spending, especially on health care, where China lags behind most other countries (Chart 4). Chart 4China: Public Spending On Health Care Has Room To Catch Up
From China To Iowa
From China To Iowa
On the negative side, the rising share of services in the Chinese economy means that some of the spending lost in Q1 will not be recouped during the rest of the year (unlike in the case of durable goods, there is little pent-up demand for say, restaurant meals). There is also a risk that spending outside China will decline if confidence drops and people begin to hunker down and save more. This is a particular risk in Japan where at least 30 people have contracted the virus (compared to zero during the SARS outbreak) and consumer confidence remains weak following the consumption tax hike. Lastly, global supply chains that rely on Chinese-produced components could be severely disrupted, leading to a downdraft in global manufacturing output. Needless to say, the impact of the outbreak depends critically on how long the epidemic lasts and how broad-based it ends up being. Our baseline assumption is that the outbreak will subside by the end of March. If that happens, growth will rebound in the remainder of the year, as occurred during the SARS episode. This will limit the overall hit to growth in 2020 to about 0.3 percentage points. As of now, the news is mixed. While the total number of new infections has dipped over the past two days in Hubei, where the outbreak originated, the trend in the province still appears to be on the upside. More encouragingly, the number of new infections seems to be stabilizing elsewhere in China and remains at very low levels in the rest of the world (Chart 5). From a markets perspective, tracking the number of new infections is important because it helped mark a bottom in stocks during the SARS outbreak (Chart 6). Chart 5The Number Of New Cases Seems To Be Stabilizing Outside Of The Epicenter
From China To Iowa
From China To Iowa
Chart 6Stocks Bottomed As The SARS Infection Rate Was Peaking
Stocks Bottomed As The SARS Infection Rate Was Peaking
Stocks Bottomed As The SARS Infection Rate Was Peaking
If the coronavirus follows a limited transmission path like MERS did, which did not spread much beyond the Middle East and South Korea, then worries about a pandemic will quickly abate. However, it is too early to make such a confident pronouncement, especially since this particular virus appears to be spreading more easily than either MERS or SARS. As such, we regard the risks to our GDP growth projection as tilted to the downside. Meanwhile, another potential risk is rising to the fore… The Democrats' B-List The Democratic presidential nomination is turning out to be a battle among four B’s: Bernie, Biden, Buttigieg, and Bloomberg. The big story from the Iowa caucus is how well Pete Buttigieg did and how poorly Joe Biden performed. Both Biden and Buttigieg are moderates. However, Biden fares much better in head-to-head polls against Trump than other Democratic challengers, including Buttigieg (Chart 7). Hence, anything that hurts Biden helps Trump. Chart 7For Now, Biden Is Trump’s Biggest Threat
From China To Iowa
From China To Iowa
The impact on the stock market would be small if either Biden or Buttigieg were to end up in the White House next year. While both of these Democrats have expressed an interest in reversing at least part of the Trump tax cuts, neither would be as hawkish on trade as Trump. For investors, this makes it a bit of a wash. What would clearly hurt the stock market is if Bernie Sanders were to become the next US president. Sanders brings a lot of baggage to the race, including having campaigned for the far-left Socialist Workers Party in the 1980s, while also honeymooning in Moscow at a time when Soviets had thousands of nuclear missiles pointed at the US. Yet, despite his checkered past, the Vermont senator has still beaten Trump in 48 of the last 53 head-to-head polls tracked by Realclearpolitics over the past 12 months. The reality is that the US is moving leftward on a variety of cultural and economic issues (Chart 8). This is unlikely to change anytime soon given the firm grip the left has over academia and most of the media (Charts 9A & B). All this benefits leftist candidates such as Bernie Sanders and Elizabeth Warren. Chart 8The US Is Moving To The Left
From China To Iowa
From China To Iowa
Chart 9AMany More Democrats Than Republicans In US Colleges
From China To Iowa
From China To Iowa
Chart 9BThe Vast Majority Of Journalists Are Left-Leaning
From China To Iowa
From China To Iowa
Battle Of The Billionaires This brings us to Mike Bloomberg. According to PredictIt, Bloomberg is now the second most likely candidate to emerge as the Democratic nominee after Bernie Sanders (Chart 10). Bloomberg’s nationwide polling numbers are quite poor, but unlike the other candidates, he has enough wealth to stay in the race for as long as he wants to. Chart 10Bloomberg As The Dark Horse?
Bloomberg As The Dark Horse?
Bloomberg As The Dark Horse?
Bloomberg can also do something the other candidates cannot: stage an independent bid for the White House. Bloomberg’s allegiance to the Democratic Party is fairly tenuous. He governed New York City as a Republican, after all. If Bernie Sanders emerges as the Democratic nominee, Bloomberg could try to run up the middle as the “moderate choice.” Granted, Bloomberg has promised to support whoever the Democratic nominee ends up being. But here is the irony: the best thing that Bloomberg could do for Sanders is run as an independent. According to BCA’s geopolitical team, Bloomberg would take more voters from Trump than he would from Sanders.1 Whether Bloomberg will try to sabotage Trump in order to help Sanders remains to be seen. Ideologically, Bloomberg is probably closer to Trump than he is to Sanders. However, the two billionaires hate each other, and this could ultimately prove to be the deciding factor. Investment Conclusions The short-term outlook for risk assets remains murky. It is too early to relax about the coronavirus. Even if the outbreak is contained, a lot of economic damage has already been done. Investors should brace for a slew of profit warnings over the coming weeks from companies with significant operations in China. The near-term economic data is also likely to disappoint. Then there are the US elections. We bucked the consensus view in 2015/16 by predicting that Donald Trump would become President. At the moment, however, we do not have a strong feeling about the outcome of this year’s contest. This is in contrast to many market participants who see a Trump victory as a foregone conclusion. At a recent Goldman conference, 87% of attendees expected President Trump to be re-elected.2 Our conversations with clients have revealed a similar bias. The S&P 500 has moved in lockstep with Trump’s chances of being re-elected (Chart 11). If Trump’s prospects begin to fade, while Bernie Sanders wins in New Hampshire and Nevada and outperforms in South Carolina, risk assets could suffer. Chart 11An Uncanny Correlation
An Uncanny Correlation
An Uncanny Correlation
Why, then, not turn bearish on stocks now? One reason, as noted above, is that global growth should pick up later this year provided the coronavirus is contained. Stocks generally outperform bonds when growth is accelerating (Chart 12). Equity risk premia also remain quite high, which gives stocks a cushion of support (Chart 13). Chart 12Stocks Usually Outperform Bonds When Global Growth Is Accelerating
Stocks Usually Outperform Bonds When Global Growth Is Accelerating
Stocks Usually Outperform Bonds When Global Growth Is Accelerating
Chart 13Relative Valuations Favor Stocks
Relative Valuations Favor Stocks
Relative Valuations Favor Stocks
All this leaves us in the somewhat uncomfortable position of continuing to advocate an overweight stance towards equities over a 12-month horizon, without having a strong view about the short-term direction for global bourses. Matters should be clearer by mid-March. Super Tuesday takes place on March 3rd. By March 17th, more than 60% of the Democratic delegates will have been awarded (Appendix Table 1). There should also be more clarity on the coronavirus outbreak by then too. At that point, we will reassess both our short-term and medium-term views on equities and other assets. Peter Berezin Chief Global Strategist peterb@bcaresearch.com Appendix Table 1Next Stops For The Democrat Caravan
From China To Iowa
From China To Iowa
Footnotes 1 Please see Geopolitical Strategy Weekly Report, “After Iowa And Impeachment? Questions From The Road,” dated February 7, 2020. 2 Theron Mohamed, “A Goldman Sachs client poll finds 87% expect Trump to win the next election,” Business Insider (January 17, 2020). Global Investment Strategy View Matrix
From China To Iowa
From China To Iowa
MacroQuant Model And Current Subjective Scores
From China To Iowa
From China To Iowa
Strategic Recommendations Closed Trades