China

Highlights Global growth is poised to accelerate this year, although the spread of the coronavirus could dampen spending in the very short term. History suggests that the likelihood of a recession rises when unemployment falls to very low levels. Three channels have been proposed to explain why that is: 1) Low unemployment can prompt households and businesses to overextend themselves, making the economy more fragile; 2) Faster wage growth stemming from a tight labor market can compress profit margins, leading to less capital spending and hiring; 3) Shrinking spare capacity can fuel inflation, forcing central banks to raise rates. The first channel is highly relevant for some smaller, developed economies where housing bubbles have formed and household debt has reached very high levels. However, it is not an immediate concern in the US, Japan, and most of the euro area. We would downplay the importance of the second channel, as faster wage growth is also likely to raise aggregate demand and incentivize firms to increase capital spending on labor-saving technologies. The third channel poses the greatest long-term risk, but is unlikely to be market-relevant this year. Investors should remain bullish on global equities over the next 12-to-18 months. A more prudent stance will be warranted starting in the second half of 2021. Global Equities: Sticking With Bullish Global equities are vulnerable to a short-term correction after having gained 16% since their August lows. Nevertheless, we continue to maintain a positive outlook on stocks for the next 12 months due to our expectation that global growth will gather steam over the course of the year. The latest data on global manufacturing activity has generally been supportive of our constructive thesis. The New York Fed Manufacturing PMI beat expectations, while the Philly Fed PMI jumped nearly 15 points to the highest level in eight months. The business outlook (six months ahead) component of the Philly Fed index rose to its best level since May 2018. European manufacturing should also improve this year. Growth expectations for Germany in the ZEW index surged in January, rising to the highest level since July 2015 (Chart 1). The Sentix and IFO indices have also moved higher. Encouragingly, euro area car registrations rose by 22% year-over-year in December. In the UK, business confidence in the CBI survey of manufacturers surged from -44 in Q3 of 2019 to +23 in Q4, the largest increase in the 62-year history of the survey. Fiscal stimulus and diminished risk of a disorderly Brexit should also bolster growth this year. Chart 1Some Green Shoots Emerging In The Euro Area
Some Green Shoots Emerging In The Euro Area
Some Green Shoots Emerging In The Euro Area
Chart 2EM Asia Is Rebounding
EM Asia Is Rebounding
EM Asia Is Rebounding
The manufacturing and trade data in Asia have been improving. Following last week’s better Chinese trade data, Korean exports recovered on a rate-of-change basis for a fourth month in a row. Japanese exports to China increased for the first time since last February. In Taiwan, industrial production increased by more than expected in December, as did export orders. Our EM Asia Economic Diffusion Index has risen to the highest level since October 2018 (Chart 2). Coronavirus: Nothing To Sneeze At? The outbreak of the coronavirus represents a potential short-term threat to the budding global economic recovery. Conceptually, outbreaks can affect the economy in two ways. One, they can reduce demand by curtailing spending on travel, entertainment, restaurants, or anything that requires close proximity to others. Two, they can reduce supply by causing people to avoid going to work. In practice, the first effect usually dominates the second. As a result, such outbreaks tend to have a deflationary impact. The Brookings Institution estimates that the 2003 SARS epidemic shaved about one percentage point from Chinese growth that year.1 The fact that this outbreak is happening during the Chinese New Year celebrations, when over 400 million people will be on the move, has the potential to exacerbate the transmission of the virus, and in the process, amplify the economic damage. That said, while it is from the same class of zoonotic viruses, early indications suggest that this particular strain is less lethal than SARS. In addition, the Chinese authorities have moved faster to address the risks than they did during the SARS outbreak. The government has effectively quarantined Wuhan, a city of 11 million people, where the virus appears to have originated. They have also sequenced the virus and shared the information with the global medical community. This has allowed the US Centers for Disease Control (CDC) to develop a test for the virus, which is likely to become available over the coming weeks. The Dark Side Of Low Unemployment Provided the coronavirus outbreak is contained, stronger global growth should continue to soak up lingering labor market slack. This raises the question of whether, at some point, declining unemployment could become counterproductive. The outbreak of the coronavirus represents a potential short-term threat to the budding global economic recovery. The unemployment rate in the OECD currently stands at 5.1%, below the low of 5.5% set in 2007 (Chart 3). In the US, the unemployment rate has dropped to a 50-year low. Chart 3Unemployment Rates Are Below Their Pre-Crisis Lows In Most Economies
Who’s Afraid Of Low Unemployment?
Who’s Afraid Of Low Unemployment?
No one would deny that the decline in unemployment since the financial crisis has been a welcome development. However, it does carry one major risk: Historically, the likelihood of a recession has risen when unemployment has fallen to very low levels (Chart 4). Chart 4Recessions Become More Likely When The Labor Market Begins To Overheat
Who’s Afraid Of Low Unemployment?
Who’s Afraid Of Low Unemployment?
Three channels have been proposed to explain this positive correlation: 1) Low unemployment can prompt households and businesses to overextend themselves, making the economy more fragile; 2) Faster wage growth stemming from a tight labor market can compress profit margins, leading to less capital spending and hiring; 3) Shrinking spare capacity can fuel inflation. This can force central banks to raise rates, choking off growth. Let’s examine each in turn. Unemployment And Irrational Exuberance Chart 5Growing Housing Imbalances In Some Economies
Growing Housing Imbalances In Some Economies
Growing Housing Imbalances In Some Economies
A strong economy promotes risk-taking. While some risk-taking is essential for capitalism, an excessive amount can lead to the buildup of imbalances, thereby setting the stage for an eventual downturn. In Australia, New Zealand, Canada, and the Scandinavian economies, the combination of low interest rates and strong economic growth has stoked debt-fueled housing bubbles (Chart 5, panel 3). As we discussed last week, higher interest rates in those economies could sow the seeds for economic distress.2 In most other countries, financial imbalances are not severe enough to trigger recessions. Chart 6 shows that the private-sector financial balance – the difference between what the private sector earns and spends – still stands at a healthy surplus of 3.4% of GDP in advanced economies. In 2007, the private-sector financial balance fell to 0.4% in advanced economies, reaching a deficit of 2% in the US. The private-sector balance also deteriorated sharply in the lead-up to the 2001 recession (Chart 7). Chart 6The Private Sector Spends Less Than It Earns In Most Economies
Who’s Afraid Of Low Unemployment?
Who’s Afraid Of Low Unemployment?
Chart 7The Private-Sector Surplus Is Larger Than It Was Before The End Of Previous Expansions
The Private-Sector Surplus Is Larger Than It Was Before The End Of Previous Expansions
The Private-Sector Surplus Is Larger Than It Was Before The End Of Previous Expansions
In the US, the personal savings rate has risen to nearly 8%, much higher than one would expect based on the level of household net worth (Chart 8). Despite growing at around 2.5% in 2018/19, real personal consumption has increased at a slower pace than predicted by the level of consumer confidence. This suggests that households have maintained a fairly prudent disposition. Consistent with this, the ratio of household debt-to-disposable income has declined by 32 percentage points since 2008. Chart 8Households Are Saving More Than One Would Expect
Households Are Saving More Than One Would Expect
Households Are Saving More Than One Would Expect
Granted, some credit categories have seen large increases (Chart 9). Student debt has risen to 9% of disposable income. Auto loans have moved back to their pre-recession highs. We would not worry too much about the former, as the vast majority of student debt is guaranteed by the government. Auto loans are more of a concern. However, it is important to keep in mind that the auto loan market is less than one-sixth as large as the mortgage market. Moreover, after loosening lending standards for vehicle loans between 2011 and 2016, banks have since tightened them. This adjustment appears to be largely complete. Lending standards did not tighten any further in the latest Senior Loan Officer Survey, while demand for auto loans rose at the fastest pace in two years. The share of auto loans falling into delinquency has been trending lower, which suggests that delinquency rates are peaking (Chart 10). Chart 9US Household Debt Levels Have Fallen, Despite Increases in Student And Auto Loans
US Household Debt Levels Have Fallen, Despite Increases in Student And Auto Loans
US Household Debt Levels Have Fallen, Despite Increases in Student And Auto Loans
Chart 10Auto Loans: Monitoring Trends In Credit Standards And Delinquency Rates
Auto Loans: Monitoring Trends In Credit Standards And Delinquency Rates
Auto Loans: Monitoring Trends In Credit Standards And Delinquency Rates
Lastly, we would point out that despite all the hoopla over the state of the auto market, auto loan asset-backed securities have performed well (Chart 11). While default rates have risen, lenders have generally set interest rates high enough to absorb incoming losses. Chart 11Securitized Auto Loans Have Performed Well
Securitized Auto Loans Have Performed Well
Securitized Auto Loans Have Performed Well
Will Falling Profit Margins Derail The Expansion? Profit margins usually peak a few years before the onset of a recessions (Chart 12, top panel). This has led some to speculate that falling margins could usher in a recession by curbing companies’ willingness to hire workers and invest in new capacity. Chart 12A Peak In Profit Margins: An Ominous Sign?
A Peak In Profit Margins: An Ominous Sign?
A Peak In Profit Margins: An Ominous Sign?
While it is an interesting theory, it does not stand up to closer scrutiny. Surveys of business sentiment clearly show that capital spending intentions are positively correlated with plans to raise wages (Chart 13, left panel). Far from cutting capital expenditures in response to rising wages, firms are more likely to boost capex if they are also planning to increase labor compensation. Chart 13AFaster Wage Growth, Increased Hiring, And More Capex Go Hand In Hand (I)
Faster Wage Growth, Increased Hiring, And More Capex Go Hand In Hand (I)
Faster Wage Growth, Increased Hiring, And More Capex Go Hand In Hand (I)
Chart 13BFaster Wage Growth, Increased Hiring, And More Capex Go Hand In Hand (II)
Faster Wage Growth, Increased Hiring, And More Capex Go Hand In Hand (II)
Faster Wage Growth, Increased Hiring, And More Capex Go Hand In Hand (II)
One reason for this is that rising wages make automation more attractive. By definition, automation requires more capital spending. However, that is not the entire story because firms also tend to hire more workers during periods when wage growth is rising (Chart 13, right panel). This implies that a third factor – strong economic growth – is responsible for both accelerating wages and rising hiring intentions. The fact that real business sales are strongly correlated with both employment growth and nonresidential investment is evidence for this claim (Chart 12, bottom panel). Falling Margins: A Symptom Of A Problem The discussion above suggests that faster wage growth is unlikely to dissuade firms from either hiring more workers or boosting capital spending. Indeed, the opposite is probably true: Since workers normally spend more of every dollar of income than firms do, an increase in the share of national income flowing to workers will lift aggregate demand. So why do profit margins usually peak before recessions? The answer is that declining labor market slack tends to push up unit labor costs, forcing central banks to hike interest rates in an effort to stave off rising inflation. Thus, falling margins are just a symptom of an underlying problem: economic overheating. Don’t blame lower margins for recessions. Blame central banks. Inflation Is Not A Threat... Yet For now, unit labor cost inflation remains reasonably well contained in the major economies (Chart 14). However, there is little evidence to suggest that the historic relationship between labor market slack and wage growth has broken down (Chart 15). Barring a major surge in productivity growth, inflation is likely to accelerate eventually as companies try to pass on higher labor costs to their customers. Chart 14AUnit Labor Costs Are Well Behaved For Now (I)
Unit Labor Costs Are Well Behaved For Now (I)
Unit Labor Costs Are Well Behaved For Now (I)
Chart 14BUnit Labor Costs Are Well Behaved For Now (II)
Unit Labor Costs Are Well Behaved For Now (II)
Unit Labor Costs Are Well Behaved For Now (II)
Chart 15Correlation Between Labor Market Slack And Wage Growth Remains Intact
Correlation Between Labor Market Slack And Wage Growth Remains Intact
Correlation Between Labor Market Slack And Wage Growth Remains Intact
We do not know exactly when such a price-wage spiral will emerge. Inflation is a notoriously lagging indicator (Chart 16). Our best guess is that inflation could become a serious risk for investors in late 2021 or 2022. Thus, investors should remain overweight global equities for the next 12-to-18 months, but be prepared to turn more cautious in the second half of 2021. Chart 16Inflation Is A Lagging Indicator
Who’s Afraid Of Low Unemployment?
Who’s Afraid Of Low Unemployment?
Peter Berezin Chief Global Strategist peterb@bcaresearch.com Footnotes 1 Jong-Wha Lee and Warwick J. McKibbin, “Globalization and Disease: The Case of SARS,” Brookings Institution, dated February 2004. 2 Please see Global Investment Strategy Weekly Report, “Bond Yields: How High Is Too High?” dated January 17, 2020. Global Investment Strategy View Matrix
Who’s Afraid Of Low Unemployment?
Who’s Afraid Of Low Unemployment?
MacroQuant Model And Current Subjective Scores
Who’s Afraid Of Low Unemployment?
Who’s Afraid Of Low Unemployment?
Strategic Recommendations Closed Trades
As tensions from the US-China trade war abate, investors are starting to refocus on economic fundamentals. This year, Chinese policymakers will maintain their tight grip on local government spending and bank lending, and will continue to fine-tune policies…
We have been cyclically overweight Chinese stocks, because we expected the economy to bottom in the first quarter of 2020 and a trade deal to materialize eventually. In the past two weeks, these two possibilities became realities. Last week's small selloffs…
Highlights An analysis on India is available on page 12. There is extreme complacency in global financial markets. With currency markets’ implied volatility at a record low, we recommend going long EM currency volatility. The latter will rise in the next six month regardless the direction of global risk assets. For now, we remain long the EM MSCI equity index with a stop point at 1050. In India, nominal income growth has fallen below lending rates. The latter have not declined despite monetary easing. The authorities will force banks to reduce their lending rates, which will hurt bank stocks. Feature “…we have probably seen the end of the boom-bust cycle.” Bob Prince, Co-CIO of Bridgewater World Economic Forum, Davos January 22, 2020 Low Volatility = Complacency Chart I-1Go Long Currency Volatility
Go Long Currency Volatility
Go Long Currency Volatility
The comment above by co-CIO of the largest hedge fund declaring the end of boom-bust cycle is consistent with lingering complacency in global financial markets. Any time an influential person made a similar declaration in the past, it marked a major turning point in financial markets. Remarkably, implied volatility for the US dollar has plummeted to a record low, as it has for EM currencies and a wide range of equity markets. Chart I-1 illustrates the implied volatility for EM currencies and the US dollar. Such low levels of implied currency market volatility historically preceded major moves in currency markets and often led to a material selloff in broad EM financial markets. It does not mean that the world economy will crash but financial markets volatility in general and currency market volatility in particular are bound to rise considerably in the months ahead. The risk-reward profile of going long EM currency or US dollar volatility appears very attractive. Today we recommend investors to go long EM currency volatility. The latter will rise regardless the direction of global risk assets. Concerning overall strategy, EM financial markets are entering a testing period. How broader EM risk assets and currencies perform in the coming weeks will signal how durable and long-lasting the current EM rally will be. Given global risk assets are overbought, a correction or consolidation phase is overdue. If EM equities, currencies and credit markets outperform, or at least do not underperform their DM peers in the course of this indigestion phase, it will beckon more upside for EM risk assets in 2020. If during budding market turbulence EM risk assets and currencies underperform their DM peers, it will signal their vulnerability in 2020.Implied volatility for the US dollar has plummeted to a record low, as it has for EM currencies. Implied volatility for the US dollar has plummeted to a record low, as it has for EM currencies. For now, we remain long the EM MSCI equity index with a stop point at 1050. We will upgrade our EM equity and credit market allocations versus DM if the EM universe generally exhibits relative resilience in the coming weeks, and more of our indicators confirm China’s growth recovery. Hints Of Recovery… December economic data out of China were strong, and it seems that the credit and fiscal stimulus are finally beginning to lift growth: Chinese imports and nominal industrial output – among the most reliable measures of the Chinese business cycle – posted very robust growth numbers in December (Chart I-2). DRAM and NAND semiconductor prices are climbing, and China’s container freight index is also in revival mode (Chart I-3). These high-frequency (daily and weekly) data confirm improving business activity in both the global semiconductor sector and in overall world trade. Chart I-2China's December Economic Data Were Strong
China's December Economic Data Were Strong
China's December Economic Data Were Strong
Chart I-3Asia's Trade Is Recovering
Asia's Trade Is Recovering
Asia's Trade Is Recovering
There are tentative signs of amelioration in our proxies for marginal propensity to spend by households and enterprises in China (Chart I-4). A more decisive improvement in these indicators is needed to reinforce the positive outlook for China’s growth. …But Doubts Still Linger Despite the recent improvement in Chinese economic data and the rebound in China-related plays, there are a number of financial market indicators that are not yet confirming a sustainable business cycle recovery in China and global trade. In particular: First, apart from semiconductor stocks, global cyclical equity sectors and sub-sectors – industrials, materials, and freight and logistics – have begun, once again, underperforming defensive sectors (Chart I-5). Outperformance by these cyclical sectors against defensives is essential in confirming that global and Chinese capital spending – which were the primary sources of the most recent slowdown – are picking up again. Chart I-4China: Tentative Improvement In Household And Corporate Marginal Propensity To Spend
China: Tentative Improvement In Household And Corporate Marginal Propensity To Spend
China: Tentative Improvement In Household And Corporate Marginal Propensity To Spend
Chart I-5Global Equities: Cyclicals Are Again Underperforming Defensives
Global Equities: Cyclicals Are Again Underperforming Defensives
Global Equities: Cyclicals Are Again Underperforming Defensives
Notably, the relative performance of EM share prices to the global equity benchmark historically tracks the relative performance of global materials versus the global overall stock index.1 However, the two have recently diverged (Chart I-6). In short, global materials are not corroborating sustainability in the recent EM outperformance. If EM equities, currencies and credit markets outperform, or at least do not underperform their DM peers in the course of this indigestion phase, it will beckon more upside for EM risk assets in 2020. Second, the rebound in Chinese and EM shares prices is not corroborated by Chinese onshore government bond yields, which are dipping to new cyclical lows (Chart I-7). In other words, interest rate expectations in China are falling – i.e., they are not confirming a robust recovery. Chart I-6Unsustainable Decoupling
Unsustainable Decoupling
Unsustainable Decoupling
Chart I-7A Message From The Chinese Fixed-Income Market
A Message From The Chinese Fixed-Income Market
A Message From The Chinese Fixed-Income Market
Third, EM ex-China currencies have not yet broken out versus the US dollar (Chart I-8). Consistently, the broad trade-weighted US dollar has not yet broken down. Chart I-9 illustrates that the greenback’s advance-decline line has not yet fallen below its 200-day moving average, a condition that has historically been required to confirm the dollar’s cyclical bear market. Chart I-8EM Currencies: No Breakout Yet
EM Currencies: No Breakout Yet
EM Currencies: No Breakout Yet
Chart I-9The US Dollar Is At A Critical Juncture
The US Dollar Is At A Critical Juncture
The US Dollar Is At A Critical Juncture
We view these exchange rate patterns as a litmus test to validate turning points in the global business cycle. Finally, the technical profiles of the KOSPI, EM small cap stocks and copper prices are inconclusive (Chart I-10). These markets have rebounded but seem to be confronting a critical technical test. If they decisively break above these technical levels, it will be a sign that the EM bull market will be lasting and durable. Otherwise, caution is still warranted. Bottom Line: There is a good amount of complacency among global investors at a time when there are several market signals that are still challenging the view of enduring revival in China/EM growth. Corporate Profits Will Be The Arbiter Ultimately, economic growth and corporate profits will determine the direction of not only share prices but also EM sovereign and corporate credit spreads as well as their currencies. So far, the EM equity rebound of the past 12 months has been solely due to multiples expansion amid a deepening EM profit recession: Earnings per share in US dollar terms has been contracting by 10% from a year ago, and the rate of change has so far not turned around (Chart I-11). Chart I-10The KOSPI And Copper Are Facing A Resilience Test
The KOSPI And Copper Are Facing A Resilience Test
The KOSPI And Copper Are Facing A Resilience Test
Chart I-11EM Equities: A Profitless Rally?
EM Equities: A Profitless Rally?
EM Equities: A Profitless Rally?
Going forward, however, EM corporate profits growth is set to improve. Our indicator for semiconductor companies’ revenues is heralding a revival in semi sector profits (Chart I-12, top panel). The rate-of-change improvement in commodities prices is also foreshadowing potential amelioration in corporate earnings growth among energy producers and materials (Chart I-12, middle and bottom panels). Chart I-12EPS Growth In EM Technology, Energy And Materials
EPS Growth In EM Technology, Energy And Materials
EPS Growth In EM Technology, Energy And Materials
We are negative on EM bank profits due to their need to recognize and provision for non-performing loans as well as the authorities’ mounting pressures on them to reduce lending rates. The latter will shrink banks’ elevated net interest rate margins. The profit profile of other EM equity sectors is illustrated in Chart I-13A and I-13B. Chart I-13AEM EPS Growth By Sectors
EM EPS Growth By Sectors
EM EPS Growth By Sectors
Chart I-13BEM EPS Growth By Sectors
EM EPS Growth By Sectors
EM EPS Growth By Sectors
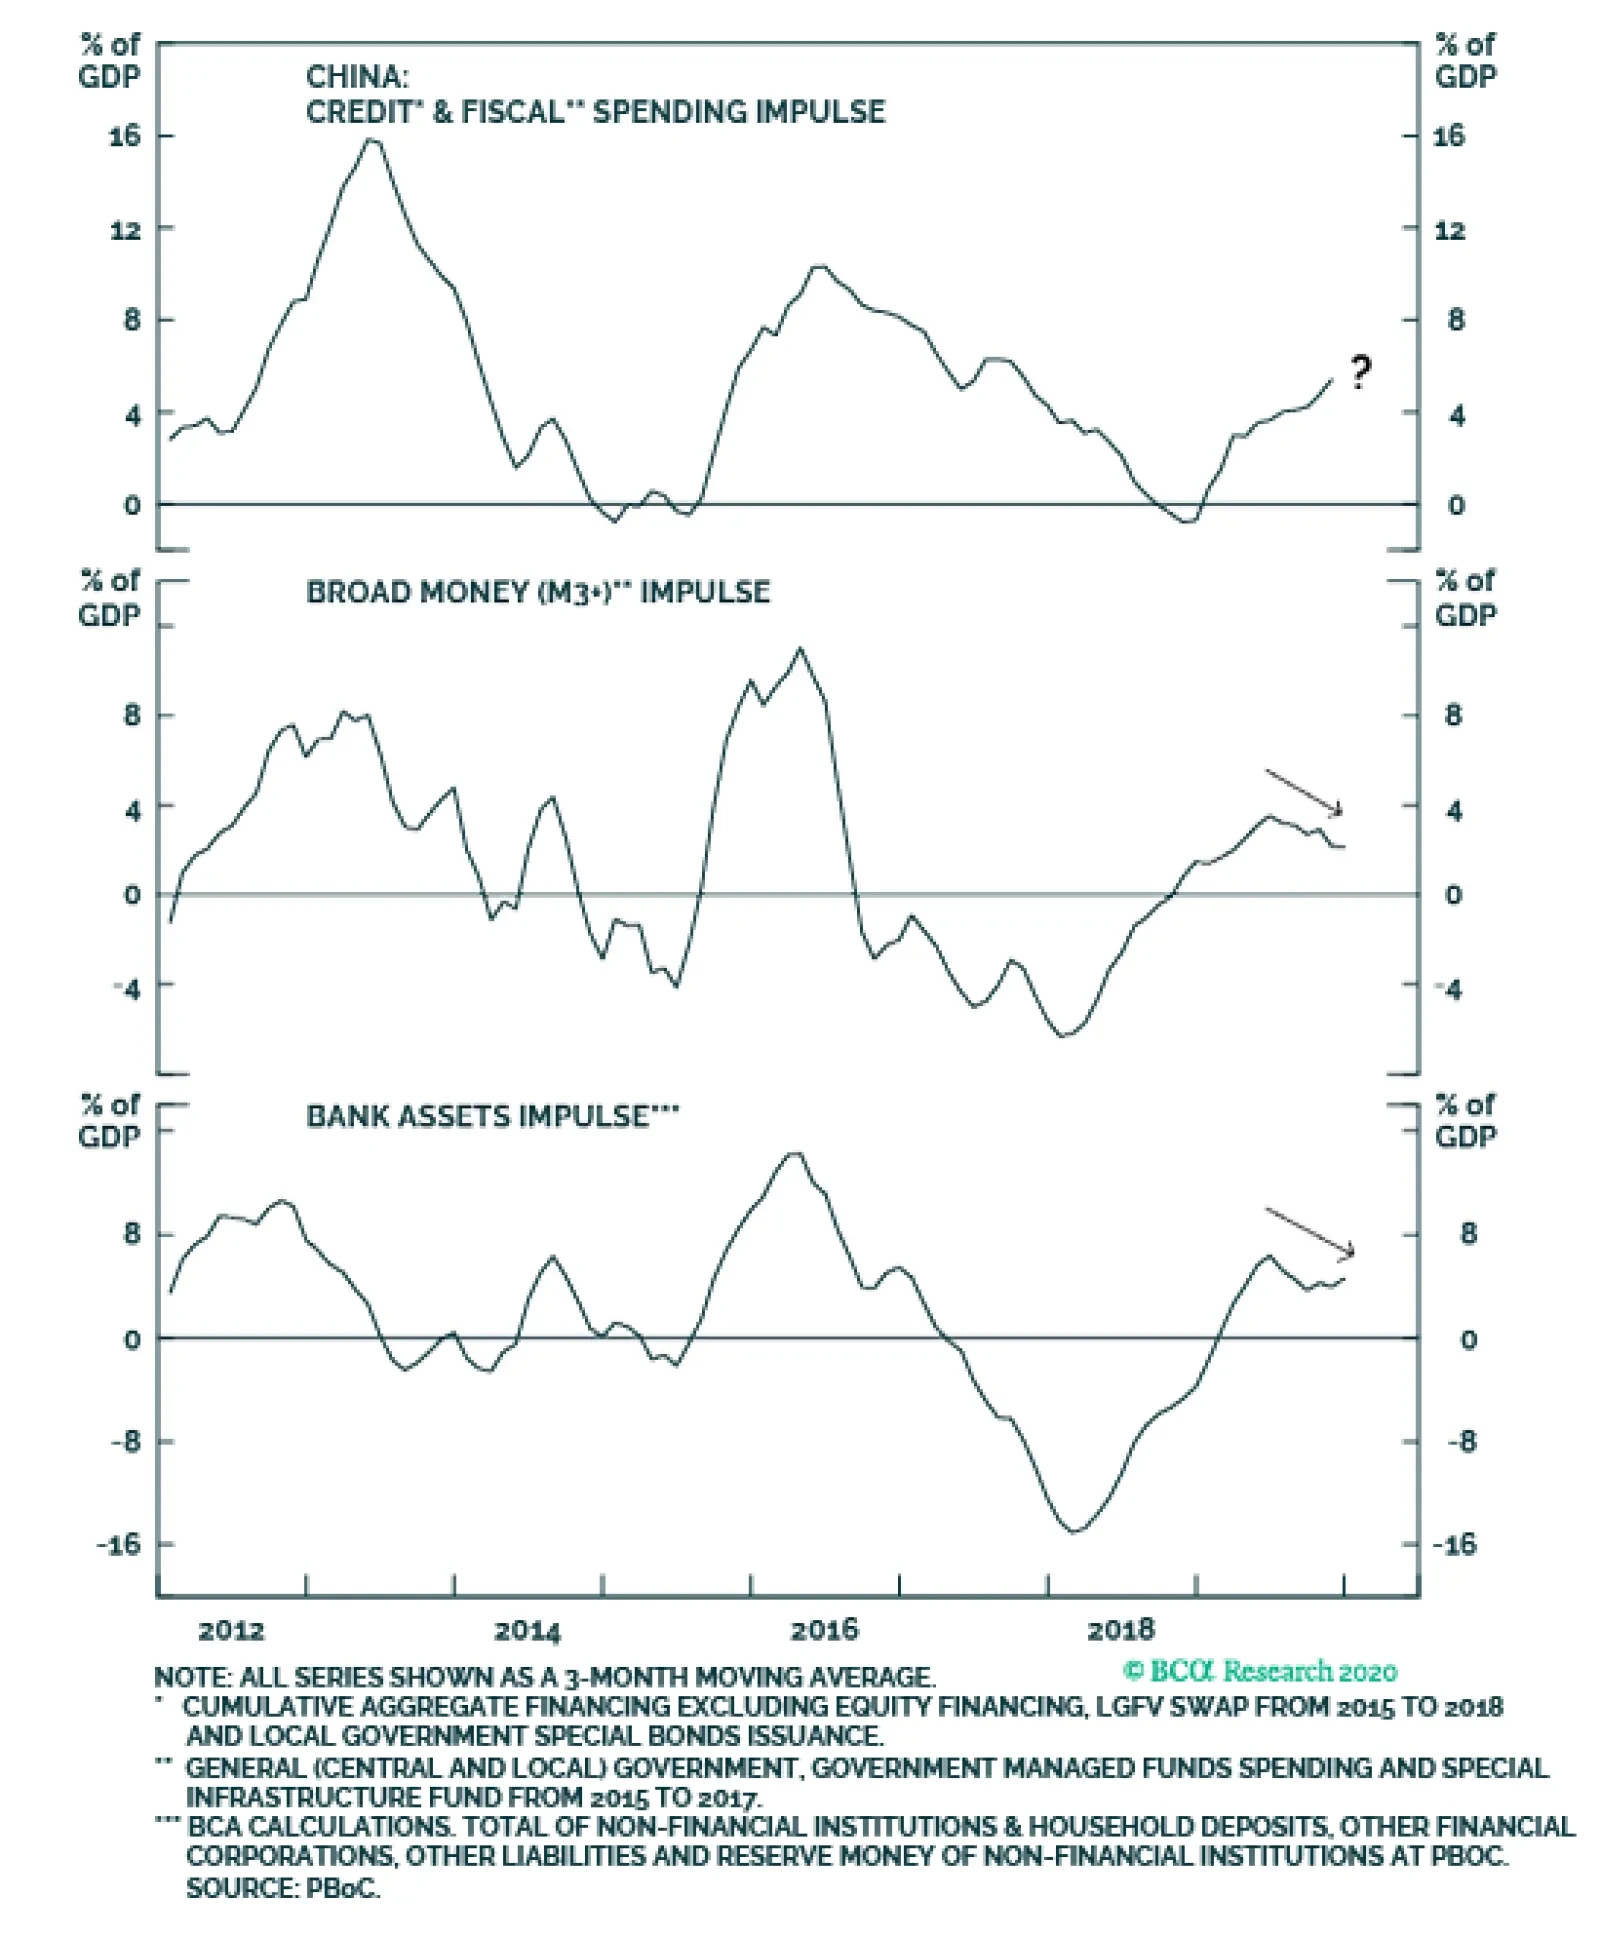
Provided technology, materials and energy stocks account for 33% of the MSCI EM aggregate equity index’s earnings (banks account for another 28% of total profits), it is safe to assume that the growth rate of EM EPS will move from -10% currently to zero or mildly positive territory by mid-2020. Nevertheless, beyond the next several months, our leading indicators on the EM profit outlook are not positive. China’s narrow money growth leads EM EPS by 12 months, and currently suggests the EPS recovery will be both muted and short-lived (Chart I-14). The technical profiles of the KOSPI, EM small cap stocks and copper prices are inconclusive. Further, China’s broad money impulse points to a peak in the credit impulse in the first half of the year (Chart I-15). Given that EM share prices bottomed a year ago, simultaneously with China’s credit impulse, odds are that EM equities could slump with a rollover in the latter. Chart I-14EM EPS: Marginal Improvement Ahead But No Robust Recovery
EM EPS: Marginal Improvement Ahead But No Robust Recovery
EM EPS: Marginal Improvement Ahead But No Robust Recovery
Chart I-15China: A Signpost Of A Potential Top In The Credit Impulse
China: A Signpost Of A Potential Top In The Credit Impulse
China: A Signpost Of A Potential Top In The Credit Impulse
Chart I-16DM Central Banks' Assets And EM Stocks And Currencies: No Stable Correlation
DM Central Banks' Assets And EM Stocks And Currencies: No Stable Correlation
DM Central Banks' Assets And EM Stocks And Currencies: No Stable Correlation
What if the current liquidity-driven rally continues? In our report last week titled A Primer On Liquidity, we elaborated at great length about the different liquidity measures and how they influence financial asset prices. Empirically, changes in DM central banks’ balance sheets have had no stable correlation with either EM share prices or EM local currency bonds, as demonstrated in Chart I-16. There have been periods over the past 10 years when EM risk assets and currencies have performed poorly, despite an accelerating pace of QE programs worldwide (Chart I-16). The true and critical driver for EM equity and currency performance has been EM’s own domestic fundamentals and China’s business cycle (please refer to Chart I-11 on page 7). To be sure, we are not suggesting that DM central bank policies have not affected global and EM financial markets at all. They have done so in spades. By purchasing and withdrawing about $9 trillion in high-quality securities from the marketplace, the monetary authorities have shrunk the stock of available financial assets. Consequently, even though QE programs have expanded broad money supply only modestly,2 the upshot has been that more money has been chasing fewer financial assets. Also, low interest rates reduce the opportunity cost of owning risk assets. These two phenomena have led investors to bid up prices of various securities, including EM ones. Nevertheless, despite the ongoing and indiscriminate global search for yield, EM share prices in US dollar terms and EM ex-China currencies (including carry, i.e. on a total-return basis) are still below their 2010 levels. Such poor performance of EM risk assets has been a corollary of just how bad EM fundamentals have been. Bottom Line: EM corporate profits will improve on a rate-of-change basis in the coming months. However, forward-looking indicators do not yet point to a robust recovery in EM corporate profits as occurred in 2017. Investment Conclusions We are maintaining our long EM equities position with a stop point at 1050 for the MSCI EM stock index (7% below the current level). If EM share prices, credit markets and currencies outperform their DM peers during a correction/consolidation phase, we will upgrade EM allocations to overweight in global equity and credit portfolios. At the moment, EM is confronting a resilience test. Within the EM equity universe, our overweights are Russia, Korea, Thailand, Mexico, UAE, Pakistan and central Europe. Our recommended equity underweights include Indonesia, the Philippines, Hong Kong domestic stocks, South Africa, Turkey and Colombia. In sovereign credit and local bond markets, our overweights are Mexico, Russia, Thailand, Malaysia, Pakistan and Ukraine. In turn, South Africa, Turkey, Philippines and Indonesia warrant an underweight stance. Today we are upgrading Indian bonds from neutral to overweight (see page 17). In the currency space, we continue holding a short position versus the US dollar in the following basket of currencies: BRL, ZAR, CLP, COP, IDR, PHP and KRW. As always, the full list of our positions is presented at the end of report (please refer to pages 18-19 and on our website). Arthur Budaghyan Chief Emerging Markets Strategist arthurb@bcaresearch.com India: Beware Of Private Banks And Consumer Perils Indian private banks and consumer staple stocks have been holding up the Indian equity market at a time when the rest of the bourse has been sluggish. Both sectors, however, are extremely expensive and thus tremendously sensitive to minor profit disappointments. Remarkably, private banks now trade at a price-to-earnings (P/E) ratio of 31 and price-to-book value (PBV) ratio of 4. Indian consumer staple stocks, on the other hand, trade at a P/E ratio of 41 (Chart II-1 and Chart II-2). Chart II-1Indian Private Bank Stocks Are Expensive
Indian Private Bank Stocks Are Expensive
Indian Private Bank Stocks Are Expensive
Chart II-2Indian Consumer Staple Stocks Are Very Pricey
Indian Consumer Staple Stocks Are Very Pricey
Indian Consumer Staple Stocks Are Very Pricey
Chart II-3A Credit Boom Among Indian Private Banks
A Credit Boom Among Indian Private Banks
A Credit Boom Among Indian Private Banks
Given that private banks have been specializing in both mortgages and non-mortgage consumer lending, the call on both private bank and consumer staple stocks is contingent on consumer financial health. The loan book of private banks has expanded tremendously: since 2010 it has grown at a compounded annual growth rate (CAGR) of 20% and 14% in nominal and real (inflation-adjusted) terms, respectively (Chart II-3).3 In turn, the share of household loans is reasonably large at around 52% of private banks total loan book. Unfortunately, India’s consumer sector appears to be fragile at the moment. Employment and wage growth have downshifted – the Manpower employment index is at a 14-year low (Chart II-4). Consequently, household disposable income growth has decelerated to 9% in nominal terms (Chart II-5). Critically, households’ ability to service debt has deteriorated as nominal disposable household income growth has fallen slightly below borrowing costs, i.e., bank lending rates (Chart II-5). This development is precarious not only because it makes it more difficult for consumers to service their debt – causing NPLs to rise – but it also dampens consumer credit demand. Consequently, private banks’ considerable exposure to consumers could reverse the fortunes of the former as consumers face increasing difficulties servicing their debt. Moreover, with borrowing costs above nominal income growth, banks in India could face adverse selection problem. The latter is a phenomenon when loan demand primarily comes from riskier borrowers who are in desperate need for funding. In such a case, non-performing loans are bound to mushroom. Chart II-4India's Labor Market Is In Doldrums
India's Labor Market Is In Doldrums
India's Labor Market Is In Doldrums
Chart II-5India: Household Nominal Income And Lending Rate
India: Household Nominal Income And Lending Rate
India: Household Nominal Income And Lending Rate
Overall, household spending is in the doldrums. Two- and three-wheeler and passenger car unit sales have all been contracting. In the meantime, consumer demand for non-durable goods has also weakened, as reflected by stalling non-durable consumer goods production. Residential property demand has plummeted. According to the Reserve Bank of India’s December Financial Stability Report – quoting data from PropTiger DataLabs – housing sales units contracted by 20% in September from a year ago. In turn, growth in house prices has been anemic (Chart II-6). Prices are now growing below core inflation, i.e. property prices are deflating in real terms. Households’ ability to service debt has deteriorated as nominal disposable household income growth has fallen slightly below borrowing costs. Going forward, odds are that employment and wage growth will remain weak in India. The basis is the corporate sector is also struggling and still reluctant to invest and hire. Chart II-7 illustrates that the number of investment projects has collapsed, while capital goods production and capital goods imports are both shrinking (Chart II-7). Chart II-6India: Housing Market Is Feeble
India: Housing Market Is Feeble
India: Housing Market Is Feeble
Chart II-7India: Companies Are Not Investing
India: Companies Are Not Investing
India: Companies Are Not Investing
Overall, the entire Indian economy is suffering from high borrowing costs in real (adjusted for inflation) terms (Chart II-8, top panel). Chart II-8Lending Rates Have Not Declined Despite Monetary Easing
Lending Rates Have Not Declined Despite Monetary Easing
Lending Rates Have Not Declined Despite Monetary Easing
Importantly, the monetary policy transmission mechanism has not been working effectively in India. Even though the central bank has cut its policy rate by 135 basis points in 2019, prime borrowing did not budge (Chart II-8, middle panel). Consequently, loan growth has decelerated sharply (Chart II-8, bottom panel). On the whole, for the economy to recover, it requires considerably lower borrowing costs or a substantial fiscal boost. Indian central and state fiscal aggregate budget deficit is already wide at 6% of GDP. With public debt-to-GDP ratio at 68%, there is some but not enormous room for boosting government expenditures drastically. This makes reducing commercial bank lending rates the most feasible mechanism to jump-start the economy. Consequently, the authorities will become more aggressive in forcing commercial banks to cut their lending rates. This seems to be taking place as in September 2019 the RBI asked Indian commercial banks to link lending rates on certain types of loans more closely to the central bank’s policy rate to ensure more effective monetary policy transmission. Yet doing so will squeeze down commercial banks’ net interest rate margins – which have widened – and will hit banks’ profits. Alternatively, if lending rates do not fall, non-performing loans (NPLs) will increase because only risky borrowers will be willing to borrow while existing debtors will struggle to service their debt at current elevated interest rates. This will also depress bank profits. These two negative scenarios are probably reflected in low valuations of public bank share prices, but they are not yet priced in among private banks stocks. Given the latter’s exuberant valuations, only a small drop in net interest rate margins or a small rise in NPLs, will be enough to drag their share prices lower. Investment Conclusions Chart II-9India Vs. EM Relative Equity Performance Is Often About Oil
India Vs. EM Relative Equity Performance Is Often About Oil
India Vs. EM Relative Equity Performance Is Often About Oil
Travails of the Indian economy will persist for now. Much more policy support is required to turn the business cycle around. EM equity investors should keep a neutral allocation to Indian stocks within an EM equity portfolio. Indian share prices often outperform their EM peers when oil prices drop and lag when crude prices rally (Chart II-9). Given our negative view on oil prices,4 we are reluctant to downgrade this bourse to underweight. Private banks are susceptible to a drawdown as either their net interest rate margins will drop or they will face rising non-performing loans. Consumer staples stocks are expensive and, hence, are vulnerable to marginal profit disappointments. We are upgrading our allocation to Indian domestic bonds from neutral to overweight within an EM local bond portfolio. Consistently, we are closing our yield curve steepening trade in India. This position has produced a 30 basis points gain since July 2016. Low inflation, weak real growth, a struggling credit system and ineffective transmission of monetary easing argue for even lower interest rates in India. The surge in food prices should be viewed as a relative price shock, not inflation. Higher food prices will curb the spending power of consumers and weaken their expenditures on non-food items. In addition, core inflation remains very low. Ayman Kawtharani Editor/Strategist ayman@bcaresearch.com Footnotes 1 Please click on the link to access EM: Perception versus Reality report. 2 Commercial banks’ reserves at central banks do not constitute and are not a part of narrow or broad money supply. 3 The calculation is based on the annual reports of four large Indian private banks: HDFC Bank, ICICI Bank, Kotak Mahindra Bank, and Axis Bank. 4 This is the Emerging Markets Strategy team’s view and it differs for BCA’s house view on oil. Equities Recommendations Currencies, Credit And Fixed-Income Recommendations
Highlights The bank credit 6-month impulse is likely to drop sharply in Europe, drop modestly in the US, but remain positive in China. Hence, the momentum of first-half economic data is likely to be worse in Europe than in China – albeit the Wuhan coronavirus scare is an unknown risk to this view. Initiate long CNY/GBP on a 6-month horizon. Underweight banks and the cyclical-heavy Eurostoxx 50 versus other markets, again on a 6-month horizon. There will be a better time to enter these positions later in the year when 6-month impulses are improving. Long-term investors seeking value in Europe should focus on the main currencies and not on the main equity indexes. Fractal trade: long EUR/GBP. Europe And China Play A Role-Reversal In recent dispatches we have highlighted that the euro area bond yield 6-month impulse stands near +100 bps, posing the strongest headwind to growth for three years. To make matters worse, the impulse has flipped from a strong -100 bps tailwind last summer into the current strong headwind, equating to a marked deterioration in the weather. But in China, it is the opposite story. Last summer, the China bond yield 6-month impulse constituted a strong +80 bps headwind; today the headwind has disappeared. Indeed, it has morphed into a tailwind, albeit a very mild tailwind at just -10 bps. In this sense, Europe and China are now playing a role-reversal. The momentum of first-half economic data is likely to be worse in Europe than in China – albeit with the caveat that the Wuhan coronavirus scare is an unknown risk to this view (Chart of the Week). Chart of the WeekBond Yields In Europe And China Play A Role-Reversal
Bond Yields In Europe And China Play A Role-Reversal
Bond Yields In Europe And China Play A Role-Reversal
For the sake of completeness, we should address the world’s other large economy, the United States. Just as in the euro area, the US bond yield 6-month impulse has flipped from a strong -100 bps tailwind last summer into a current headwind. But the headwind, at +50 bps, is not as strong as it is in the euro area (Chart I-2). Chart I-2Headwind Impulses In The Euro Area And The US, But Not In China
Headwind Impulses In The Euro Area And The US, But Not In China
Headwind Impulses In The Euro Area And The US, But Not In China
The Four Impulse Framework For Short-Term Growth The bond yield 6-month impulse is the first component of our proprietary ‘four impulse framework’ for short-term growth. The bond yield 6-month impulse is important because it usually leads the framework’s second component, the bank credit 6-month impulse, by a few months. This relationship makes perfect sense as, at the margin, it is the price of credit that drives credit demand. Indeed, to the extent that monetary policy drives growth, this is the main mechanism by which it operates, albeit with a slight delay. The bond yield impulse usually leads the credit impulse. On this compelling theoretical and empirical evidence, the bank credit impulse is now likely to drop sharply in the euro area (Chart I-3), drop modestly in the US (Chart I-4), but remain positive in China (Chart I-5). Chart I-3The Credit 6-Month Impulse Is Likely To Drop Sharply In The Euro Area...
The Credit 6-Month Impulse Is Likely To Drop Sharply In The Euro Area...
The Credit 6-Month Impulse Is Likely To Drop Sharply In The Euro Area...
Chart I-4...Drop Modestly In ##br##The US...
...Drop Modestly In The US...
...Drop Modestly In The US...
Chart I-5...But Remain Positive In China
...But Remain Positive In China
...But Remain Positive In China
But we must also consider the other two impulses in our four impulse framework. In the case of the euro area, the third important impulse is the oil price 6-month impulse. This is because the euro area relies on oil imports whose volumes tend to be price inelastic. Hence, when the oil price falls it subtracts from imports, thereby adding to net exports and growth – and vice-versa when the oil price rises. In the middle of 2019, the oil price impulse constituted a very strong headwind which helps to explain the midyear sharp slowdown in Germany. Subsequently, the headwind eased, even reversing into a modest tailwind which facilitated a recovery. But the tailwind is now fading (Chart I-6). Chart I-6A Fading Tailwind From The Oil Price 6-Month Impulse
A Fading Tailwind From The Oil Price 6-Month Impulse
A Fading Tailwind From The Oil Price 6-Month Impulse
The fourth and final component of our four impulse framework is geopolitical risk. This is not an impulse in the strict mathematical sense, but it is the same broad idea applied to the flow of geopolitical tail-events, both negative and positive. Europe’s positive events came several months ago: first in early-August when Italy ousted the firebrand Matteo Salvini from government; then in early-October when the UK parliament legislated against a no-deal Halloween Brexit. The tailwind from these positive events has now likely faded. For China, a positive geopolitical event and potential mild tailwind has come more recently, with the signing of the phase one trade deal with the US. Against this, the Wuhan coronavirus scare is a new risk – though based on the latest information it is unlikely to impact a 6-month view. The tailwind from the oil price impulse is now fading. On the four impulse framework, the momentum of first-half economic data is likely to favour China over Europe. We have found that the best way of playing this is through the exchange rate (Chart I-7), though given recent moves our preferred expression is versus the pound rather than the euro. Hence, on a 6-month horizon, initiate long CNY/GBP. Chart I-7Play Relative Impulses Through Currencies
Play Relative Impulses Through Currencies
Play Relative Impulses Through Currencies
More generally, can the mild tailwind in China counter the headwinds in the West? No. Despite the improvement in China, the aggregate global bond yield impulse still constitutes a +50 bps headwind, which is almost certain to weigh down the global credit impulse through the early months of 2020 (Chart I-8). Chart I-8The Global Credit 6-Month Impulse Will Weaken In Early 2020
The Global Credit 6-Month Impulse Will Weaken In Early 2020
The Global Credit 6-Month Impulse Will Weaken In Early 2020
Therefore, as discussed last week in Strong Headwind Warrants Caution In H1, we recommend an underweight stance to banks and to the cyclical-heavy Eurostoxx 50 versus other markets, again on a 6-month horizon. This is not to say that these positions cannot do better on a 12-month view, as per the BCA house view. But if so, any outperformance will be back-end loaded, and there will be a better time to enter these positions later in the year when 6-month impulses are improving. Where Is The Value In Europe? One of the most common questions we get is: are European equities cheaper than US equities? Usually, this question comes from our US clients who are aware that their own stock market is expensive and wish that Europe might be less so. Unfortunately, the wishful thinking won’t make it come true! Major stock market indexes comprise multinational companies with global footprints. For these multinationals, there is no such thing as a ‘European’ company or a ‘US’ company. They are simply global companies that could list their shares on any major stock market. Now ask yourself this: is it really plausible that such a multinational would be cheaper if its primary listing was in Frankfurt as opposed to New York? Of course not. The valuation depends on the industry and company specifics, but it is highly unlikely to depend on whether the company is listed in Frankfurt or New York. It is not European equities that are cheap, it is European currencies that are cheap. But then why do companies with dual listings in Europe and outside Europe trade at a valuation discount in their European listing? For example, Carnival Cruises trades around 8 percent dearer in New York than in London (Chart I-9); and BHP Billiton trades around 15 percent dearer in Sydney than in London (Chart I-10). The answer is that the London listing is quoted in pounds, the New York listing is quoted in US dollars, the Sydney listing is quoted in Australian dollars, but Carnival’s and BHP’s sales and profits are denominated in a mix of international currencies. Chart I-9Carnival Cruises Trades Dearer In New York Than In London
Carnival Cruises Trades Dearer In New York Than In London
Carnival Cruises Trades Dearer In New York Than In London
Chart I-10BHP Trades Dearer In Sydney ##br##Than In London
BHP Trades Dearer In Sydney Than In London
BHP Trades Dearer In Sydney Than In London
Hence, Carnival and BHP are trading dearer in New York and Sydney because the market is expecting their mixed currency earnings to appreciate more in US dollar and Australian dollar terms respectively than in pound terms. Put another way, the market is expecting the pound to appreciate structurally versus the major non-European currencies. Therein lies the important message. It is not European equities that are cheap, it is European currencies that are cheap. For those of you still in doubt, just visit the ECB website. The central bank’s own currency valuation indicator admits that the trade-weighted euro is 10 percent undervalued (Chart I-11). Chart I-11The ECB Admits That The Euro Is 10 Percent Undervalued
The ECB Admits That The Euro Is 10 Percent Undervalued
The ECB Admits That The Euro Is 10 Percent Undervalued
Hence, investors seeking value in Europe should not focus on the main equity indexes. Instead, they should focus on the main currencies. That said, valuation based investing only works if you have a long enough time horizon, meaning at least two years. For shorter horizons, economic momentum and technical factors dominate. In this regard, the pound’s strong rally faces resistance once post-Brexit trade deal negotiations begin in earnest after January 31. As a tactical trade, go long EUR/GBP (see next section). Fractal Trading System* The Brexit deal unleashed a strong rally in the pound, but this is vulnerable to a countertrend setback once the trade deal negotiations begin in earnest. Accordingly, this week's recommendation is long EUR/GBP. Set a profit target at 2 percent with a symmetrical stop-loss. In other trades, long tin achieved its 5 percent profit target at which it was closed. The rolling 1-year win ratio stands at 62 percent. Chart I-12EUR/GBP
EUR/GBP
EUR/GBP
When the fractal dimension approaches the lower limit after an investment has been in an established trend it is a potential trigger for a liquidity-triggered trend reversal. Therefore, open a countertrend position. The profit target is a one-third reversal of the preceding 13-week move. Apply a symmetrical stop-loss. Close the position at the profit target or stop-loss. Otherwise close the position after 13 weeks. * For more details please see the European Investment Strategy Special Report “Fractals, Liquidity & A Trading Model,” dated December 11, 2014, available at eis.bcaresearch.com. Dhaval Joshi Chief European Investment Strategist dhaval@bcaresearch.com Fractal Trading System
Europe And China Play A Role-Reversal
Europe And China Play A Role-Reversal
Europe And China Play A Role-Reversal
Europe And China Play A Role-Reversal
Cyclical Recommendations Structural Recommendations
Europe And China Play A Role-Reversal
Europe And China Play A Role-Reversal
Europe And China Play A Role-Reversal
Europe And China Play A Role-Reversal
Europe And China Play A Role-Reversal
Europe And China Play A Role-Reversal
Europe And China Play A Role-Reversal
Europe And China Play A Role-Reversal
Trades Closed Trades Asset Performance Currency & Bond Equity Sector Country Equity Indicators Bond Yields Chart II-1Indicators To Watch - Bond Yields
Indicators To Watch - Bond Yields
Indicators To Watch - Bond Yields
Chart II-2Indicators To Watch - Bond Yields
Indicators To Watch - Bond Yields
Indicators To Watch - Bond Yields
Chart II-3Indicators To Watch - Bond Yields
Indicators To Watch - Bond Yields
Indicators To Watch - Bond Yields
Chart II-4Indicators To Watch - Bond Yields
Indicators To Watch - Bond Yields
Indicators To Watch - Bond Yields
Interest Rate Chart II-5Indicators To Watch - Interest Rate Expectations
Indicators To Watch - Interest Rate Expectations
Indicators To Watch - Interest Rate Expectations
Chart II-6Indicators To Watch - Interest Rate Expectations
Indicators To Watch - Interest Rate Expectations
Indicators To Watch - Interest Rate Expectations
Chart II-7Indicators To Watch - Interest Rate Expectations
Indicators To Watch - Interest Rate Expectations
Indicators To Watch - Interest Rate Expectations
Chart II-8Indicators To Watch - Interest Rate Expectations
Indicators To Watch - Interest Rate Expectations
Indicators To Watch - Interest Rate Expectations
Highlights The recently signed Phase One deal is positive for China and global equity markets as it brings a temporary truce to the trade war. However, China is unlikely to change its current policy trajectory to create additional domestic demand to consume $200 billion in new imports from the US. China is likely to meet the commitment only half way in the next two years, and meet the 2020 import target from the US by a redistribution of its purchases overseas. The RMB will modestly appreciate in the next three to six months. On the monetary policy front, there is no sign of further monetary easing from the PBoC. We continue to recommend an overweight stance towards Chinese stocks in the next six months, relative to the global benchmark. Feature Economic data released last week, including Q4 GDP growth, December industrial production, fixed-asset investment and trade data, all suggest that the Chinese economy bottomed before the end of 2019. The Phase One trade deal between China and the US marks a significant de-escalation in a two-year trade war. The RMB appreciated by 1.4% against the greenback since the beginning of the year, pushing USD-CNY firmly below the key psychological 7 mark. The performance of equities in China’s onshore and offshore markets confirms that the economy has bottomed. Since December 11, 2019, Chinese cyclical sectors have outperformed defensives and both the investable and domestic markets have broken above their respective 200-day moving averages versus global stocks (Chart 1A and 1B). Chart 1ABoth Onshore And Offshore Equities Signal A Bottoming In China's Economy
Both Onshore And Offshore Equities Signal A Bottoming In China's Economy
Both Onshore And Offshore Equities Signal A Bottoming In China's Economy
Chart 1BCyclicals Have Significantly Outperformed Defensives Lately
Cyclicals Have Significantly Outperformed Defensives Lately
Cyclicals Have Significantly Outperformed Defensives Lately
We continue to recommend a cyclical long stance on Chinese stocks. We expect pro-growth policy support to accelerate in the first quarter, economic recovery to further solidify, and the Phase One trade deal to reduce economic and financial market volatility until the November 2020 US presidential election. All of these factors should support an outperformance in Chinese stocks relative to their global peers. Some Inconvenient Truth To The Truce China’s commitment to purchase an additional $200 billion in goods from the US was more than market participants anticipated. We do not think China will honor this commitment to its full extent. Moreover, we also do not think this will change China’s domestic economic policy trajectory for 2020. Details in Chapter 6 of the Phase One trade agreement titled “Expanding Trade”1 include: In the next 2 years, China is committed to purchase an additional $200 billion worth of goods and services from the US, from the 2017 baseline. The additional $200 billion amount is split over the next two years: China will need to add no less than $77 billion of imports from the US in 2020, and $123 billion in 2021. This amounts to a 41% increase in 2020 and a 66% increase in 2021, from the 2017 baseline of $186 billion (Chart 2). The text from Chapter 6 of the Phase One deal also specifies that, between January 2020 and December 2021, China will add a total of $77.7 billion in purchases of manufactured goods (including aircraft components), $32 billion in agricultural products, $52.4 billion in energy and $37.9 billion in services from the US (Chart 3). Chart 2Phase One Trade Deal Sets An Ambitious Import Target For The Next Two Years
Phase One Trade Deal Sets An Ambitious Import Target For The Next Two Years
Phase One Trade Deal Sets An Ambitious Import Target For The Next Two Years
Chart 3Chinese Imports Of Agro And Energy Goods From The US Likely To See The Biggest Increase In 2020 From 2019
Chinese Imports Of Agro And Energy Goods From The US Likely To See The Biggest Increase In 2020 From 2019
Chinese Imports Of Agro And Energy Goods From The US Likely To See The Biggest Increase In 2020 From 2019
China’s annual import growth from the US in 2017 was the highest one in the past ten years. If we assume that China will simply add $200 billion of new imports in the next two years from the US to this high starting point, it will need to boost domestic demand to accommodate at least a 4-6% increase in total imports in the next two years from 2019.2 In contrast, growth in China’s total imports in 2019 contracted by 3% from 2018, and averaged at only 2% in the last five years. In other words, in 2020 and 2021, even if China does not increase imports from other countries, just the commitment from purchases of US goods alone would require a sizable boost in China’s domestic demand. However, the assumption above is overly simplified and optimistic. Even though Chinese leadership may have shifted their policy priority from financial deleveraging to supporting economic growth this year, we do not think they will fully abandon the battle against systemic risks in the financial sector. Therefore, China is unlikely to significantly deviate from its current policy trajectory and stimulate aggressively to create additional domestic demand to consume the agreed $200 billion in new imports from the US. It is equally unlikely that China will absorb the $200 billion additional imports from the US, at the expense of its domestic production. A more plausible approach, which is our base case scenario, is that China will meet a large portion of the 2020 import target before November, to show good faith. After the US presidential election, China will face the challenge of either a re-escalation from the Phase Two trade talk with a re-elected President Trump, or a new US president with his/her own political agenda. In either case, at this point China is unlikely to have the intention to meet the import target for 2021. Chart 4China Likely To Shift Agro And Energy Import Suppliers To The US
Managing Expectations
Managing Expectations
In 2020, to absorb a $77 billion additional imports from the US, China will likely shift some of its imports, such as agriculture and energy products, from other countries to suppliers in the US. China currently imports $150 billion of agriculture goods and $298 billion of energy related products on an annual basis, so the pie is large enough to absorb some of increased import commitments by shifting the sources of imports (Chart 4). The same logic goes for the manufactured goods category in the trade agreement, which includes cars, airplanes, steel, industrial machinery, and so on.3 China is likely to choose to shift its import suppliers of these goods to the US, while increasing its own share of intermediate goods supplies to the US manufacturers. Almost all of the eight subcategories under the manufactured goods category in the Phase One trade agreement are deeply integrated in the global supply chain. For example, foreign value-added share accounts for 23% of the total output value of the US automobile industry.4 In other words, if a “Made in America” car is worth $20,000, $4,600 is produced by foreign suppliers of intermediate goods. Since China has been the leading source of this foreign value-added in the US automobile industry, a sizeable slice of these additional imports will likely benefit Chinese manufacturers. In this scenario, we expect an increase in bilateral trade between China and the US in 2020, at the expense of other players in the global supply chain. Lastly, while this is not our base case scenario, it is possible the Phase One trade agreement was set up for failure, if China is simply hoping to delay the imposition of additional tariffs as part of a gamble that President Trump will not be re-elected. In this scenario, China might not make any meaningful additional purchases from the US even in 2020 (while claiming that they will be made closer to the election), implying that bilateral trade between China and the US will only revert to its historical average this year, at best. Bottom Line: Chinese policymakers are unlikely willing to alter their existing policy trajectory when accommodating more imports of US goods. China will, at best, reshuffle its supply chain to absorb a portion of the commitment before November 2020. The RMB And Monetary Policy: A Refocus On The Economic Fundamentals As tensions from the US-China trade war abate, investors are starting to refocus on economic fundamentals. The RMB has appreciated by 1.4% against the USD since the beginning of this year (Chart 5). The recent appreciation in the currency is a reversal to its fair value, which reflects an ongoing economic recovery (Chart 6). In the next three to six months, the improvement in China’s economic fundamentals and market sentiment should support a continuation in the RMB’s reversal to its structural trend. Chart 5USD/CNY Has Durably Fallen Below 7
USD/CNY Has Durably Fallen Below 7
USD/CNY Has Durably Fallen Below 7
Chart 6The Recent Appreciation In RMB Is A Reversal To Its Fair Value
The Recent Appreciation In RMB Is A Reversal To Its Fair Value
The Recent Appreciation In RMB Is A Reversal To Its Fair Value
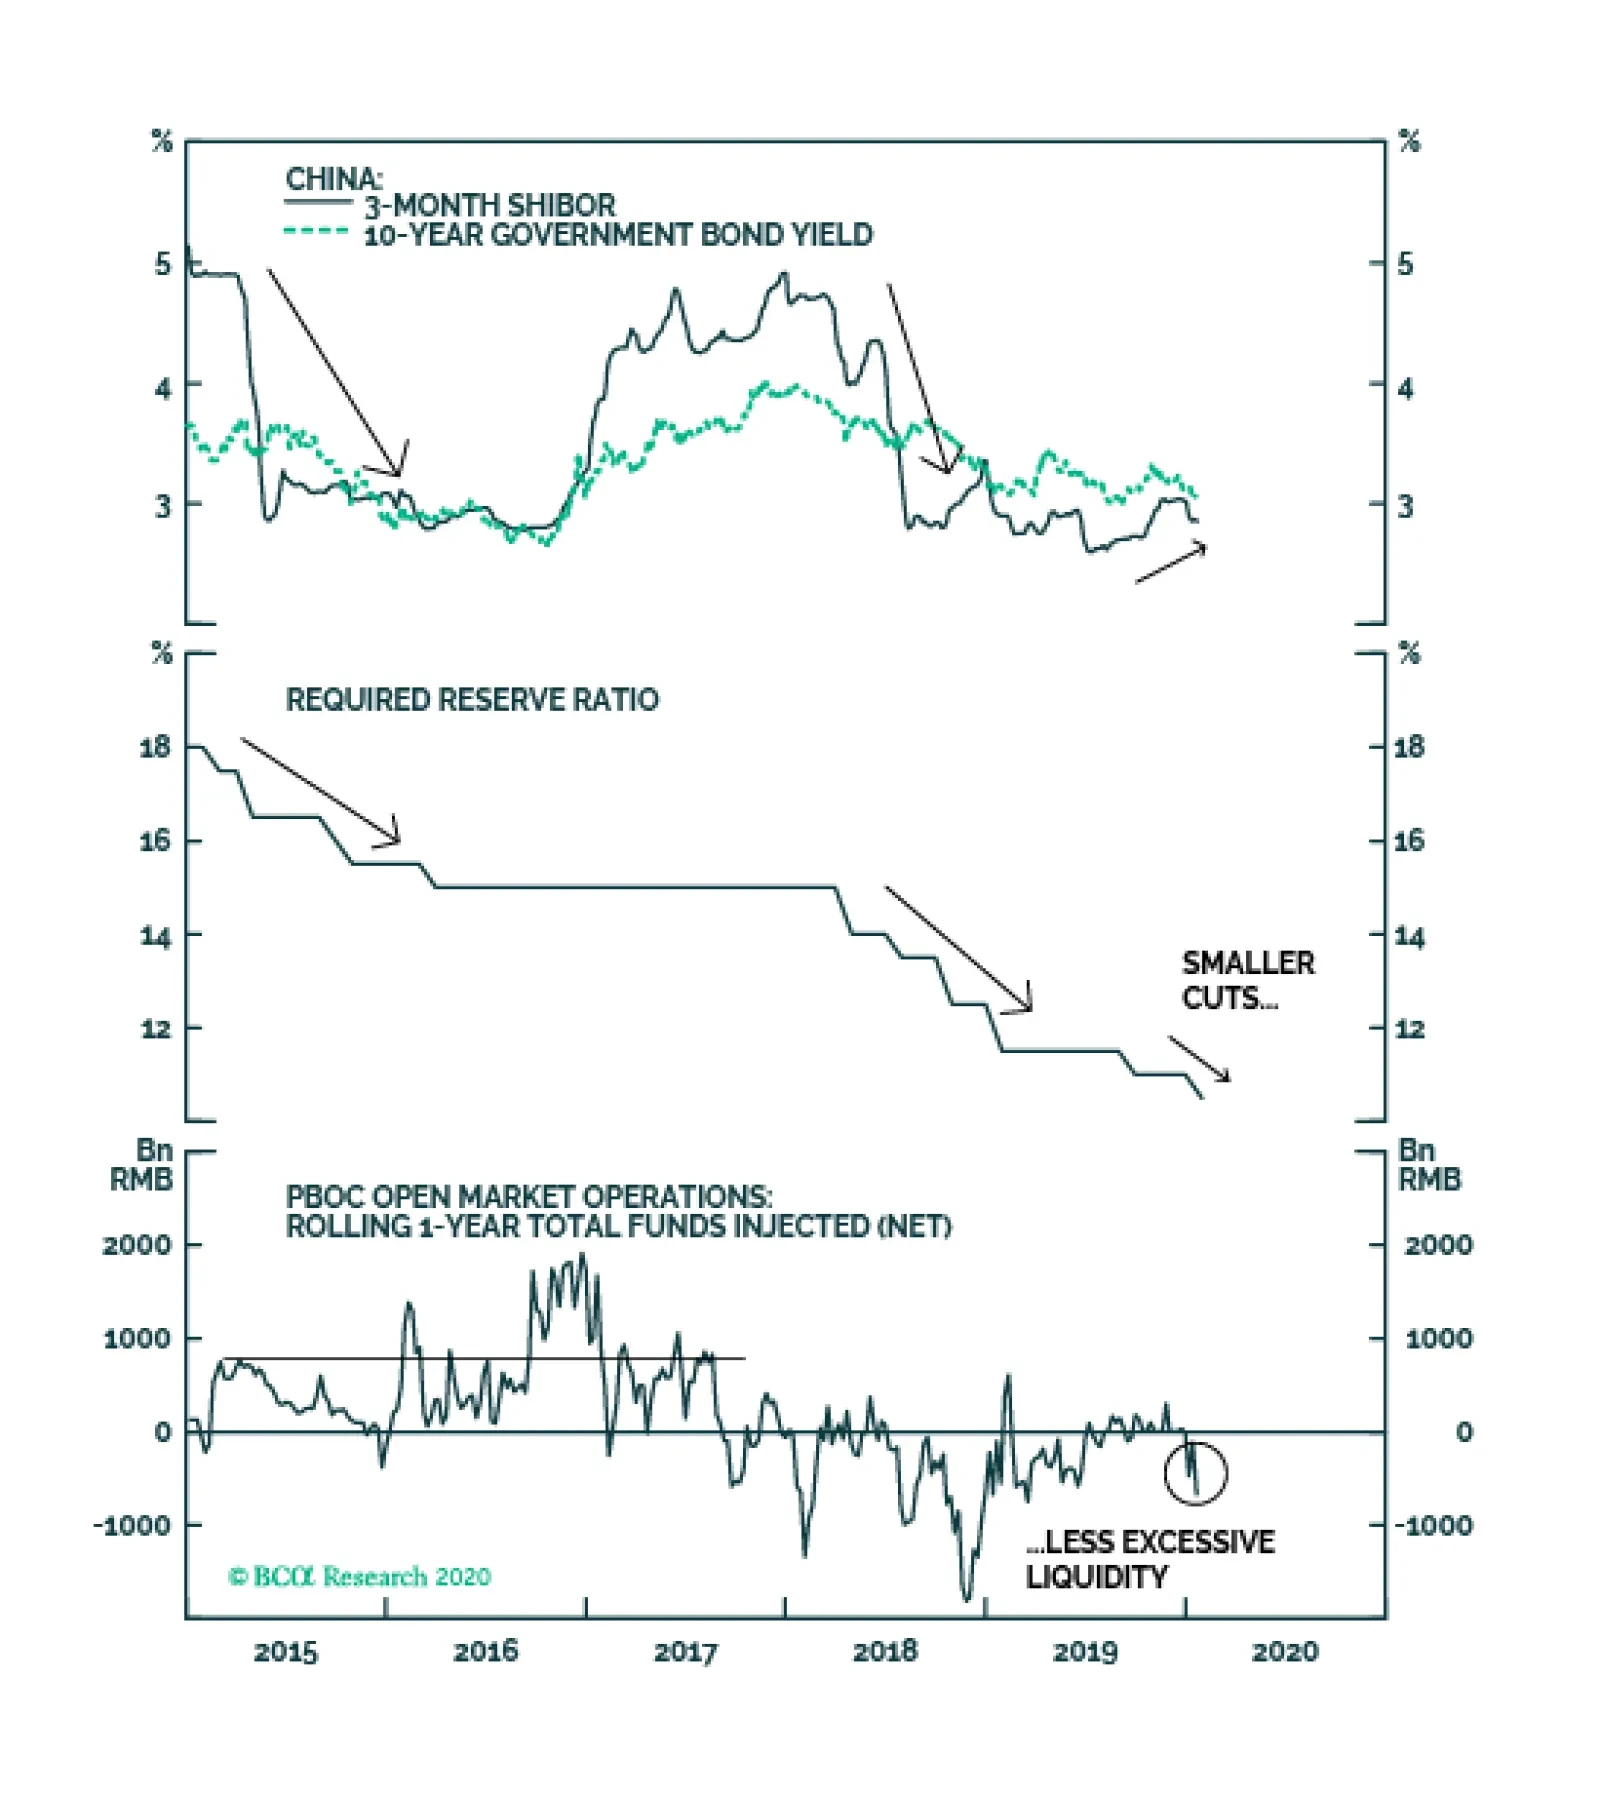
But Chinese leadership’s cautious approach to boosting domestic demand will also cap the upside potential in the RMB appreciation. We think Chinese policymakers will maintain their tight grip this year on local government spending and bank lending, and will continue to fine-tune policies based on economic conditions. This will limit the magnitude in both the stimulus and economic recovery. Baring a major re-escalation in the trade war, the RMB should oscillate within a relatively narrow band through the third quarter of this year. For that reason, the PBoC is unlikely to intervene in the RMB exchange rate by significantly altering its monetary stance (Chart 7). The 3-month interbank lending rate, China’s de facto policy rate, remains low compared with the 2015-16 easing cycle. There is no sign that the PBoC will allow the rate to fall much more. The recent bank reserve requirement ratio (RRR) rate cut provides additional liquidity to the interbank system, but on a net basis liquidity does not seem excessive (Chart 8). Chart 7PBoC Unlikely To Alter Monetary Policy To Intervene RMB Exchange Rate This Year
PBoC Unlikely To Alter Monetary Policy To Intervene RMB Exchange Rate This Year
PBoC Unlikely To Alter Monetary Policy To Intervene RMB Exchange Rate This Year
Chart 8No Sign Of Meaningful Monetary Easing From PBoC
No Sign Of Meaningful Monetary Easing From PBoC
No Sign Of Meaningful Monetary Easing From PBoC
Historically, the 3-month interbank lending rate only falls significantly and durably when the PBoC places consecutive RRR rate cuts (in both 2015 and mid-2018) and/or keeps net fund injections positive through the open market for a prolonged period (such as in the 2015/16 easing cycle). Chart 8 suggests the current monetary environment does not indicate that such an extremely easy stance is in place, as PBoC net fund injections through the open market remain negative. Furthermore, neither the 3-month interbank lending rate nor the 10-year government bond yield has fallen below its most recent lows in the third quarter of last year. Bottom Line: While the current environment supports a stronger RMB, the upside potential in RMB appreciation is capped by a modest scale of economic recovery. There is no sign that the PBoC is easing its monetary stance by lowering the policy rate. Investment Conclusions We have been cyclically overweight Chinese stocks on the basis of a bottoming in the economy in the first quarter of 2020, and the likelihood of an eventual trade deal. These two factors were confirmed in the past two weeks. Last week’s small selloffs in both onshore and offshore Chinese equity markets were likely technical corrections and pre-Chinese New Year profit taking, rather than a fundamental shift in investors’ sentiment towards Chinese stocks (Chart 9). We expect Chinese stocks to resume an upward trajectory after the Chinese New Year. Chart 9Small Corrections Following A 14% Gain Since Dec 2019
Small Corrections Following A 14% Gain Since Dec 2019
Small Corrections Following A 14% Gain Since Dec 2019
Chart 10Offshore Stocks Still Showing More Upside Potential Than Onshore
Offshore Stocks Still Showing More Upside Potential Than Onshore
Offshore Stocks Still Showing More Upside Potential Than Onshore
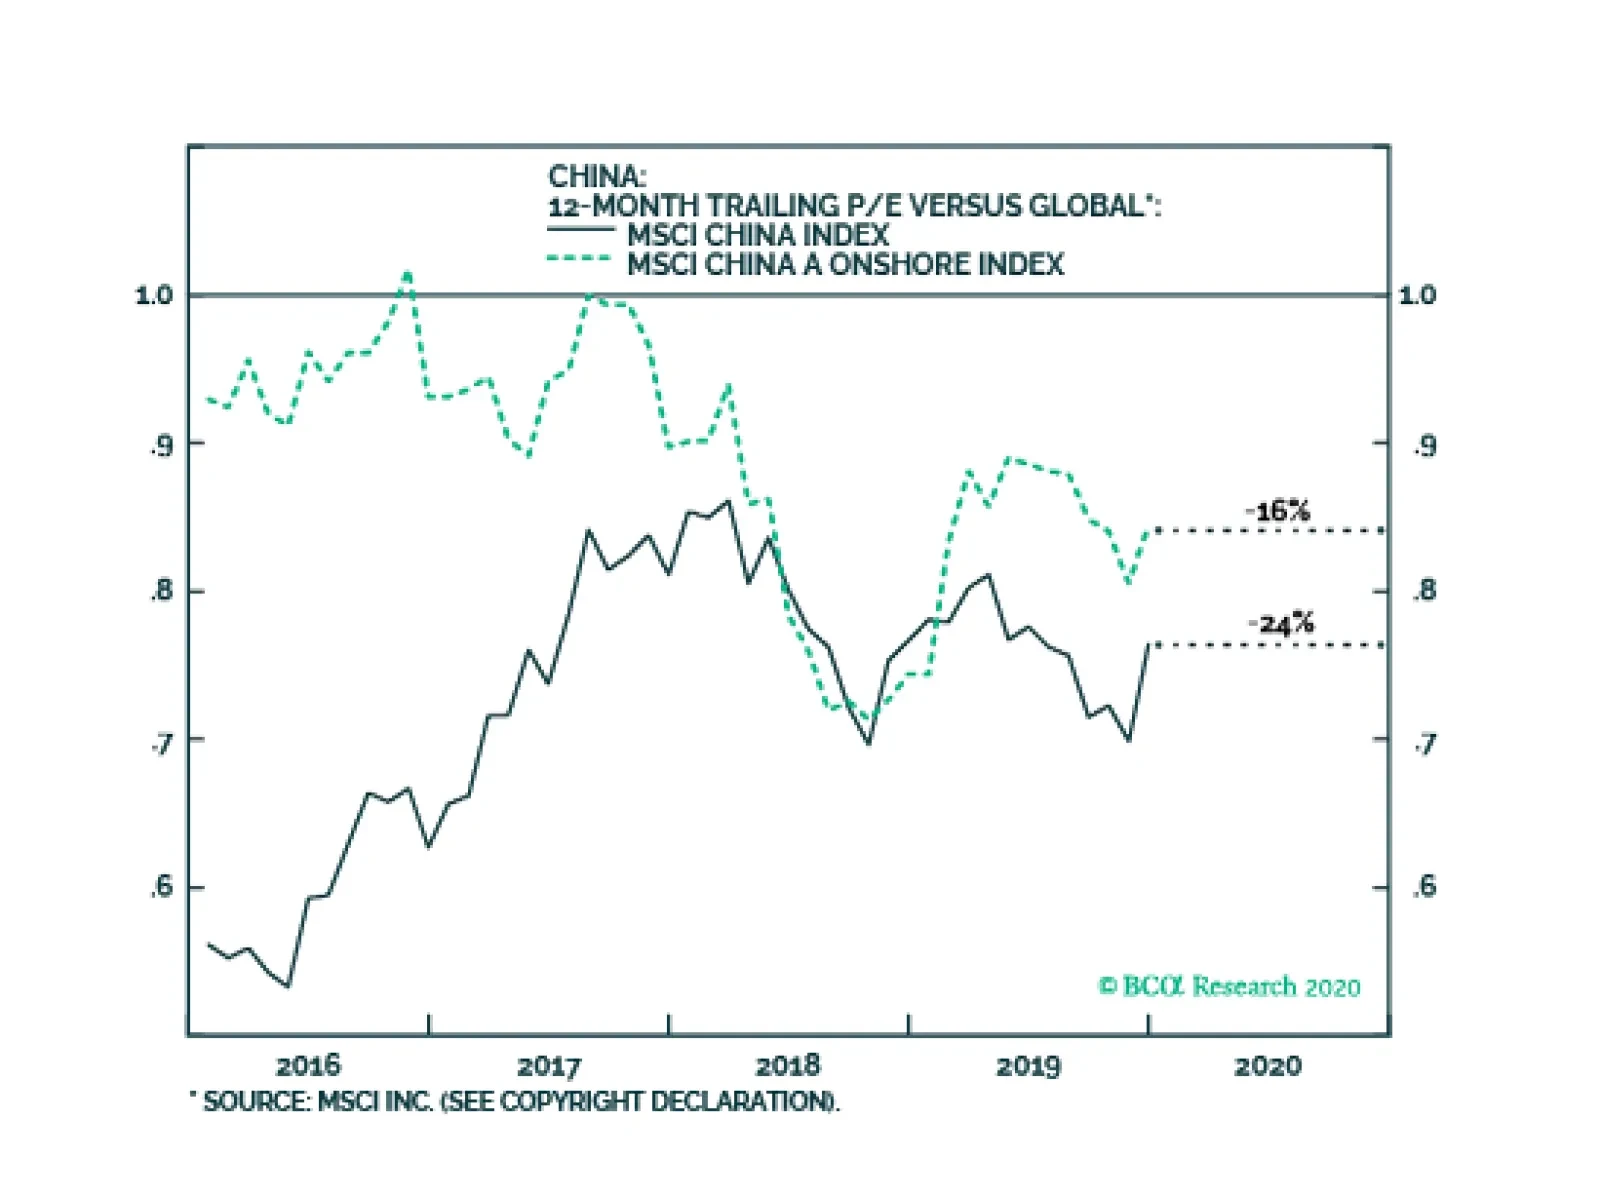
China’s economic conditions and corporate earnings should continue to improve, with investable stocks showing more upside potential than their domestic counterparts (Chart 10). As growth supporting measures continue to work their way through the economy and solidify an economic recovery, China’s leadership may pull back the scale of the stimulus in the second half of the year. Therefore, the relative outperformance in both markets may be front loaded and subsequently subside in the second half of 2020. Jing Sima China Strategist jings@bcaresearch.com Footnotes 1 https://assets.bwbx.io/documents/users/iqjWHBFdfxIU/rVaHxDBUtdew/v0 2 China’s total imports of goods and services in 2019 was $2604 billion, including $168 billion imports from the US. If China was to fully meet the $200 billion target of additional imports from the US, assuming no change to imports from other countries in 2020 from 2019, China’s total imports would jump to $2699 billion in 2020 and $2745 billion in 2021. 3 The eight subcategories of Manufacturing Goods listed in the Annex 6.1 of the Phase One Trade agreement include: Industrial Machinery, Electrical Equipment and Machinery, Pharmaceutical Products, Aircraft, Vehicles, Optical and Medical Instruments, Iron and Steel, Other Manufactured Goods including solar-grade polysilicon and other organic and inorganic chemicals, hardwood lumber, integrated circuits (manufactured in US), and chemical products. 4 WIOD Data, 2016 release and OECD Input-Output Tables (IOTs), 2015 release. Cyclical Investment Stance Equity Sector Recommendations
While Chinese authorities are most likely targeting “around 6%” in 2020, the authorities may allow an undershoot in the 5.5%-5.9% range. They will argue that the GDP target for 2020 has already been met on a compound growth rate basis. They may see less need…
Highlights We continue to have a positive view on global equities over the next 12 months, but see heightened risks of a near-term correction. Despite dwindling spare capacity, government bond yields are still lower today than they were shortly after the financial crisis. Many investors argue that bond yields cannot rise much because asset values would plunge if yields rose sharply, while debt burdens would quickly become unsustainable. We disagree. We think there is greater scope for yields to rise than is widely believed. Investors should maintain below-benchmark duration in fixed-income portfolios, favoring inflation-linked over nominal bonds and positioning for steeper yield curves. Gold should also do well next year. As long as bond yields are rising in response to stronger growth, as will be the case for the next two years, equities will fare well. The stock market will buckle, however, once stagflation sets in around 2022. Stocks Need To Work Off Overbought Conditions Before Moving Higher Again In last week’s report, entitled “Time For A Breather,” we downgraded our tactical three-month view on global equities from overweight to neutral on the grounds that stocks had run up too hard, too fast. Net long positions in equity futures among asset managers and levered funds are now at levels that have historically preceded corrections (Chart 1). Chart 1Stocks Are At A Heightened Risk Of A Correction
Stocks Are At A Heightened Risk Of A Correction
Stocks Are At A Heightened Risk Of A Correction
Chart 2Breadth Is Quite Narrow
Breadth Is Quite Narrow
Breadth Is Quite Narrow
Chart 3The Equity Risk Premium Is Fairly High, Especially Outside The US
The Equity Risk Premium Is Fairly High, Especially Outside The US
The Equity Risk Premium Is Fairly High, Especially Outside The US
The rally has been lopsided, characterized by very narrow breadth. The top five stocks in the S&P 500 (Apple, Microsoft, Alphabet, Amazon, and Facebook) now comprise 18% of market cap, a higher share than in the late 1999/early 2000s (Chart 2). As my colleague, Anastasios Avgeriou, has pointed out, Apple’s $30 billion one day market cap gain on January 9th was greater than the market cap of the median stock in the S&P 500 index. Despite our near-term concerns, we continue to maintain a positive 12-month view on global equities. Easier financial conditions, a turn in the global inventory cycle, modestly looser fiscal policy in the UK and euro area, and re-upped fiscal/credit stimulus in China should all support global growth this year. Faster growth, in turn, will lift corporate earnings. The equity risk premium also remains quite high, particularly outside the US (Chart 3). A Fragile Trade Truce A de-escalation in the trade war should provide a further tailwind to equities. The “phase one” agreement signed on Wednesday features a commitment by China to purchase an additional $200 billion in US goods and services over the next two years relative to 2017 levels. In return, the US will halve tariffs, to 7.5%, on the $120 billion tranche in Chinese imports and suspend any further tariff hikes. No firm schedule exists to begin “phase two” talks, and at this point, it is quite likely that no negotiations will take place until after the US presidential election. Nevertheless, the tail risk of an out-of-control trade war has receded for the time being, which is positive for stocks. Better Chinese Trade Data Adding to growing optimism over the global economy and diminished trade tensions, Chinese trade data surprised on the upside this week. Exports rose 7.6% in December, well above the consensus estimate of 2.9%. Imports surged 16.3%, easily surpassing the consensus estimate of 9.6%. While base effects explain some of the improvement, the overall tone of the trade data is consistent with the strengthening Chinese PMIs and improvement in industrial production and retail sales (Chart 4). Chart 4Chinese Trade Data Is Improving
Chinese Trade Data Is Improving
Chinese Trade Data Is Improving
Chart 5Better News Out Of China Has Propelled The Yuan Higher Versus The US Dollar
Better News Out Of China Has Propelled The Yuan Higher Versus The US Dollar
Better News Out Of China Has Propelled The Yuan Higher Versus The US Dollar
Better news out of China has pushed the yuan to the strongest level against the US dollar since last summer (Chart 5). The Chinese currency is the most important driver of other EM currencies. If the yuan continues to strengthen, as we expect, EM assets – particularly EM stocks and local-currency bonds – should do well this year. How High Can Bond Yields (Realistically) Go? Despite rising over the past few months, global government bond yields are lower today than they were shortly after the financial crisis ended (Chart 6). The decline in yields has occurred alongside dwindling spare capacity. In most countries, the unemployment rate today is below 2007/08 lows (Chart 7). Many investors argue that bond yields cannot rise much from current levels because asset values would plunge if yields rose sharply, while debt burdens would quickly become unsustainable. If such an unfortunate turn of events were to occur, central bankers would have to shelve any tightening plans, just as Jay Powell had to do in late 2018. Chart 6Bond Yields Are Lower Today Than They Were After The Great Recession
Bond Yields Are Lower Today Than They Were After The Great Recession
Bond Yields Are Lower Today Than They Were After The Great Recession
Chart 7Unemployment Rates Are Below Their Pre-Recession Lows In Most Economies
Bond Yields: How High Is Too High?
Bond Yields: How High Is Too High?
Convexity Fears One argument often heard these days is that asset prices have become hypersensitive to changes in interest rates. There is some basis for thinking this. As Box 1 explains, the relationship between asset returns and interest rates tends to be “convex,” meaning that any given change in interest rates will have a bigger effect on returns if rates are low to begin with, as they are today. The effect is particularly pronounced for long duration assets such as long-term bonds, equities, or real estate. Nevertheless, while the theoretical presence of convexity in asset returns is crystal clear, many commentators overstate its practical importance. As Chart 8 shows, the average maturity of government debt stands at seven years. At that level of maturity, the effects of convexity tend to be quite small.1 Chart 8Average Debt Maturity Is Below 10 Years In Most Countries
Bond Yields: How High Is Too High?
Bond Yields: How High Is Too High?
Granted, the overall stock of debt has increased in relation to GDP. However, much of that additional debt has been absorbed by central banks, reducing the amount of government debt available for the private sector. What about equities? The ratio of stock market capitalization-to-GDP has risen to 59%, up from a low of 24% in 2009, and close to its 2000 highs (Chart 9). Does that mean that stocks will sink if yields rise from current levels? Not necessarily. Remember that the discount rate is not the only thing that affects the present value of a stream of income. The expected growth rate of that income also matters. In fact, in the standard dividend discount model, it is simply the difference between the discount rate and the growth rate of dividends that determines how much a stock is worth. If higher bond yields coincide with rising growth expectations, stock prices do not need to fall at all. Chart 9Equity Market Cap Is Approaching Previous Highs
Equity Market Cap Is Approaching Previous Highs
Equity Market Cap Is Approaching Previous Highs
Chart 10 shows that the monthly correlation between equity returns and bond yields remains as high as ever. This suggests that favorable economic news, to the extent that it leads investors to revise up the expected growth rate for earnings, usually more than compensates for a rising discount rate (Chart 11). Chart 10Correlation Between Equity Returns And Bond Yields Remains High
Correlation Between Equity Returns And Bond Yields Remains High
Correlation Between Equity Returns And Bond Yields Remains High
Chart 11Earnings Estimates Tend To Move In Sync With Swings In Bond Yields
Earnings Estimates Tend To Move In Sync With Swings In Bond Yields
Earnings Estimates Tend To Move In Sync With Swings In Bond Yields
So why are so many investors worried that higher bond yields will undercut stocks? The answer has less to do with convexity and more to do with the fear that bond yields will reach a level that chokes off growth. The combination of a rising discount rate and a falling growth rate would be toxic for equities and other risk assets. Debt Worries Likewise, it is not so much that corporate bond investors are worried that rising yields will cause interest payments to swell. After all, interest costs are still quite low as a share of cash flows for most firms (Chart 12). Rather, the fear is that higher yields will imperil growth, causing those cash flows to evaporate. Government debt is also much less of a problem than often assumed, at least in countries that issue bonds in their own currencies. The standard rule for debt sustainability says that the debt-to-GDP ratio will always converge to a stable level if the interest rate is below the growth rate of the economy.2 This is easily the case in almost all economies today (Chart 13). Chart 12US Corporate Sector: Interest Payments Are Not A Worry
US Corporate Sector: Interest Payments Are Not A Worry
US Corporate Sector: Interest Payments Are Not A Worry
Chart 13Bond Yield Minus GDP Growth: Please Mind The Gap
Bond Yields: How High Is Too High?
Bond Yields: How High Is Too High?
The only places where central banks are severely constrained in raising rates are in economies such as Canada, Sweden, and Australia where debt-financed housing bubbles have formed (Chart 14). However, even in these countries, the quality of mortgage underwriting has generally been strong, implying that a banking crisis would likely be avoided. Chart 14Canada, Sweden, And Australia Stand Out As Having Very Frothy Housing Markets
Canada, Sweden, And Australia Stand Out As Having Very Frothy Housing Markets
Canada, Sweden, And Australia Stand Out As Having Very Frothy Housing Markets
It’s Really About The Neutral Rate The discussion above suggests that the main constraint to higher bond yields is the economy itself. If bond yields rise enough, the interest rate-sensitive sectors of the economy will weaken, and a recession will ensue. As long as bond yields are rising in response to stronger growth, as will be the case for the next two years, equities will be fine. Unfortunately, no one knows where the neutral rate – the interest rate demarcating the boundary between expansionary and contractionary monetary policy – really lies. Chart 15Rising Labor Share Of Income Occurring Alongside Labor Market Tightening
Rising Labor Share Of Income Occurring Alongside Labor Market Tightening
Rising Labor Share Of Income Occurring Alongside Labor Market Tightening
Slower trend growth has probably reduced the neutral rate, as has the shift to a more “capital-lite” economy. On the flipside, other forces have probably raised the neutral rate over the past few years. A tighter labor market has increased workers’ share of national income (Chart 15). Since workers spend more of every dollar of income than companies, this has raised aggregate demand. Fiscal policy has also been loosened, while elevated asset prices have likely incentivized some spending that would otherwise not have taken place. Even though we do not know the exact value of the neutral rate, we do know that the unemployment rate has been falling in most countries for the past 10 years, a period during which bond yields were generally higher than today. This suggests that monetary policy remains in expansionary territory. True, global growth did slow in 2018, just as the Fed was raising rates. However, this probably had more to do with the natural ebb and flow of the global manufacturing cycle, exacerbated by the Chinese deleveraging campaign and the brewing trade war. If global growth recovers this year, as we expect, estimates of the neutral rate will rise. This will allow equity prices to increase even in an environment of modestly higher bond yields. Inflation Is Coming… Eventually While stronger economic growth will lift bond yields this year, the big move in yields will only come when inflation breaks out. Core inflation tends to track unit labor costs (Chart 16). Unit labor cost inflation has remained range-bound for most of the recovery in the United States, which explains the failure of inflation to take flight. Unit labor cost inflation has been even more moribund elsewhere. Chart 16Core Inflation Tends To Track Unit Labor Costs
Core Inflation Tends To Track Unit Labor Costs
Core Inflation Tends To Track Unit Labor Costs
Chart 17Correlation Between Labor Market Slack And Wage Growth Remains Intact
Bond Yields: How High Is Too High?
Bond Yields: How High Is Too High?
Looking out, barring a major surge in productivity, rising wage growth should lead to accelerating unit labor cost inflation, first in the US and then in the rest of the world, which will translate into higher price inflation. We doubt that such a price-wage spiral will erupt this year. If anything, US wage growth has leveled off recently, with the year-over-year change in average hourly earnings falling back below the 3% mark. Nevertheless, the long-term correlation between labor market slack and wage growth remains intact (Chart 17). As wage growth reaccelerates, unit labor cost inflation will drift higher, setting the stage for a period of rising price inflation. Investors should maintain below-benchmark duration in global fixed-income portfolios, favoring inflation-linked over nominal bonds and positioning for steeper yield curves. Gold should also do well next year. As long as bond yields are rising in response to stronger growth, as will be the case for the next two years, equities will be fine. The stock market will buckle, however, once stagflation sets in around 2022. Box 1 Asset Prices And Interest Rates: The Role Of Convexity
Bond Yields: How High Is Too High?
Bond Yields: How High Is Too High?
Peter Berezin Chief Global Strategist peterb@bcaresearch.com Footnotes 1Assuming semi-annual compounding, the price of a 10-year bond with a 5% coupon rate falls by 7.9% if the yield increases from 1% to 2%, which is only slightly higher than the 7.6% decline that would be incurred if the yield increases from 4% to 5%. 2One might add that if the interest rate is below the growth rate of the economy, a higher starting point for the debt stock will allow for more debt issuance without leading to a higher debt-to-GDP ratio. As we have shown before, the steady-state debt-to-GDP ratio can be expressed as p/(r-g), where r is the interest rate, g is trend GDP growth, and p is the primary (i.e., non-interest) budget balance. Thus, for example, if the government wanted to achieve a stable debt-to-GDP ratio of 50% and r-g is -2%, it would need to run a primary budget deficit of 0.5*0.02=1% of GDP. However, if the government targeted a stable debt-to-GDP ratio of 200%, it could run a primary budget deficit of 2*0.02=4% of GDP. Global Investment Strategy View Matrix
Bond Yields: How High Is Too High?
Bond Yields: How High Is Too High?
MacroQuant Model And Current Subjective Scores
Bond Yields: How High Is Too High?
Bond Yields: How High Is Too High?
Strategic Recommendations Closed Trades
Highlights We expect both the Australian dollar and Chinese RMB to move higher in the coming months. A key catalyst is broad-based weakness in the US dollar. The composition of goods benefiting from the US-China Phase I deal are a small portion of Australia’s export basket, limiting substitution. Remain long AUD/NZD and AUD/CAD. Place a limit buy on AUD/USD at 0.68. Feature The three key obstacles that have been hijacking currency markets are finally being addressed. First, the lack of dollar liquidity that was creating a funding crisis in repo markets has been curtailed via significant expansion of the Federal Reserve’s balance sheet. The Libor-OIS spread - a measure of banking stress - is rapidly narrowing (Chart I-1). Second, the US-China trade deal has cemented a cap on economic policy uncertainty for now. At minimum, this should allow for an increase in cross-border flows, which tends to be positive for growth. As a counter-cyclical currency, the US dollar will continue to depreciate as global growth improves. The third obstacle giving way is political risk. The biggest uncertainty for the dollar was the surge in far-left populist candidates, especially Elizabeth Warren. The result would be a highly polarized election campaign, heightening uncertainty. The near-term reaction would be a surge in safe-haven demand, even though far-left policies could significantly knock down expected returns on US assets, which would be negative for the dollar. Chart I-1An Improvement In Dollar Liquidity
An Improvement In Dollar Liquidity
An Improvement In Dollar Liquidity
Chart I-2The Dollar And Election Outcomes
The Dollar And Election Outcomes
The Dollar And Election Outcomes
Chart I-2 shows that the ebb and flow in the dollar in recent months has eerily matched the probability of a Donald Trump–Elizabeth Warren contest. With a centrist like former Vice President Joe Biden now likely the next democratic nominee, the likelihood of a knee-jerk rally in the dollar has subsided. Unless these risks flare up again, this suggests that for the next few months, US dollar long positions face asymmetric downside risk. This creates a growing number of trading opportunities on the short side. Australian Growth And The Fires One of the FX market’s current favorite short positions is the Australian dollar (Chart I-3). Granted, most incoming data over the past year have been negative for the Aussie dollar, and typical global reflation indicators are just beginning to show tentative signs of a bottom. Among our favorite indicators on whether or not easing liquidity conditions are fuelling higher global growth are the copper-to-gold and oil-to-gold ratios. The signal is usually strongest when they are moving in tandem with US bond yields, another global growth barometer. The message so far has been one of stabilization rather than a renewed reflation cycle (Chart I-4). Chart I-3Lots Of AUD Shorts
On AUD And CNY
On AUD And CNY
Chart I-4Reflation Barometers
Reflation Barometers
Reflation Barometers
The devastating fires that are sweeping through Australia are the worst in decades. As we go to press, the death toll has risen to at least 25, and the cumulative damage is expected to exceed A$4.4 billion.1 Given that we are still in the middle of the summer months, both are likely to keep ramping up. Tourist arrivals are already down significantly, and both business and consumer confidence are approaching fresh lows. This augurs a swift and powerful policy response. Tourist arrivals are already down significantly, and both business and consumer confidence are approaching fresh lows. This augurs a swift and powerful policy response. So far, at A$2 billion, the fiscal pledge will do little to alter Australia’s economic fortunes (Chart I-5). But given the scale of this season’s fires, the effects are rapidly spilling over into urban populated areas and tourist hot spots compared to the past. This suggests more fiscal stimulus will be forthcoming. Chart I-5The Fiscal Impulse Is Minuscule
The Fiscal Impulse Is Minuscule
The Fiscal Impulse Is Minuscule
Naturally, the odds of the Reserve Bank of Australia cutting rates at its next policy meeting are rapidly rising. The RBA views the risks from climate change through the lens of financial stability.2 With insurance companies slated to rack up significant losses, along with the immediate impact of slower economic growth, lower rates will likely be the policy of choice. The probability of a rate cut next month is currently being priced at 55%. That said, we would still be buyers of the AUD today despite an impending rate cut. Bottom Line: The latest fires have hit the Australian economy at a time when growth is weak. We expect the RBA to cut rates. How To Trade The Aussie For most small, open economies, external conditions tend to be more important for asset prices than what is happening domestically. In the case of the Australian dollar, the commodity cycle has been the most important driver (Chart I-6). Similarly, the most important catalyst for multiple expansion in Australian equities is Chinese credit demand. This makes sense, since over 35% of Australian exports go to China (Chart I-7), generating tremendous income for domestically-listed concerns. Chart I-6AUD Tracks Commodities
AUD Tracks Commodities
AUD Tracks Commodities
Chart I-7Australian Equities And Chinese Credit
Australian Equities And Chinese Credit
Australian Equities And Chinese Credit
Australian exports have remained resilient in recent weeks, and are unlikely to be affected much by the Phase I trade deal. This is because the composition of goods that have been spared additional tariffs or seen much-reduced export duties are mostly consumer goods that make up a small portion of Australia’s export basket. This means that the path of least resistance for Aussie assets will continue to be dictated by Chinese reflationary efforts. On that front, we have seen a number of green shoots, notably the rise in the manufacturing PMI, retail sales, imports and exports. Last night’s credit numbers were also robust. Meanwhile, interest rates in China continue to be lowered. For most small, open economies, external conditions tend to be more important for asset prices.In the case of the Australian dollar, the commodity cycle has been the most important driver. Our favorite indicator for Chinese domestic demand is the lag between the drop in bond yields (more and more credit is being intermediated through the bond market) and the pick-up in import demand. This suggests a very healthy recovery in Chinese consumption (Chart I-8). Chart I-8Chinese Imports And Bond Yields
Chinese Imports And Bond Yields
Chinese Imports And Bond Yields
How to trade the Aussie will depend on time horizons. In the near-term, improving global growth will likely be accompanied by a weakening dollar. This means the most potent trade in the short term will be long AUD/USD. Given our bias that we will get a dovish surprise from the RBA next month, we are instituting a limit-buy on AUD/USD at 68 cents today. Over the longer term, we believe the Australian dollar will outperform its commodity-currency counterparts. In our portfolio, we are already both long AUD/CAD and AUD/NZD. This bullish view is predicated on three key developments: Commodity Prices: One bright spot for the Aussie dollar has been rising terms of trade. However, the media often focuses on rising steel and iron ore prices as a catalyst for rising terms of trade in Australia. While true, often overlooked is the rising share of liquefied natural gas in the export mix (Chart I-9). Beijing has a clear environmental push to shift its economy away from coal electricity generation and towards natural gas. Given that reducing if not outright eliminating pollution is a long-term strategic goal in China, this will be a multi-year tailwind. As the market becomes more liberalized and long-term contracts are revised to reflect higher spot prices, the Aussie dollar will get a boost (Chart I-10). In a nutshell, this is a bet that terms of trade in Australia will continue to outpace those in Canada and New Zealand over the medium-term. Chart I-9LNG Will Be A Game-Changer For Australia
LNG Will Be A Game-Changer For Australia
LNG Will Be A Game-Changer For Australia
Chart I-10A Terms-Of-Trade Tailwind
A Terms-Of-Trade Tailwind
A Terms-Of-Trade Tailwind
Construction Activity: All things equal, natural disasters tend to be ultimately positive for GDP, since the destruction in the capital stock does not go into the GDP equation, but reconstruction efforts do. This is especially the case when the economy is running well below capacity. The downturn in Australian housing on the back of macro-prudential measures has been negative for consumption via the wealth effect and the outlook for residential construction activity. At a minimum, this downturn should stabilize as reconstruction efforts pick up (Chart I-11). Meanwhile, policy has become supportive for Aussie homebuyers at the margin. The government now guarantees first-time homebuyers in Australia below a certain income threshold access to the housing market, with just a 5% down payment instead of the standard 20%. Should labor market conditions improve, it will also help household income levels. Already, the Liberal-National coalition has left in place “negative gearing”3 and kept the capital gains tax exemption from selling properties at 50% (the pledge from the center-left Labour party was to reduce it to 25%). Aussie home prices are further along their downward adjustment path than, say, Canada or New Zealand. Most importantly, Aussie home prices are further along their downward adjustment path than, say, Canada or New Zealand. The mirror image has been that Aussie banks have massively underperformed those in Canada (Chart I-12). Over the medium term, we could see a reversal of these fortunes. Chart I-11Capex Should Rise In Australia
Capex Should Rise In Australia
Capex Should Rise In Australia
Chart I-12Aussie Banks Versus Canadian Banks
Aussie Banks Versus Canadian Banks
Aussie Banks Versus Canadian Banks
Valuation And Sentiment: We will show in an upcoming report that while currency valuation is a poor timing tool, it is excellent for calibrating longer-term returns. One of our favorite metrics for gauging the Australian dollar’s fair value is its real effective exchange rate relative to its terms of trade. On this basis, the Aussie dollar is cheap by about 18% (Chart I-13). In terms of currency performance, a lot of the bad news already appears priced in the Australian dollar, which is down 15% from its 2018 peak, and 37% from its 2011 peak. Meanwhile, Australian dollar short positions appeared to have already hit a nadir. This suggests outright short AUD bets are at risk from either upside surprises in global growth or simply the forces of mean reversion (Chart I-14). Chart I-13AUD Is Cheap
AUD Is Cheap
AUD Is Cheap
Chart I-14Still Lots Of AUD Shorts
Still Lots Of AUD Shorts
Still Lots Of AUD Shorts
Bottom Line: Place a limit buy on AUD/USD at 0.68. Remain long AUD/NZD and AUD/CAD. Notes On The RMB The currency details from the Phase I trade deal were vague, suggesting monitoring export balances and FX reserves, data that is already available publicly. Our guess is that there was some kind of handshake accord agreed upon to ensure that the RMB does not depreciate significantly in the coming months. More importantly, the RMB will also be a beneficiary from increased cross-border trade, given that it has been trading like a pro-cyclical currency. The USD/CNY has been moving tick-for-tick with emerging market equities, Asian currencies, and even some commodity prices (Chart I-15). It has also closely mirrored the broad trade-weighted dollar (Chart I-16). Chart I-15CNY And EM Assets
CNY And EM Assets
CNY And EM Assets
Chart I-16CNY And The Dollar
CNY And The Dollar
CNY And The Dollar
This has implications for developed market currencies, since the RMB is often a signaling mechanism on the efficacy of China’s reflationary efforts. Fundamentally, the RMB has more upside. In a world of rapidly falling yields, Chinese rates remain attractive. Historically, the USD/CNY has moved in line with interest rate differentials between the US and China. The current divergence pins the USD/CNY near 6.7 (Chart I-17). Chart I-17USD/CNY Could Touch 6.7
USD/CNY Could Touch 6.7
USD/CNY Could Touch 6.7
Bottom Line: Remain positive on the RMB. Housekeeping The Canadian dollar is one of the strongest currencies this year. The most recent catalyst was good news from the Bank of Canada’s business outlook survey, a key input into policy decisions. Canadian firms are now expecting an acceleration in both domestic and international sales throughout 2020, particularly outside the energy sector (Chart I-18, top panel). Chart I-18BoC Business Outlook Survey
BoC Business Outlook Survey
BoC Business Outlook Survey
Hiring intentions among surveyed firms edged up in Q4. Meanwhile, many firms reported facing capacity pressures, particularly related to a shortage of labor (Chart I-18, middle panel). This will allow the BoC to overlook weak labor market data in October and November. That said, it is not all clear blue skies for the CAD. The balance of opinion for capex intentions among surveyed Canadian firms plunged in Q4 (Chart I-18, bottom panel). We will be monitoring these developments but remain short CAD/NOK and long AUD/CAD for the time being. Chester Ntonifor Foreign Exchange Strategist chestern@bcaresearch.com Footnotes 1 Keith Bradsher and Isabella Kwai, “Australia’s Fires Test Its Winning Growth Formula,” The New York Times, January 13, 2020. 2 Please see “Financial Stability Risks From Climate Change,” Financial Stability Review, Reserve Bank Of Australia, October 2019. 3 The practice of using investment properties that are generating losses to offset one’s income tax bill. Currencies U.S. Dollar Chart II-1USD Technicals 1
USD Technicals 1
USD Technicals 1
Chart II-2USD Technicals 2
USD Technicals 2
USD Technicals 2
Recent data in the US have been mixed: On the labor market front, nonfarm payrolls increased by 145K in December, the smallest increase since May. Average hourly earnings growth slowed to 2.9%, while the unemployment rate was unchanged at 3.5%. Lastly, initial jobless claims fell to 204K for the week ended January 10th. The NFIB business optimism index declined to 102.7 from 104.7 in December. Headline inflation increased to 2.3% year-on-year in December, while core inflation was unchanged at 2.3%. Both the NY Empire State and Philly Fed manufacturing indices rose to 4.8 and 17, respectively in January. The DXY index fell by 0.3% this week. While both headline and core inflation remain close to target, the bearish job report last Friday is likely to reduce the scope for the Fed to raise rates in the near term. Report Links: On Oil, Growth And The Dollar - January 10, 2020 Updating Our Balance Of Payments Monitor - November 29, 2019 Place A Limit Sell On DXY At 100 - November 15, 2019 The Euro Chart II-3EUR Technicals 1
EUR Technicals 1
EUR Technicals 1
Chart II-4EUR Technicals 2
EUR Technicals 2
EUR Technicals 2
Recent data in the euro area have been mixed: The seasonally-adjusted trade balance fell by €4.8 billion to €19.2 billion in November. Industrial production fell by 1.5% year-on-year in November. German GDP grew by 0.6% year-on-year in 2019, down from 1.5% the previous year. Car registrations rose by a remarkable 21.7% in December. The euro rose by 0.3% against the US dollar this week. "Incoming data since the last monetary policy meeting pointed to continued weak but stabilizing euro area growth dynamics," according to the ECB Meeting Accounts this Thursday. Moreover, both private and government consumption accelerated in 2019, while capex and exports slowed down. A pickup in global growth will be bullish the euro. Report Links: Updating Our Balance Of Payments Monitor - November 29, 2019 On Money Velocity, EUR/USD And Silver - October 11, 2019 A Few Trade Ideas - Sept. 27, 2019 Japanese Yen Chart II-5JPY Technicals 1
JPY Technicals 1
JPY Technicals 1
Chart II-6JPY Technicals 2
JPY Technicals 2
JPY Technicals 2
Recent data in Japan have been mixed: Both the coincident and leading indices fell to 95.1 and 90.9, respectively in November. That said, they were above expectations. The current account balance fell to ¥1,437 billion from ¥1,817 billion in November. The trade balance shifted from a surplus of ¥254 billion to a small deficit of ¥2.5 billion. The Eco Watchers' Survey recorded an improvement of current conditions to 39.8 in December, while the outlook index marginally dropped to 45.7. Preliminary machine tool orders continued to plunge by 33.6% year-on-year in December. However, machinery orders increased by 5.3% year-on-year in November. The Japanese yen depreciated by 0.4% against the US dollar this week. The recent Eco Watchers' Survey was cautiously positive on the Japanese outlook. We continue to recommend the Japanese yen as a safe-haven hedge. Report Links: Updating Our Balance Of Payments Monitor - November 29, 2019 Signposts For A Reversal In The Dollar Bull Market - November 1, 2019 A Few Trade Ideas - Sept. 27, 2019 British Pound Chart II-7GBP Technicals 1
GBP Technicals 1
GBP Technicals 1
Chart II-8GBP Technicals 2
GBP Technicals 2
GBP Technicals 2
Recent data in the UK have been weak: Core CPI fell to 1.4% while core PPI declined to 0.9%. The total trade balance (including EU) rose from a deficit of £1.3 billion to a surplus of £4 billion in November. Industrial production fell by 1.6% year-on-year in November; manufacturing production also fell by 2% year-on-year in November. The notable improvement was in car registrations that rose 3.4% year-on-year in December. The British pound fell by 0.2% against the US dollar this week. The recent drop in inflation has undoubtedly put more pressure on the BoE to reduce rates in the coming policy meeting late January. The market is now pricing in a 66% probability for a rate cut, up from 40% a week ago, while a 25 bps cut is fully priced in by May. Report Links: Updating Our Balance Of Payments Monitor - November 29, 2019 A Few Trade Ideas - Sept. 27, 2019 United Kingdom: Cyclical Slowdown Or Structural Malaise? - Sept. 20, 2019 Australian Dollar Chart II-9AUD Technicals 1
AUD Technicals 1
AUD Technicals 1
Chart II-10AUD Technicals 2
AUD Technicals 2
AUD Technicals 2
Recent data in Australia have been mostly negative: The AiG services PMI fell to 48.7 from 53.7 in December. Retail sales increased by 0.9% month-on-month in November. Melbourne Institute headline inflation fell to 1.4% from 1.5% year-on-year in December. Home loans increased by 1.8% month-on-month in November, higher than expectations of a 1.4% increase. The Australian dollar is flat this week. The ongoing wildfires continue to impact the Australian economy, particularly the tourism industry. Please refer to our front section for a more in-depth analysis on Australia. Report Links: Updating Our Balance Of Payments Monitor - November 29, 2019 A Contrarian View On The Australian Dollar - May 24, 2019 Beware Of Diminishing Marginal Returns - April 19, 2019 New Zealand Dollar Chart II-11NZD Technicals 1
NZD Technicals 1
NZD Technicals 1
Chart II-12NZD Technicals 2
NZD Technicals 2
NZD Technicals 2
Recent data in New Zealand have been soft: Building permits fell by 8.5% month-on-month in November. REINZ house prices grew by 1.2% month-on-month in December. The New Zealand dollar has been flat versus the US dollar this week. The recent quarterly survey from the New Zealand Institute of Economic Research (NZIER) showed that a net 21% of firms surveyed expected business conditions to deteriorate, an improvement from 40% in the previous survey. Improving data has led speculators to close NZD shorts. Stay long AUD/NZD. Report Links: Updating Our Balance Of Payments Monitor - November 29, 2019 Place A Limit Sell On DXY At 100 - November 15, 2019 USD/CNY And Market Turbulence - August 9, 2019 Canadian Dollar Chart II-13CAD Technicals 1
CAD Technicals 1
CAD Technicals 1
Chart II-14CAD Technicals 2
CAD Technicals 2
CAD Technicals 2
Recent data in Canada have been positive: The unemployment rate fell further to 5.6% from 5.9% in December. Average hourly wage growth slowed to 3.8% from 4.4% year-on-year in December. 35.2K new jobs were created compared to a loss of 71.2K jobs the previous month. The Canadian dollar increased by 0.1% against the US dollar this week. The recent BoC Business Outlook Survey indicator edged up in Q4, lowering the probability that the BoC will cut interest rates next week. That said, the forecast for weak investment spending is worrisome. Report Links: The Loonie: Upside Versus The Dollar, But Downside At The Crosses Updating Our Balance Of Payments Monitor - November 29, 2019 Making Money With Petrocurrencies - November 8, 2019 Swiss Franc Chart II-15CHF Technicals 1
CHF Technicals 1
CHF Technicals 1
Chart II-16CHF Technicals 2
CHF Technicals 2
CHF Technicals 2
There was scant data out of Switzerland this week: The unemployment rate was unchanged at 2.3% in December. The Swiss franc has appreciated by 1% against the US dollar, making it the best performing G10 currency this week. It is an open question whether the US Treasury’s move to put the Swiss franc on the currency manipulation watch list was a catalyst. What is clear is that interventions in recent weeks have been weak. Meanwhile, the last inflation reading from Switzerland was positive, reducing the urge for the SNB to intervene. EUR/CHF is approaching our limit buy position at 1.06. Stay tuned. Report Links: Updating Our Balance Of Payments Monitor - November 29, 2019 Notes On The SNB - October 4, 2019 What To Do About The Swiss Franc? - May 17, 2019 Norwegian Krone Chart II-17NOK Technicals 1
NOK Technicals 1
NOK Technicals 1
Chart II-18NOK Technicals 2
NOK Technicals 2
NOK Technicals 2
Recent data in Norway have been mixed: The producer price index fell by 2.2% year-on-year in November. Both headline and core inflation fell to 1.4% and 1.8% year-on-year, respectively in December. The trade surplus increased to NOK 25.6 billion from NOK 18.8 billion in December. The Norwegian krone has been flat against the US dollar this week. Both inventory reports from API and EIA have been bearish on oil prices, which put a cap on petrocurrencies this week. However, going forward, we continue to believe that the combination of expansionary monetary and fiscal policy will support commodity demand growth in 2020, which is bullish for the Norwegian krone. Report Links: On Oil, Growth And The Dollar - January 10, 2020 Updating Our Balance Of Payments Monitor - November 29, 2019 Making Money With Petrocurrencies - November 8, 2019 Swedish Krona Chart II-19SEK Technicals 1
SEK Technicals 1
SEK Technicals 1
Chart II-20SEK Technicals 2
SEK Technicals 2
SEK Technicals 2
Recent data in Sweden have been mixed: Industrial production increased by 0.4% year-on-year in November. Manufacturing new orders fell by 1.2% year-on-year in November. Headline inflation was unchanged at 1.8% year-on-year in December. The Swedish krona rose by 0.2% against the US dollar this week. The Swedish government cut the forecast of GDP growth to 1.1% this year, down from the previous figure of 1.4% in September. Moreover, it forecasted negative rates going forward. That said, valuations and improving global growth will remain strong catalysts for long SEK positions. Report Links: Updating Our Balance Of Payments Monitor - November 29, 2019 Where To Next For The US Dollar? - June 7, 2019 Balance Of Payments Across The G10 - February 15, 2019 Trades & Forecasts Forecast Summary Core Portfolio Tactical Trades Limit Orders Closed Trades
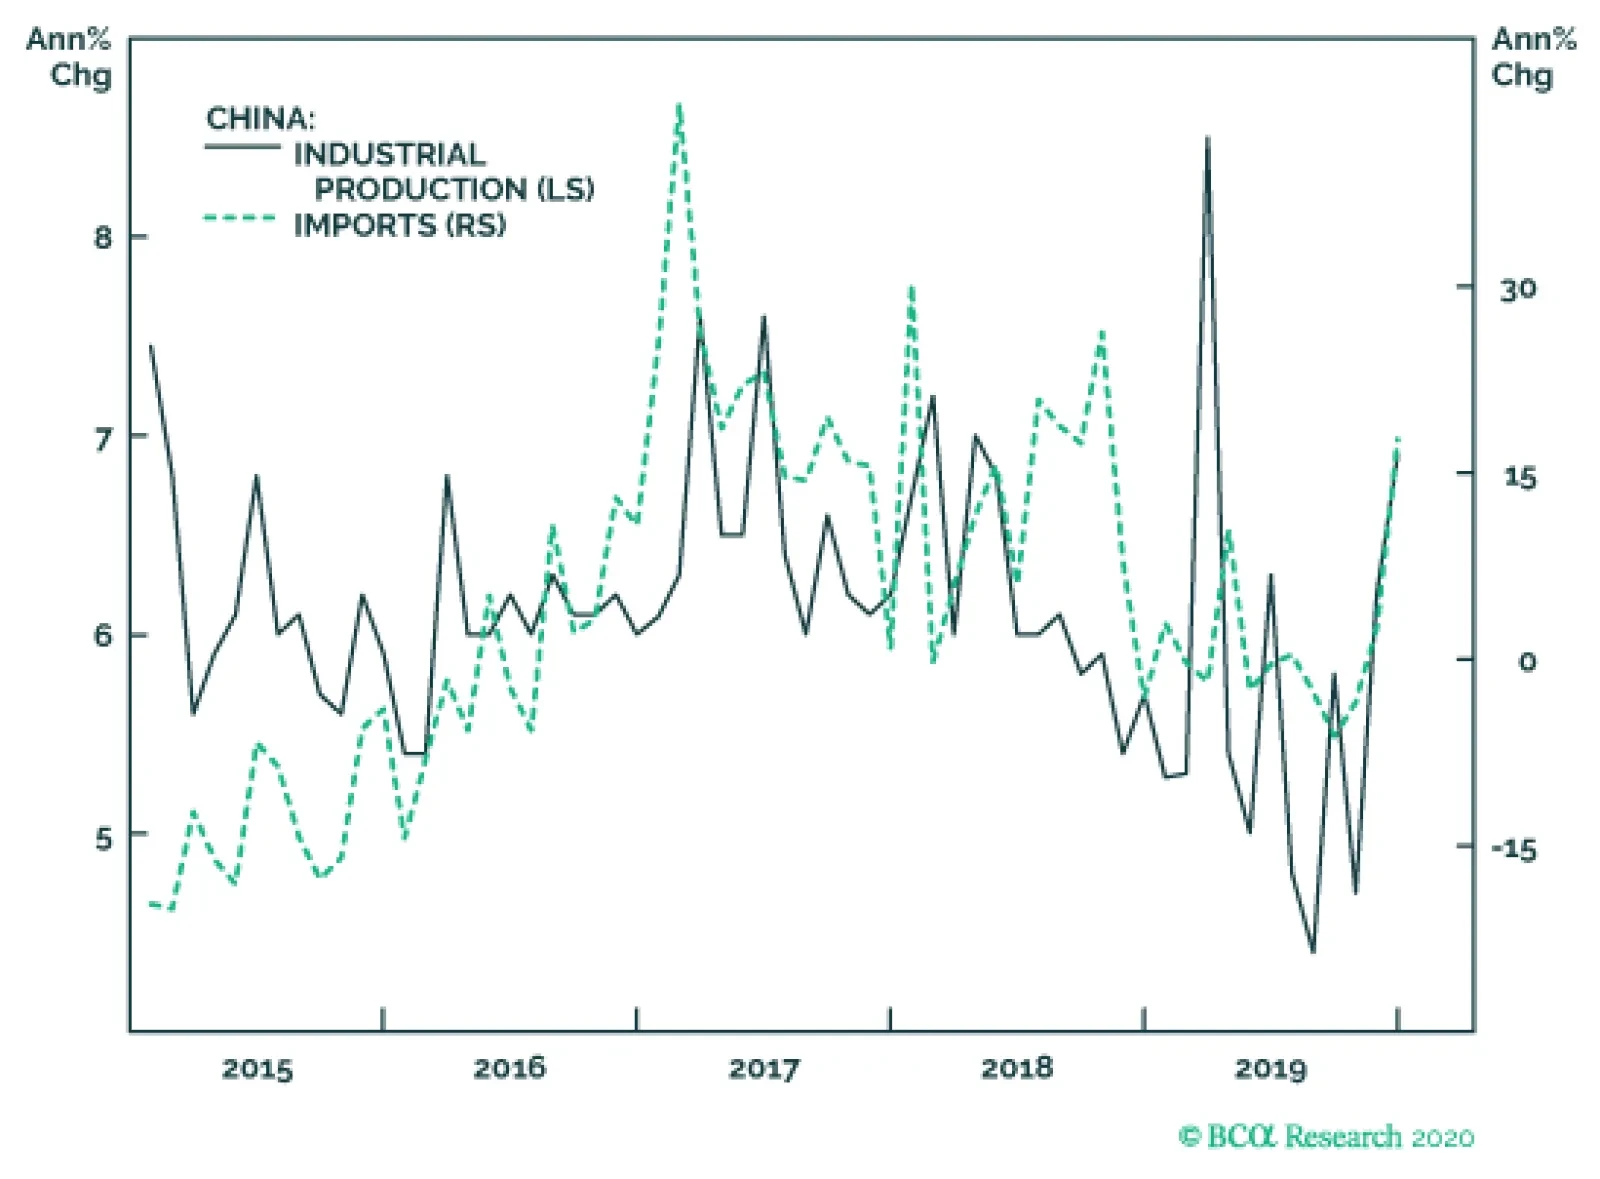
Chinese economic activity is picking up steam. This morning’s releases showed that industrial production accelerated further in December, rising 6.9%. Additionally, fixed-asset investments, retail sales and quarter-on-quarter GDP growth for Q4 all beat…