China
While the growth rate in investable earnings per share has slowed significantly over the past year, it has merely fallen to zero and not deeply into negative territory. In BCA’s China Investment Strategy’s view, the risk of a similar collapse in EPS has…
The trade confrontation has not derailed U.S. household spending as it is still robust. Because they slowed but did not contract, U.S. imports have been a mild positive rather than a negative for global trades. In addition, Chinese exports have been…
Two factors support our baseline view: The direct impact from tariffs on the Chinese economy is limited. Evidence suggests some Chinese exports have been re-routed to peripheral countries to avoid U.S. import tariffs. This implies that real growth in…

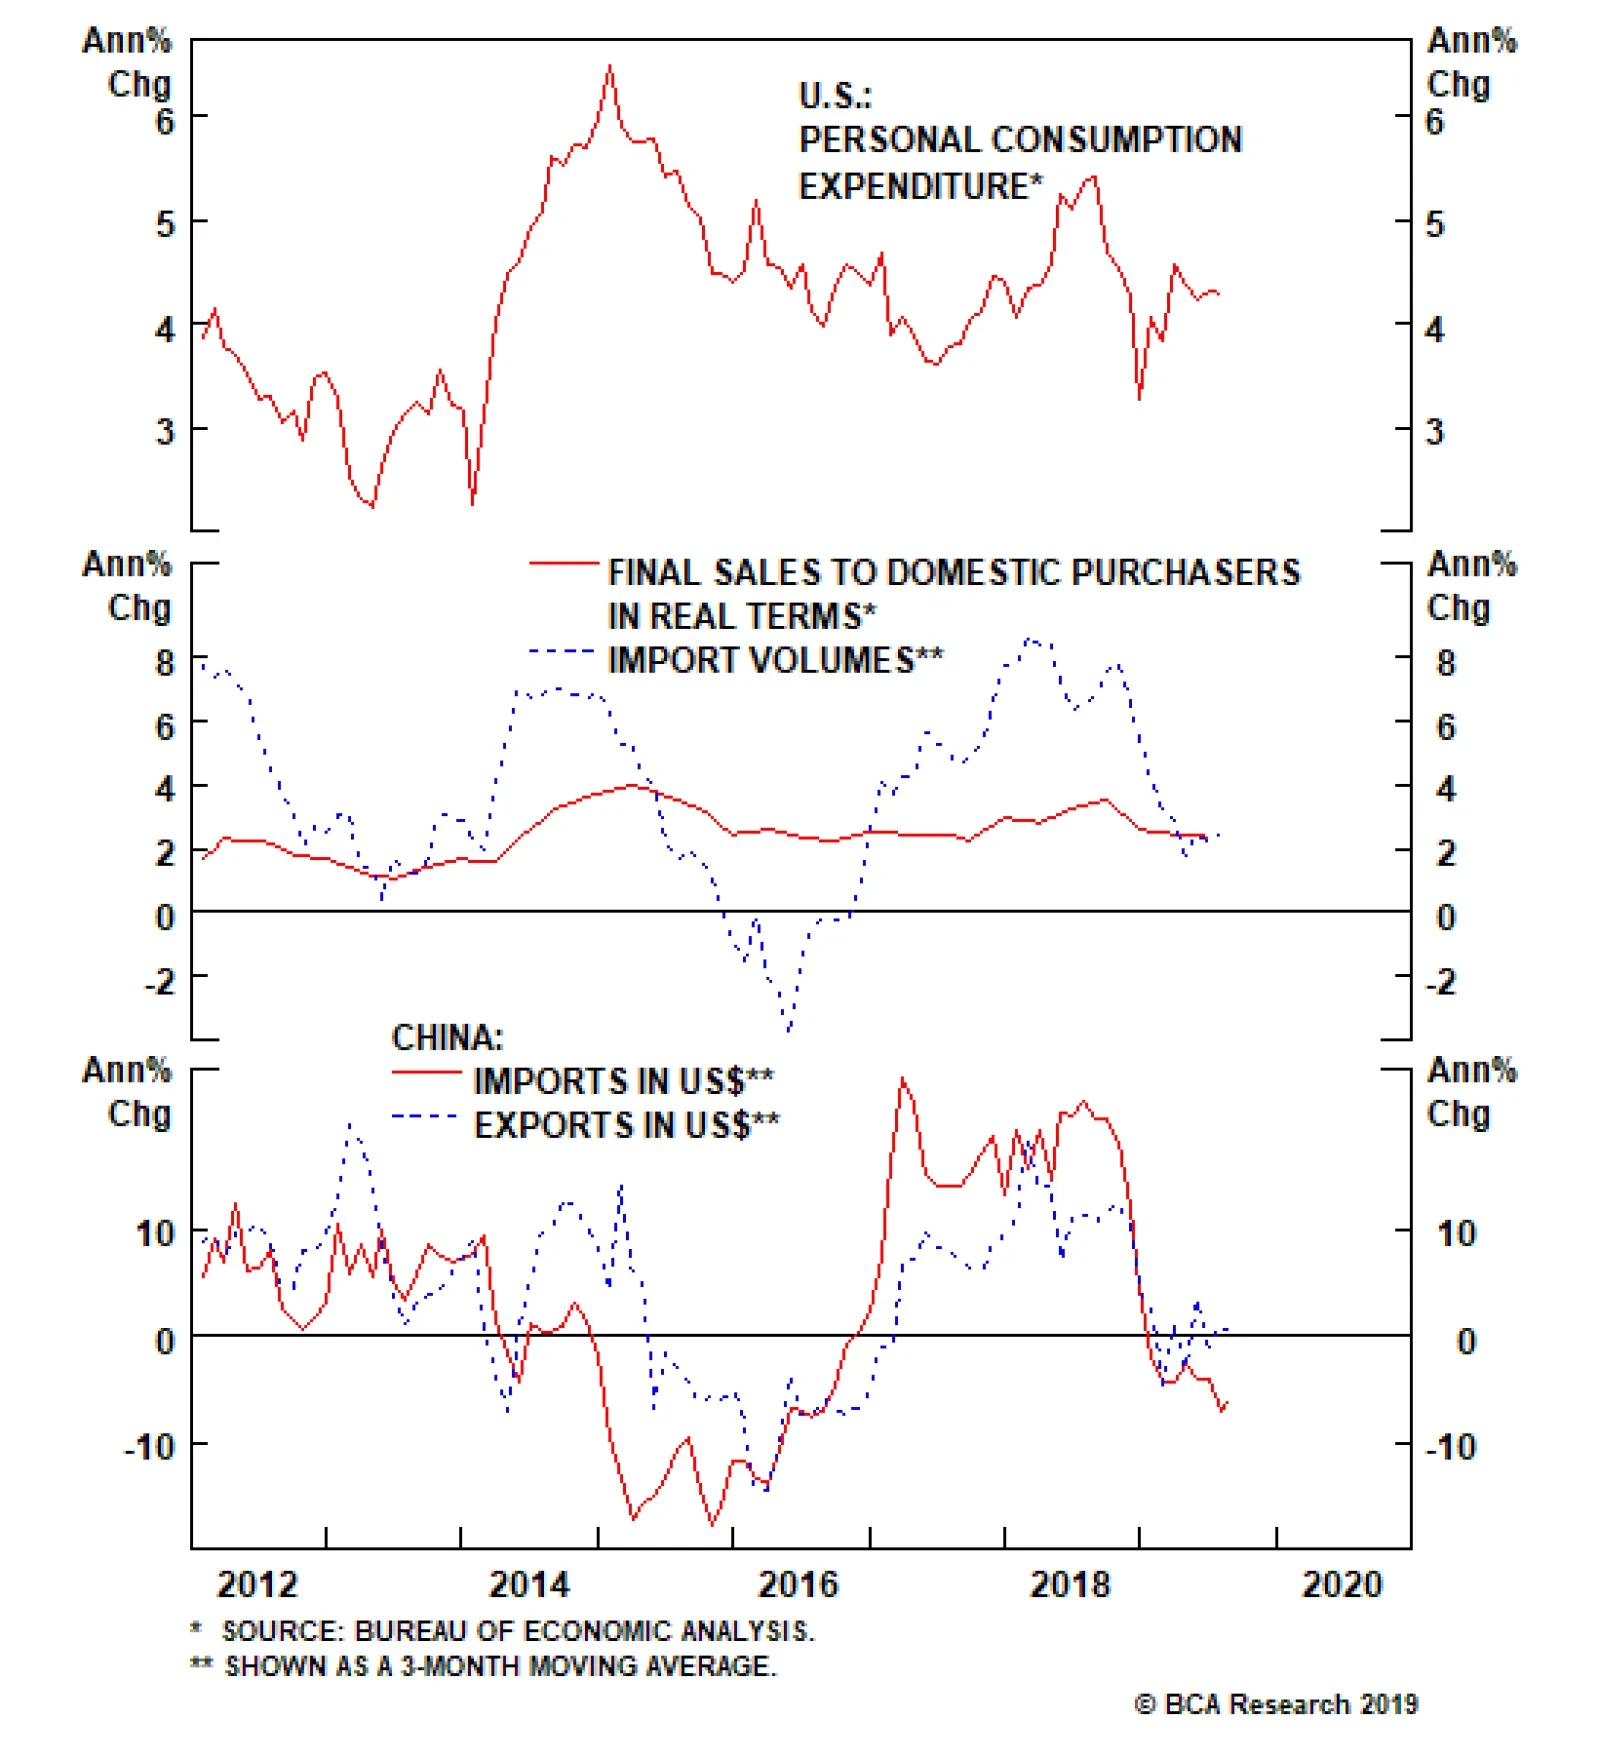
Highlights Analyses on Indonesia and South Africa are available below. The slowdown in Chinese domestic demand has been the main culprit behind the global trade contraction - not the U.S.-China trade confrontation. China’s economy is not reliant on exports to the U.S. and there has been little damage to Chinese total exports. In contrast, Chinese imports have been contracting, dampening global trade. A recovery in the former is contingent on credit stimulus. Feature Chart I-1Chinese Imports Are Contracting Yet U.S. Ones Are Not
Chinese Imports Are Contracting Yet U.S. Ones Are Not
Chinese Imports Are Contracting Yet U.S. Ones Are Not
With odds of a potential trade deal between the U.S. and China rising, the question now becomes whether an imminent acceleration in global trade will occur, sparking a rally in EM risk assets and currencies. We believe the trade confrontation between the U.S. and China has not been the main culprit behind the global trade contraction and manufacturing recession. The latter has primarily been due to a slowdown in Chinese domestic demand. Chart I-1 illustrates that Chinese imports for domestic consumption (excluding processing trade) are shrinking at 6% while U.S. total imports are still growing at 2% from a year ago. Consequently, an improvement in the global business cycle due to a potential trade agreement between the U.S. and China will be limited. Provided the global business cycle is the main factor driving EM risk assets and currencies, there is no sufficient reason to turn bullish on EM at the current juncture. Origin Of The Global Trade Slowdown Tariffs have mainly affected global growth indirectly (via dampening business confidence) rather than directly – by derailing Chinese exports to the U.S. or by affecting American consumer spending. First, U.S. household spending is still reasonably robust, and U.S. imports from the rest of the world have slowed but have not contracted (Chart I-2). Hence, the trade confrontation has not derailed U.S. household spending, and the latter’s impact on global trade has been mildly positive rather than negative. An improvement in the global business cycle due to a potential trade agreement between the U.S. and China will be limited. Second, Chinese exports have been more resilient than those of other Asian economies (Chart I-3). If the tariffs on Chinese exports to the U.S. were the main cause of the global trade slump, Chinese exports would be shrinking the most. Yet Chinese exports are not contracting – their growth rate is close to zero while Korean and Japanese exports have been plummeting (Chart I-3). Chart I-2U.S. Consumer Spending And Imports Have Not Been A Drag On Global Trade
U.S. Consumer Spending And Imports Have Not Been A Drag On Global Trade
U.S. Consumer Spending And Imports Have Not Been A Drag On Global Trade
Chart I-3Exports In China Are Faring Better Than Those In Japan And Korea
Exports In China Are Faring Better Than Those In Japan And Korea
Exports In China Are Faring Better Than Those In Japan And Korea
While China’s shipments to the U.S. have certainly plunged, there is both anecdotal and empirical evidence that mainland-produced goods have been making their way to the U.S. via Taiwan, Vietnam and other economies (Chart I-4). This is why Chinese aggregate exports are not contracting. Third, Chinese exports are doing better than imports (Chart I-5). This tells us that the underlying reason for the slowdown both in China and globally is not tariffs, but rather the weakness in Chinese domestic demand. Chart I-4China's Exports To U.S. Have Been Re-Routed Via Rest Of Asia
China's Exports To U.S. Have Been Re-Routed Via Rest Of Asia
China's Exports To U.S. Have Been Re-Routed Via Rest Of Asia
Chart I-5Chinese Imports Are Worse Than Its Exports
Chinese Imports Are Worse Than Its Exports
Chinese Imports Are Worse Than Its Exports
Importantly, ongoing contraction in Chinese imports excluding processing trade (i.e., excluding imports of inputs that are assembled and then re-exported) is a clear indication of a slump in Chinese domestic demand (please refer to Chart I-1 on page 1). Capital outlays in general and construction activity in particular remain very weak (Chart I-6). This is consistent with shrinking import volumes of capital goods, base metals, chemicals and lumber (Chart I-7). Chart I-6China: Capex Is In Doldrums
China: Capex Is In Doldrums
China: Capex Is In Doldrums
Chart I-7China: Capex-Exposed Imports Are Shrinking
China: Capex-Exposed Imports Are Shrinking
China: Capex-Exposed Imports Are Shrinking
Chart I-8China's Economy Is Not Reliant On Exports To The U.S.
China's Economy Is Not Reliant On Exports To The U.S.
China's Economy Is Not Reliant On Exports To The U.S.
Finally, Chart I-8 shows that Chinese exports to the U.S. before the commencement of the trade war represented less than 4% of Chinese GDP. In contrast, capital spending in China is 42% of GDP. Hence, China’s economy is not reliant on exports to the U.S. This is why in our research and strategy we emphasize the mainland’s money/credit cycle – which leads capital spending – much more than its exports. To be clear, we are not implying that the U.S.-China trade confrontation has had no bearing on global growth. It has certainly affected business and consumer sentiment in China and hurt confidence among multinational companies. Hence, a trade deal could boost sentiment among these segments, leading to some improvement in their spending. Nevertheless, odds are that businesspeople in China and multinational CEOs around the world will realize that we are witnessing a secular rise in the U.S.-China confrontation, and that any trade deal will be temporary. The basis is that the genuine interests of the U.S. go against China’s national interests, since the U.S. has an interest in preventing the formation of a regional empire that can then challenge it for global supremacy. Conversely, whatever is in the long-term interests of China will not be acceptable for the U.S., particularly China’s rapid military and technological advancement. As such, global CEOs may see through a trade deal and any improvement in their confidence will likely be muted. In fact, if a China-U.S. trade détente leads Chinese authorities to resort to less stimulus going forward, odds are that China’s domestic demand revival will be delayed. Hence, the positive boost to global trade will not be substantial. The underlying reason for the slowdown both in China and globally is not tariffs, but rather the weakness in Chinese domestic demand. In such a case, global manufacturing and trade contraction will likely last longer than financial markets are presently pricing in. Asset prices will need to be reset in this scenario before a new cyclical rally begins. Bottom Line: The trade confrontation has not been the main reason behind the global trade slowdown. Consequently, its temporary resolution may not be enough to produce a cyclical recovery in global trade. Given financial markets have already bounced back in recent weeks, they may follow a “buy the rumor, sell the news” pattern regarding the trade deal. Investors should continue to underweight EM equities, sovereign credit and currencies within respective global portfolios. In absolute term, risks to EM assets and currencies are still tilted to the downside too. Arthur Budaghyan Chief Emerging Markets Strategist arthurb@bcaresearch.com Indonesia: Relapsing Growth Risks Foreign Outflows Indonesian stocks and the rupiah have been benefiting from falling U.S. interest rate expectations. This has been occurring even though domestic fundamentals, namely economic growth and the outlook for corporate profits, have been deteriorating. The Indonesian economy is undergoing a sharp slowdown: The private credit impulse is declining (Chart II-1, top panel). Retail sales volume of various goods are heading south (Chart II-1, middle panel). Mirroring the weakness in investment expenditures, capital goods imports are shrinking (Chart II-1, bottom panel). Passenger car sales are shrinking and sales of other types of vehicles have stalled. The real estate sector has entered a weak spot as well. House prices are only growing at 2% in nominal local currency terms according to data from the central bank. Growth in rail freight transport has stalled and the manufacturing PMI has dipped below the critical 50 level (Chart II-2, top and middle panels). Domestic cement consumption is contracting (Chart II-2, bottom panel). Chart II-1Indonesia: Domestic Demand Is Slumping
Indonesia: Domestic Demand Is Slumping
Indonesia: Domestic Demand Is Slumping
Chart II-2Indonesia: Business Activity Is Anemic
Indonesia: Business Activity Is Anemic
Indonesia: Business Activity Is Anemic
Finally, exports are dwindling at an annual rate of -8% from a year ago. Chart II-3Borrowing Costs Are Elevated Relative To Nominal Income Growth
Borrowing Costs Are Elevated Relative To Nominal Income Growth
Borrowing Costs Are Elevated Relative To Nominal Income Growth
This growth deceleration is due to the ongoing contraction in exports, slowing domestic loan growth and somewhat conservative fiscal policy. These factors have altogether hit nominal incomes and hurt spending. Meanwhile, Indonesia’s lending rates remain elevated and well above nominal growth (Chart II-3). Such a gap between nominal income growth and borrowing costs is exerting deflationary pressures on the Indonesian economy. Consistent with worsening growth dynamics, non-financial stocks have been struggling and small cap stocks have been in a bear market since 2013 (Chart II-4). The basis is poor and deteriorating profitability among non-financial firms (Chart II-5). Chart II-5Indonesia: Poor Profitability Among Non-Financial Companies
Indonesia: Poor Profitability Among Non-Financial Companies
Indonesia: Poor Profitability Among Non-Financial Companies
Chart II-4Non-Financial & Small Caps Stocks: Dismal Performance
Non-Financial & Small Caps Stocks: Dismal Performance
Non-Financial & Small Caps Stocks: Dismal Performance
Only shares prices of three banks - Bank Central Asia, Bank Rakyat and Bank Mandiri - have been in a genuine bull market. These three stocks now account for 40% of the overall Indonesia MSCI Index and their rally has prevented an outright decline in the bourse. Chart II-6Indonesian Banks: Higher Provisions, Lower Profits
Indonesian Banks: Higher Provisions, Lower Profits
Indonesian Banks: Higher Provisions, Lower Profits
We agree that these three banks are well provisioned and extremely well capitalized. Nevertheless, at a price-to-book value ratio of 4.7 for Bank Central Asia, 2.8 for Bank Rakyat and 1.8 Bank Mandiri, they are expensive. Given the ongoing economic slowdown and still high real borrowing costs, these three banks as well as all commercial banks in Indonesia will face higher NPLs and will be forced to provision for them. As NPL provisioning rise, banks’ profits will slow (Chart II-6). Such a scenario will likely lead to a 10-15% decline in these banks’ share prices in local currency terms. In U.S. dollars terms, the decline will be larger. Finally, as foreign investors in Indonesia begin digesting the magnitude of the country’s ongoing growth slump, their expectations for Indonesia’s return on capital will decline and they will likely reduce their exposure. This will trigger a selloff in the rupiah. Historically, foreign investors in Indonesia have cumulatively pumped $175 billion into debt securities and $105 billion into equity and investment funds. Indonesia’s lending rates remain elevated and well above nominal growth. Moreover, foreign ownership of local currency bonds and equities is high at 38% and 45%, respectively. Therefore, a decline in the rupiah will likely intensify the selloffs in the bond and equity markets. Bottom Line: For now, we continue recommending EM dedicated investors to remain underweight Indonesian equities, local currency bonds and U.S. dollar sovereign credit within their respective portfolios. We continue to recommend a short position in the IDR versus USD trade. Ayman Kawtharani, Editor/Strategist ayman@bcaresearch.com South Africa: On An Unsustainable Path The backdrop for South African financial assets remains poor, despite the recent surge in precious metals prices and Federal Reserve easing. The rand will continue to depreciate, even if precious metals prices continue to rise. Such a decoupling will not be historically unprecedented. Chart III-1 shows the long-term relationship between gold and the rand. The rand has failed to rally on several occasions during periods of rising gold prices. Chart III-1Rand Has Diverged Historically From Gold Prices
Rand Has Diverged Historically From Gold Prices
Rand Has Diverged Historically From Gold Prices
What’s more, contrary to popular narrative, the rand and the majority of EM currencies do not typically appreciate when U.S. interest rate expectations drop. We have elaborated on this topic in depth in previous reports. Ultimately, widening twin deficits, dwindling growth and declining return on capital will continue to depress the rand and risk assets. Supply constraints are preventing South Africa from capitalizing on rising gold prices – gold mining output is plummeting (Chart III-2). In fact, the trade deficit has been widening, despite surging gold prices (Chart III-3). Chart III-2Contracting Mining Output
Contracting Mining Output
Contracting Mining Output
Chart III-3Rising Gold Prices ≠ Improving Trade Balance
Rising Gold Prices Improving Trade Balance
Rising Gold Prices Improving Trade Balance
The overall and primary fiscal deficits are also widening, as government revenues are slumping (Chart III-4). On top of this, the government recently announced a $4.2 billion (ZAR 59 billion) bailout for state-owned utility company Eskom, further worsening the country’s debt sustainability position. The combination of plummeting nominal GDP growth and still-high borrowing costs (Chart III-5) have also worsened debt dynamics among private borrowers, hurting private consumption and investment. Chart III-4Fiscal Deficit Will Widen Further
Fiscal Deficit Will Widen Further
Fiscal Deficit Will Widen Further
Chart III-5Interest Rates Are Restrictive For Growth
Interest Rates Are Restrictive For Growth
Interest Rates Are Restrictive For Growth
Both business and household demand remain lackluster. South African non-financial companies’ return on assets (RoA) has been declining and has dropped below EM for the first time in the past 20 years (Chart III-6). Falling RoA has been due not only to cyclical growth headwinds but also structural issues such as lack of productivity growth. The falling RoA explains South African financial assets’ underperformance versus their EM counterparts. Finally, the rand is not very cheap (Chart III-7). Given poor fundamentals, including but not limited to a lack of productivity growth and a low and falling return on capital, the currency may need to get much cheaper. Chart III-6Non-Financials: Return On Assets
Non-Financials: Return On Assets
Non-Financials: Return On Assets
Chart III-7The Rand Needs To Get Cheaper!
The Rand Needs To Get Cheaper!
The Rand Needs To Get Cheaper!
Overall, South Africa’s current macro dynamics are unsustainable. On the one hand, widening twin deficits will augment the country’s reliance on foreign funding. FDI inflows have been rather meager and are likely to stay that way. Hence, South Africa remains extremely dependent on volatile foreign portfolio inflows. Historically, foreign investors have cumulatively pumped $100 billion into debt securities and $120 billion into equity and investment funds. In turn, foreign portfolio inflows are contingent on a firm currency and high interest rates. Widening twin deficits, dwindling growth and declining return on capital will continue to depress the rand and risk assets. On the other hand, the economy is choking and public debt dynamics are worsening at a torrid pace due to high interest rates. Much lower domestic interest rates and a cheaper currency are necessary to reflate the economy and stabilize the public debt-to-GDP ratio. Ultimately, financial markets will likely push for a resolution of these contradictions. In the medium to long run, international capital flows gravitate towards countries that offer a high or rising return on capital. Provided return on capital in South Africa is very low and falling, foreign portfolio inflows will at some point diminish or grind to a halt. This will likely coincide with a negative global trigger for overall EM. Reduced inflows or mild outflows of foreign portfolio capital will cause sizable rand depreciation. Bottom Line: The economy requires a cheaper rand and much lower interest rates to grow. The rand will likely act as a release valve: it will depreciate a lot, improving the trade balance, which in turn will ultimately allow interest rates to decline - although local bond yields will spike initially on rand weakness. Investment recommendations: Remain short the rand versus the U.S. dollar, and underweight stocks and sovereign credit in respective dedicated EM portfolios. Concerning bonds, a depreciating rand will initially cause a selloff in local currency government bonds, warranting an underweight position for now. In the sovereign credit space, we are maintaining the following trade: sell CDS on Mexico / buy CDS on South Africa and Brazil. Andrija Vesic, Research Analyst andrijav@bcaresearch.com Footnotes Equities Recommendations Currencies, Credit And Fixed-Income Recommendations
Dear Client, Owing to BCA’s 40th Annual Investment Conference at the Grand Hyatt in New York City next week, there will be no report on Wednesday, September 25. We will return to our regular publication schedule on Wednesday, October 2. I look forward to meeting China Investment Strategy clients in person at our conference. Please do not hesitate to say hello. Best regards, Jing Sima China Strategist Highlights China’s economy should bottom as a result of the pickup in credit that occurred earlier this year, but the circumstances surrounding the ongoing slowdown are unprecedented in nature. This raises the risk that policymakers will have to do more in order to stabilize growth. Optimism surrounding recent Chinese policy announcements is misguided. For now, Chinese policymakers are not upping the pace of stimulus, which underscores the risk to our forecast that growth will soon stabilize. A more meaningful shot of reflation will occur in the coming few months if the economy slows further, but policymakers will be reactive rather than proactive. Barring a successful (even if temporary) trade deal, we expect more weakness in the RMB as a passive source of reflation to aid the economy. But currency devaluation is a double-edged sword, and cannot be counted on to single-handedly stabilize China’s economy. Over a 6-12 month time horizon, investors should continue to overweight Chinese stocks versus the global benchmark in currency hedged terms, but the risk of further underperformance over the near-term is high. Feature Chinese economic growth continues to weaken. The Caixin manufacturing PMI for August, along with the New Export Orders component of the manufacturing PMI released by China’s National Bureau of Statistics, registered small gains in August from July. However, any hopes pinned on this being an emerging sign of turnaround in the Chinese economy soon faded. A slew of August data showed continued sluggishness in exports, an even worse domestic-demand picture, and further deflation in ex-factory producer prices. Most importantly, we continue to witness “half-measured” stimulus. In explaining past and existing economic weakness, many investors point to the trade war with the U.S. However, Charts 1 and 2 serve as an important reminder that domestic weakness predates U.S. protectionism. The trade war tensions and tariffs are magnifying this weakness, but China’s slowdown is, at its core, policy driven. Chart 1Weakness In Chinese Economy Predates The Trade War...
Weakness In Chinese Economy Predates The Trade War...
Weakness In Chinese Economy Predates The Trade War...
Chart 2…And Has Been A Byproduct Of Financial De-Risking Campaign
...And Has Been A Byproduct Of Financial De-risk Companion
...And Has Been A Byproduct Of Financial De-risk Companion
Given this, investors should be more focused on identifying signs of a major reversal in policy. So far Chinese policymakers have been firmly holding their line in keeping credit growth somewhat in check. Policy-Induced Economic Stabilization: A Tough Forecast To Make Our baseline view is that the current scale of stimulus should be sufficient to stop economic growth from decelerating further. Two factors support our baseline view: The direct impact from tariffs on the Chinese economy is limited. Growth in China’s exports to the U.S. in 2019 is likely to be somewhere close to a 9% contraction, down from the 10.8% increase registered in 2018. Based on a simple calculation with all else being equal, this is likely to shave 1.6 percentage points off China’s total export growth and 0.3 percentage points off nominal GDP growth in 2019. This is not trivial, but arguably not devastating to China’s aggregate economy either. There is anecdotal evidence suggesting some Chinese exports have been re-routed to peripheral countries such as Vietnam and Taiwan in order to avoid the U.S. import tariffs on Chinese goods (Chart 3). This suggests that real growth in Chinese exports to the U.S. could be stronger than the current data suggests. Chart 3Exports Finding Alternative Routes?
Exports Finding Alternative Routes?
Exports Finding Alternative Routes?
Chart 4Bottoming in the economy In Sight?
Bottoming in the economy In Sight?
Bottoming in the economy In Sight?
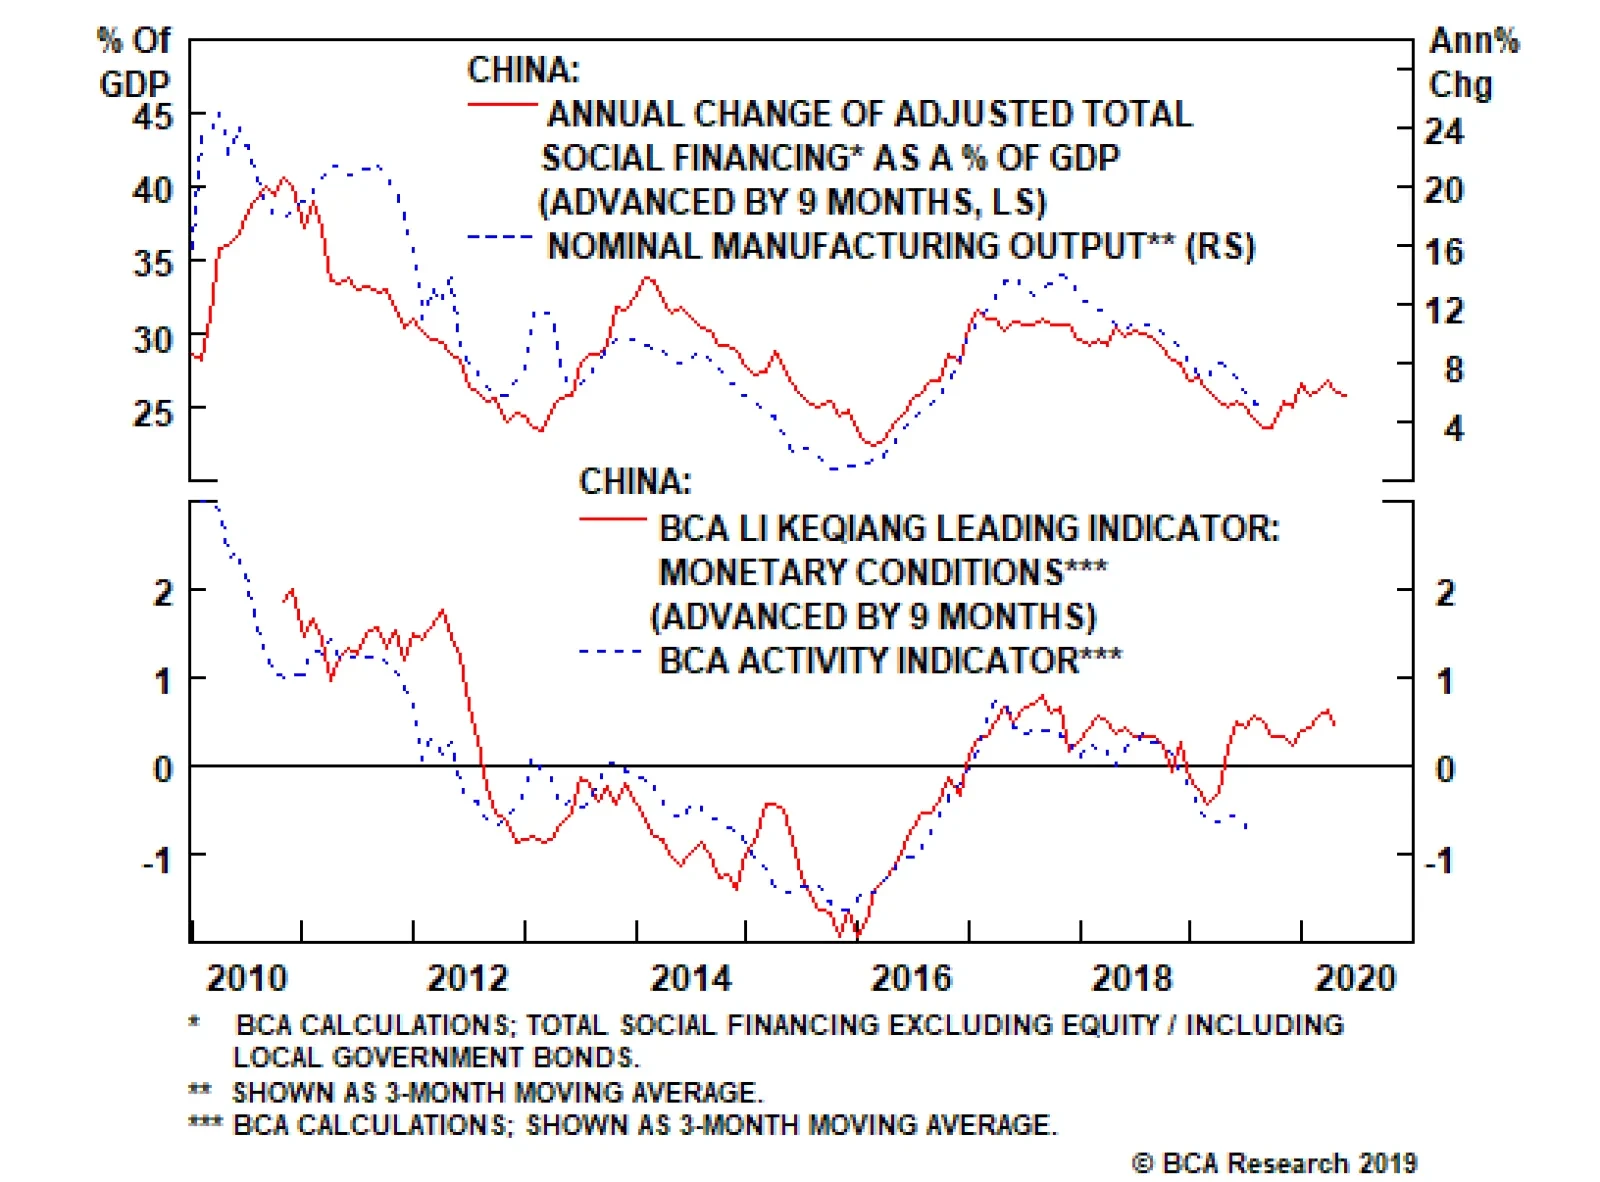
Credit growth has picked up since the beginning of this year. Based on the historical relationship between China’s credit impulse (measured by the 12-month change in BCA’s adjusted total social financing as a percentage of nominal GDP) and domestic demand, the economy should bottom out at some point before the end of the year (Chart 4). Although, import growth, a key measure of China’s domestic demand, remains in deep contraction, some of its components that usually lead industrial activities are showing signs of improvement (Chart 5). Chart 5Early Signs of Improved Domestic Demand
Early Signs of Improved Domestic Demand
Early Signs of Improved Domestic Demand
Chart 6Manufacturing Investment Growth In Contraction
Manufacturing Investment Growth In Contraction
Manufacturing Investment Growth In Contraction
However, our level of confidence that the existing stimulus will be sufficient to stabilize economic growth is lower than it otherwise would be. This is due to the fact that the challenges facing the Chinese economy are unprecedented in nature. For one, the indirect impact of the trade war on China’s economy through business sentiment and manufacturing investment has yet to be fully revealed in the data. As Chart 6 shows, manufacturing investment is already deteriorating, particularly in export-intensive sectors. The ultimate impact on investment from the trade war is still uncertain, and can pose significant downside risks to the Chinese economy in the coming year. More importantly, as Chart 7 suggests, a weak credit impulse will at best lead to a very subdued economic recovery even if growth does indeed bottom. In terms of the link between policy and the economy, Chart 8 points out a key difference between the current slowdown and previous down cycles: Monetary conditions have been ultra-loose for more than a year, but current economic conditions remain on a downward trend – much more so than in the previous cycles. This huge gap and lag in economic response to monetary stance can only be explained by an impaired policy transmission mechanism. An expansionary monetary stance has not proportionally translated into credit expansion or economic recovery. This challenges the effectiveness and timeliness of future monetary loosening in terms of its ability to revive the Chinese economy. Chart 7Current Pace Of Credit Growth Will Lead To A Fragile Recovery, At Best
Current Pace Of Credit Growth Will Lead To A Fragile Recovery, At Best
Current Pace Of Credit Growth Will Lead To A Fragile Recovery, At Best
Chart 8An Impaired Monetary Policy Transmission
An Impaired Monetary Policy Transmission
An Impaired Monetary Policy Transmission
The scale and timing of the current stimulus measures have been “behind the curve.” Therefore, the historical relationship between China’s credit impulse and the turning points in the economy may not apply to the current cycle. Bottom Line: China’s economy should bottom as a result of the pickup in credit that occurred earlier this year, but the circumstances surrounding the ongoing slowdown are unprecedented in nature. This raises the risk that policymakers will have to do more in order to stabilize growth. An Unusually Prudent Policy Bias For some, the recent slew of announcements on upcoming stimulus qualified as a major shift in policy bias. Our analysis suggests otherwise. The bank reserve requirement ratio (RRR) cuts announced late in August have been among the most cited policy announcements, with the PBoC stating that the new cuts will release RMB 900 billion of fresh liquidity.1 In our view, this measure is more about maintaining liquidity in China’s large commercial banks than adding to it (on a net basis). Chart 9RRR Cuts May Not Be That Stimulative
RRR Cuts May Not Be That Stimulative
RRR Cuts May Not Be That Stimulative
Chart 9 shows that, in previous episodes of meaningful RMB depreciation against the U.S. dollar, in order to prevent the RMB from falling at an undesirable pace, PBoC has had to intervene in the spot market by selling U.S. dollars. The selling of U.S. dollars in this round of RMB depreciation has been much more muted than in 2015-2016, but we suspect some intervention has taken place following each bout of escalation in the trade war. This has had a liquidity tightening effect on banks, as selling central bank foreign-exchange reserves reduces liquidity in the banking system. It is very likely that following the PBoC’s defense of the RMB in the last two months, the RRR cuts were a measure aimed at preventing a liquidity crunch ahead of the September tax season. If true, this hardly qualifies as net new stimulus for the economy. There were also two important announcements that came out of the September 5th State Council meeting: The entire 2019 quota for local government special project bonds must be issued by the end of September, and all money raised from the bonds must be disbursed to projects by the end of October. This too is not exactly “stimulative,” as over 90% of the 2019 local government special-project bond quota has already been issued. This leaves less than 10% of the quota outstanding, an 80% decline from what was issued last September. On a quarterly basis, special-bond issuance in the third quarter of 2019 will end up being 30% lower than the same period last year. It was also announced that, in order to meet the local needs for construction of key projects, part of 2020’s special bonds quota will be allocated in advance to ensure that the funds are available for use at the beginning of next year.2 While the announcement did not indicate how much in the way of special-purpose bonds local governments are allowed to frontload through the remainder of this year, we maintain our view that this is not a policy shift towards materially larger stimulus than we have seen so far this year: Without an additional quota, local government special-purpose bond issuance would essentially fall to zero in the fourth quarter as the 2019 target would be hit by the end of September. Thus, the frontloading of next year’s bond issuance will only “fill the gap” between now and year-end. As special-purpose bond issuance only accounts for 15% of total funding for local governments’ infrastructure spending, the new measure alone is unlikely to meaningfully accelerate investment growth.3 We have noted in previous reports that in order for local governments to accelerate spending within the current fiscal budget framework, one of three things must occur: more direct funding from the central government, an acceptance by policymakers of more shadow bank lending, or a larger quota for bond issuance. So far we have not seen any of the above-mentioned shifts in policy. Chart 10Local Governments Tightening Belt This Year
Local Governments Tightening Belt This Year
Local Governments Tightening Belt This Year
The only positive sign for local government spending has been a pickup in land sales in Q2, which makes up more than 70% of local government revenues. But, it is far from making up the shortfalls in local governments’ budgets (Chart 10). Local governments are facing considerable fiscal pressure as annual tax revenue growth has fallen to near zero. Critically, the government’s regulatory stance on local government budgets has continued to tighten: Local governments have been ordered by the Ministry of Finance to liquidate state-owned assets to fund their budget deficits this year.4 This austerity measure is also being met with explicit reiteration from the Ministry of Finance on the central government not bailing out local governments, and that local government officials are held responsible for their own borrowing and spending.5 Bottom Line: Optimism surrounding recent Chinese policy announcements is misguided. For now, Chinese policymakers are not upping the pace of stimulus, which underscores the risk to our forecast that growth will soon stabilize. A more meaningful shot of reflation will occur in early 2020 if the economy slows further in Q4, but policymakers will most likely continue their reactive approach rather than proactive. RMB Depreciation: A Plus Or Peril? The RMB’s renewed depreciation since August initially raised fears among global investors that an uncontrolled decline might occur, but these fears have subsided over the past several weeks. Even though the USD-CNY exchange rate has broken the psychological 7 threshold, it is not forming a linear downward trend. Unlike after the August 2015 devaluation, it appears that the PBoC can successfully enact countercyclical measures to guide the RMB’s value higher following each large depreciation (Chart 11). Chart 11PBoC Not Panicking Over RMB Depreciation
PBoC Not Panicking Over RMB Depreciation
PBoC Not Panicking Over RMB Depreciation
Fears of uncontrolled capital outflows following the depreciation are also abating. We presented a dashboard for monitoring short-term capital outflows from China in our March 20 Special Report,6 and an update of these indicators suggests that China’s heightened capital controls are holding – i.e., outflows have not escalated as they did in 2015 (Chart 12). Chart 12No Major Capital Outflow
No Major Capital Outflow
No Major Capital Outflow
Chart 13RMB Depreciation Partially Offsets Tariffs
RMB Depreciation Partially Offsets Tariffs
RMB Depreciation Partially Offsets Tariffs
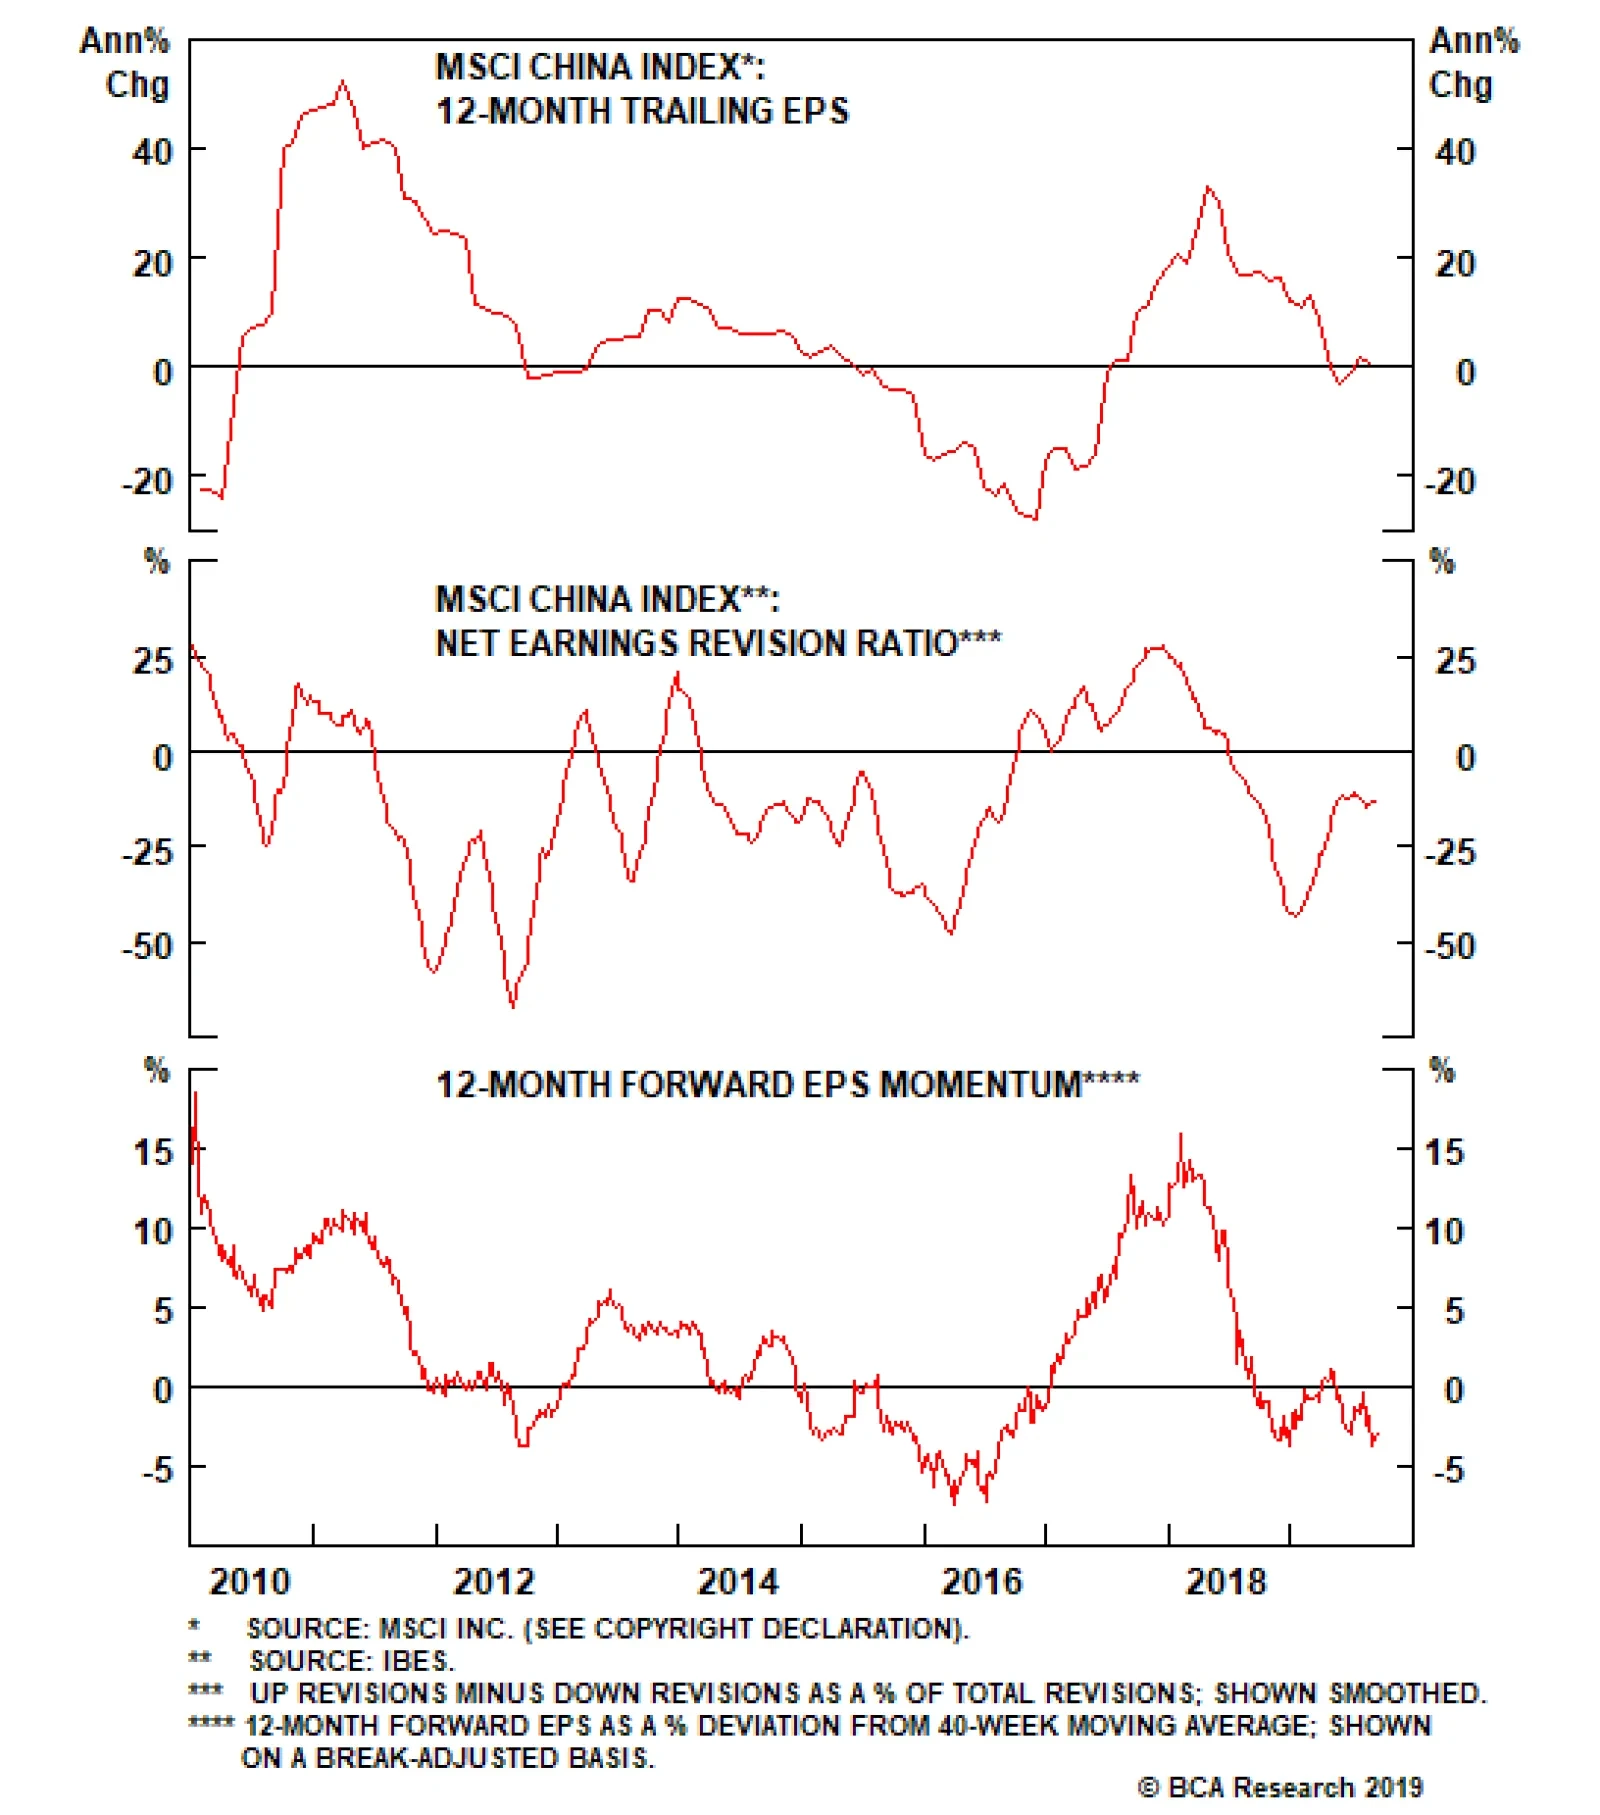
Thus, the conclusion is that Chinese policymakers appear to be in control of the currency. The reduced risk of an uncontrolled decline has allowed policymakers to (passively) provide meaningful stimulus to the domestic economy via depreciation. Indeed, the RMB has not only depreciated against the USD, but also against many Asian currencies including direct trade competitors such as Vietnam and Taiwan (Chart 13). This is helping offset the negative impact of U.S. tariffs on Chinese exporters. But currency devaluation can come with a price tag – in particular for corporations that have borrowed heavily in U.S. dollar-denominated debt. We estimate that $440 billion of U.S. dollar debt will be maturing over the coming two years, for Chinese companies and banks in the aggregate.7 A 12% depreciation in the RMB since April 2018 means that debt servicing costs will be 12% higher for unhedged debtors. This is particularly painful for real estate and financial services companies, two of the largest holders of U.S. dollar-denominated loans, and the weakest sectors in the current economic downturn. Most importantly, while currency devaluation ease the slowdown, it cannot be counted on to stabilize Chinese economic activity on its own. For example, while our earnings recession model suggests that the decline in the RMB since May has reduced the odds of a major decline in economic activity by roughly 20%, the model also shows that such an event is still highly probable (current odds are roughly at 70%). Bottom Line: Barring a successful (even if temporary) trade deal, we expect more weakness in the RMB as a passive source of reflation to aid the economy. But currency devaluation is a double-edged sword, and cannot be counted on to single-handedly stabilize China’s economy if a further slowdown occurs. An Update On Corporate Earnings Against a backdrop of what may turn out to be insufficient policy support, the earnings picture is providing one modest positive for equity investors. While the growth rate in investable earnings per share has slowed significantly over the past year (Chart 14), it has merely fallen to zero and not deeply into negative territory, as what seemingly occurred in 2015-2016. In our view, the risk of a similar collapse in earnings per share (EPS) has been an important factor weighing on Chinese investable equities’ relative performance since June 2018. In reality, a closer examination of MSCI China Index earnings reveals that a huge decline in EPS this year was never really a threat, because the apparent collapse in 2015-2016 did not actually transpire. Changes to the composition in the MSCI China Index that took effect in November 2015 and June 2016 had the effect of depressing index EPS, due to the sizeable inclusion of a set of richly valued stocks. Chart 15 presents BCA’s calculation of “break-adjusted” EPS for Chinese investable stocks, which shows that EPS growth bottomed out at -10% in late-2016, as opposed to the -28% implied by the unadjusted series. Chart 14Investable EPS Has Yet To Contract Meaningfully
Investable EPS Has Yet To Contract Meaningfully
Investable EPS Has Yet To Contract Meaningfully
Chart 15The Potential Downside For Earnings Is Less Than Many Fear
The Potential Downside For Earnings Is Less Than Many Fear
The Potential Downside For Earnings Is Less Than Many Fear
Chart 16A Cyclical Recovery In Earnings Has Not Yet Begun
A Cyclical Recovery In Earnings Has Not Yet Begun
A Cyclical Recovery In Earnings Has Not Yet Begun
The existence of less downside potential for earnings is certainly positive for investable stocks at the margin, but it does not alter the outlook for equity fundamentals over the coming year. We have shown in several previous reports that there is a strong and reliable link between investable EPS growth and China’s coincident economic activity,8 and the continued slowing in the latter does not suggest that a bottom in earnings is imminent. In addition, Chart 16 highlights that while net earnings revisions have recovered from their early-year lows, they remain in negative territory and have stopped rising over the past few weeks. Twelve-month forward EPS momentum, also presented on a break-adjusted basis, is modestly negative, and has recently weakened (panel 2). Bottom Line: The downside risk to earnings for Chinese investable equities is less than many investors fear. But absent stronger credit growth, it remains too early to confidently project a cyclical earnings recovery. Investment Conclusions The historical relationship between credit growth and economic activity suggests that the latter should soon stabilize, which is our base case view for the coming few months. Still, the risk of a further, meaningful deceleration in growth is elevated, given the unprecedented circumstances surrounding the ongoing slowdown. For equity investors, less potential downside risks to earnings than previously feared is a positive at the margin, but the fundamental outlook still hinges on a durable pickup in economic activity. Over a 6-12 month time horizon, this implies that one of two scenarios will unfold: The economy will stabilize in response to the easing that has already occurred (i.e. our base case view). The economy slows further in the near-term, prompting a more significant policy response that leads to an even sharper pickup in activity. Chart 17Investable Stocks: An Overshoot To The Downside?
Investable Stocks: An Overshoot To The Downside?
Investable Stocks: An Overshoot To The Downside?
In the first scenario, investable stocks have probably overshot to the downside versus the global benchmark and thus will very likely outperform from current levels. Near-term performance is likely to be flat-to-down, as investors await hard evidence of a sequential improvement in growth (Chart 17). In the second scenario, investable stocks are at potentially acute near-term risk, but will likely eventually outperform global stocks once activity begins to pick up sharply. In this scenario, the outperformance of Chinese equities will commence later, but would likely still occur by the tail end of our cyclical investment horizon (6-12 months). As a final point, we are not ruling out the possibility of a temporary trade deal between the U.S. and China, as both sides have the incentive to avoid a further escalation and are now showing goodwill towards constructive negotiations. This may change our tactical view on Chinese stocks, but our cyclical view remains focused on China’s domestic policy and economic fundamentals. Jing Sima China Strategist JingS@bcaresearch.com Footnotes 1 PBC Official: The RRR Cut Aims at Bolstering Real Economy, September 6, 2019 2 China to accelerate the issuance and use of special local government bonds to catalyze effective investment, China State Council, September 4, 2019 3 Please see Emerging Markets Strategy Special Report, “Chinese Infrastructure Investment: A Ramp-Up Ahead?”, dated August 1, 2019, available at ems.bcaresearch.com 4 China’s Local Governments Sell Assets to Make Up for Revenue Loss, Caixin, September 3, 2019 5 http://www.mof.gov.cn/zhengwuxinxi/caizhengxinwen/201909/t20190906_3382239.htm?mc_cid=eb2b199651&mc_eid=9da16a4859 6 Please see China Investment Strategy Special Report, “Monitoring Chinese Capital Outflows”, dated March 20, 2019, available at cis.bcaresearch.com 7 Please see Emerging Markets Strategy Special Report, “China’s Foreign Debt, And A Secret Weapon”, dated September 12, 2019, available at ems.bcaresearch.com 8 Please see China Investment Strategy Weekly Report, “Threading A Stimulus Needle (Part 2):Will Proactive Fiscal Policy Lose Steam?”, dated July 24, 2019, available at cis.bcaresearch.com Cyclical Investment Stance Equity Sector Recommendations
The authorities (state banks or the central bank) could hypothetically support the yuan by selling unlimited amounts of dollars in the forward market. Unlike the sale of U.S. dollars from the People’s Bank of China’s FX reserves, this would entail neither a…
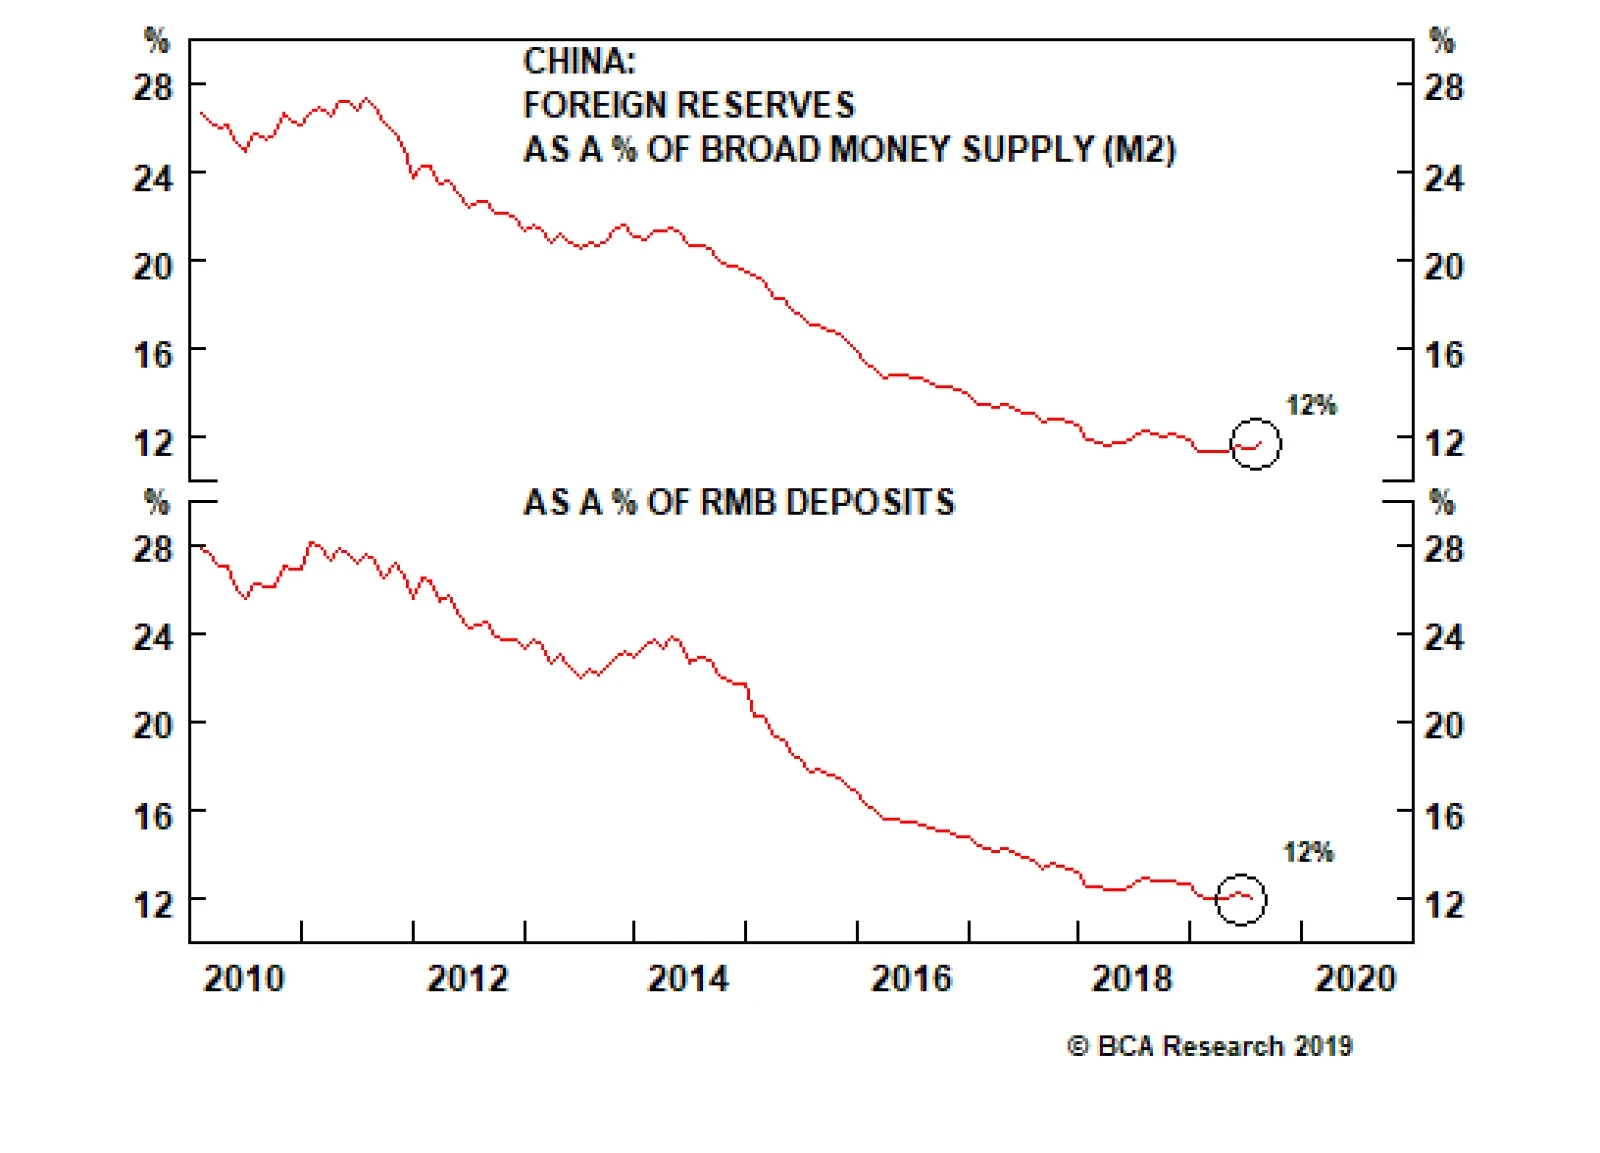
China’s central bank has about $3 trillion of foreign exchange (FX) reserves that can be used to intervene in the spot market. However, the authorities are highly reluctant to use these reserves. These FX reserves are equal to only 12% of broad money supply…
Highlights Trump is now clearly retreating from policies that harm the economy and reduce his reelection chances. Geopolitical risks are abating for the first time since May – a boon for financial markets amid global policy stimulus. The U.S. and China are containing tensions in the short term – though we remain skeptical about a final trade agreement. The U.S. election cycle is a rising source of political risk even as global risks fall – but Warren is not a reason to turn cyclically bearish. Book gains on our long spot gold trade. Feature President Trump is staging a tactical retreat from his “maximum pressure” foreign and trade policies. As a late-cycle president with an election looming, his decision to escalate conflicts with China and Iran in May revealed a voracious risk appetite. This “war president” mentality – the idea that Trump would reconnect with his political base ahead of 2020 at the risk of undermining his own economy – led us to recommend a defensive position over the course of the summer, even though we remained cyclically bullish. Now with Trump’s backpedaling this tactical narrative is starting to turn. The shift adds policy support to the recent up-tick in critical risk-on indicators (Chart 1). While U.S.-China fears have played a much greater role than Brexit in the political tailwind behind global government bond yields (Chart 2), the collapse of Boris Johnson’s no-deal gambit is also helping geopolitical risk to abate. Chart 1Risk-On Indicators Flash Green
Risk-On Indicators Flash Green
Risk-On Indicators Flash Green
Chart 2China Political Risk To Ease (Brexit Is Nice Too)
China Political Risk To Ease (Brexit Is Nice Too)
China Political Risk To Ease (Brexit Is Nice Too)
Unfortunately, it is too soon to sound the all-clear: The U.S. election cycle still warrants caution. As we highlighted in July, the rise of the progressive wing of the Democratic Party, particularly firebrand Senator Elizabeth Warren of Massachusetts, is causing jitters in the marketplace. Warren is on the cusp of displacing Vermont Senator Bernie Sanders as the second-place candidate behind former Vice President Joe Biden. Biden remains the frontrunner – which helps to support a constructive cyclical view – but the progressives have a tailwind and his status could change. Moreover, the entire primary process and U.S. election cycle will engender policy uncertainty and “black swan” risks. Trump’s pivot could come too late to save the bull market. There are still significant risks to our House View that equities will be higher in a year’s time. If a bear market and recession become a foregone conclusion, then Trump will have to return to a war footing. This means escalating the conflict with China or confronting Iran in a desperate bid to get voters to rally around the flag. This is a substantial political risk given that the odds of a recession are elevated and rising. Despite these risks, it is significant for the global macro view that President Trump is making a last ditch effort to save the business cycle while it can still be saved. This supports BCA’s House View that investors should maintain a cyclical risk-on orientation. How Do We Know Trump Is In Retreat? Here are the critical signs that Trump is downgrading his administration’s level of aggression after another summer of “fire and fury”: The U.S. and China are now officially easing tensions. Trump has delayed the October 1 tariff hike (from 25% to 30% on $250 billion worth of goods), while China has issued waivers for tariffs and promised to increase purchases of U.S. farm goods in advance of talks. Talks are resuming with the principal negotiators set to meet face-to-face after China’s National Day celebration on October 1. Critically, the two sides are reportedly picking up the nearly completed draft text of a trade agreement that was abandoned in May when divisions over compliance and tariffs resulted in a breakdown. Trump and Xi Jinping have an occasion to meet in Santiago, Chile in November, which is the best time for a signing if the talks progress well. Trump fired his hawkish National Security Adviser, John Bolton. Bolton was a supporter of the president’s “maximum pressure” foreign policy toward rivals, including China as well as Iran and North Korea. Oil prices dropped on the expectation that U.S. relations with Iran could improve, easing oil sanctions and increasing supply (Chart 3). But ultimately the signal is bullish for oil. The real significance is not Bolton himself but rather that Trump is changing tack to reduce geopolitical risks to economic growth. Whoever replaces Bolton is far less likely to be an uber-hawk (Bolton had cornered that market). A trade deal with Japan has been agreed in principle and may be signed in late September. U.S. relations with Europe are marginally improving. Trump even sent Secretary of State Mike Pompeo on a trip to discuss a diplomatic “reset” with the EU’s new crop of leaders set to take power in November and December. These improvements are tentative. Trump still explicitly rejects the idea that he should court Europe to apply unified pressure on China. But his administration has agreed to a beef export deal with the EU and, as long as China talks are ongoing, he is unlikely to slap tariffs on European cars. This decision will likely be postponed beyond November 14. All of the above confirms that Trump is focused on reelection. But how can we be sure this less-hawkish policy turn will last longer than five minutes? Rising unemployment is the most deadly leading indicator of a president’s approval rating. Economic data is alarming for a sitting president. Following a drop in business sentiment and investment, consumer sentiment is now suffering (Chart 4). Manufacturing – the sector Trump was ostensibly elected to defend – has slipped into outright contraction and loans and leases are shrinking in the electorally vital Midwestern states (Chart 5). Chart 3Bolton Bolting Is Bullish For Brent
Bolton Bolting Is Bullish For Brent
Bolton Bolting Is Bullish For Brent
Chart 4A Reason For Trump To De-Escalate
A Reason For Trump To De-Escalate
A Reason For Trump To De-Escalate
Fortunately for Trump, the job market is showing signs of resilience, with initial unemployment claims dropping hard (Chart 6). Chart 5Another Reason For Trump To De-Escalate
Another Reason For Trump To De-Escalate
Another Reason For Trump To De-Escalate
Chart 6Good News For Trump
Good News For Trump
Good News For Trump
Chart 7U.S. Consumer Should Prevent Recession
U.S. Consumer Should Prevent Recession
U.S. Consumer Should Prevent Recession
BCA does not expect a recession within the next 12 months. The American consumer remains buoyant and median family incomes are strong (Chart 7). Nevertheless, Trump cannot assume anything. The proliferation of the “R” word has a negative psychological effect on businesses and consumers that could create a negative feedback loop. It also raises the risk of an equity selloff that tightens financial conditions and exacerbates the slowdown (Chart 8). Trump’s Democratic opponents and much of the news media will amplify negative economic news. Chart 8Trump Needs To Change The Topic
Trump Needs To Change The Topic
Trump Needs To Change The Topic
While Trump cares about the stock market, his election ultimately rests on voters, not investors. Even if recession is avoided, a rising unemployment rate would be the most deadly leading indicator of a sitting president’s approval rating (Charts 9A & 9B). It is a far more telling variable than income growth or gasoline prices, for example. Chart 9APresidential Approval...
Presidential Approval...
Presidential Approval...
Chart 9B...Follows Unemployment
...Follows Unemployment
...Follows Unemployment
As Charts 9A & 9B demonstrate, unemployment and presidential approval are not always tightly correlated. Rather, for all recent presidents, the direction of unemployment ultimately prevailed over the approval rating by the time of the election – it pulled approval up or down in the final lap of the term in office. Moreover Trump, a bull-market president, is one of the cases where the approval rating is indeed tightly correlated with unemployment, as with Bill Clinton. And he is particularly vulnerable because his approval is historically weak and the unemployment rate can hardly fall much further from today. Granting that Trump is now going to adopt a more pro-market foreign and trade policy orientation, the next question is: what will that entail? Bottom Line: Trump’s tactical policy retreat is materializing which means that geopolitical risk stemming from U.S. foreign and trade policy is declining on the margin. While Trump is unpredictable, his sensitivity to the drop in his polling and weakening economy shows he wants to be reelected. Hence policy will have to moderate. Bolton Bolts – Geopolitical Risks Abate Trump’s ousting of his National Security Adviser Bolton is an important sign of the less-hawkish shift in administration policy. The ouster itself is not surprising in the least. Trump ran for office on a relatively isolationist foreign policy of non-intervention, withdrawal from long-running wars, and eschewing regime change and foreign quagmires to focus on America’s commercial interests. By contrast Bolton is perhaps the Republican Party’s most outspoken war hawk – a neo-conservative of the Bush era who advocated regime change in North Korea and Iran. This position was always at odds with Trump’s eagerness to negotiate and strike deals with the world’s dictators in the name of trade and riches rather than war and expenses.1 Chart 10Will Xi Sell Pyongyang For Washington?
Will Xi Sell Pyongyang For Washington?
Will Xi Sell Pyongyang For Washington?
The immediate implication is that the U.S. and Iran will reduce tensions. We will address this topic at length next week, but the gist is that Trump is much more likely to relax sanctions and hold a summit with Iranian President Hassan Rouhani now than before. This is in keeping with our view that the China trade war is a far greater geopolitical risk than the U.S.-Iran tensions post-withdrawal from the 2015 nuclear pact. However, Bolton’s firing is bullish for oil prices. Iran may still stage low-level provocations that threaten supply, but Saudi Arabia has also appointed a new energy minister in preparation for an OPEC 2.0 strategy that aims to bolster prices in the advance of the initial public offering of Aramco.2 At the same time, Trump’s softening foreign policy stance portends an improvement to the global economy. Nowhere is this clearer than with North Korea and China. Kim Jong Un has explicitly demanded Bolton’s replacement to get talks back on track – Trump has now met this demand. North Korea has also been an integral component of the U.S.-China negotiations throughout Trump’s administration. If Trump’s diplomacy succeeds with North Korea, markets will rightly conclude that U.S.-China tensions are falling. China has an interest in denuclearizing the peninsula, which ultimately entails getting rid of U.S. troops, so it has shown it can comply with U.S. sanctions (Chart 10). A third Trump-Kim summit that results in a nuclear deal of any kind would be a concrete policy win for Trump and a strategic win for China. The North Korean threat itself is not market-relevant – war risk peaked in 2017 (Chart 11). But an official agreement would provide an “off-ramp” for U.S.-China trade tensions. It would boost trade talks enough to improve global sentiment, and it could even increase the chances that the two countries conclude a deal involving tariff rollback. A Trump-Kim agreement would provide an “off-ramp” for U.S.-China trade tensions. Bolton’s ouster could also smooth U.S.-China tensions over Taiwan – he was an outspoken hawk on this front as well. His presence encouraged fears in Beijing that the Trump administration was planning a significant upgrade in Taiwan relations. These apprehensions were already high from the moment Trump accepted President Tsai Ing-wen’s congratulations on his election in 2016. It remains to be seen whether Trump will delay an $8 billion arms sale that will be the biggest since 1992 (Chart 12) – China has threatened to sanction U.S. defense firms if it goes ahead. But postponement is more likely now than before. This would help along the trade talks. Chart 11North Korea: 'Off-Ramp' For US-China Tensions
North Korea: 'Off-Ramp' For US-China Tensions
North Korea: 'Off-Ramp' For US-China Tensions
Chart 12Will Trump Sell Taipei For Beijing?
Trump's Tactical Retreat
Trump's Tactical Retreat
The direction of Taiwan in the near term partly depends on the direction of Hong Kong. Bolton likely advised a hard line in defense of the mass pro-democracy protests, which Trump was inclined to neglect for the sake of the trade talks with Beijing. Unless a mainland intervention and bloody security crackdown occurs – which is still a risk, and would make it politically impossible to conclude a trade deal with China – Trump will probably continue to sideline this Special Administrative Region. The jury is still out on whether protests will escalate after China’s National Day celebration, but Bolton’s absence and Hong Kong’s concessions to the protesters (which are backed by Beijing) are both positive signs. All of these factors suggest that the odds of a U.S.-China trade deal by November 2020 should rise. But is that really the case? For now we are maintaining our view that the odds are 40% by November 2020, though the risks are to the upside. Chart 13Trump Can Partially Offset China Tariffs
Trump Can Partially Offset China Tariffs
Trump Can Partially Offset China Tariffs
While Trump and Xi can certainly make an executive decision to agree to a deal – any deal – we maintain our high-conviction view that it will lack durability due to uncertainties regarding compliance on China’s side and faithfulness on Trump’s side. And a shallow deal may be politically untenable if markets and the economy rebound. Crucially, neither China’s economic data nor U.S. financial conditions are forcing either side to capitulate entirely. Trump’s policy retreat entails the removal of trade risks from Canada, Mexico, and Japan first and foremost, and likely the European Union. This will offer some consolation to markets even though the small increase in U.S. exports in the near-term will not offset the sharp drop in exports to China (Chart 13). Combined with a de-escalation and containment of tensions with China, and worldwide monetary and fiscal stimulus, markets will face a substantial policy improvement. This will actually reduce the incentive for a final trade deal. If financial and economic pressure intensify and the U.S. heads toward a technical correction or bear market, Trump will need to capitulate. This will require significant tariff rollback. At that point, Xi Jinping will have the opportunity to agree to a short-term deal based on China’s current concessions and nothing more (Table 1). This would demonstrate to the whole world that it does not pay to coerce China: China operates on mutual respect and win-win agreements. This would be acceptable to Xi Jinping since it would at least buy some time until the inevitable second round of the strategic conflict in 2021. But we are not at full capitulation yet. Table 1China’s Offers Thus Far In The Trade War
Trump's Tactical Retreat
Trump's Tactical Retreat
Bottom Line: Trump’s policy retreat includes the ouster of Bolton, which deescalates geopolitical risk on several fronts. Nevertheless, none of these risks – Iran, China, North Korea, Hong Kong, Taiwan – is fundamentally resolved. A U.S.-China trade agreement is not even necessary if the two political leaders are sufficiently supported by positive global macro developments. We continue to believe North Korea will lead to Trump diplomatic successes. De-escalation could lead to a breakthrough in trade talks pointing toward a deal, but it could also simply create an “off ramp” for the U.S. and China to contain tensions without having to capitulate on the trade front. Warren Still Warrants Caution While geopolitical risk has some room to abate, domestic political risk in the U.S. will pick up the slack. The entire American election cycle will trouble the markets over the coming 12 months – particularly due to the high chances of significant social unrest. Yet the greatest risks are frontloaded in the form of the Democratic Primary contest. This is because Warren will continue to do well in the early primary debates and therefore could soon morph into the biggest market risk of the entire election cycle. To be clear, her position as the frontrunner in the online betting markets is not validated by the national or state-level opinion polling. Biden remains dominant (Chart 14). If he stays firm above a 30% support rate, with double-digit leads over his nearest competitors in a range of important states, his chances of winning will rise over time and market uncertainty will fall. Chart 14Biden Still The Frontrunner In Democratic Primary
Trump's Tactical Retreat
Trump's Tactical Retreat
While Biden’s election would be market-negative on the margin due to the outlook for tax hikes and re-regulation, Trump’s reelection is not as market-positive as some may believe since he will be unbridled in his second term and more capable of pursuing his aggressive protectionism. Ultimately, the choice between Trump and Biden is a choice between two candidates whose policies and flaws are well known and relatively digestible by markets. If Warren or Sanders come close to the Oval Office, the equity market will go through a re-rating. On the contrary, if Warren surpasses Sanders and takes the lead, uncertainty will skyrocket regardless of Trump’s advantages in the general election. This is not unlikely, as the leftward lurch within the party continues to propel the progressive candidates upward in the contest (Chart 15). If Warren or Sanders are seen as coming within one step from the Oval Office, the equity market will have to go through a re-rating. These progressive populists are proposing an onslaught of laws and regulations against banks, health insurers, oil and gas drillers, and the tech oligopoly. The agenda is inherently negative for corporate earnings in these sectors, as Peter Berezin of BCA’s Global Investment Strategy shows in a recent report.3 Chart 15Progressive Consolidation Would Increase Market Angst
Trump's Tactical Retreat
Trump's Tactical Retreat
Chart 16Stocks Will Start To Trade On Polls
Stocks Will Start To Trade On Polls
Stocks Will Start To Trade On Polls
Health stocks are clearly reacting to Warren’s surge in the online betting markets (Chart 16), so any convergence of the polling of real voters to these probabilities will cause a reckoning in this sector as well as in other sectors she has targeted, like financials, technology, and energy. The saving grace for now – a reason we remain cyclically bullish – is that Biden has not yet broken down in the polling. He is the least market-negative of the top three candidates, yet the most electable from the point of view of the swing state polling and electoral-college calculus. Warren is the most market-negative yet least electable of the top three. She must decisively surpass Sanders in order to create lasting volatility. Yet this will be hard to do because his electoral-college path to the presidency is clearer than Warren’s, judging by head-to-head polls with Trump, and he has the machinery and motivation to slog through the primary race for a long time – which undercuts both him and Warren versus Biden. Warren and Sanders are also less likely to lead the Democrats to victory in the senate even if they take the White House due to their lack of appeal in key senate races like Arizona and Georgia. Without a majority in the senate, their radical policy agenda will have to be left at the door. Investment Implications We are booking gains on our long spot gold trade at 16% since initiation. The thesis remains sound and we will reinitiate when appropriate. Matt Gertken, Vice President Geopolitical Strategist mattg@bcaresearch.com Footnotes 1 Bolton’s tenure with Trump began with an incredible faux pas in which he advocated “the Libyan model” for the administration’s North Korean policy – prompting Trump to overrule him and reject that model. No comment could have been more inappropriate for a president trying to build trust with Kim Jong Un to sign a denuclearization deal. Libyan dictator Muammar Gaddafi was killed by enemy militias in Libya after NATO warplanes bombed his convoy – NATO’s intervention occurred despite Gaddafi’s having abandoned his nuclear weapon program in the wake of the September 1, 2001 attacks to avoid conflict with the U.S. and its allies. 2 See BCA Commodity & Energy Strategy Weekly Report, “Ignore The KSA-Russia Production Pact, Focus Instead On Their Need For Cash,” September 8, 016, ces.bcaresearch.com. 3 See BCA Global Investment Strategy Weekly Report, “Elizabeth Warren And The Markets,” September 1, 2019, gis.bcaresearch.com.
Highlights On a national level, China’s foreign currency debt does not seem excessive. Nevertheless, foreign currency debt is concentrated in the weakest sectors: property developers, banks and non-bank financial companies. The authorities can resort to FX swaps to smooth China’s currency depreciation. This will assure there is no currency turmoil. Yet, these FX swaps transactions will only defer downward pressure on the local currency, but will not eliminate it. Feature Chart I-1China's Aggregate FX Debt
China's Aggregate FX Debt
China's Aggregate FX Debt
China’s foreign debt has increased dramatically over the past 10 years, from $390 billion to $1.83 trillion currently (Chart I-1). With the RMB’s recent depreciation, the pressure on Chinese debtors to service foreign currency debt is rising. In this week's report, we gauge the size of the nation’s foreign currency debt, assess its vulnerability and discuss how policymakers will manage potential downside risks to the exchange rate. Quantifying The Size Of External Debt The State Administration of Foreign Exchange (SAFE) currently reports foreign currency denominated liabilities amounting to $1.97 trillion. This includes debts of general (central and local) government, the central bank, commercial banks and other enterprises. However, SAFE does not record foreign currency debt of offshore subsidiaries of Chinese companies. For example, if a subsidiary of a Chinese company in Hong Kong issued bonds denominated in foreign currency, this amount will not be captured in SAFE’s data. To get a more complete picture of China’s total foreign currency debt, we included the foreign debt of offshore subsidiaries to the SAFE figure. Also, we exclude banks' foreign currency deposits from foreign debt. Table I-1 is a comprehensive profile of China’s foreign currency debt. Table I-1Who Owes FX Debt In China
China’s Foreign Debt, And A Secret Weapon
China’s Foreign Debt, And A Secret Weapon
The key takeaways are as follows: China’s aggregate foreign currency debt is $1.83 trillion, or 13% of GDP. Public sector foreign currency debt stands at $263 billion, or 0.2% of GDP. Such a low number suggests one should not worry about the government’s foreign currency indebtedness. Companies’ and banks’ foreign indebtedness as of the end of March 2019 amounted to $436 billion and $1.3 trillion, respectively, totaling $1.7 trillion (or 12.5% of GDP) (Chart I-2A and I-2B). Chart I-2AFX Debt Of Companies And Banks
FX Debt Of Companies And Banks
FX Debt Of Companies And Banks
Chart I-2BFX Debt Of Companies And Banks
FX Debt Of Companies And Banks
FX Debt Of Companies And Banks
For banks, we deducted foreign currency deposits from the SAFE numbers – in other words, banks’ foreign currency debt excludes their foreign currency deposits. For instance, a mainland bank operating in Hong Kong has a large number of Hong Kong dollar deposits, yet the latter does not really constitute a foreign currency debt, as it is an inherent part of banking operations and is counterbalanced by Hong Kong dollar assets. A foreign borrowing binge by banks and companies began in 2009, paused in 2015 and took off again in 2016. Overseas financing regulation was loosened in September 2015. The idea was to facilitate foreign currency borrowing so that the proceeds would offset the rampant capital outflows during that period and stabilize the exchange rate. This relaxation of regulation contributed to the overseas borrowing binge, especially short-term debt, which does not require approval from SAFE. The fact that U.S. dollar rates have been below mainland RMB interest rates have enticed foreign currency borrowing by mainland entities over this decade. In addition, the authorities’ deleveraging campaign since late 2016 constrained domestic credit creation relative to the boom of the previous years and drove enterprises to seek capital overseas. For companies, foreign debt constitutes 5% of their aggregate debt (Chart I-3). As to banks, foreign debt is equal to 3% of non-deposit liabilities (Chart I-4). Chart I-3Companies Reliance On FX Debt Has Risen But Remains Low
Companies Reliance On FX Debt Has Risen But Remains Low
Companies Reliance On FX Debt Has Risen But Remains Low
Chart I-4Banks Reliance On FX Debt Is Low
Banks Reliance On FX Debt Is Low
Banks Reliance On FX Debt Is Low
The currency of China’s aggregate foreign debt is mostly USD (85% of total) and HK$ (10% of total). Provided the latter is pegged to the greenback – something we do not expect to change anytime soon – the overwhelming portion of foreign currency debt is de facto in U.S. dollars. Companies’ and banks’ foreign indebtedness as of the end of March 2019 amounted to $436 billion and $1.3 trillion, respectively, totaling $1.7 trillion (or 12.5% of GDP). Bottom Line: While small as a share of total debt, the absolute size of foreign currency debt held by Chinese companies and banks is not trivial. Meaningful currency depreciation poses risks for industries where foreign currency debt is concentrated. Vulnerability Assessment We examine China’s vulnerability stemming from foreign currency debt on the national level as well as on the level of both banks and enterprises. National Level On the national level, China’s foreign currency debt does not seem problematic. Total foreign currency debt accounts for 70% of exports and 58% of foreign currency reserves at the central bank (Chart I-5). These ratios are lower than those of many other EM countries. Foreign debt service obligations (FDSOs) are the sum of interest payments and amortization of all types of external debt over the next 12 months. China’s current FDSOs stand at 11% relative to its exports of goods and services, and at 24% relative to the central bank’s foreign exchange reserves (Chart I-6). These numbers are also somewhat lower than in other emerging countries. Chart I-5Macro Metrics For Foreign Debt
Macro Metrics For Foreign Debt
Macro Metrics For Foreign Debt
Chart I-6Foreign Debt Service Obligations
Foreign Debt Service Obligations
Foreign Debt Service Obligations
Chart I-7Foreign Funding Requirements
Foreign Funding Requirements
Foreign Funding Requirements
Exports are a country’s foreign currency earnings (cash flow) that can be used to service foreign exchange-denominated debt. Central banks’ foreign exchange reserves are a stock of liquid foreign currency assets that can be used by the central bank to plug the gap in the balance of payments, if needed. Foreign funding requirements (FFRs) are calculated as the current account deficit plus FDSOs in the next 12 months. FFRs measure the amount of net foreign capital inflows required in the next 12 months for a country to cover any potential shortfall in its current account balance, as well as to service and repay its foreign currency debt coming due (both principal and interest). Chart I-7 illustrates the Chinese mainland’s FFRs over the next 12 months exceed the current account surplus by $600 billion. The fact that U.S. dollar rates have been below mainland RMB interest rates have enticed foreign currency borrowing by mainland entities over this decade. The yuan has depreciated by 12% since April 2018. This has raised foreign debt burdens relative to GDP as well as made debt servicing more expensive. Please refer to Box I-1 that elaborates why currency depreciation is more damaging than a rise in interest rates for debtors with foreign currency borrowing. Box I-1
China’s Foreign Debt, And A Secret Weapon
China’s Foreign Debt, And A Secret Weapon
Companies And Banks Table I-3 illustrates the industry composition of non-government external debt. This also includes foreign debt of offshore subsidiaries. Table I-3
China’s Foreign Debt, And A Secret Weapon
China’s Foreign Debt, And A Secret Weapon
Non-policy banks have the highest amount of outstanding private external debt, at $367 billion, followed by real estate companies at $240 billion and financial service companies at $172 billion. Overall, foreign currency debt is concentrated in the weakest links of the Chinese economy: First, revenues and cash flows of property developers, banks and non-bank finance companies are predominantly in yuan. Hence, RMB currency depreciation reduces their cash flow in U.S. dollar terms, hurting their ability to service foreign debt. The yuan has depreciated by 12% since April 2018. This has raised foreign debt burdens relative to GDP as well as made debt servicing more expensive. Second, debt stress recedes in economic upswings and rises in economic downturns. The reason is that companies’ cash flows shrink in downturns and grow in economic expansions. Property developers, banks and non-bank finance companies are not only the largest foreign currency debtors in China, but also have the weakest profit/cash flow outlooks. Chart I-8Chinese Real Estate: Starts Outpacing Completions
Chinese Real Estate: Starts Outpacing Completions
Chinese Real Estate: Starts Outpacing Completions
Property developers’ cash flow positions will deteriorate further as the lack of policy stimulus for real estate in this cycle will constrain housing demand. Chart I-8 illustrates property developers have had many starts, but few completions and generally weak sales. This is due to the fact that they use starts to raise cash through pre-sales (down payments). Once they have raised the cash, they slow the pace of construction, as demand as well as their own cash positions are weak. As to banks and non-bank financial companies, their total assets skyrocketed until the 2016 deleveraging campaign kicked in. Since then, their asset growth has been relatively tame. This along with rising non-performing loans is hurting their profits, and consequently their debt-servicing ability. Third, for non-policy banks, short-term debt is very high at $234 billion. The same measure for property developers and non-bank finance companies is $31 billion and $33 billion, respectively. Finally, companies and banks in aggregate will be confronted with $438 billion of U.S. dollar debt maturing over the coming two years. In particular, real estate companies and financial services companies are faced with repayment pressures of $99 billion and $79 billion, respectively. Risks From Currency Hedging Prior the RMB breaking below the important 7 CNY/USD technical level, it was safe to assume that there was no pressure to hedge currency risks by debtors with FX debt. Odds are that following the breaching of this technical level and in anticipation of further devaluation, many of these debtors have begun hedging their foreign currency exposure. In turn, demand to hedge currency risk for $1.3 trillion foreign currency debt by companies and non-policy banks could exert further downward pressure on the exchange rate. Do the authorities have the tools to avoid self-feeding currency depreciation? A Secret Defense Weapon: FX Swaps Chart I-9Few FX Reserves Compared With RMB Money Supply
Few FX Reserves Compared With RMB Money Supply
Few FX Reserves Compared With RMB Money Supply
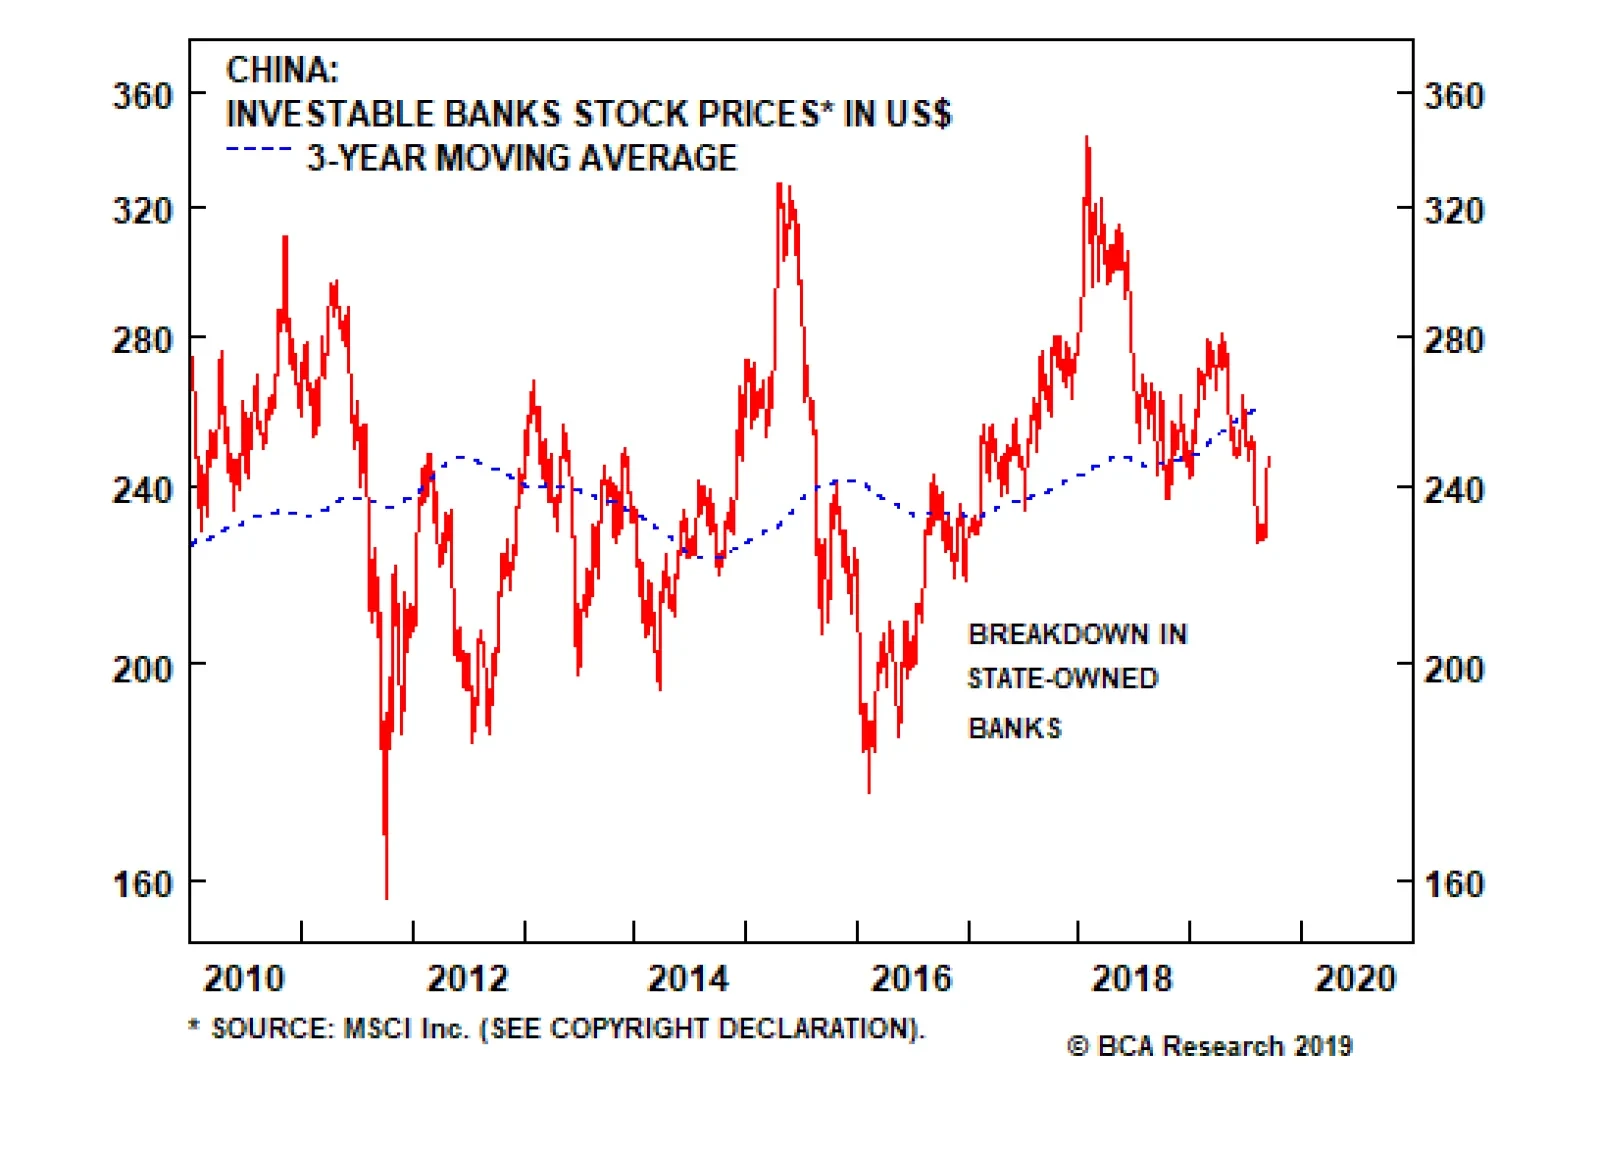
China’s central bank has about $3 trillion of foreign exchange (FX) reserves that can be used to intervene in the spot market. However, the authorities are very reluctant to use these reserves. One of the primary reasons is that these FX reserves are equal to only 12% of broad money supply and RMB deposits (Chart I-9). These are very low numbers in comparison with other countries. In addition, when a central bank sells its international reserves and buys local currency, the banking system’s liquidity/excess reserves at the central bank shrink, leading to higher interbank rates. Hence, defending the currency with FX reserves comes at the expense of tighter liquidity. This is unacceptable for Chinese policymakers because the economy remains very weak and extremely reliant on credit to grow. The good news is that the authorities have another tool – FX swaps – and are likely already using it to defend the yuan. Other EM countries have used FX swaps to defend their currencies as well, most notably Brazil in 2014-‘15. Media reports on several occasions have speculated that Chinese state banks sold U.S. dollars in the forward foreign exchange market in a bid to defend the forward rate and thus influence the spot market. We suspect this may be true, even though there is no available information on the amount and counterparties of FX swaps. What are the mechanisms and implications of FX swap interventions? In a FX swap transaction, a bank (the central bank or a state-owned bank) sells U.S. dollars to a company in the forward market. There is no flow of dollars or yuan in the spot market. If by the maturity date of the FX swap, the RMB depreciates more than what was implied by forwards on the date of the transaction, the bank suffers a loss. Otherwise, the bank makes a profit. The bad news is that a lot of FX debt is concentrated in the most vulnerable segments of the Chinese economy. In a nutshell, the authorities (state banks or the central bank) could hypothetically support the yuan by selling unlimited amounts of dollars in the forward market. Unlike the sale of U.S. dollars from the People’s Bank of China’s FX reserves, this would entail neither a depletion of foreign currency reserves nor a withdrawal of yuan liquidity. Chart I-10Large Bank Stocks Have Broken Down
Large Bank Stocks Have Broken Down
Large Bank Stocks Have Broken Down
These interventions are positive as they smooth the exchange rate trend and rule out a sharp tumble in the currency value. However, this strategy still has several shortcomings: (1) These FX swap operations can lead to large losses at state-owned banks. Barring the Ministry of Finance or the PBoC writing a check to these state banks to cover these losses, the latter will dampen banks’ earnings. Consequently, their share prices will slump (Chart I-10). (2) These FX swaps transactions only delay demand for dollars in the spot market and thereby defer downward pressure on the local currency, but they do not eliminate it forever. Conclusions The bad news is that a lot of FX debt is concentrated in the most vulnerable segments of the Chinese economy: property developers, banks and finance companies. They have little FX revenues so they are exposed to RMB depreciation. Given the exchange rate has broken below the psychological level of 7 CNY/USD (Chart I-11), odds are they will try to hedge their currency risk by buying U.S. dollars in the forward market. This will heighten depreciation pressure on the yuan. Chart I-11RMB And Its Volatility
RMB And Its Volatility
RMB And Its Volatility
The good news is that the authorities have a tool to smooth the currency depreciation via FX swaps. This will assure there is no currency turmoil in China, even if demand for dollars escalates. The costs of defending will be losses at large state-owned banks. Yet, those losses can ultimately be borne by the central government, which has little debt (20% of GDP). Downward pressure on the RMB will persist because of: Large demand for dollars from companies and banks with large FX debt levels as they attempt to hedge their FX risks; Weak economic activity, U.S. import tariffs and deflationary pressures - warranting currency depreciation; Potentially large demand for dollars from resident capital outflows. Lin Xiang, Research Analyst linx@bcaresearch.com Arthur Budaghyan Chief Emerging Markets Strategist arthurb@bcaresearch.com Footnotes
Highlights On a national level, China’s foreign currency debt does not seem excessive. Nevertheless, foreign currency debt is concentrated in the weakest sectors: property developers, banks and non-bank financial companies. The authorities can resort to FX swaps to smooth China’s currency depreciation. This will assure there is no currency turmoil. Yet, these FX swaps transactions will only defer downward pressure on the local currency, but will not eliminate it. Feature Chart I-1China's Aggregate FX Debt
China's Aggregate FX Debt
China's Aggregate FX Debt
China’s foreign debt has increased dramatically over the past 10 years, from $390 billion to $1.83 trillion currently (Chart I-1). With the RMB’s recent depreciation, the pressure on Chinese debtors to service foreign currency debt is rising. In this week's report, we gauge the size of the nation’s foreign currency debt, assess its vulnerability and discuss how policymakers will manage potential downside risks to the exchange rate. Quantifying The Size Of External Debt The State Administration of Foreign Exchange (SAFE) currently reports foreign currency denominated liabilities amounting to $1.97 trillion. This includes debts of general (central and local) government, the central bank, commercial banks and other enterprises. However, SAFE does not record foreign currency debt of offshore subsidiaries of Chinese companies. For example, if a subsidiary of a Chinese company in Hong Kong issued bonds denominated in foreign currency, this amount will not be captured in SAFE’s data. To get a more complete picture of China’s total foreign currency debt, we included the foreign debt of offshore subsidiaries to the SAFE figure. Also, we exclude banks' foreign currency deposits from foreign debt. Table I-1 is a comprehensive profile of China’s foreign currency debt. Table I-1Who Owes FX Debt In China
China’s Foreign Debt, And A Secret Weapon
China’s Foreign Debt, And A Secret Weapon
The key takeaways are as follows: China’s aggregate foreign currency debt is $1.83 trillion, or 13% of GDP. Public sector foreign currency debt stands at $263 billion, or 0.2% of GDP. Such a low number suggests one should not worry about the government’s foreign currency indebtedness. Companies’ and banks’ foreign indebtedness as of the end of March 2019 amounted to $436 billion and $1.3 trillion, respectively, totaling $1.7 trillion (or 12.5% of GDP) (Chart I-2A and I-2B). Chart I-2AFX Debt Of Companies And Banks
FX Debt Of Companies And Banks
FX Debt Of Companies And Banks
Chart I-2BFX Debt Of Companies And Banks
FX Debt Of Companies And Banks
FX Debt Of Companies And Banks
For banks, we deducted foreign currency deposits from the SAFE numbers – in other words, banks’ foreign currency debt excludes their foreign currency deposits. For instance, a mainland bank operating in Hong Kong has a large number of Hong Kong dollar deposits, yet the latter does not really constitute a foreign currency debt, as it is an inherent part of banking operations and is counterbalanced by Hong Kong dollar assets. A foreign borrowing binge by banks and companies began in 2009, paused in 2015 and took off again in 2016. Overseas financing regulation was loosened in September 2015. The idea was to facilitate foreign currency borrowing so that the proceeds would offset the rampant capital outflows during that period and stabilize the exchange rate. This relaxation of regulation contributed to the overseas borrowing binge, especially short-term debt, which does not require approval from SAFE. The fact that U.S. dollar rates have been below mainland RMB interest rates have enticed foreign currency borrowing by mainland entities over this decade. In addition, the authorities’ deleveraging campaign since late 2016 constrained domestic credit creation relative to the boom of the previous years and drove enterprises to seek capital overseas. For companies, foreign debt constitutes 5% of their aggregate debt (Chart I-3). As to banks, foreign debt is equal to 3% of non-deposit liabilities (Chart I-4). Chart I-3Companies Reliance On FX Debt Has Risen But Remains Low
Companies Reliance On FX Debt Has Risen But Remains Low
Companies Reliance On FX Debt Has Risen But Remains Low
Chart I-4Banks Reliance On FX Debt Is Low
Banks Reliance On FX Debt Is Low
Banks Reliance On FX Debt Is Low
The currency of China’s aggregate foreign debt is mostly USD (85% of total) and HK$ (10% of total). Provided the latter is pegged to the greenback – something we do not expect to change anytime soon – the overwhelming portion of foreign currency debt is de facto in U.S. dollars. Companies’ and banks’ foreign indebtedness as of the end of March 2019 amounted to $436 billion and $1.3 trillion, respectively, totaling $1.7 trillion (or 12.5% of GDP). Bottom Line: While small as a share of total debt, the absolute size of foreign currency debt held by Chinese companies and banks is not trivial. Meaningful currency depreciation poses risks for industries where foreign currency debt is concentrated. Vulnerability Assessment We examine China’s vulnerability stemming from foreign currency debt on the national level as well as on the level of both banks and enterprises. National Level On the national level, China’s foreign currency debt does not seem problematic. Total foreign currency debt accounts for 70% of exports and 58% of foreign currency reserves at the central bank (Chart I-5). These ratios are lower than those of many other EM countries. Foreign debt service obligations (FDSOs) are the sum of interest payments and amortization of all types of external debt over the next 12 months. China’s current FDSOs stand at 11% relative to its exports of goods and services, and at 24% relative to the central bank’s foreign exchange reserves (Chart I-6). These numbers are also somewhat lower than in other emerging countries. Chart I-5Macro Metrics For Foreign Debt
Macro Metrics For Foreign Debt
Macro Metrics For Foreign Debt
Chart I-6Foreign Debt Service Obligations
Foreign Debt Service Obligations
Foreign Debt Service Obligations
Chart I-7Foreign Funding Requirements
Foreign Funding Requirements
Foreign Funding Requirements
Exports are a country’s foreign currency earnings (cash flow) that can be used to service foreign exchange-denominated debt. Central banks’ foreign exchange reserves are a stock of liquid foreign currency assets that can be used by the central bank to plug the gap in the balance of payments, if needed. Foreign funding requirements (FFRs) are calculated as the current account deficit plus FDSOs in the next 12 months. FFRs measure the amount of net foreign capital inflows required in the next 12 months for a country to cover any potential shortfall in its current account balance, as well as to service and repay its foreign currency debt coming due (both principal and interest). Chart I-7 illustrates the Chinese mainland’s FFRs over the next 12 months exceed the current account surplus by $600 billion. The fact that U.S. dollar rates have been below mainland RMB interest rates have enticed foreign currency borrowing by mainland entities over this decade. The yuan has depreciated by 12% since April 2018. This has raised foreign debt burdens relative to GDP as well as made debt servicing more expensive. Please refer to Box I-1 that elaborates why currency depreciation is more damaging than a rise in interest rates for debtors with foreign currency borrowing. Box I-1
China’s Foreign Debt, And A Secret Weapon
China’s Foreign Debt, And A Secret Weapon
Companies And Banks Table I-3 illustrates the industry composition of non-government external debt. This also includes foreign debt of offshore subsidiaries. Table I-3
China’s Foreign Debt, And A Secret Weapon
China’s Foreign Debt, And A Secret Weapon
Non-policy banks have the highest amount of outstanding private external debt, at $367 billion, followed by real estate companies at $240 billion and financial service companies at $172 billion. Overall, foreign currency debt is concentrated in the weakest links of the Chinese economy: First, revenues and cash flows of property developers, banks and non-bank finance companies are predominantly in yuan. Hence, RMB currency depreciation reduces their cash flow in U.S. dollar terms, hurting their ability to service foreign debt. The yuan has depreciated by 12% since April 2018. This has raised foreign debt burdens relative to GDP as well as made debt servicing more expensive. Second, debt stress recedes in economic upswings and rises in economic downturns. The reason is that companies’ cash flows shrink in downturns and grow in economic expansions. Property developers, banks and non-bank finance companies are not only the largest foreign currency debtors in China, but also have the weakest profit/cash flow outlooks. Chart I-8Chinese Real Estate: Starts Outpacing Completions
Chinese Real Estate: Starts Outpacing Completions
Chinese Real Estate: Starts Outpacing Completions
Property developers’ cash flow positions will deteriorate further as the lack of policy stimulus for real estate in this cycle will constrain housing demand. Chart I-8 illustrates property developers have had many starts, but few completions and generally weak sales. This is due to the fact that they use starts to raise cash through pre-sales (down payments). Once they have raised the cash, they slow the pace of construction, as demand as well as their own cash positions are weak. As to banks and non-bank financial companies, their total assets skyrocketed until the 2016 deleveraging campaign kicked in. Since then, their asset growth has been relatively tame. This along with rising non-performing loans is hurting their profits, and consequently their debt-servicing ability. Third, for non-policy banks, short-term debt is very high at $234 billion. The same measure for property developers and non-bank finance companies is $31 billion and $33 billion, respectively. Finally, companies and banks in aggregate will be confronted with $438 billion of U.S. dollar debt maturing over the coming two years. In particular, real estate companies and financial services companies are faced with repayment pressures of $99 billion and $79 billion, respectively. Risks From Currency Hedging Prior the RMB breaking below the important 7 CNY/USD technical level, it was safe to assume that there was no pressure to hedge currency risks by debtors with FX debt. Odds are that following the breaching of this technical level and in anticipation of further devaluation, many of these debtors have begun hedging their foreign currency exposure. In turn, demand to hedge currency risk for $1.3 trillion foreign currency debt by companies and non-policy banks could exert further downward pressure on the exchange rate. Do the authorities have the tools to avoid self-feeding currency depreciation? A Secret Defense Weapon: FX Swaps Chart I-9Few FX Reserves Compared With RMB Money Supply
Few FX Reserves Compared With RMB Money Supply
Few FX Reserves Compared With RMB Money Supply
China’s central bank has about $3 trillion of foreign exchange (FX) reserves that can be used to intervene in the spot market. However, the authorities are very reluctant to use these reserves. One of the primary reasons is that these FX reserves are equal to only 12% of broad money supply and RMB deposits (Chart I-9). These are very low numbers in comparison with other countries. In addition, when a central bank sells its international reserves and buys local currency, the banking system’s liquidity/excess reserves at the central bank shrink, leading to higher interbank rates. Hence, defending the currency with FX reserves comes at the expense of tighter liquidity. This is unacceptable for Chinese policymakers because the economy remains very weak and extremely reliant on credit to grow. The good news is that the authorities have another tool – FX swaps – and are likely already using it to defend the yuan. Other EM countries have used FX swaps to defend their currencies as well, most notably Brazil in 2014-‘15. Media reports on several occasions have speculated that Chinese state banks sold U.S. dollars in the forward foreign exchange market in a bid to defend the forward rate and thus influence the spot market. We suspect this may be true, even though there is no available information on the amount and counterparties of FX swaps. What are the mechanisms and implications of FX swap interventions? In a FX swap transaction, a bank (the central bank or a state-owned bank) sells U.S. dollars to a company in the forward market. There is no flow of dollars or yuan in the spot market. If by the maturity date of the FX swap, the RMB depreciates more than what was implied by forwards on the date of the transaction, the bank suffers a loss. Otherwise, the bank makes a profit. The bad news is that a lot of FX debt is concentrated in the most vulnerable segments of the Chinese economy. In a nutshell, the authorities (state banks or the central bank) could hypothetically support the yuan by selling unlimited amounts of dollars in the forward market. Unlike the sale of U.S. dollars from the People’s Bank of China’s FX reserves, this would entail neither a depletion of foreign currency reserves nor a withdrawal of yuan liquidity. Chart I-10Large Bank Stocks Have Broken Down
Large Bank Stocks Have Broken Down
Large Bank Stocks Have Broken Down
These interventions are positive as they smooth the exchange rate trend and rule out a sharp tumble in the currency value. However, this strategy still has several shortcomings: (1) These FX swap operations can lead to large losses at state-owned banks. Barring the Ministry of Finance or the PBoC writing a check to these state banks to cover these losses, the latter will dampen banks’ earnings. Consequently, their share prices will slump (Chart I-10). (2) These FX swaps transactions only delay demand for dollars in the spot market and thereby defer downward pressure on the local currency, but they do not eliminate it forever. Conclusions The bad news is that a lot of FX debt is concentrated in the most vulnerable segments of the Chinese economy: property developers, banks and finance companies. They have little FX revenues so they are exposed to RMB depreciation. Given the exchange rate has broken below the psychological level of 7 CNY/USD (Chart I-11), odds are they will try to hedge their currency risk by buying U.S. dollars in the forward market. This will heighten depreciation pressure on the yuan. Chart I-11RMB And Its Volatility
RMB And Its Volatility
RMB And Its Volatility
The good news is that the authorities have a tool to smooth the currency depreciation via FX swaps. This will assure there is no currency turmoil in China, even if demand for dollars escalates. The costs of defending will be losses at large state-owned banks. Yet, those losses can ultimately be borne by the central government, which has little debt (20% of GDP). Downward pressure on the RMB will persist because of: Large demand for dollars from companies and banks with large FX debt levels as they attempt to hedge their FX risks; Weak economic activity, U.S. import tariffs and deflationary pressures - warranting currency depreciation; Potentially large demand for dollars from resident capital outflows. Lin Xiang, Research Analyst linx@bcaresearch.com Arthur Budaghyan Chief Emerging Markets Strategist arthurb@bcaresearch.com Footnotes