China
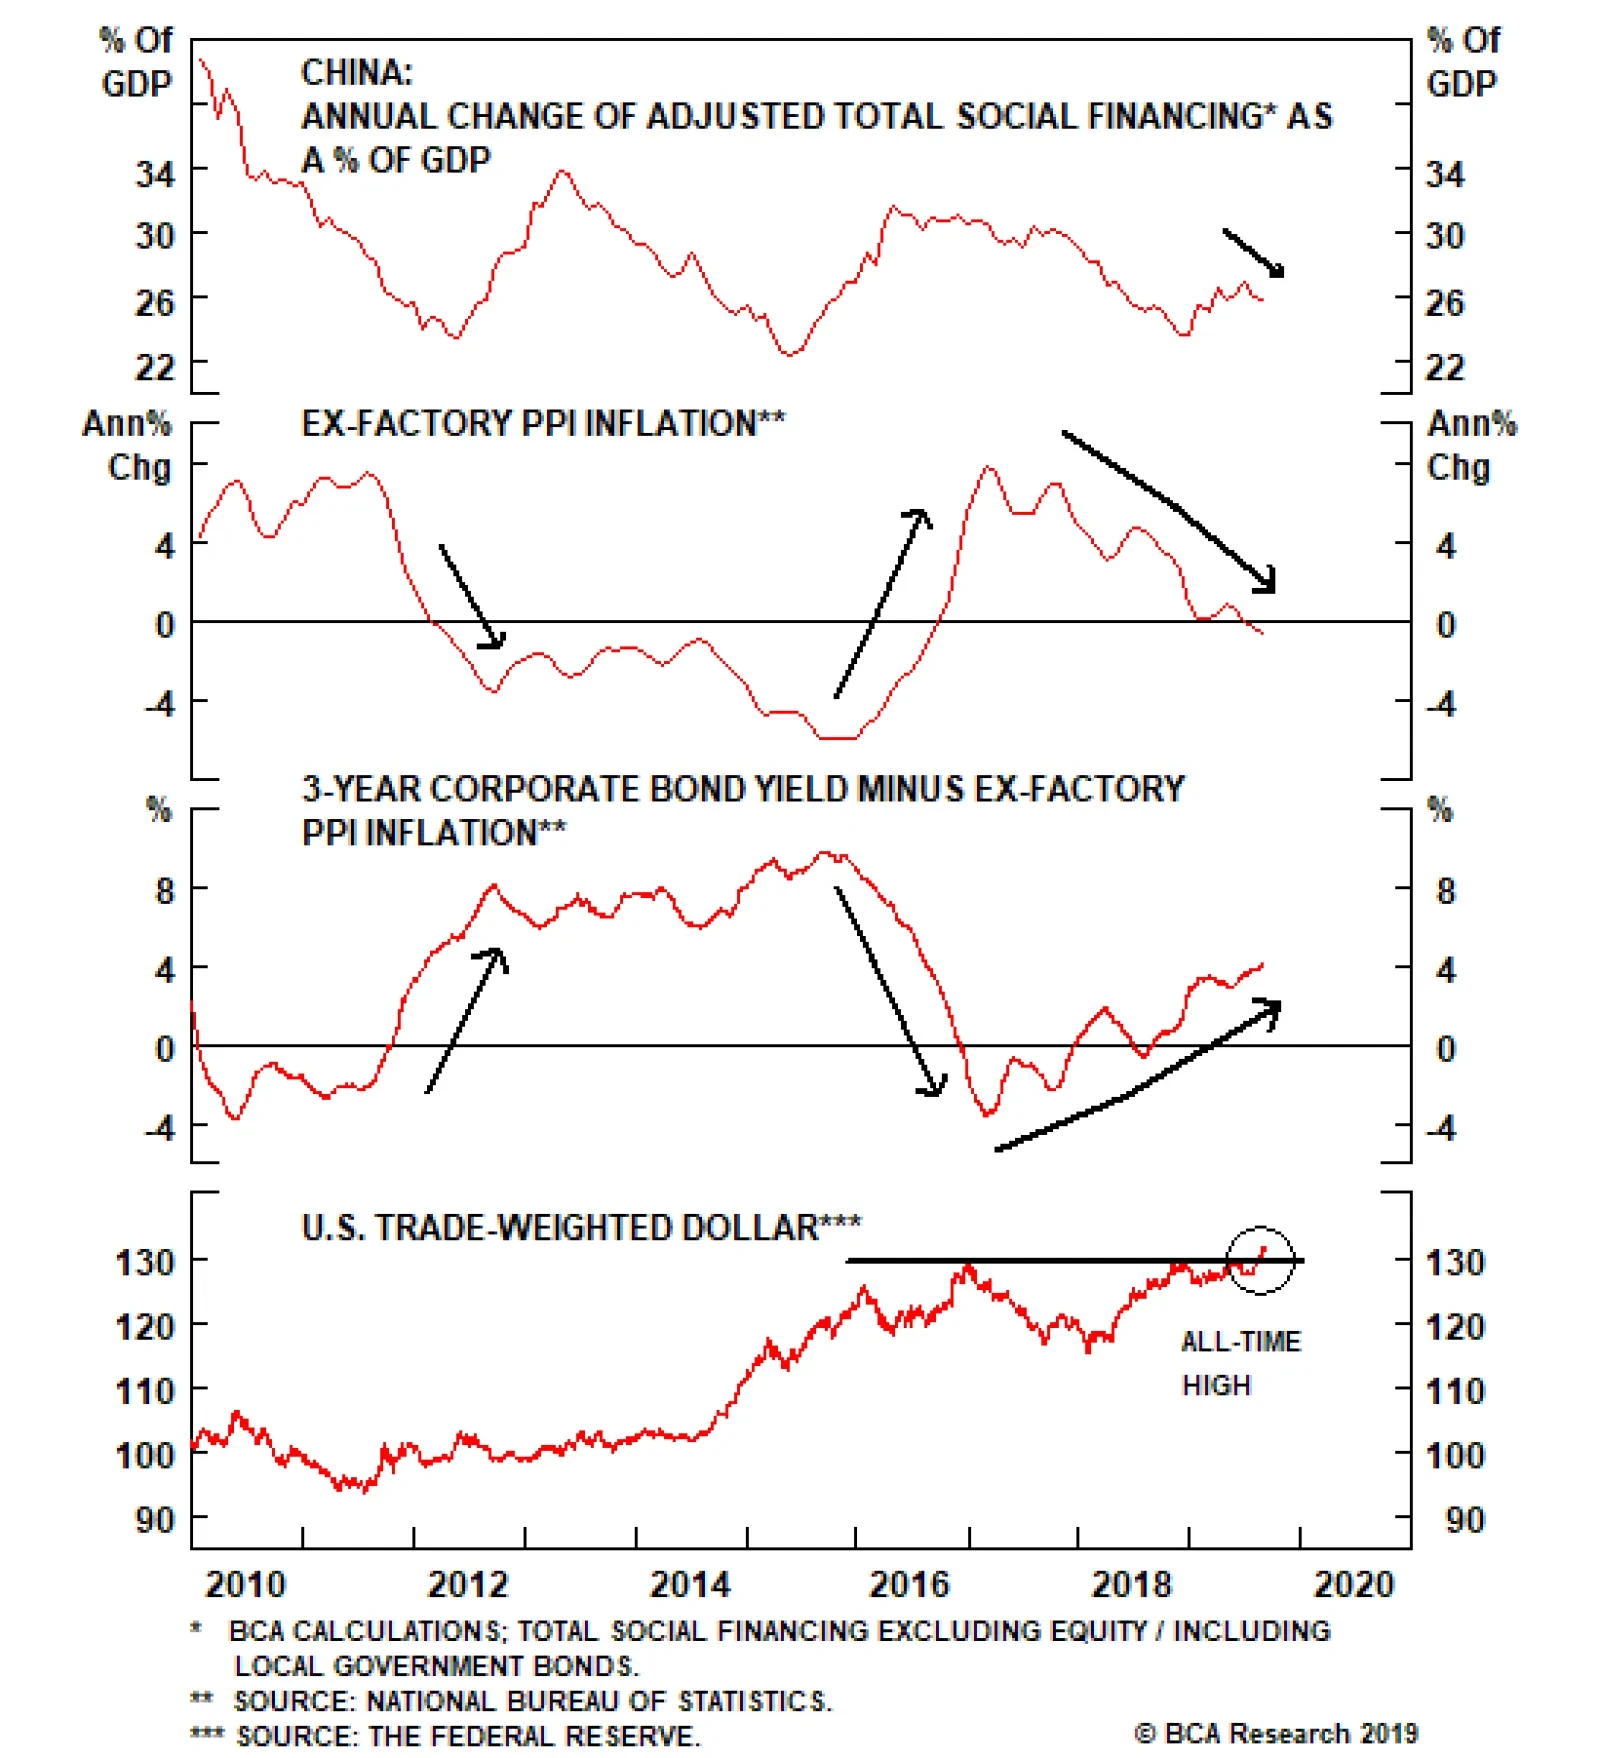
China’s August Total Social Financing improved relative to July, rising from CNY1.01 trillion to CNY1.95 trillion, and beating expectations of CNY1.605 trillion. The positives end there. The annual growth rate of Total Social Financing continues to…
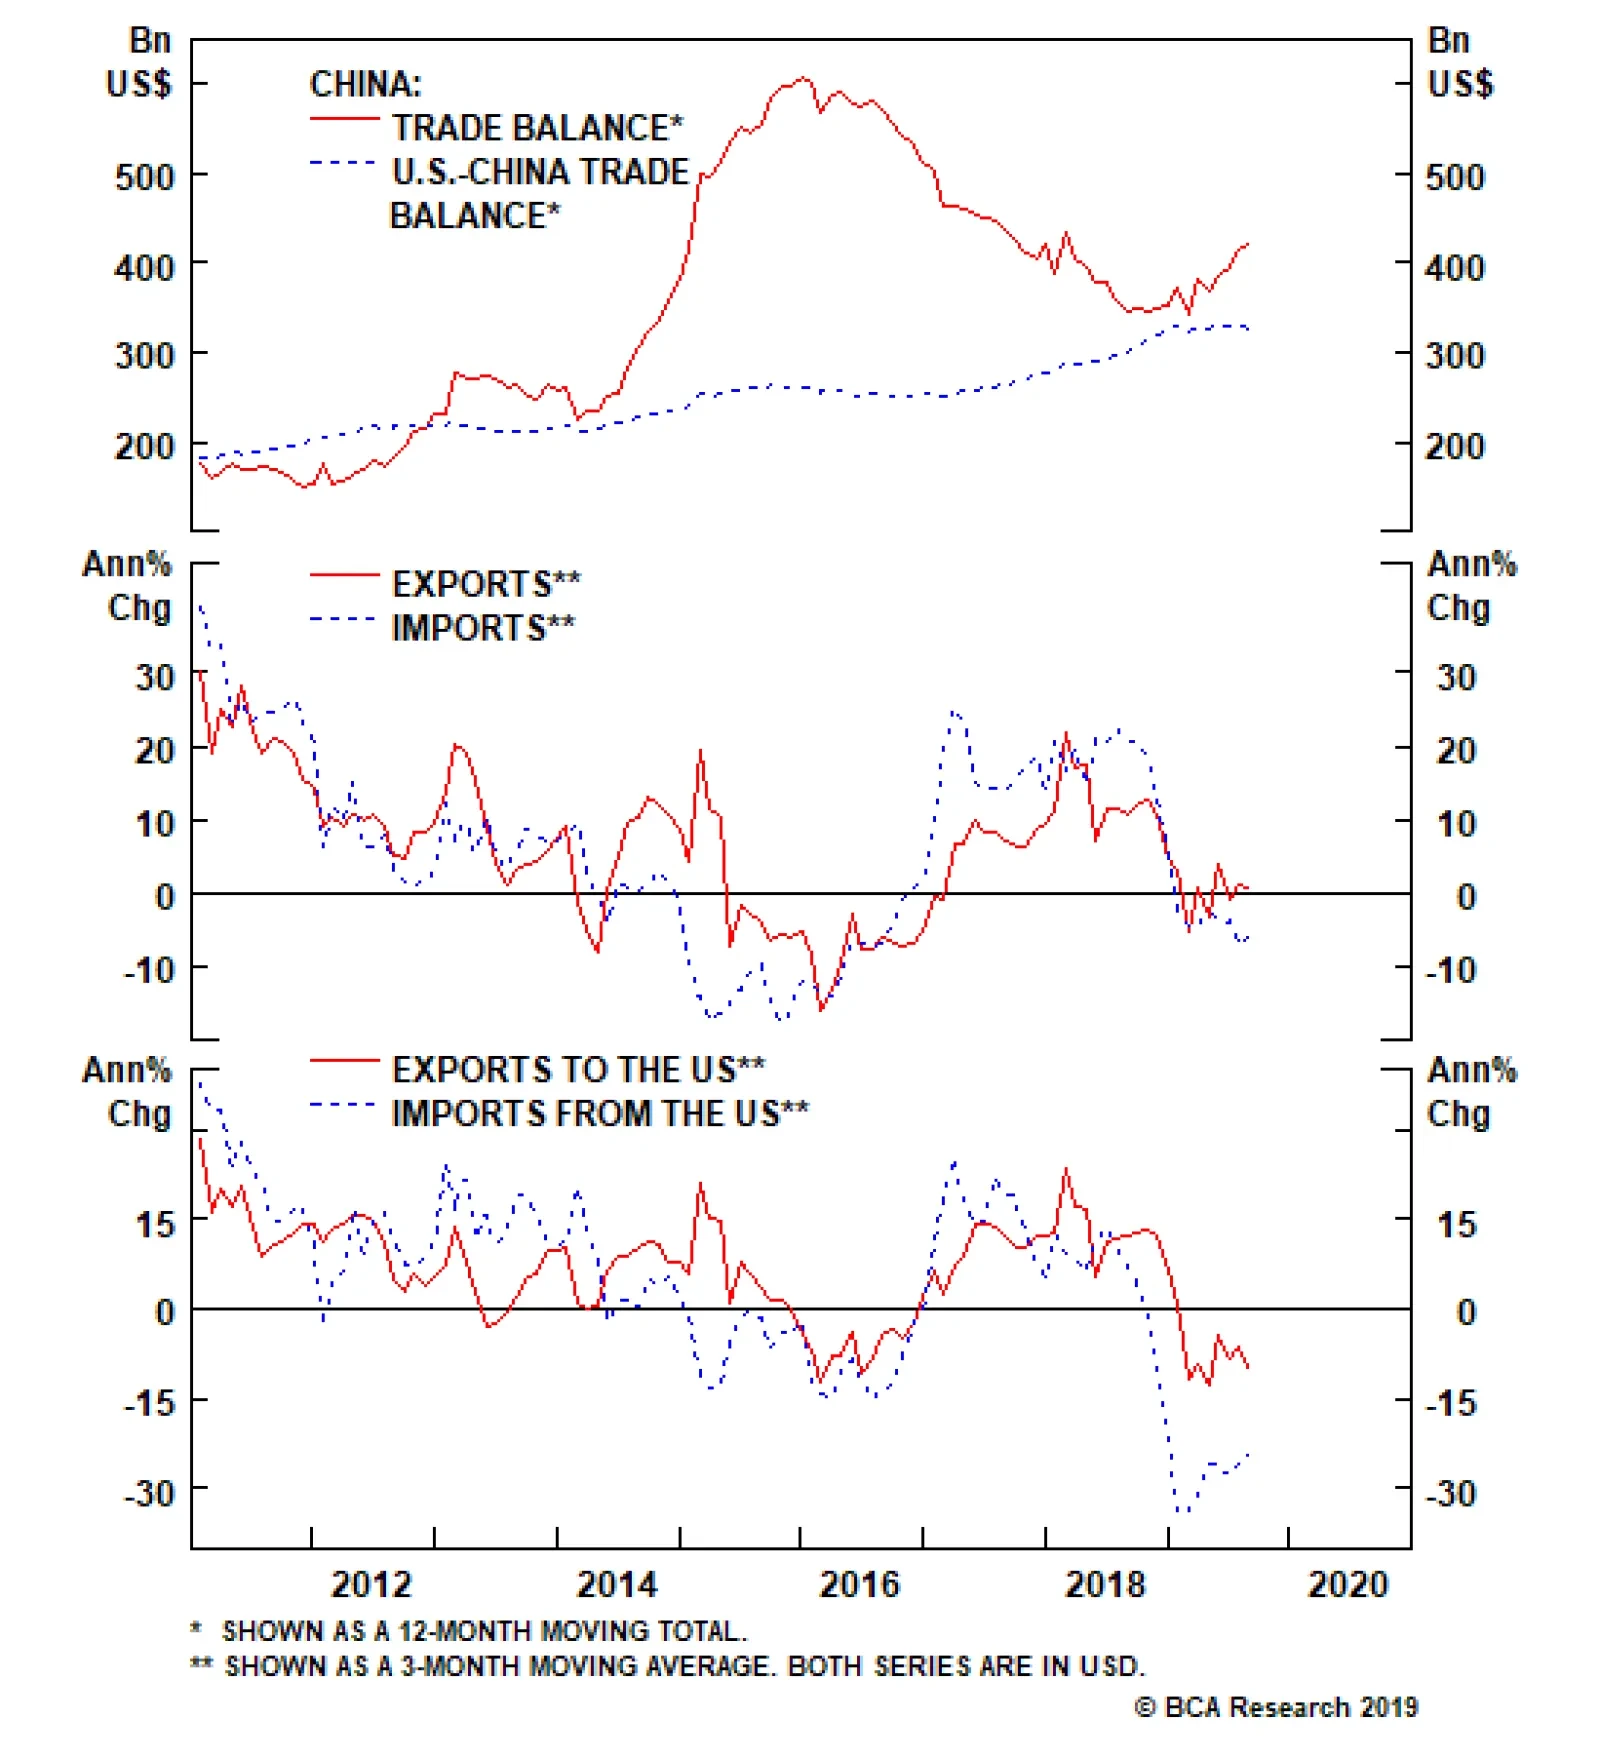
Chinese August trade numbers were soft. In USD-terms, Chinese exports contracted 1% annually, and imports, 5.6%. A weak yuan softened the blow. In RMB-terms, exports decelerated from a 10.3% annual growth to 2.6% and imports contracted by 2.6%. The…
Share prices of growth companies, defensive equity sectors and credit markets are at risk because of expensive valuations and crowded investor positioning. In other words, they could sell off even if a global recession is avoided. To assess the outlook for…
China, rather than the U.S. has been the epicenter of the global slowdown. Hence, a major rally in global cyclical equities and EM risk assets hinges on a recovery in the Chinese business cycle. Even though Caixin’s PMI for China was slightly up in August,…

Highlights The lingering global manufacturing recession and the substantial drop in U.S. bond yields have been behind the decoupling between both EM stocks and the S&P 500, and cyclical and defensive equities. Neither the most recent economic data, nor the relative performance of global cyclicals, China-related plays and high-beta markets herald a broad-based and lasting risk-on phase in global markets. On the contrary, economic and market signposts continue to indicate either further bifurcation in global markets or a risk-off period. We review some of our long-standing themes and associated recommendations. Feature Global financial markets have become bifurcated. On one hand, numerous segments of global financial markets leveraged to global growth, including EM stocks, have already sold off (Chart I-1). On the other hand, share prices of growth companies, defensive stocks and global credit markets have remained resilient. Chart I-2 shows that a similar divergence has taken place within EM asset classes: EM share prices have plummeted while EM corporate credit excess returns have not dropped much. Chart I-1Bifurcated Equity Markets
Bifurcated Equity Markets
Bifurcated Equity Markets
Chart I-2Bifurcated Markets In EM
Bifurcated Markets In EM
Bifurcated Markets In EM
How to explain this market bifurcation? Financial markets sensitive to global trade and manufacturing cycles have been mirroring worsening conditions in global trade and manufacturing. Some of the affected segments include: Global cyclical equity sectors. Emerging Asia manufacturing-related currencies (KRW, TWD and SGD) versus the U.S. dollar (Chart I-3). EM and DM commodity currencies (Chart I-4). Chart I-3Total Return (Including Carry): KRW, TWD And SGD Vs. USD
bca.ems_wr_2019_09_05_s1_c3
bca.ems_wr_2019_09_05_s1_c3
Chart I-4EM And DM Commodity Currencies
EM And DM Commodity Currencies
EM And DM Commodity Currencies
Industrial and energy commodities prices. U.S. high-beta stocks as well as U.S. small caps (Chart I-5). Chart I-5U.S. High-Beta Stocks
U.S. High-Beta Stocks
U.S. High-Beta Stocks
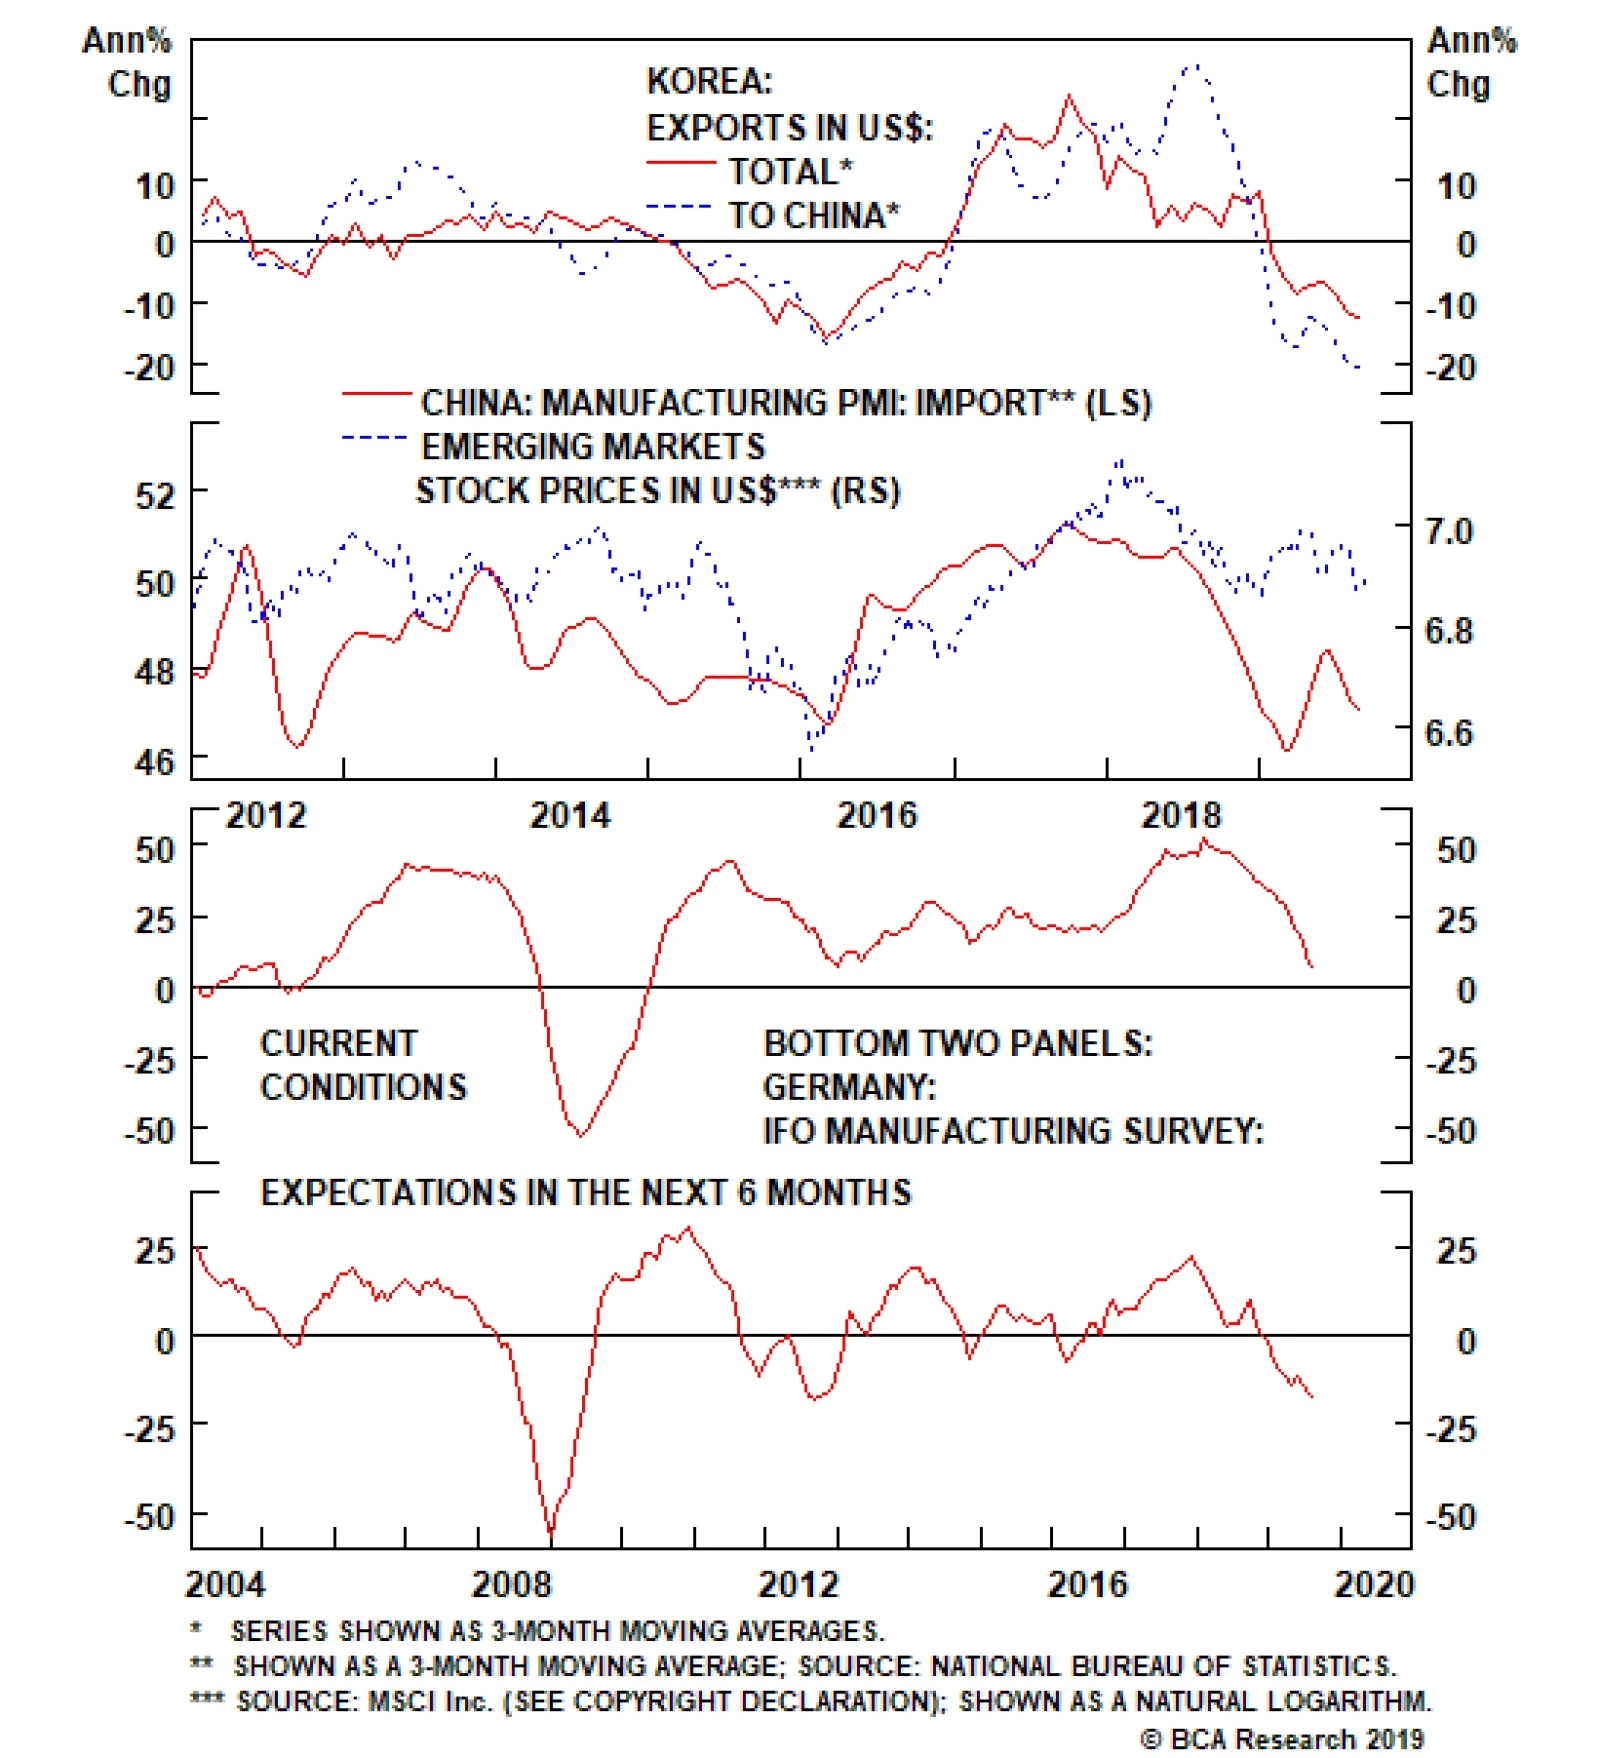
DM bond yields. Crucially, the current global trade and manufacturing downturns have taken place despite robust U.S. consumer spending. In fact, our theme for the past several years has been that a global business cycle downturn would occur despite ongoing strength in American household spending. The rationale has been that China and the rest of EM combined are large enough on their own to bring down global trade and manufacturing, irrespective of strength in U.S. consumer spending. At the current juncture, one wonders whether such a market bifurcation is justified. It is not irrational. The basis for decoupling between cyclical and defensive equities has been U.S. bond yields. The substantial downshift in U.S. interest rate expectations has led to a re-rating of non-cyclicals and growth company stocks. Corporate bonds have also done well, given the background of a falling risk-free rate. Will the current market bifurcation continue? Or will these segments in global financial markets recouple and in which direction? What To Watch China rather than the U.S. has been the epicenter of this slowdown, as we have argued repeatedly in the past. Hence, a major rally in global cyclical equities and EM risk assets all hinge on a recovery in the Chinese business cycle. The basis for decoupling between cyclical and defensive equities has been U.S. bond yields. The substantial downshift in U.S. interest rate expectations has led to a re-rating of non-cyclicals and growth company stocks. Even though Caixin’s PMI for China was slightly up in August, many other economic indicators remain downbeat: The latest hard economic data out of Asia suggest that global trade/manufacturing continues to contract. Korea’s total exports in August contracted by 12.5% from a year ago, and its shipments to China plunged by 20% (Chart I-6). The import sub-component of China’s manufacturing PMI is not showing signs of amelioration (Chart I-7). The mainland’s import recovery is very critical to a revival in global trade and manufacturing. Chart I-6Korean Exports: No Recovery
Korean Exports: No Recovery
Korean Exports: No Recovery
Chart I-7Chinese Imports To Remain Weak
Chinese Imports To Remain Weak
Chinese Imports To Remain Weak
Chart I-8German Manufacturing Confidence
German Manufacturing Confidence
German Manufacturing Confidence
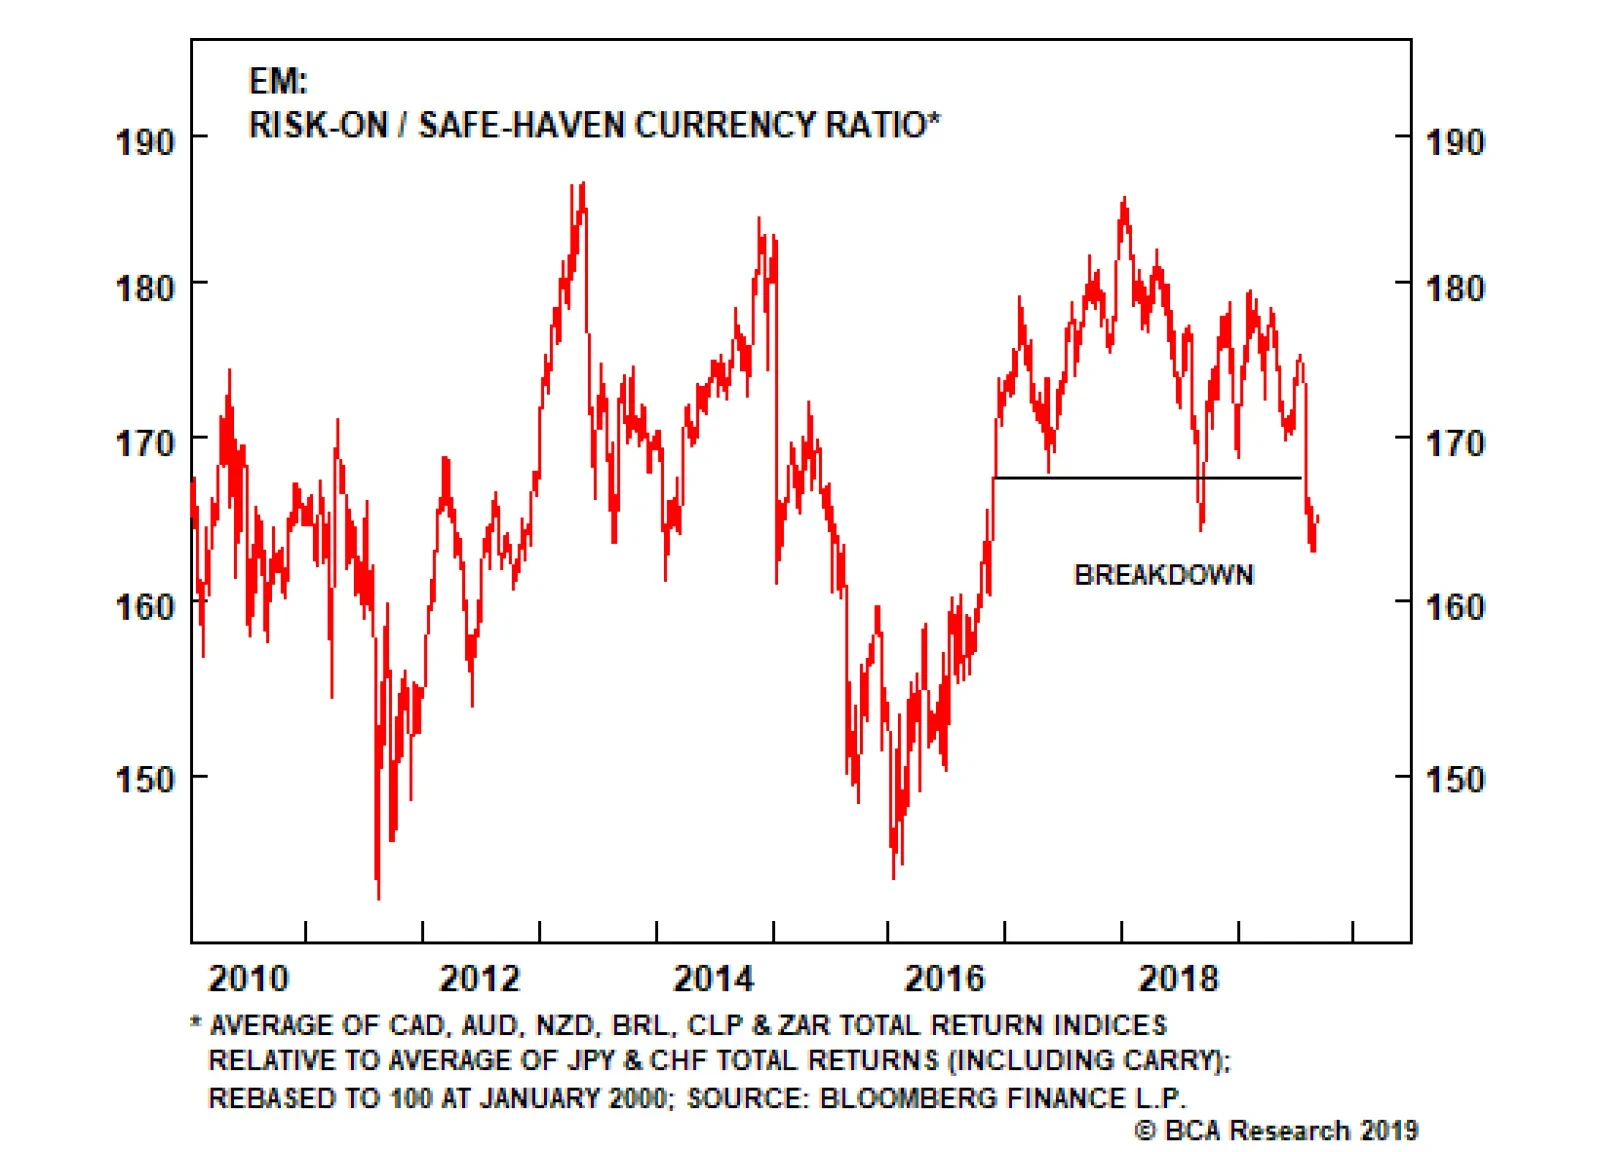
German manufacturing IFO business expectations and current conditions both suggest that it is still early to bet on a global trade recovery (Chart I-8). Newly released August data points reveal that U.S., Taiwanese, and Swedish manufacturing new export orders continue to tumble. To gauge whether bifurcated markets will recouple and whether it will occur to the downside or the upside, investors should watch the relative performance of China-exposed markets, global cyclicals and high-beta plays – the ones that have already sold off substantially. The notion is as follows: These markets’ relative performance will likely bottom before their absolute performance recovers. If so, their relative performance will likely foretell the outlook for their absolute performance. Concerning share prices of growth companies, defensive equity sectors and credit markets, these segments are at risk because of expensive valuations and crowded investor positioning. In other words, they could sell off even if a global recession is avoided. Concerning share prices of growth companies, defensive equity sectors and credit markets, these segments are at risk because of expensive valuations and crowded investor positioning. To assess the outlook for global cyclicals and China-related plays, we are monitoring the following financial market indicators: The Risk-On/Safe-Haven currency ratio is the average of high-beta commodity currencies such as the CAD, AUD, NZD, BRL, CLP and ZAR total return (including carry) indices relative to the average of JPY and CHF total returns (including carry). This ratio is dollar-agnostic. This ratio is making a new cyclical low (Chart I-9). Hence, it presently warrants a negative view on global growth, China’s industrial sector and commodities. Global cyclical equity sectors seem to be on the edge of breaking down versus defensives (Chart I-10). This ratio does not signal ameliorating global growth conditions. Chart I-9The Risk-On/Safe-Haven Currency Ratio
bca.ems_wr_2019_09_05_s1_c9
bca.ems_wr_2019_09_05_s1_c9
Chart I-10Global Cyclicals Versus Defensives
Global Cyclicals Versus Defensives
Global Cyclicals Versus Defensives
Chart I-11U.S. High-Beta Stocks Versus S&P 500
U.S. High-Beta Stocks Versus S&P 500
U.S. High-Beta Stocks Versus S&P 500
Finally, U.S. high-beta stocks continue to underperform the S&P 500 (Chart I-11). This is consistent with overall U.S. growth deceleration. Bottom Line: Neither the most recent economic data, nor the relative performance of global cyclicals, China-related plays and high-beta markets herald a broad-based and lasting risk-on phase in global markets. On the contrary, economic and market signposts continue to foreshadow either further bifurcation in global markets or a risk-off period. Continue trading EM stocks and currencies on the short side, and underweighting EM risk assets versus DM. Our Investment Themes And Positions Some of our open positions often run for years because they reflect our long-standing themes. Our core theme has for some time been that a global trade/manufacturing recession will be generated by a growth relapse in China. To capitalize on this theme, we have been recommending a short EM stocks / long 30-year U.S. Treasurys strategy since April 2017. This recommendation has produced a 25% gain since its initiation (Chart I-12). Continue betting on lower local interest rates in emerging economies where the central bank can cut rates despite currency depreciation. To implement this theme, we have been recommending receiving swap rates in Korea and Chile for the past several years. Our reluctance to recommend an outright buy on local bonds stems from our bearish view on both currencies – the Korean won and Chilean peso. In fact, we have been shorting both the KRW and the CLP against the U.S. dollar. Chart I-13 shows that swap rates in Korea and Chile have dropped substantially since our recommendations to receive rates in these countries. More rate cuts are forthcoming in these economies, and we are maintaining these positions. Chart I-12EM Stocks Have Massively Underperformed U.S. Bonds
EM Stocks Have Massively Underperformed U.S. Bonds
EM Stocks Have Massively Underperformed U.S. Bonds
Chart I-13Continue Receiving Rates In Korea And Chile
Continue Receiving Rates In Korea And Chile
Continue Receiving Rates In Korea And Chile
We have been bearish on EM banks in general and Chinese banks in particular. We have expressed these themes in a number of ways: Short EM and Chinese / long U.S. bank stocks. Short EM banks / long EM consumer staples (Chart I-14). Within Chinese banks, we have been short Chinese medium and small banks / long large ones. All these strategies remain valid. In credit markets, we have been favoring U.S. corporate credit versus EM sovereign and corporate credit. Ability to service debt is better among U.S. debtors than EM/Chinese borrowers. We have been playing this theme in the following ways: Underweight EM sovereign and corporate credit / overweight U.S. investment-grade corporates (Chart I-15). Chart I-14Short EM Banks / Long EM Consumer Staples
Short EM Banks / Long EM Consumer Staples
Short EM Banks / Long EM Consumer Staples
Chart I-15Underweight EM Credit / Overweight U.S. Investment-Grade Corporates
Underweight EM Credit / Overweight U.S. Investment-Grade Corporates
Underweight EM Credit / Overweight U.S. Investment-Grade Corporates
Underweight Asian high-yield corporate credit / overweight emerging Asian investment-grade corporates. As a bet on a deteriorating political and business climate in Hong Kong, in our Special Report on Hong Kong SAR from June 27, we reiterated the following positions: Short Hong Kong property stocks / long Singapore equities. Arthur Budaghyan Chief Emerging Markets Strategist arthurb@bcaresearch.com Mexico: Crying Out For Policy Easing The Mexican economy is heading into a full-blown recession. Most segments of the economy are in contraction, and leading indicators point to further downside. Both manufacturing and non-manufacturing PMIs are well below 50 (Chart II-1). Monetary policy remains too restrictive: Nominal and real interest rates are both very high and plunging narrow money (M1) growth is signaling further downside in economic activity (Chart II-2). Chart II-1The Economy Is Deteriorating
The Economy Is Deteriorating
The Economy Is Deteriorating
Chart II-2Narrow Money Points To Negative Growth
Narrow Money Points To Negative Growth
Narrow Money Points To Negative Growth
An inverted yield curve signifies that the central bank is behind the curve and foreshadows growth contraction (Chart II-3). Fiscal policy has tightened as the government has remained committed to achieving a primary fiscal surplus of 1% of GDP in 2019 (Chart II-4, top panel). Consequently, nominal government expenditures have been curbed (Chart II-4, bottom panel). The government’s fiscal stimulus has not been large and has been implemented too late. Chart II-3A Message From The Inverted Yield Curve
A Message From The Inverted Yield Curve
A Message From The Inverted Yield Curve
Chart II-4Fiscal Policy Has Tightened A Lot
Fiscal Policy Has Tightened A Lot
Fiscal Policy Has Tightened A Lot
Finally, business confidence is extremely low due to uncertainty over President Andrés Manuel López Obrador’s (AMLO) policies towards the private sector. The president is attempting to revive business confidence, but it will take time. Chart II-5Mexico Versus EM: Domestic Bonds And Sovereign Credit
Mexico Versus EM: Domestic Bonds And Sovereign Credit
Mexico Versus EM: Domestic Bonds And Sovereign Credit
Our major theme for Mexico has been that both monetary and fiscal policies are very tight. Consequently, we have been recommending overweight positions in Mexican domestic bonds and sovereign credit relative to their respective EM benchmarks. (Chart II-5). Recessions are bad for share prices, but in tandem with prudent macro policies, they can be positive for fixed-income markets. Meanwhile, we have been favoring the Mexican peso relative to other EM currencies due to the fact that AMLO is not as negative for the country as was initially perceived by markets. With inflation falling and the Federal Reserve cutting rates, Banxico will ease further. Yet, it will likely cut rates slower than warranted by the economy. The longer the central bank takes to ease, the lower domestic bond yields will drop. Concerning sovereign credit, investors should remain overweight Mexico within an EM credit portfolio. Mexico’s fiscal position is healthier, and macroeconomic policies will be more prudent relative to what the market is currently pricing. We continue to believe concerns about Pemex’s financing and its impact on government debt are overblown, as we discussed in detail in our previous Special Report. In July, the government released an action plan for Pemex financing. We view this plan as marginally positive. To supplement this plan, the government can use the $14.5 billion federal budget stabilization fund to fill in financing shortfalls in the coming years. Importantly, the starting point of Mexican public debt is quite low, which will allow the government to finance Pemex in the years to come by borrowing more from markets. Recessions are bad for share prices, but in tandem with prudent macro policies, they can be positive for fixed-income markets. Lastly, our overweight recommendation in Mexican stocks has not played out. However, we are maintaining it for the following reasons: Chart II-6 illustrates that when Mexican domestic bond yields decline relative to EM ones (shown inverted on Chart II-6), Mexican share prices usually outperform their EM counterparts in common currency terms. Consistent with our view that Mexican local currency bonds will outperform their EM peers, we expect Mexican stocks to outpace the EM equity benchmark. The Mexican bourse’s relative performance against EM often swings with the relative performance of EM consumer staples versus the EM equity benchmark. This is due to the large share of consumer staples stocks in Mexico (34.5%) compared to that in the EM benchmark (7%). Consumer staples stocks are beginning to outpace the EM equity index, raising the odds of Mexican equity outperformance versus its EM peers (Chart II-7). Chart II-6Local Bond Yields And Relative Stocks: Mexico Versus EM
Local Bond Yields And Relative Stocks: Mexico Versus EM
Local Bond Yields And Relative Stocks: Mexico Versus EM
Chart II-7Consumer Staples Have A Large Weight In Mexican Bourse
Consumer Staples Have A Large Weight In Mexican Bourse
Consumer Staples Have A Large Weight In Mexican Bourse
We do not expect a major rally in this nation’s stock market given the negative growth outlook. Our bet is that Mexican share prices - having already deflated considerably - will drop less in dollar terms than the overall EM equity index. Bottom Line: We continue to recommend an overweight stance on Mexican sovereign credit, domestic bonds and equities relative to their respective EM benchmarks. The main risk to the Mexican peso stems from persisting selloff in EM currencies. Traders’ net long positions in the MXN are elevated posing non-trivial risk (Chart II-8). We have been long MXN versus ZAR but are taking profit today. This trade has generated a 9.7% gain since March 29, 2018. A plunging oil-gold ratio warrants a caution on this cross rate in the near term (Chart II-9). Chart II-8Investors Are Long MXN
Investors Are Long MXN
Investors Are Long MXN
Chart II-9Take Profits On Long MXN / Short ZAR Trade
Take Profits On Long MXN / Short ZAR Trade
Take Profits On Long MXN / Short ZAR Trade
Juan Egaña, Research Associate juane@bcaresearch.com Arthur Budaghyan Chief Emerging Markets Strategist arthurb@bcaresearch.com Footnotes Equities Recommendations Currencies, Credit And Fixed-Income Recommendations
Highlights Coincident measures of economic activity suggest that China’s economy continued to slow in July. The August manufacturing PMIs were positive, but they more likely reflect tariff front-running activity than a genuine improvement in the export outlook. The decline in the RMB will have a positive reflationary effect for Chinese producers, but it will not likely be enough to prevent a further slowdown in activity if the export outlook continues to deteriorate (as we expect). Our investment strategy recommendations remain unchanged: underweight Chinese stocks over a tactical (i.e. 0-3 month) time horizon, but overweight cyclically (6-12 months) on the basis that policymakers will ultimately act on the need to ease further. Feature Tables 1 and 2 on pages 2 and 3 highlight key developments in China’s economy and its financial markets over the past month. On the growth front, coincident measures of economic activity suggest that China’s economy continued to slow in July. The August manufacturing PMIs were positive (especially the Caixin PMI), but the absence of a pickup in manufacturing outside of China suggests that the August improvement (and the recent trend in China’s export data) reflects the same kind of tariff front-running activity that has occurred on more than one occasion over the past 18 months (and which sharply unwound in late-2018 / early-2019). On the housing front, July’s update saw a narrowing in the gap between lofty housing construction and depressed sales volume, suggesting that housing-related activity is unlikely to provide a ballast to counter a weakening external demand outlook absent further policy support for the sector. Table 1China Macro Data Summary
China Macro And Market Review
China Macro And Market Review
Table 2China Financial Market Performance Summary
China Macro And Market Review
China Macro And Market Review
Within financial markets, the continued decline in the RMB is the most noteworthy development, with USD-CNH having risen roughly 4.5% since we initiated our long position in mid-May. The still-controlled decline is likely to have a reflationary effect for Chinese producers, but not likely enough to prevent a further slowdown in activity if the export outlook continues to deteriorate in Q4 (as we expect). Consequently, our investment strategy recommendations remain unchanged: the near-term outlook remains bearish for China-related assets, but Chinese policymakers will be forced over the coming 3-6 months to recognize the need to ease further. Investors should remain overweight Chinese stocks over a 6-12 month horizon, but should continue to hedge RMB exposure by being long USD-CNH. In reference to Tables 1 and 2, we provide below several detailed observations concerning developments in China’s macro and financial market data: Chart 1The Chinese Economy Continues To Slow
The Chinese Economy Continues To Slow
The Chinese Economy Continues To Slow
Based on coincident activity indicators such as the Li Keqiang index (LKI), China’s economy continued to slow in July (Chart 1). While the pace of growth remains stronger today than it did during the depths of the 2015/2016 slowdown, momentum is clearly negative and a further deceleration is likely over the coming few months. In short, Chinese growth has not yet bottomed. Our leading indicator for the LKI remains in a shallow uptrend, but slowed in July. The sequential decline occurred in nearly all of the components of the indicator; credit was particularly disappointing, with adjusted total social financing growth having decelerated nearly a half a percentage point on a YoY basis. Our indicator underscores that more easing will ultimately be needed in order to stabilize economic activity, even though we acknowledge that it will only likely arrive in piecemeal fashion until policymakers are pressured with a further significant slowdown in growth. The July housing data update was significant, as it featured a narrowing of the gap between lofty housing construction and depressed sales volume (Chart 2). While both the pace of pledged supplementary lending as well as sales volume growth marginally improved in July, floor space started decelerated to mid-single-digit territory (from 10+%). We have noted in several reports that the gap between starts and sales is unsustainable, suggesting that housing-related activity is unlikely to provide a ballast to counter a weakening external demand outlook absent further policy support. At first blush, China’s August PMIs were surprisingly positive. While the official manufacturing PMI slightly declined, the new export orders component improved as did the overall Caixin manufacturing PMI. The improvement in the latter was particularly significant, as it brought the index back into expansionary territory. However, our view of the pickup is less sanguine, and we expect it to reverse over the coming few months. August’s trade data has yet to be released, but the divergence between export and import growth in July provides a clue that the pickup in manufacturing/export sentiment is likely to be temporary. Ex-China, the global PMI has not meaningfully improved (Chart 3), which implies that the acceleration in Chinese export growth is indicative of the same kind of tariff front-running activity that has occurred on more than one occasion over the past 18 months (and which sharply unwound in late-2018 / early-2019). As a result, investors should view the near-term improvement in Chinese export-related data as a sign of an impending slowdown in trade activity, rather than an indication that the underlying trade situation is improving. Chart 2The Unsustainable Pace Of Housing Starts Is Slowing
The Unsustainable Pace Of Housing Starts Is Slowing
The Unsustainable Pace Of Housing Starts Is Slowing
Chart 3China's August PMI Likely Reflects Tariff Front-Running
China's August PMI Likely Reflects Tariff Front-Running
China's August PMI Likely Reflects Tariff Front-Running
Chart 4A-Shares Are Trading More Off Domestic Stimulus Odds Than Investable Stocks
A-Shares Are Trading More Off Domestic Stimulus Odds Than Investable Stocks
A-Shares Are Trading More Off Domestic Stimulus Odds Than Investable Stocks
The most relevant high-level insight emanating from China’s equity markets continues to be the divergence in performance between investable and domestic stocks over the past three months. While investable stocks have trended lower due to the strong focus of foreign investors on the trade war, domestic stocks have moved sideways versus the global benchmark in US$ terms (Chart 4). To us, this suggests that domestic stocks are acting as a better barometer of domestic reflation than their investable peers and, for now, A-shares are acting as if reflationary efforts will just offset weak external demand. The likelihood of a further growth slowdown coupled with the reluctance of Chinese policymakers to aggressively stimulate implies that the domestic market is at risk of a near-term relapse, but global investors should watch closely for a breakout to the upside as an indication that policy is becoming considerably easier (and that investable stocks may soon follow the domestic market higher). Over the past month, sector performance within the investable equity market has mostly been along cyclical/defensive lines, with the former underperforming the latter. One notable exception is the investable consumer discretionary sector, which has risen more than 7% over the past month in absolute US$ terms, and has been rising in relative terms since the beginning of the year. Alibaba now accounts for a sizeable portion of the investable consumer discretionary sector, and its outperformance may be signaling a stable outlook for domestic consumer spending. China’s interbank and government bond market has been little changed over the past month. After having declined roughly 20 bps from late-July to early-August, Chinese government bond yields remain at a nearly 3-year low as part of ongoing investor expectations that monetary policy in China will remain easy. The PBOC’s mid-August reform of the loan prime rate (LPR) was a small step in the direction of further easing, but was not likely large enough to have a material impact on credit growth. More fiscal spending remains the most likely avenue for significant additional stimulus, but we do not expect it to materialize before economic activity slows further. Chart 5Onshore Corporate Bond Returns: Negligant Impact Of Defaults
Onshore Corporate Bond Returns: Negligant Impact Of Defaults
Onshore Corporate Bond Returns: Negligant Impact Of Defaults
Chinese onshore corporate bond spreads fell slightly over the past month, reversing part of a modest uptrend in spreads that had begun in May. Abstracting from the day-to-day changes in spreads, the bigger story is that acute concerns over the potential for widespread corporate defaults have not led to any material impact on onshore corporate bond performance at any point over the past 18 months (which is in line with what we argued several times last year). In RMB terms the ChinaBond Corporate Bond Total Return Index has risen nearly 8% over the past year, or roughly 2.6% in unhedged US$ terms using spot exchange rates (Chart 5). While we would not advise an unhedged currency position in onshore corporate bonds at this time given our long stance towards USD-CNH, the bottom line for investors is that onshore corporate bond spreads already account for rising defaults, and probably overstate the risk. China’s controlled but very significant currency depreciation has continued over the past month, with USD-CNH having nearly reached 7.2 this week. Our earnings recession model for the MSCI China index suggests that the depreciation is likely to have a stimulative effect; holding the current pace of credit growth and the outlook for new export orders constant, the decline in the RMB has probably cut the odds of an ongoing contraction in EPS from roughly two-thirds to slightly over one-half over the past month. However, we noted above that the modest improvement in China’s manufacturing PMIs likely reflects unsustainable trade frontrunning, signaling that further stimulus will likely be required. This will have to come either through a more intense pace of credit growth, or meaningful further currency depreciation (or both). As such, investors should stay long USD-CNH for now, despite the significant rise over the past month. Jonathan LaBerge, CFA, Vice President Special Reports jonathanl@bcaresearch.com Jing Sima China Strategist jings@bcaresearch.com Cyclical Investment Stance Equity Sector Recommendations
Highlights While a self-fulfilling crisis of confidence that plunges the global economy into recession cannot be excluded, it is far from our base case. Provided the trade war does not spiral out of control, it is highly likely that global equities will outperform bonds over the next 12 months. The auto sector has been the main driver of the global manufacturing slowdown. As automobile output begins to recover later this year, so too will global manufacturing. Go long auto stocks. As a countercyclical currency, the U.S. dollar will weaken once global growth picks up. We expect to upgrade EM and European equities later this year along with cyclical equity sectors such as industrials, energy, and materials. Financials should also benefit from steeper yield curves. We still like gold as a long-term investment. However, the combination of higher bond yields and diminished trade tensions could cause bullion to sell off in the near term. As such, we are closing our tactical long gold trade for a gain of 20.5%. Feature “The Democrats are trying to 'will' the Economy to be bad for purposes of the 2020 Election. Very Selfish!” – @realDonaldTrump, 19 August 2019 8:26 am “The Fake News Media is doing everything they can to crash the economy because they think that will be bad for me and my re-election” – @realDonaldTrump, 15 August 2019 9:52 am Bad Juju Chart 1Spike In Google Searches For The Word Recession
A Psychological Recession?
A Psychological Recession?
President Trump’s remarks, made just a few days after the U.S. yield curve inverted, were no doubt meant to deflect attention away from the trade war, while providing cover for any economic weakness that might occur on his watch. But does the larger point still stand? Google searches for the word “recession” have spiked recently, even though underlying U.S. growth has remained robust (Chart 1). Could rising angst induce an actual recession? Theoretically, the answer is yes. A sudden drop in confidence can generate a self-fulfilling cycle where rising pessimism leads to less private-sector spending, higher unemployment, lower corporate profits, weaker stock prices, and ultimately, even deeper pessimism. Two things make such a vicious cycle more probable in the current environment. First, the value of risk assets is quite high in relation to GDP in many economies (Chart 2). This means that any pullback in equity prices or jump in credit spreads will have an outsized impact on financial conditions. Chart 2The Total Market Value Of Risk Assets Is Elevated
The Total Market Value Of Risk Assets Is Elevated
The Total Market Value Of Risk Assets Is Elevated
Chart 3Not Much Scope To Cut Rates
Not Much Scope To Cut Rates
Not Much Scope To Cut Rates
Second, policymakers are currently more constrained in their ability to react to adverse shocks, such as an intensification of the trade war, than in the past. Interest rates in Europe and Japan are already at zero or in negative territory (Chart 3). Even in the U.S., the zero-lower bound constraint – though squishier than once believed – remains a formidable obstacle. Chart 4 shows that the Federal Reserve has cut rates by over five percentage points, on average, during past recessions. It would be impossible to cut rates by that much this time around if the U.S. economy were to experience a major downturn. Chart 4The Fed Is Worried About The Zero Bound
The Fed Is Worried About The Zero Bound
The Fed Is Worried About The Zero Bound
Fiscal stimulus could help buttress growth. However, both political and economic considerations are likely to limit the policy response. While China is stimulating its economy, concerns about excessively high debt levels have caused the authorities to adopt a reactive, tentative approach. Japan is set to raise the consumption tax on October 1st. Although a variety of offsetting measures will mitigate the impact on the Japanese economy, the net effect will still be a tightening of fiscal policy. Germany has mused over launching its own Green New Deal, but so far there has been a lot more talk than action. President Trump floated the idea of cutting payroll taxes, only to abandon it once it became clear that the Democrats were unwilling to go along. On The Positive Side Despite these clear risks, we are inclined to maintain our fairly sanguine 12-to-18 month global macro view. There are a number of reasons for this: First, the weakness in global manufacturing over the past 18 months has not infected the much larger service sector (Chart 5). Even in Germany, with its large manufacturing base, the service sector PMI remains above 50, and is actually higher than it was late last year. This suggests that the latest global slowdown is more akin to the 2015-16 episode than the 2007-08 or 2000-01 downturns. Chart 5AThe Service Sector Has Softened Much Less Than Manufacturing (I)
The Service Sector Has Softened Much Less Than Manufacturing (I)
The Service Sector Has Softened Much Less Than Manufacturing (I)
Chart 5BThe Service Sector Has Softened Much Less Than Manufacturing (II)
The Service Sector Has Softened Much Less Than Manufacturing (II)
The Service Sector Has Softened Much Less Than Manufacturing (II)
Second, manufacturing activity should benefit from a turn in the inventory cycle over the remainder of the year. A slower pace of inventory accumulation shaved 90 basis points off of U.S. growth in the second quarter and is set to knock another 40 basis points from growth in the third quarter, according to the Atlanta Fed GDPNow model. Excluding inventories, U.S. GDP growth would have been 3% in Q2 and is tracking at 2.7% in Q3 – a fairly healthy pace given the weak global backdrop (Chart 6). Chart 6The U.S. Economy Is Still Holding Up Well
A Psychological Recession?
A Psychological Recession?
Outside the U.S., inventories are making a negative contribution to growth (Chart 7). In addition to the official data, this can be seen in the commentary accompanying the Markit manufacturing surveys, which suggest that many firms are liquidating inventories (Box 1). Falling inventory levels imply that sales are outstripping production, a state of affairs that cannot persist indefinitely. Third, and related to the point above, the automobile sector has been the key driver of the global manufacturing slowdown. This is in contrast to 2015-16, when the main culprit was declining energy capex. According to Wards, global vehicle production is down about 10% from year-ago levels, by far the biggest drop since the Great Recession (Chart 8). The drop in automobile production helps explain why the German economy has taken it on the chin recently. Chart 7Inventories Are Making A Negative Contribution To Growth
Inventories Are Making A Negative Contribution To Growth
Inventories Are Making A Negative Contribution To Growth
Chart 8Auto Sector: The Culprit Behind The Manufacturing Slowdown
Auto Sector: The Culprit Behind The Manufacturing Slowdown
Auto Sector: The Culprit Behind The Manufacturing Slowdown
Importantly, motor vehicle production growth has fallen more than sales growth, implying that inventory levels are coming down. Despite secular shifts in automobile ownership preferences, there is still plenty of upside to automobile usage. Per capita automobile ownership in China is only one-fifth of what it is in the United States, and one-fourth of what it is in Japan (Chart 9). This suggests that the recent drop in Chinese auto sales will be reversed. As automobile output begins to recover later this year, so too will global manufacturing. Investors should consider going long automobile makers. Chart 10 shows that the All-Country World MSCI automobiles index is trading near its lows on both a forward P/E and price-to-book basis, and sports a juicy dividend yield of nearly 4%.1 Chart 9The Automobile Ownership Rate Is Still Quite Low In China
The Automobile Ownership Rate Is Still Quite Low In China
The Automobile Ownership Rate Is Still Quite Low In China
Chart 10Auto Stocks Are A Compelling Buy
A Psychological Recession?
A Psychological Recession?
Fourth, our research has shown that globally, the neutral rate of interest is generally higher than widely believed. This means that monetary policy is currently stimulative, and will become even more accommodative as the Fed and a number of other central banks continue to cut rates. Remember that unemployment rates have been trending lower since the Great Recession and have continued falling even during the latest slowdown, implying that GDP growth has remained above trend (Chart 11). As diminished labor market slack causes inflation to rebound from today’s depressed levels, real policy rates will decline, leading to more spending through the economy. Chart 11Unemployment Rates Keep Trending Lower
Unemployment Rates Keep Trending Lower
Unemployment Rates Keep Trending Lower
The Trade War Remains The Biggest Risk The points discussed above will not matter much if the trade war spirals out of control. It is impossible to know what will happen for sure, but we can deduce the likely course of action based on the incentives that both sides face. President Trump has shown a clear tendency in recent weeks to try to de-escalate trade tensions whenever the stock market drops. This is not surprising: Despite his efforts to deflect blame for any selloff on others, he knows full well that many voters will blame him for losses in their 401(k) accounts and for slower domestic growth and rising unemployment. What about the Chinese? An increasing number of pundits have warmed up to the idea that China is more than willing to let the global economy crash if this means that Trump won’t be re-elected. If this is China’s true intention, the Chinese will resist making any deal, and could even try to escalate tensions as the U.S. election approaches. It is an intriguing thesis. However, it is not particularly plausible. U.S. goods exports to China account for 0.5% of U.S. GDP, while Chinese exports to the U.S. account for 3.4% of Chinese GDP. Total manufacturing value-added represents 29% of Chinese GDP, compared to 11% for the United States. There is no way that China could torpedo the U.S. economy without greatly hurting itself first. Any effort by China to undermine Trump’s re-election prospects would invite extreme retaliatory actions, including the invocation of the War Powers Act, which would make it onerous for U.S. companies to continue operating in China. Even if Trump loses the election, he could still wreak a lot of havoc on China during the time he has left in office. Moreover, as Matt Gertken, BCA’s Chief Geopolitical Strategist, has stressed, if Trump were to feel that he could not run for re-election on a strong economy, he would try to position himself as a “War President,” hoping that Americans rally around the flag. That would be a dangerous outcome for China. Chart 12Would China Really Be Better Off Negotiating With A Democrat As President?
Would China Really Be Better Off Negotiating With A Democrat As President?
Would China Really Be Better Off Negotiating With A Democrat As President?
In any case, it is not clear whether China would be better off with a Democrat as president. The popular betting site PredictIt currently gives Elizabeth Warren a 34% chance of winning, followed by Joe Biden with 26%, and Bernie Sanders with 15% (Chart 12). This means that two far-left candidates with protectionist leanings, who would stress environmental protection and human rights in their negotiations with China, have nearly twice as much support as the former Vice President. All this suggests that China has an incentive to de-escalate the trade war. Given that Trump also has an incentive to put the trade war on hiatus, some sort of détente between the U.S. and China, as well as between the U.S. and other players such as the EU, is more likely than not. Investment Conclusions Provided the trade war does not spiral out of control, it is very likely that global equities will outperform bonds over the next 12 months. Since it might take a few more months for the data on global growth to improve, equities will remain in a choppy range in the near term, before moving higher later this year. As we discussed last week, the equity risk premium is quite high in the U.S., and even higher abroad, where valuations are generally cheaper and interest rates are lower (Chart 13).2 Chart 13AEquity Risk Premia Remain Quite High (I)
Equity Risk Premia Remain Quite High (I)
Equity Risk Premia Remain Quite High (I)
Chart 13BEquity Risk Premia Remain Quite High (II)
Equity Risk Premia Remain Quite High (II)
Equity Risk Premia Remain Quite High (II)
The U.S. dollar is a countercyclical currency (Chart 14). If global growth picks up later this year, the greenback should begin to weaken. European and emerging market stocks have typically outperformed the global benchmark in an environment of rising global growth and a weakening dollar (Chart 15). We expect to upgrade EM and European equities – along with more cyclical sectors of the stock market such as industrials, materials, and energy – later this year. Chart 14The U.S. Dollar Is A Countercyclical Currency
The U.S. Dollar Is A Countercyclical Currency
The U.S. Dollar Is A Countercyclical Currency
Chart 15EM And Euro Area Equities Usually Outperform When Global Growth Improves
EM And Euro Area Equities Usually Outperform When Global Growth Improves
EM And Euro Area Equities Usually Outperform When Global Growth Improves
Thanks to the dovish shift by central banks around the world, government bond yields are unlikely to return to their 2018 highs anytime soon. Nevertheless, stronger economic growth should lift long-term yields at the margin, causing yield curves to steepen (Chart 16). Steeper yield curves will benefit beleaguered bank stocks. Chart 16Stronger Economic Growth Should Lift Long-Term Bond Yields, Causing Yield Curves To Steepen
Stronger Economic Growth Should Lift Long-Term Bond Yields, Causing Yield Curves To Steepen
Stronger Economic Growth Should Lift Long-Term Bond Yields, Causing Yield Curves To Steepen
Finally, a word on gold: We still like gold as a long-term investment. However, the combination of higher bond yields and diminished trade tensions could cause bullion to sell off in the near term. As such, we are closing our tactical long gold trade for a gain of 20.5%. Peter Berezin, Chief Global Strategist Global Investment Strategy peterb@bcaresearch.com Box 1 Evidence of Inventory Liquidation In The Manufacturing Sector
A Psychological Recession?
A Psychological Recession?
Footnotes 1 The top ten constituents of the MSCI ACWI Automobiles Index are Toyota (22.6%), General Motors (7.8%), Daimler (7.3%), Honda Motor (6.2%), Ford Motor (5.7%), Tesla (4.8%), Volkswagen (4.8%), BMW (3.8%), Ferrari (3.0%), Hyundai Motor (2.4%). 2 Please see Global Investment Strategy Special Report, “TINA To The Rescue?” dated August 23, 2019. Strategy & Market Trends MacroQuant Model And Current Subjective Scores
A Psychological Recession?
A Psychological Recession?
Tactical Trades Strategic Recommendations Closed Trades
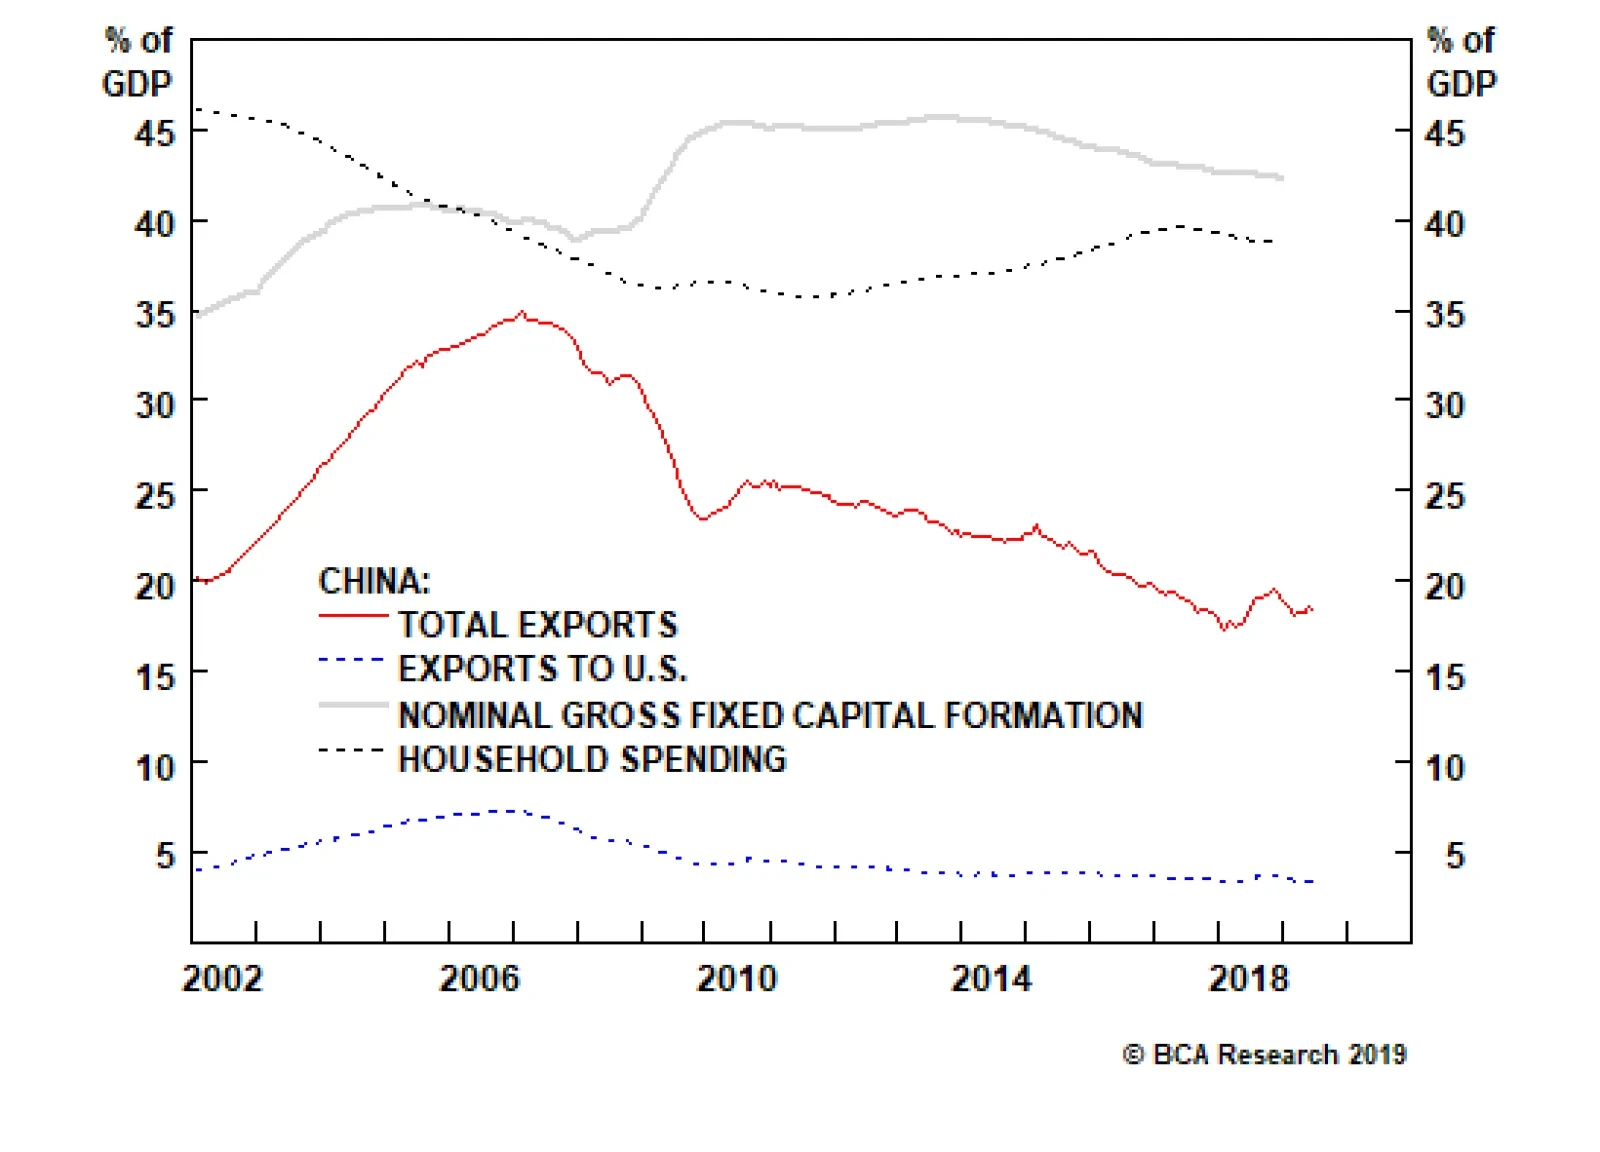
If and when deleveraging does transpire in China, the household income growth rate will decelerate, resulting in weaker spending growth. It will be impossible for the mainland economy to undertake even mild deleveraging and simultaneously accelerate household…
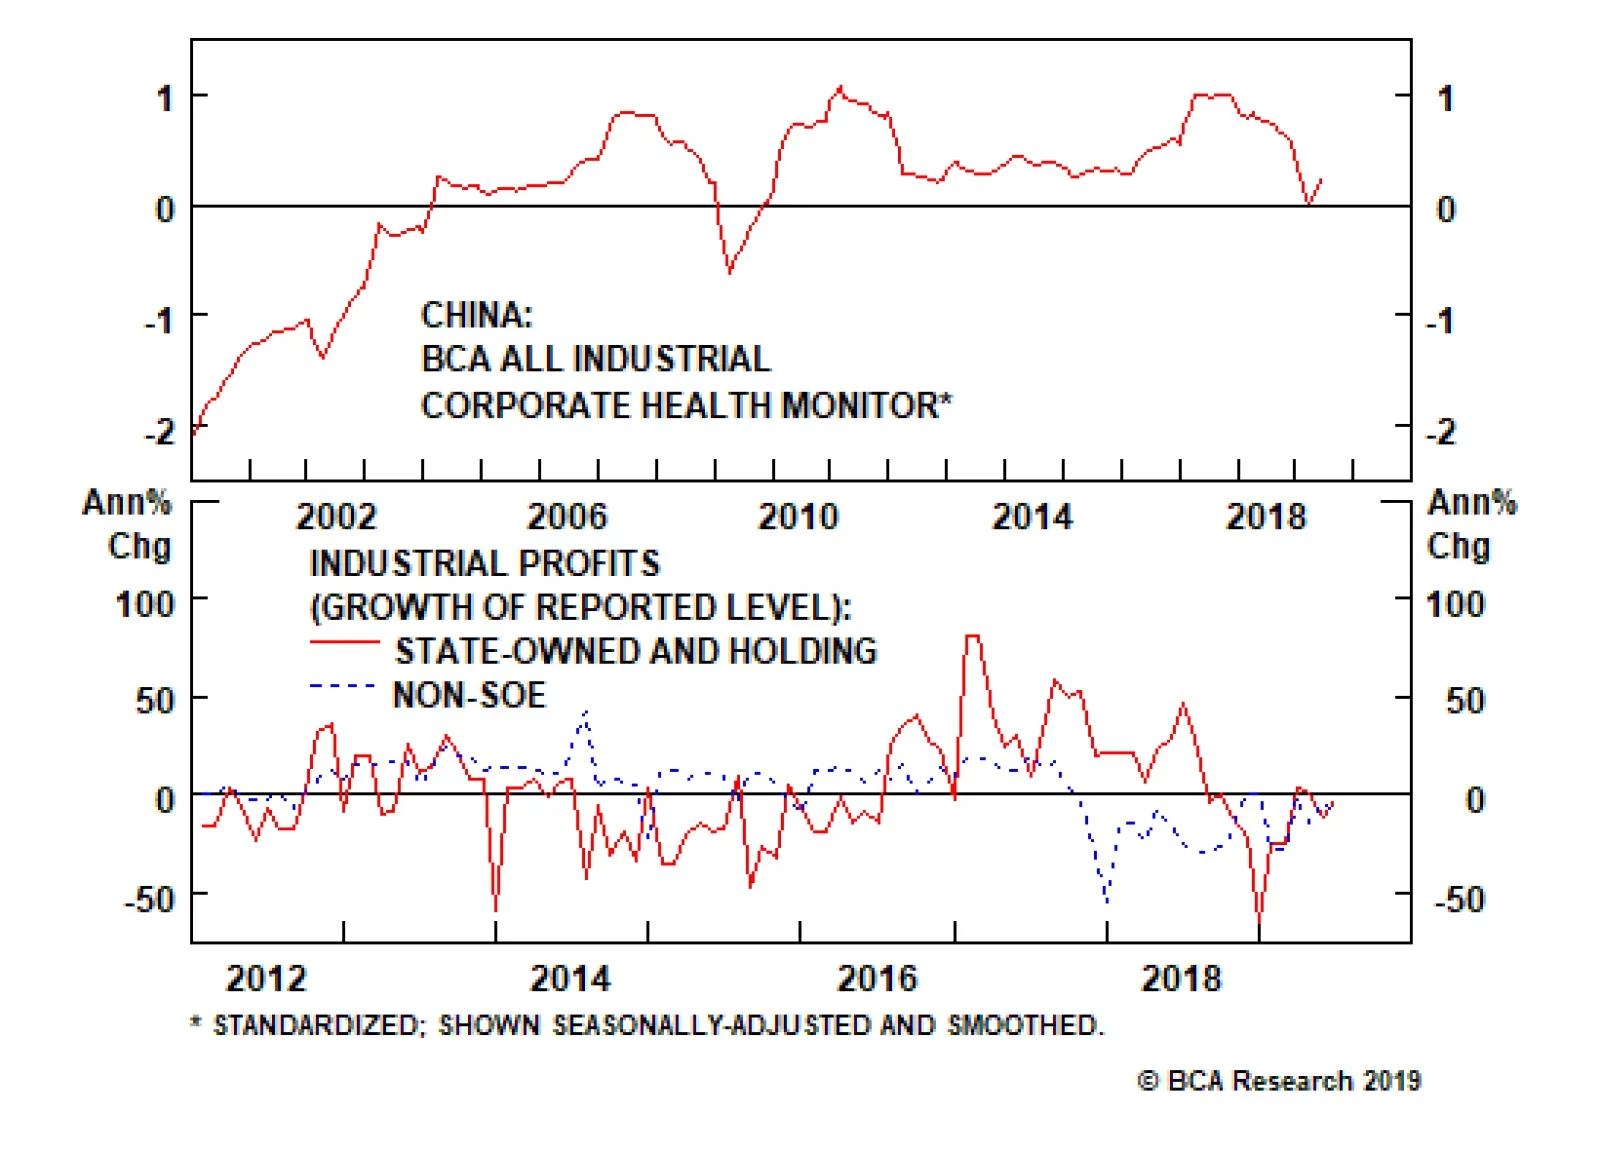
The deterioration in China’s profit growth and corporate health has the following implications: The deceleration in profit growth has caused a meaningful deterioration in corporate health, even if our Corporate Health Monitor (CHM) is not as depressed…
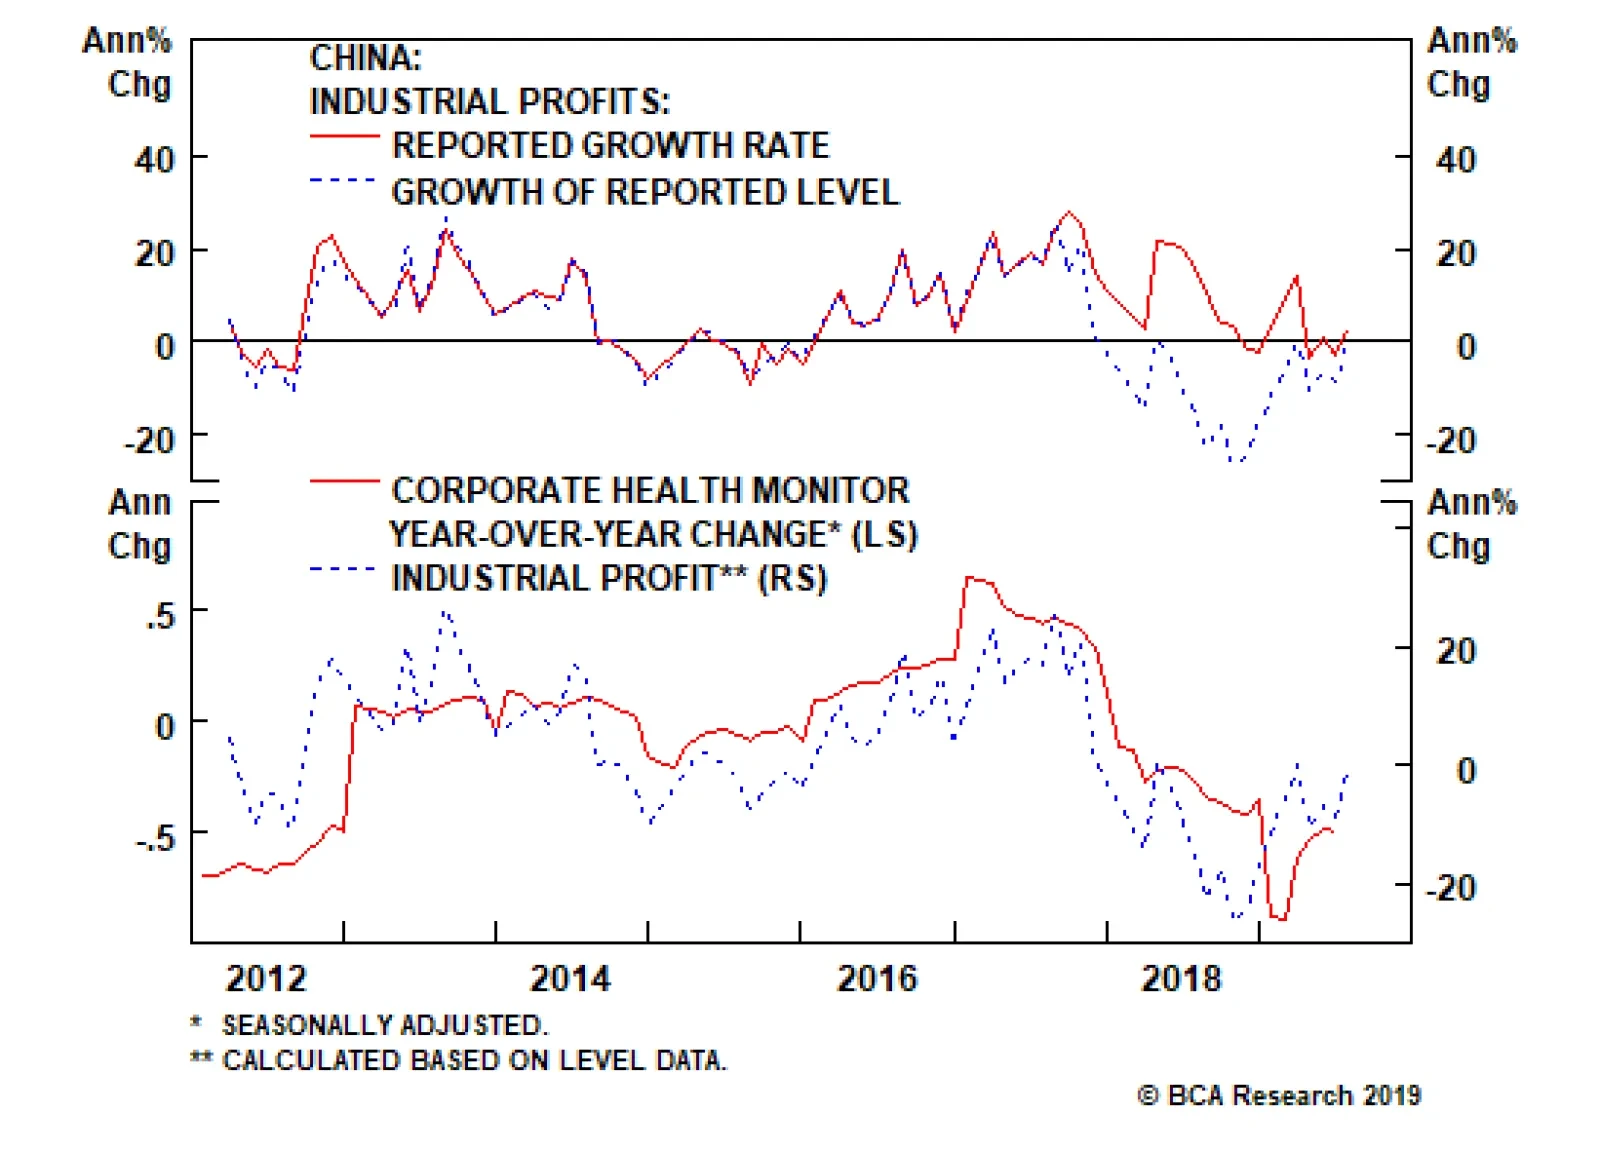
According to the official reported growth rate, Chinese industrial profit growth ticked back up into positive territory in July, after having fallen into modestly negative territory earlier this year. However, market participants have increasingly noted the…