China

Dear Client, Credit in China has expanded at an exponential pace, with the country’s debt-to-GDP ratio climbing from 143% to more than 250% over the last decade. The speed and scale of China’s debt surge dwarfs Japan and the U.S.’ respective credit binges in the 1980’s and 2000’s, each of which ultimately led to financial market meltdowns. Why should China’s experience be any different? Given that China has pursued a different economic model whereby the banking sector is largely state-sponsored and the currency is tightly managed by the central bank, the answer to this pressing question for global markets is the subject of spirited debate at BCA and within the investment community at large. Clients are already aware that my colleagues, Peter Berezin and Arthur Budaghyan, disagree on the macro and market ramifications of China’s decade-long credit boom. The aim of this report is to provide visibility on the root sources of the view divergence, not to reconcile the gaps. We hope these insights will help shape your own conviction about this important topic. Caroline Miller Global Strategy Feature Caroline: Arthur, your cautious outlook towards emerging markets in general and China’s prospects in particular stems from your belief that China’s economy is dangerously addicted to credit as a growth driver. Please explain why you dismiss the more sanguine view that China’s elevated debt burden is a function of an equally unusually high household savings rate. Arthur: It is simple: When people use the word “savings,” they typically and intuitively refer to bank deposits or securities investments; but this is incorrect. Chart 1 (Arthur)No Empirical Evidence That Deposits = 'Savings'
No Empirical Evidence That Deposits = 'Savings'
No Empirical Evidence That Deposits = 'Savings'
Money supply/deposits in the banking system have no relationship with the savings rate of a nation in general or households in particular (Chart 1). When households save, they do not change the amount of money supply and deposits. Hence, households’ decision to save neither alters liquidity in the banking system nor helps banks to originate loans. In fact, banks do not intermediate deposits into loans or savings into credit.1 The terms “savings” in economics does not denote an increase in the stock of money and deposits. The term “savings” in economics means the amount of goods and services produced but not consumed. When an economy produces a steel bar, it is registered as national “savings.” We cannot consume (say, eat or expense) a steel bar. Therefore, once a steel bar or any equipment is produced, economic statistics will count it as “savings.” Besides, the sole utilization of a steel bar is in capital goods and construction, and hence, it cannot be consumed. Once a steel bar is produced, both national savings and investment will rise. That is how the “savings” = “investment” identity is derived. Chart 2 (Arthur)Chinese Households Are More Leveraged Than U.S. Ones
Chinese Households Are More Leveraged Than U.S. Ones
Chinese Households Are More Leveraged Than U.S. Ones
It would avoid confusion and help everyone if economists were to call it “excess production” not “excess savings.” Banks do not need “excess production” – i.e., national “savings” – to create loans. Critically, the enormous amount of bank deposits in China is not due to household “savings” but is originated by banks “out of thin air.” In fact, Chinese households are now more leveraged than U.S. ones (Chart 2).
Chart 3
The surge of credit and money supply in China during the past 10 years has been due to animal spirits running wild among lenders and borrowers on the mainland, not its households’ “savings.” In short, the root of China’s credit bubble is not any different from Japan’s (in the 1980s), or the U.S.’ (in the 2000s) and so on. Peter: Yes, banks can create deposits “out of thin air,” as Arthur says. However, people must be willing to hold those deposits. The amount of deposits that households and businesses wish to hold reflects many things, including the interest rate paid on deposits and the overall wealth of the society. The interest rate is a function of savings. The more people save, the lower interest rates will be. And the lower interest rates are, the more demand for credit there will be (Chart 3). It’s like asking what determines how many apples are consumed. Is it how many apple trees farmers want to plant or how many apples people want to eat? The answer is both. Prices adjust so that supply equals demand. How about national wealth? To a large extent, wealth represents the accumulation of tangible capital – factories, plant and machinery, homes and office buildings: the sort of stuff that banks can use as collateral for lending. And what determines how much tangible capital a country possesses? The answer is past savings, of the exact sort Arthur is referring to: the excess of production over consumption. So this form of “economic” savings also plays an important indirect role in determining the level of bank deposits. Chart 4 (Peter)China: From Exporting Savings To Investing Domestically And Building Up Debt
China: From Exporting Savings To Investing Domestically And Building Up Debt
China: From Exporting Savings To Investing Domestically And Building Up Debt
I think the main problem with Arthur’s argument is that he is observing an accounting identity, which is that total bank assets (mostly loans) must equal liabilities (mostly deposits and capital) in equilibrium, without fully appreciating the economic forces – savings being one of them – that produce this equilibrium. In any case, the whole question of whether deposits create savings or savings create deposits misses the point. China’s fundamental problem is that it does not consume enough of what it produces. In the days when China had a massive current account surplus, it could export its excess savings abroad (Chart 4). It can’t do that anymore, so the government has consciously chosen to spur investment spending in order to prop up employment. Since a lot of investment spending is financed through credit, debt levels have risen. It really is just that simple. Arthur: First, neither the stock nor the flow of credit and deposits has any relevance to (1) the economic term “savings;” (2) a country’s capital stock; or (3) national wealth, contrary to what Peter claims. China’s broad money supply (M2) now stands at 190 trillion yuan, equivalent to US$28 trillion (Chart 5, top panel). It is equal to the size of broad money supply in the U.S. and the euro area combined (US$14 trillion each). Yet, China’s nominal GDP is only two-thirds the size of the U.S. Does the level of China’s wealth and capital stock justify it having broad money supply (US$28 trillion) equivalent to the U.S. and the euro area combined? Chart 5 (Arthur)“Helicopter” Money In China
“Helicopter” Money In China
“Helicopter” Money In China
Second, are Chinese households and companies willing to hold all RMB deposits that banks have created “out of thin air”? The answer: not really. Without capital controls, a notable portion of these deposits would have rushed into the foreign exchange markets and caused currency depreciation. Another sign of growing reluctance to hold the yuan is that households have been swapping their RMB deposits for real assets (property) at astronomical valuations. There is a bubble in China but people are looking for reasons to justify why it is different this time. Caroline: OK, let’s get away from the term “savings,” and agree that China continues to generate a chronic surplus of production of goods and services relative to consumption, and that how China chooses to intermediate that surplus is the most market-relevant issue. Arthur, you have used the terms “money bubble” and “helicopter money” in relation to China. This implies that banks are unconstrained in their ability to make loans. Just because savings don’t equal deposits, and banks can create deposits when they make loans doesn’t mean there is no relationship between the flow of credit and the stock of deposits. Arthur: Money supply and deposits expand only when banks originate a loan or buy an asset from a non-bank. In short, both credit and money/deposits are created by commercial banks “out of thin air.” This is true for any country.2 Consider a loan transaction by a German commercial bank. When it grants a €100 loan to a borrower, two accounting entries occur on its balance sheet. On the assets side, the amount of loans, and therefore total assets, increases by €100. Simultaneously, on the liabilities side, this accounting entry creates €100 of new deposits “out of thin air” (Figure 1). Hence, new purchasing power of €100 has been created via a simple accounting entry, which otherwise would not exist.
Chart
Critically, no one needed to save for this loan and money to be originated. The bank does not transfer someone else’s deposits to the borrower; it creates a new deposit when it lends. Banks also create deposits/money “out of thin air” when they buy securities from non-banks. In China, fiscal stimulus is largely financed by commercial banks – banks purchase more than 80% of government-issued bonds. This also leads to money creation. In short, when banks originate too much credit – as they have in China – they generate a money bubble. The money bubble is the mirror image of a credit bubble. Chinese banks have created 141 trillion yuan (US$21 trillion) of new money since 2009, compared with $8.25 trillion created in the U.S., euro area, and Japan combined over the same period (Chart 5, bottom panel). This is why I refer to it as “helicopter” money. Caroline: If banks need capital and liquidity to make loans, and deposits are one potential source of funds, don't these capital and liquidity constraints drive banks’ willingness and ability to lend, creating a link between the two variables? Arthur: Let me explain how mainland banks were able to circumvent those regulatory lending constraints. In 2009, they expanded their credit assets by about 30%. Even though a non-trivial portion of those loans were not paid back, banks did not recognize NPLs and instead booked large profits. By retaining a portion of those earnings, they boosted their equity, say, by 20%. As a result, the next year they were able to expand their credit assets by another 20% and so on. If banks lend and do not recognize bad loans, they can increase their equity and continue lending. With respect to liquidity, deposits are not liquidity for banks; excess reserves at the central bank are true liquidity for them. The reason why banks need to attract deposits is not to appropriate the deposits themselves, but to gain access to the excess reserves that come with them. When a person shifts her deposit from Bank A to Bank B, the former transfers a similar amount of excess reserves (liquidity) to the latter. When expanding their credit assets aggressively, banks can: (1) create more loans per one unit of excess reserves/liquidity, i.e., expand the money multiplier; and (2) borrow excess reserves/liquidity from the central bank or other banks. Chinese banks have used both channels to expand their balance sheets over the past 10 years (Chart 6). Chart 6 (Arthur)Broad Money Can Expand Without Growing Banks' Excess Reserves At The Central Bank
Broad Money Can Expand Without Growing Banks' Excess Reserves At The Central Bank
Broad Money Can Expand Without Growing Banks' Excess Reserves At The Central Bank
Crucially, commercial banks create deposits, but they cannot create excess reserves (liquidity).3 The latter are issued only by central banks “out of thin air.” So, neither deposits nor excess reserves have any relevance to household or national “savings.” Caroline: Peter, Arthur argues that Chinese credit policy has been unconstrained by the traditional metrics of capital adequacy that prevail in capitalist, free-market economies. In other words, there is no connection between the availability of funds to lend via deposits in the banking system, and the pace of credit creation. Rather, the central bank has controlled the terms and volume of lending via regulation and fiat reserve provisioning. You’ve argued that credit creation has served the greater good of propping up employment via investment spending. Moreover, you posit that countries with a surplus of production over consumption will invariably experience high levels of credit creation. Our colleague, Martin Barnes, has analyzed national savings rates (as a proxy for over-production) relative to debt-GDP ratios in other countries. The relationship doesn’t look that strong elsewhere (Chart 7). Please elaborate on why you see credit growth as an inevitable policy response to the dearth of aggregate demand we observe in China?
Chart 7
Peter: I would not say that countries with a surplus of production over consumption will invariably experience high levels of credit creation. For example, if most business investment is financed through retained earnings, you can have a lot of investment with little new debt. Debt can also result from activities not directly linked to the intermediation of savings. For instance, if you take out a mortgage to buy some land, your consumption and savings need not change, even though debt will be created. I think Arthur and I agree on this point. Thus, I am not saying that debt is always and everywhere the result of savings. I am simply pushing back against Arthur’s extremist position that debt never has anything to do with savings. Caroline: So what determines the level of debt in an economy in your view, Peter? Peter: In general, debt levels will rise if there are large imbalances between income and spending within society and/or if there are significant differences in the mix of assets people wish to hold. Think about the U.S. in the pre-financial crisis period. First, there was a surge in income inequality beginning in the early 1980s. For all intents and purposes, rich households with excess savings ended up lending their surplus income to poor households struggling to pay their bills. Overall savings did not rise, but debt levels still increased. That’s one reason why Martin’s chart doesn’t show a strong correlation between the aggregate savings rate and debt-to-GDP. Sometimes you need to look beneath the aggregate numbers to see the savings intermediation taking place. Unlike in the U.S., even poor Chinese households are net savers (Chart 8). Thus, the aggregate savings rate in China is very high4 (Chart 9). Much of these savings are funnelled to finance investment in the corporate and public sectors. This fuels debt growth.
Chart 8
Chart 9 (Peter)Chinese Households Have More Savings Than The U.S., Europe And Japan Combined
Chinese Household Savings Are More Than The U.S., Europe And Japan Combined
Chinese Household Savings Are More Than The U.S., Europe And Japan Combined
The second thing that happened in the U.S. starting in 2000 was a massive housing boom. If you bought a second home with credit, you ended up with one more asset (the house) but one more liability (the mortgage). The person who sold you the home ended up losing one asset (the house) but gaining another asset (a bigger bank deposit). The net result was both higher debt and higher bank deposits. Lending to finance asset purchases has also been a big source of debt growth in China, as it was in the U.S. before the crisis. The U.S. mortgage boom ended in tears, and so the question that we should be asking is whether the Chinese debt boom will end the same way. Arthur: We agreed not to use the term “savings,” yet Peter again refers to “savings” being funnelled into credit. As I explained above, banks do not funnel “savings” (i.e., “excess production”) into credit. China, Japan, and Germany have high “savings” rates because they produce a lot of steel, chemicals, autos, and machinery that literally cannot be consumed and, thus, are recorded as “savings.” The U.S. produces too many services that are consumed/expensed and, hence, not recorded as “savings.” That is why the U.S. has a lower “savings” rate. Chart 10 (Arthur)The Myth Of Deficient Demand In China
The Myth Of Deficient Demand In China
The Myth Of Deficient Demand In China
Economic textbook discussions on “savings” and “investment” are relevant for a barter economy where banks do not exist. When this framework is applied to modern economies with banks, it generates a lot of confusion.5 Caroline: OK, so Peter argues that an imbalance between spending and income CAN be a marker for high debt levels. Arthur, please explain why you see no relationship between China’s chronic shortfall in demand and authorities’ explicit decision to support growth via credit creation. Arthur: First, China does not have deficient demand – consumer spending and capital expenditures have been growing at 10% and 9.4%, respectively, in real terms annually compounded for the past 10 years (Chart 10). The mainland economy has been suffering from excess production, not a lack of demand. China has invested a lot (Chart 11) and ended up with too much capacity to produce steel, cement, chemicals and other materials as well as machinery and industrial goods. So, China has an excess production of goods relative to firms’ and households’ underlying demand. In a market economy, these producers would become non-profitable, halt their investments, and shut down some capacity. Chart 11 (Arthur)China Has Been Over-Investing On An Unprecedented Scale
China Has Been Over-Investing On An Unprecedented Scale
China Has Been Over-Investing On An Unprecedented Scale
In China, to keep the producers of these unwanted goods operating, the government has allowed and encouraged banks to originate loans creating new purchasing power literally “out of thin air” to purchase these goods. This has created a credit/money bubble. In a socialist system, banks do not ask debtors to repay loans and government officials are heavily involved in resource and capital allocation. China’s credit system and a growing chunk of its economy have been operating like a typical socialist system. Socialism leads to lower productivity growth for well-known reasons. With labor force growth set to turn negative, productivity is going to be the sole source of China’s potential growth rate. If the nation continues expanding this money/credit bubble to prop up zombie enterprises, its potential growth rate will fall considerably. As the potential growth rate drops, recurring stimulus will create nominal but not real growth. In short, the outcome will be stagflation. Caroline: The theoretical macro frameworks that you have both outlined make for interesting thought experiments, and spirited intellectual debate. However, investors are most concerned about the sustainability of China’s explosive credit growth, implications for the country’s growth rate, and the return on invested capital. Arthur, given your perspective on how Chinese credit policy has been designed and implemented, please outline the contours of how and when you see the music stopping, and the debt mountain crumbling. Arthur: Not every credit bubble will burst like the U.S. one did in 2008. For example, in the case of the Japanese credit bubble, there was no acute crisis. The bubble deflated gradually for about 20 years. In the cases of the U.S. (2008), Japan (1990), the euro area (2008-2014), Spain (2008-2014) and every other credit bubble, a common adjustment was a contraction in bank loans in nominal terms (Chart 12). Chart 12 (Arthur)All Credit Booms Have Been Followed By Contracting Bank Loans (I)
All Credit Booms Have Been Followed By Contracting Bank Loans
All Credit Booms Have Been Followed By Contracting Bank Loans
Chart 12 (Arthur)All Credit Booms Have Been Followed By Contracting Bank Loans (II)
All Credit Booms Have Been Followed By Contracting Bank Loans
All Credit Booms Have Been Followed By Contracting Bank Loans
Why do banks stop lending? The reason is that banks’ shareholders absorb the largest losses from credit booms. Given that banks are levered at least 20-to-1 at the peak of a typical credit boom, every $1 of non-performing loans leads to a $20 drop in their equity value. Bank shareholders halt the flow of credit to protect their wealth. Chart 13 (Arthur)China: Deleveraging Has Not Yet Begun
China: Deleveraging Has Not Yet Begun
China: Deleveraging Has Not Yet Begun
Chart 14
In fact, credit in China is still growing at a double-digit rate, above nominal GDP growth (Chart 13). Hence, aggregate deleveraging in China has not yet begun. If banks do not curtail credit origination, the music will not stop. However, uninterrupted credit growth happens only in a socialist system where banks subsidize the economy at the expense of their shareholders. But even then, there is no free lunch. Credit origination by banks also expands the money supply as discussed above. An expanding money bubble will heighten devaluation pressure on the yuan in the long run. The enormous amount of money supply/deposits – the money bubble – in China is like “the sword of Damocles” hanging over the nation’s currency. Chinese households and businesses are becoming reluctant to hold this ballooning supply of local currency. Continuous “helicopter” money will only increase their desire to diversify their RMB deposits into foreign currencies and assets. Yet, there is an insufficient supply of foreign currency to accommodate this conversion. The nation’s current account surplus has almost vanished while the central bank carries US$3 trillion in foreign exchange reserve representing only 11% of the yuan deposits and cash in circulation (Chart 14). It is inconceivable that China can open its capital account in the foreseeable future. “Helicopter” money also discourages innovation and breeds capital misallocation, which reduces productivity growth. A combination of slowing productivity growth, and thus potential GDP, and strong money growth ultimately lead to stagflation – the dynamics endemic to socialist systems. Peter: Arthur’s answer implicitly assumes that private investment would increase if the government removed credit/fiscal stimulus. But where is the evidence for that? We had just established that the Chinese economy suffers from a lack of aggregate demand. Public-sector spending, to the extent that it increases employment and incomes, crowds in private-sector investment rather than crowding it out. Ask yourself what would have happened if China didn’t build that “bridge to nowhere.” Would those displaced construction workers have found more productive work elsewhere or would they have remained idle? The answer is almost certainly the latter. After all, the reason the Chinese government built the bridge in the first place was to increase employment in an economy that habitually struggles to consume enough of what is produces. Arthur talks about the “misallocation” of resources. But doesn’t an unemployed worker also represent a misallocation of resources? In my view, it certainly does – and one that is much more threatening to social stability than an underutilized bridge or road. If you understand the point above, you will also understand why Arthur’s comparison between Chinese banks and say, U.S. banks is misplaced. The Chinese government is the main shareholder in Chinese banks. The government cares more about social stability than anything else. There is no way it would let credit growth plunge. Moreover, as the main shareholder, the government has a strong incentive to raise the share price of Chinese banks. After all, it is difficult to have a reserve currency that rivals the U.S. dollar, as China aspires to have, if your largest banks trade like penny stocks. My guess is that the Chinese government will shut down a few small banks to “show” that it is concerned about moral hazard, but then turn around and allow the larger banks to sell their troubled loans to state-owned asset management companies on very favourable terms (similar to what happened in the early 2000s). Once investors get wind that this is about to happen, Chinese bank shares will rally like crazy. Caroline: Isn’t shuffling debt from one sector of the economy to another akin to a shell game? Wouldn’t rampant debt growth eventually cause investors to lose confidence in the currency? Peter: China has a problem with the composition of its debt, not with its total value. Debt is a problem when the borrower can’t or won’t repay the loan. Chart 15 (Peter)China Is On Course To Lose More Than 400 Million Workers
China On Course To Lose More Than 400 Million Workers
China On Course To Lose More Than 400 Million Workers
I completely agree that there is too much shadow bank lending in China. There is also too much borrowing by state-owned enterprises. Ideally, the Chinese government would move all this quasi-public spending onto its own balance sheet. It would significantly raise social spending to discourage precautionary household savings. It would also adopt generous pro-natal policies — free childcare, education, government paid parental leave, and the like. The fact that the Chinese working-age population is set to shrink by 400 million by the end of the century is a huge problem (Chart 15). If the central government borrowed and spent more, state-owned companies and local governments would not have to borrow or spend as much. Banks could then increase their holding of high-quality central government bonds. Debt sustainability is only a problem if the interest rate the government faces exceeds the growth rate of the economy.6 That is manifestly not the case in China (Chart 16). And why are interest rates so low in relation to growth? Because Chinese households save so much! We simply can’t ignore the role of savings in the discussion. Chart 16 (Peter)China: High Levels Of Household Savings Have Kept Interest Rates Below The Growth Rate Of The Economy
China: High Levels Of Household Savings Have Kept Interest Rates Below The Growth Rate Of The Economy
China: High Levels Of Household Savings Have Kept Interest Rates Below The Growth Rate Of The Economy
As far as the currency is concerned, if debt growth rose so much that the economy overheated and inflation soared, then yes, the yuan would plunge. But that’s not what we are talking about here. We are talking about bringing debt growth to a level that generates just enough demand to achieve something resembling full employment. No one is calling for raising debt growth beyond that point. Curbing debt growth in a demand-deficient economy, as Arthur seems to be recommending, would cause unemployment to rise. Investors would then bet that the Chinese government would try to boost net exports by engineering a currency devaluation. Capital outflows would intensify. Far from creating the conditions for a weaker yuan, fiscal/credit stimulus obviates the need for a currency depreciation. Caroline: Peter, even if we accept your argument that the counterfactual of curbing credit growth in a demand-deficient economy would be a more deflationary outcome than sustaining the government-sponsored credit growth engine, how is building bridges to nowhere a positive sum for investors? Even if this strategy maintains social stability in the interests of the CCP’s regime preservation, won’t investors eventually recoil at the retreat to socialism that Arthur outlines, reducing the appeal of holding the yuan, even if, as you both seem to agree, no apocalyptic debt crisis is at hand? In other words, isn’t two times nothing still nothing? Peter: First of all, many of these infrastructure projects may turn out to be quite useful down the road, pardon the pun. Per capita vehicle ownership in China is only one one-fifth of what it is in the United States, and one-fourth of what it is in Japan (Chart 17). A sparsely used expressway today may be a clogged one tomorrow. Chart 17 (Peter)The Automobile Ownership Rate Is Still Quite Low In China
The Automobile Ownership Rate Is Still Quite Low In China
The Automobile Ownership Rate Is Still Quite Low In China
Would China really be better off if it had fewer infrastructure projects and more big screen TVs? An economy where people are always buying stuff they don’t need, with money they don’t have, to impress people they don’t like, is hardly a recipe for success. I am not sure what these references to socialism are supposed to accomplish. You want to see a real retreat to socialism? Try creating millions of unemployed workers with no jobs and no hope. All sorts of pundits decried Franklin Roosevelt’s New Deal as creeping socialism. The truth is that the New Deal took the wind out of the sails of the fledgling U.S. communist movement at the time. Arthur: I believe that Peter is confusing the structural and cyclical needs for stimulus. When an economy is in a recession – banks are shrinking their balance sheets and property prices are deflating – the authorities must undertake fiscal and credit stimulus. Chart 18 (Arthur)What Will Productivity Growth Look Like If Public Officials Allocate 55%-60% Of GDP?
What Will Productivity Growth Look Like If Public Officials Allocate 55%-60% Of GDP?
What Will Productivity Growth Look Like If Public Officials Allocate 55%-60% Of GDP?
Credit and fiscal stimulus made sense in China in early 2009 when growth plunged. However, over the past 10 years, we have witnessed credit and property market booms of gigantic proportions. Does this economy warrant continuous stimulus? What will productivity growth look like if government bureaucrats continuously allocate 55-60% of GDP each year (Chart 18)? Caroline: Arthur and Peter, you can both argue with one another about the semantic economic definition of the term ‘savings’, the implications of chronic excess production (relative to consumption), and the root drivers of credit growth in China long past the expiry of every BCA client’s investment horizon. Clients benefit from understanding your distinct perspectives only to the extent that they inform your outlook for markets. Will each of you now please outline how you see high levels of credit in China’s economy impacting the following over a cyclical (6-12 month) and structural (3-5 year) horizon: Global growth Commodity prices China-geared financial assets Peter: Regardless of what one thinks about the root causes of China’s high debt levels, it seems certain to me that the Chinese are going to pick up the pace of credit/fiscal stimulus over the next six months in response to slowing growth and trade war uncertainties. If anything, the incentive to open the credit spigots this time around is greater than in the past because the Chinese government wants to have a fast-growing economy to gain leverage over trade negotiations with the U.S. Chart 19 (Peter)Stronger Chinese Credit Growth Bodes Well For Commodity Prices
Stronger Chinese Credit Growth Bodes Well For Commodity Prices
Stronger Chinese Credit Growth Bodes Well For Commodity Prices
Chart 20 (Peter)The Dollar Is A Countercyclical Currency
The Dollar Is A Countercyclical Currency
The Dollar Is A Countercyclical Currency
Stronger Chinese growth will boost growth in the rest of the world. Commodity prices will rise (Chart 19). As a counter-cyclical currency, the U.S. dollar will likely peak over the next month or so and then weaken in the back half of 2019 and into 2020 (Chart 20). The combination of stronger Chinese growth, higher commodity prices, and a weaker dollar will be manna from heaven for emerging markets. If a trade truce between China and the U.S. is reached, investors should move quickly to overweight EM equities. European stocks should also benefit. Looking further out, China’s economy will slow in absolute terms. In relative terms, however, Chinese growth will remain near the top of the global rankings. China has one of the most educated workforces in the world (Chart 21). Assuming that output-per-hour reaches South Korean levels by the middle of the century, Chinese real GDP would need to expand by about 6% per year over the next decade (Chart 22). That’s a lot of growth – growth that will eventually help China outgrow its debt burden.
Chart 21
Chart 22 (Peter)China Has More Catching Up To Do
China Has More Catching Up To Do
China Has More Catching Up To Do
Keep in mind that credit growth of 1% when the debt-to-GDP ratio is 300% yields 3% of GDP in credit stimulus, compared with only 1% of stimulus when the debt-to-GDP ratio is 100%. That does not mean that more debt is intrinsically a good thing, but it does mean that China will eventually be able to slow debt growth even if excess savings remains a problem. Structurally, Chinese and EM equities will likely outperform their developed market peers over a 3-to-5 year horizon. The P/E ratio for EM stocks is currently 4.7 percentage points below that of developed markets, which is below its long-term average (Chart 23). While EM EPS growth has lagged DM earnings growth over the past eight years, the long-term trend still favors EM (Chart 24). EM currencies will appreciate over this period, with the RMB leading the way. Chart 23 (Peter)EM Stocks: Valuations Are Attractive
EM Stocks: Valuations Are Attractive
EM Stocks: Valuations Are Attractive
Chart 24 (Peter)Earnings Growth In EM Has Outpaced That Of DM Over The Long Haul
Earnings Growth In EM Has Outpaced That Of DM Over The Long Haul
Earnings Growth In EM Has Outpaced That Of DM Over The Long Haul
Arthur: China is facing a historic choice between two scenarios. Medium- and long-term macro outcomes will impact markets differently in each case. Table 1 shows my cyclical and structural investment recommendations for each scenario. Table 1 (Arthur)Arthur’s Recommended Investment Strategy For China-Geared Financial Assets
China’s Credit Cycle: A Spirited Debate
China’s Credit Cycle: A Spirited Debate
Allowing Markets to Play A Bigger Role = Lower credit growth (deleveraging), corporate restructuring, and weaker growth (Chart 25). This is bearish for growth and financial markets in the medium term but it will make Chinese stocks and the currency structural (long-term) buys. Credit/Money Boom Persists (Socialist Put) = Secular Stagnation, Inflation and Currency Depreciation: The structural outlook is downbeat but there are mini-cycles that investors could play (Chart 26). Cyclically, China-geared financial assets still remain at risk. However, lower asset prices and more stimulus in China could put a floor under asset prices later this year. Timing these mini-cycles is critical. A buy-and-hold strategy for Chinese assets will not be appropriate in this scenario. In short, capitalism is bad but socialism is worse. I hope China will pursue the first path.
Chart 25
Chart 26
Caroline: Thank you both for clarifying your perspectives. Over a multi-year horizon, markets will render the ultimate judgement on whether China’s credit boom has represented a reckless misallocation of capital, or a rational policy response to an imbalance between domestic spending and income. In the meantime, we will monitor the complexion of Chinese stimulus and evidence of its global growth multiplier effect over the coming weeks and months. These will be the key variables to watch as we determine when and at what level to upgrade BCA’s cyclical outlook for China-geared assets. Can’t wait for that debate. Footnotes 1 For a detailed discussion of these issues, please see Emerging Markets Strategy Special Reports, “Misconceptions About China's Credit Excesses,” dated October 26, 2016 and “The True Meaning Of China's Great 'Savings' Wall,” dated December 20, 2017. 2 For a detailed discussion of these issues, please see Emerging Markets Strategy Special Reports, “Misconceptions About China's Credit Excesses,” dated October 26, 2016 and “The True Meaning Of China's Great 'Savings' Wall,” dated December 20, 2017. 3 For a detailed discussion of these issues, please see Emerging Markets Strategy Special Report, “China's Money Creation Redux And The RMB,” dated November 23, 2016. 4 For a discussion on the reasons behind China’s high savings rate, please see Global Investment Strategy Weekly Report, “China’s Savings Problem,” dated January 25, 2019. 5 For a detailed discussion of these issues, please see Emerging Markets Strategy Special Report, “Is Investment Constrained By Savings? Tales Of China And Brazil,” dated March 22, 2018. 6 For a detailed discussion of these issues, please see Global Investment Strategy Weekly Report, “Is There Really Too Much Government Debt In The World?” dated February 22, 2019 and “Chinese Debt: A Contrarian View,” dated April 19, 2019. Strategy & Market Trends MacroQuant Model And Current Subjective Scores
Image
Tactical Trades Strategic Recommendations Closed Trades

The speed and scale of China’s recent debt surge dwarfs Japan and the U.S.’ respective credit binges in the 1980’s and 2000’s, each of which ultimately led to financial market meltdowns. Why should China’s experience be any different? Clients are already aware that Peter Berezin and Arthur Budaghyan disagree on the macro and market ramifications of China’s decade-long credit boom. The aim of this report is to provide visibility on the root sources of the view divergence. To access the full report entitled, “China’s Credit Cycle: A Spirited Debate,” please click here.
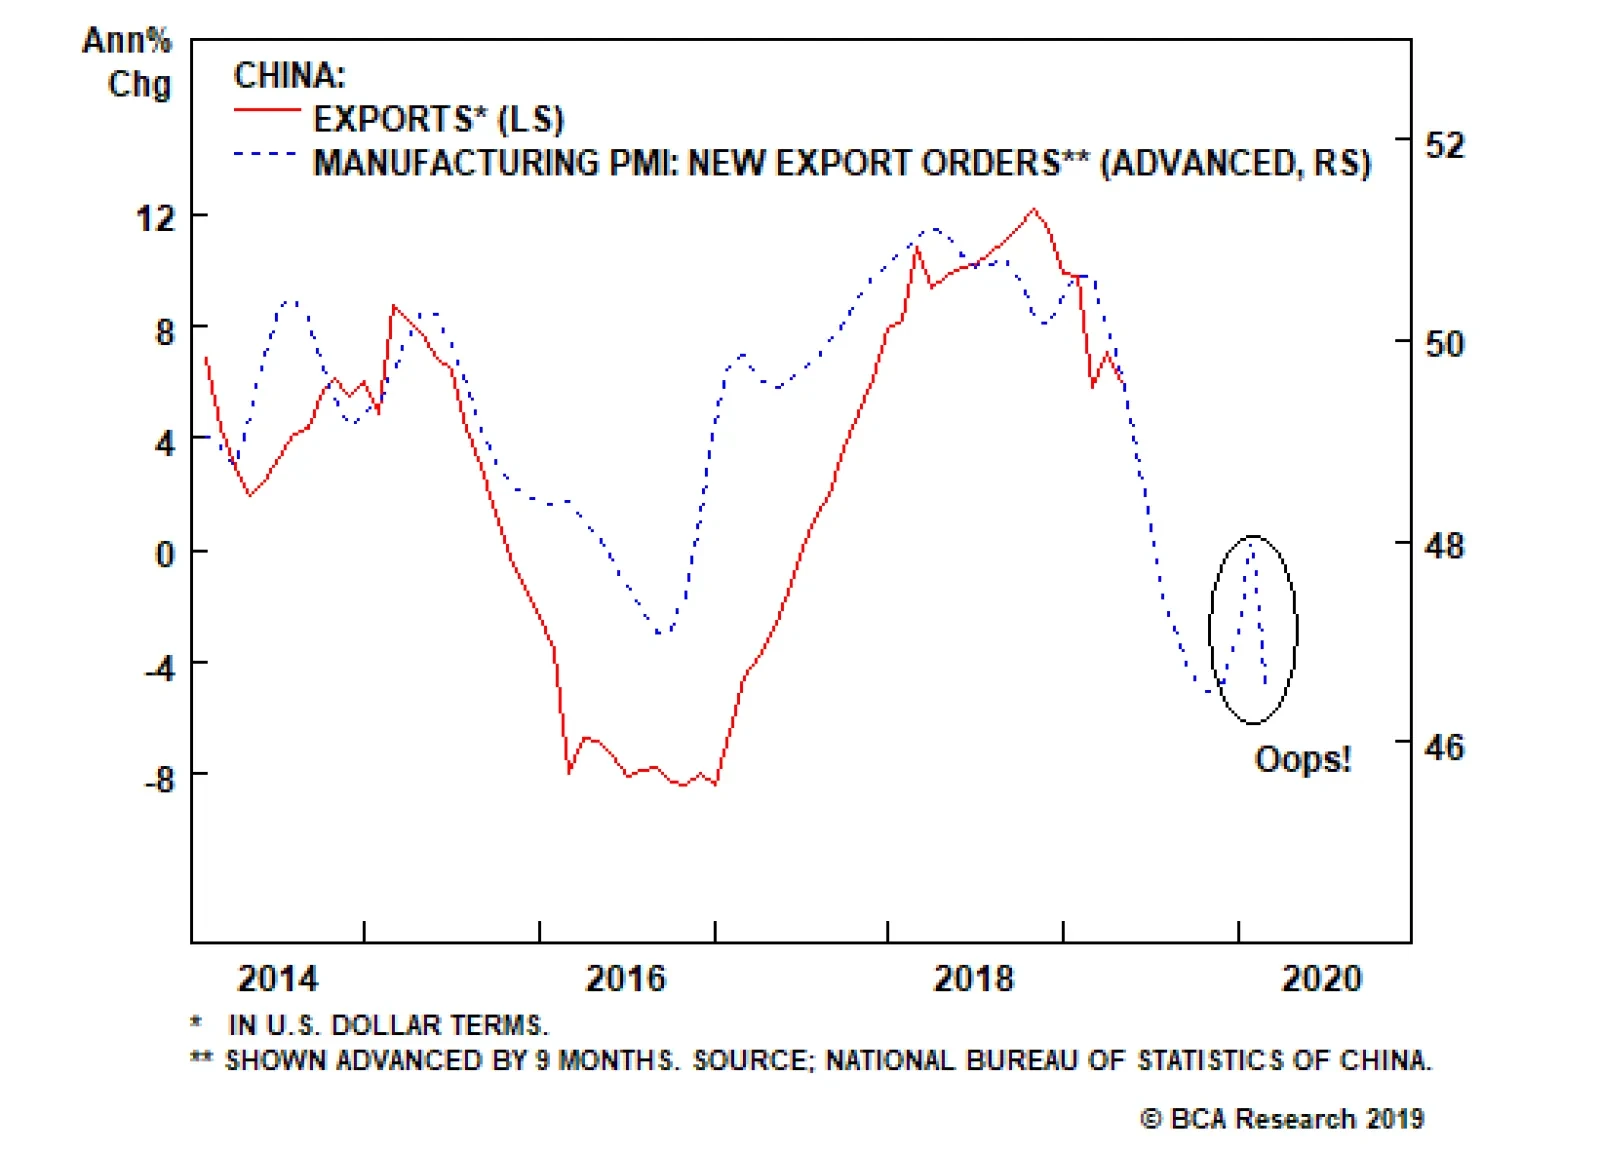
Highlights The May official PMI shows that manufacturing in China will slow over the coming year unless the recent doubling of U.S. import tariffs can be reversed and the imposition of the remaining tariffs can be avoided. The divergence between H-shares and both A-shares and the domestic fixed-income market suggests that China’s domestic financial market participants are pricing in some probability of a major reflationary response by Chinese authorities. We agree that such a response will occur over the coming 6-12 months, and would recommend that investors stay overweight Chinese equities within a global equity portfolio over that time horizon. Feature Tables 1 and 2 on pages 2 and 3 highlight key developments in China’s economy and its financial markets over the past month. On the growth front, April’s activity data provided early evidence that the trajectory of the economy was beginning to turn prior to the breakdown in U.S./China trade talks, in response to a meaningful credit improvement in Q1. The May Caixin manufacturing PMI was stable, but the official PMI fell and the experience of last year clearly shows that manufacturing in China will slow over the coming year unless the recent doubling of U.S. import tariffs can be reversed and the imposition of the remaining tariffs can be avoided. Assuming that the Trump administration follows through with its threat, investors are likely to see a repeat of last year’s perversely positive effects of tariff frontrunning on the Chinese trade data over the next few months; this should be viewed as confirmation of an impending collapse in trade activity, rather than a sign that the underlying trade situation is improving. Table 1China Macro Data Summary
China Macro And Market Review
China Macro And Market Review
Table 2China Financial Market Performance Summary
China Macro And Market Review
China Macro And Market Review
Within financial markets, the most notable development is the contrast between the relative performance of investable Chinese stocks on the one hand, and domestic equities and the Chinese fixed-income market on the other. The recent performance of investable stocks confirms that they have been driven nearly exclusively by trade war developments for the better part of the past year, whereas the somewhat better relative performance of A-shares and the calm in the government bond, corporate bond, and sovereign CDS markets suggests that China’s domestic financial market participants are pricing in some probability of a major reflationary response by Chinese authorities. We agree that such a response will occur over the coming 6-12 months, and would recommend that investors stay overweight Chinese equities within a global equity portfolio over that time horizon. In reference to Tables 1 and 2, we provide below several detailed observations concerning developments in China’s macro and financial market data: Chart 1A Strong Response From Policymakers Will Likely Offset The Coming Tariff Shock
A Strong Response From Policymakers Will Likely Offset The Coming Tariff Shock
A Strong Response From Policymakers Will Likely Offset The Coming Tariff Shock
Both Bloomberg’s and our alternative calculation of the Li Keqiang index (LKI) rose in April, albeit only fractionally in the case of the latter. Still, as we noted in last week’s report,1 the Q1 rebound in credit appears to have halted the decline in investment-relevant Chinese economic activity (Chart 1). This suggests that the trajectory of the economy was beginning to change in April prior to the breakdown in U.S./China trade talks, implying that an aggressively stimulative response from Chinese authorities to counter a full 25% tariff scenario has good odds of succeeding. This supports our cyclically overweight stance towards Chinese stocks. Our leading indicator for the LKI declined slightly in April, but remains in a very modest uptrend. The gap between accelerating credit growth and the sluggishness of our leading indicator is explained by the fact that growth in Chinese M2 and M3 has been slow to rise. A weaker-than-expected recovery in Chinese economic activity is much more likely if money growth remains weak, but we cannot reasonably envision an outcome where credit growth continues to trend higher and growth in the money supply does not meaningfully accelerate. The incoming Chinese housing data continues to provide conflicting signals. The annual change of the PBOC’s pledged supplementary lending injections declined further in April, which since 2015 has done an excellent job explaining weak housing demand. However, both floor space started and sold picked up in April (Chart 2), and house price growth remained steady despite a significant decline in the breadth of house price appreciation across 70 cities. Policymakers are likely to allow aggregate credit growth to accelerate significantly over the coming 6-12 months in order to counter the deflationary impact of a trade war with the U.S., but our sense is that policymakers will then refocus their financial stability efforts on the household sector (i.e. they will work to prevent another significant reacceleration in household debt growth). Given this, we continue to expect that housing demand will remain weak, although we will be closely watching floor space sold over the coming few months. The new export orders component of the official manufacturing PMI is signaling an external outlook that is as negative as the 2015/2016 episode. The May official manufacturing PMI fell back into contractionary territory, led by a very significant decline in the new export orders component (Chart 3). The Caixin manufacturing PMI was stable, but the outlook for manufacturing in China is clearly negative unless the recent doubling of U.S. import tariffs can be reversed and the imposition of the remaining tariffs can be avoided. Investors are likely to see a repeat of last year’s perversely positive effects of tariff frontrunning on the Chinese trade data over the next few months; this should be viewed as confirmation of an impending collapse in trade activity, rather than a sign that the underlying trade situation is improving. Chart 2Surprising Resilience In China's Housing Market (For Now)
Surprising Resilience In China's Housing Market (For Now)
Surprising Resilience In China's Housing Market (For Now)
Chart 3A Clearly Negative Outlook For Manufacturing
A Clearly Negative Outlook For Manufacturing
A Clearly Negative Outlook For Manufacturing
There has been a sharp contrast in the behavior of the Chinese investable and domestic equity markets over the past month, which in our view confirms that the former has been driven nearly exclusively by trade war developments for the better part of the past year. Chart 4 shows that the relative performance of investable stocks (versus global) has nearly fallen back to its late-October low, whereas A-shares technically remain in an uptrend despite having sold off. Some investors have attributed the relative support of A-shares to aggressive buying by the “national team”, state-related financial market participants that the government has relied on since 2015 to manage volatility in the domestic equity market. Chart 4Are A-Shares Acting More Rationally Than The Investable Market?
Are A-Shares Acting More Rationally Than The Investable Market?
Are A-Shares Acting More Rationally Than The Investable Market?
However, it is also possible that the A-share market is acting more rationally than the investable market, by focusing on the possibility of a major reflationary response to the Trump tariffs. This contrast in behavior between the investable and domestic markets was also observed pre- and post-February 15th, when the January credit data was released. Prior to this point, the A-share market was (rightly) not confirming the relative uptrend in investable stocks; following February 15th, A-shares exploded higher in response to tangible evidence that a upcycle in credit had arrived. If it is true that the A-share market is better reflecting the prospect of a reflationary response from Chinese policymakers, the relative performance trend for domestic stocks supports our decision to remain cyclically overweight Chinese stocks versus the global benchmark. Chinese utilities and consumer staples have outperformed in both the investable and domestic equity markets over the past month, which is not surprising given that these sectors typically outperform during risk-off phases. Within the investable market, the sharp underperformance of the BAT (Baidu, Alibaba, and Tencent) stocks has been the most interesting (Chart 5). To the extent that the selloff in BAT stocks reflects trade war retaliation risk (through, for example, delisting from U.S. exchanges), then the selloff is rational. But the fact that Tencent (which also trades in Hong Kong) has also declined so sharply suggests that investors are blanket selling Chinese technology-related stocks out of concern that the sector will be heavily implicated by punitive action from the Trump administration. The BAT stocks are domestically oriented, meaning that “Huawei risk” appears to be minimal. Chart 5A Potential (Future) Opportunity In The BAT Stocks
A Potential (Future) Opportunity In The BAT Stocks
A Potential (Future) Opportunity In The BAT Stocks
Beyond the near-term risk from deteriorating sentiment, the selloff in BAT stocks may present a cyclical opportunity for investors. Unlike Huawei, whose export-oriented business model relied on the U.S. as part of its supply chain, Alibaba and Tencent are largely domestically-driven businesses whose earnings will depend mostly on the outlook for Chinese consumer spending. We agree that reflationary efforts by Chinese policymakers will attempt to avoid stoking a significant acceleration in residential mortgage credit, but it is difficult to envision a scenario in which China stimulates aggressively and consumer spending growth does not accelerate. As such, investors should closely watch the performance of BAT stocks in response to reflationary announcements and developments on the credit front; we would strongly consider an outright long stance favoring BAT stocks if a technical breakout occurs alongside the release of data that is consistent with a significant improvement in the macro outlook. There has been little movement in the Chinese government bond market over the past month, with the Chinese 10-year government bond yield having fallen merely 10 basis points since late-April. This is in contrast to what has occurred in the U.S., with yields on 10-year Treasurys having come in roughly three times as much over the past month (Chart 6). The relative calm in the Chinese government bond market is echoed by the relative 5-year CDS spread between China and Germany, a component of our BCA Market-Based China Growth Indicator. While the spread has certainly moved higher in response to the breakdown in trade talks and President Trump’s full imposition of tariffs on the second tranche of imports from China, it remains below its 2018 average and well below levels that prevailed in 2015 and 2016 (Chart 7). Similarly, Chinese onshore corporate bond spreads have not reacted negatively to the resumption in the trade war, with the spread on the aggregate ChinaBond Onshore Corporate Bond Index up one basis point over the past month. Taken together with the relative performance of A-shares as well as Charts 6 and 7 we see this as evidence that China’s financial market participants are pricing in some probability of a major reflationary response by Chinese authorities. Chart 6Relative Calm In China's Fixed-Income Market
Relative Calm In China's Fixed-Income Market
Relative Calm In China's Fixed-Income Market
Chart 7China's Sovereign CDS Spread Is Rising, But The Level Remains Low
China's Sovereign CDS Spread Is Rising, But The Level Remains Low
China's Sovereign CDS Spread Is Rising, But The Level Remains Low
A decline in the RMB is necessary to stabilize China’s economy (and is thus reflationary), but global investors will not act like it is until the economy visibly improves. Global financial market commentary on the RMB has been focused almost exclusively over the past month on the USD-CNY exchange rate, but Chart 8 shows that the decline in the currency has been broad-based. The RMB has fallen roughly 1.4% versus the euro over the past month, and over 2% versus an equally-weighted basket of Asian currencies. We highlighted in our May 15 Weekly Report that a 25% increase in tariffs affecting all U.S.-China trade would cause economic conditions in China to deteriorate to 2015/2016-like levels, and that currency depreciation was essential in order to generate a 2015/2016-magnitude policy response.2 However, to the extent that the decline in the RMB will contribute to a period of greater volatility in the global foreign exchange market, China-related assets are not likely to respond positively to this form of stimulus until “hard” activity data clearly shows a meaningful rise. Chart 8The RMB Has Declined Against Everything, Not Just The Dollar
The RMB Has Declined Against Everything, Not Just The Dollar
The RMB Has Declined Against Everything, Not Just The Dollar
Jonathan LaBerge, CFA, Vice President Special Reports jonathanl@bcaresearch.com Footnotes 1 Please see China Investment Strategy Weekly Report, “Waiting For The Pain”, dated May 29, 2019, available at cis.bcaresearch.com. 2 Please see China Investment Strategy Weekly Report, “Simple Arithmetic”, dated May 15, 2019, available at cis.bcaresearch.com. Cyclical Investment Stance Equity Sector Recommendations
Feature Markets have turned jittery in the past month. Global growth data have deteriorated further (Chart 1), with Korean exports, the German manufacturing PMI, and even U.S. industrial production weak. Moreover, trade negotiations between the U.S. and China appear to have broken down, with China threatening to retaliate against U.S. sanctions on Huawei by blocking sales of rare earths, and refusing to negotiate further unless the U.S. eases tariffs. BCA’s Geopolitical Strategists now give only a 40% probability of a trade deal by the time of the G20 summit at the end of June (Table 1). As a result, BCA alerted clients on 10 May to the risk of a further short-term 5% correction in global equities.1 Recommended Allocation
Monthly Portfolio Update: China To The Rescue?
Monthly Portfolio Update: China To The Rescue?
Chart 1Worrying Signs?
Worrying Signs?
Worrying Signs?
Table 1Chances Of A Trade Deal Fading Fast
Monthly Portfolio Update: China To The Rescue?
Monthly Portfolio Update: China To The Rescue?
What is essentially behind the global slowdown, especially outside the U.S., is that both China and the U.S. last year were tightening monetary policy – China by slowing credit growth, the U.S. via Fed hikes. The U.S. economy was robust enough to withstand this, but economies in Europe, Asia, and Emerging Markets were not (Chart 2). The question now is whether the Chinese authorities and the Fed will come to the rescue and add stimulus that will cause a recovery in global growth. China has already triggered a rebound in credit growth since January (Chart 3). Chart 2U.S. Holding Up Better Than Elsewhere
U.S. Holding Up Better Than Elsewhere
U.S. Holding Up Better Than Elsewhere
Chart 3China Stimulus Has Only Just Begun
China Stimulus Has Only Just Begun
China Stimulus Has Only Just Begun
This has not come through clearly in Chinese – and other countries’ – activity data yet, partly because there is usually a lag of 3-12 months before this happens, and partly because Chinese authorities seemingly eased back somewhat on the gas pedal in April given rising expectations of a trade deal. But, judging by previous episodes such as 2009 and 2016, the Chinese will stimulate now based on the worst-case scenario. The risk is more that they overdo the stimulus than that they fail to do enough. Yes, China is worried about its excess debt situation. But this year they will prioritize growth – not least because of some sensitive anniversaries in the months ahead (for example, the 70th anniversary of the People’s Republic on October 1), and because the government is falling behind on its promise to double per capita real income between 2010 and 2020 (Chart 4). Chart 4Chinese Communist Party Needs To Prioritize Growth
Chinese Communist Party Needs To Prioritize Growth
Chinese Communist Party Needs To Prioritize Growth
Chart 5U.S. Consumers Look In Fine State
U.S. Consumers Look In Fine State
U.S. Consumers Look In Fine State
In the U.S., consumption is likely to continue to buoy the economy. Wages are growing 3.2% a year and set to accelerate further, and consumer confidence is close to a 50-year high (Chart 5). It is easy to exaggerate the impact of even an all-out trade war. For China, exports to the U.S. are only 3.4% of GDP. A hit to this could easily be offset by stimulus leading to greater capital expenditure. For the U.S, most academic studies show that the impact of tariffs will largely be passed on to the consumer via higher prices.2 But even if the U.S. imposes 25% tariffs on all Chinese exports and all is passed on to the consumer with no substitutions for goods from other countries the impact, about $130 billion, would represent only 1% of total U.S. consumption. The question now is whether the Chinese authorities and the Fed will come to the rescue and add stimulus that will cause a recovery in global growth. But if China will bail out the global economy, we are not so convinced that the Fed will cut rates any time soon. The market has priced in two Fed rate cuts over the next 12 months (Chart 6). But we agree with comments from Fed officials that recent softness in inflation is transitory. For example, financial services inflation (mostly comprising financial advisor fees, linked to assets under management, and therefore very sensitive to the stock market) alone has deducted 0.4 percentage points from core PCE inflation over the past six months (Chart 7). The trimmed mean PCE (which cuts out other volatile items besides energy and food, which are excluded from the commonly used core PCE measure) is close to 2% and continues to drift up. Chart 6Will The Fed Really Cut Twice In 12 Months?
Will The Fed Really Cut Twice In 12 Months?
Will The Fed Really Cut Twice In 12 Months?
Chart 7Soft Inflation Probably Is Transitory
Soft Inflation Probably Is Transitory
Soft Inflation Probably Is Transitory
Fed policy remains mildly accommodative: the current Fed Funds Rate is still two hikes below the neutral rate, as defined by the median terminal-rate dot in the FOMC’s Summary of Economic Projections (Chart 8). The market may be trying to push the Fed into cutting rates and could be disappointed if it does not. For now, we tend to agree with the Fed’s view that policy is about correct (Chart 9) but, if global growth does recover before the end of the year, one hike would be justified in early 2020 – before the upcoming Presidential election in November 2020 makes it less comfortable for the Fed to move. Chart 8Fed Policy Is Still Accommodative
Fed Policy Is Still Accommodative
Fed Policy Is Still Accommodative
Chart 9Fed Doesn't Need To Move For Now
Fed Doesn't Need To Move For Now
Fed Doesn't Need To Move For Now
In this macro environment, we see global bond yields bottoming not far below their current (very depressed) levels, and equities eking out reasonable gains over the next 12 months. The risk of a global recession over the next year or so is not high, in our opinion. We, therefore, continue to recommend an overweight on global equities and underweight on bonds over the cyclical horizon. We see global bond yields bottoming not far below their current (very depressed) levels, and equities eking out reasonable gains over the next 12 months. Fixed Income: Government bond yields have fallen sharply over the past eight months (by 110 basis points for the U.S. 10-year, for example) because of 1) falling inflation expectations, caused mostly by a weak oil price, 2) expectations of Fed rate cuts, 3) especially weak growth in Europe, which pulled German yields down to -20 basis points in May, and 4) global risk aversion which pushed asset allocators into government bonds, and lowered the term premium to near record low levels (Chart 10). If Brent crude rises to $80 a barrel this year as we forecast, the Fed does not cut rates, and European growth rebounds because of Chinese stimulus, we find it highly improbable that yields will fall much further. Ultimately, the global risk-free rate is driven by global growth (Chart 11). Investors are already positioned very aggressively for a further fall in yields (Chart 12). We would expect the U.S. 10-year yield to move back towards 3% over the next 12 months. We remain moderately positive on credit, which should also benefit from a growth rebound: U.S. high-yield spreads are still around 70 basis points for Ba-rated bonds, and 110 basis points for B-rated ones, above the levels at which they typically bottom in expansions; investment-grade bonds, though, have less room for spread contraction (Chart 13). Chart 10Term Premium Near Record Low
Term Premium Near Record Low
Term Premium Near Record Low
Chart 11Global Rebound Would Push Up Yields
Global Rebound Would Push Up Yields
Global Rebound Would Push Up Yields
Chart 12Investors Very Long Duration
Investors Very Long Duration
Investors Very Long Duration
Chart 13Credit Spreads Can Tighten Further
Credit Spreads Can Tighten Further
Credit Spreads Can Tighten Further
Equities: We remain overweight U.S. equities, partly as a hedge against our overweight on the equity asset class, since the U.S. remains a relatively low beta market. Our call for the second half will be 1) when will Chinese stimulus start to boost growth disproportionately for commodity and capital-goods exporters, and 2) does that justify a shift out of the U.S. (which may be somewhat hurt short term by the Trade War) and into euro zone and Emerging Markets equities. Given the structural headwinds in both (the chronically weak banking system and political issues in Europe; high debt and lack of structural reforms in EM), we want clear evidence that the Chinese stimulus is working before making this call. We are likely to remain more cautious on Japan, even though it is a clear beneficiary of Chinese growth, because of the risk presented by the rise in the consumption tax in October: after previous such hikes, consumption not only slumped immediately afterwards but remained depressed (Chart 14). Chart 14Japan's Sales Tax Hike Is A Worry
Japan's Sales Tax Hike Is A Worry
Japan's Sales Tax Hike Is A Worry
Chart 15Dollar Is A Counter-Cyclical Currency
Dollar Is A Counter-Cyclical Currency
Dollar Is A Counter-Cyclical Currency
Currencies: Again, China is the key. The dollar is a counter-cyclical currency, and a pickup in global growth would weaken it (Chart 15). Any further easing by the ECB – for example, significantly easier terms on the next Targeted Longer-Term Refinancing Operations (TLTRO) – might actually be positive for the euro since it would augur stronger growth in the euro area. Moreover, long dollar is a clear consensus view, with very skewed market positioning (Chart 16). Also, on a fundamental basis, compared to Purchasing Power Parity, the dollar is around 15% overvalued versus the euro and 11% versus the yen.
Chart 16
Chart 17Industrial Metals Driven By China Too
Industrial Metals Driven By China Too
Industrial Metals Driven By China Too
Commodities: Industrial metals prices have generally been weak in recent months with copper, for example, falling by 10% since mid-April. It will require a sustained rebound in Chinese infrastructure spending to push prices back up (Chart 17). Oil continues to be driven by supply-side factors, not demand. With OPEC discipline holding, Iran sanctions about to be reimposed, political turmoil in Libya and Venezuela, BCA’s energy strategists continue to see inventories drawing down this year, and therefore forecast Brent crude to reach $80 during 2019 (Chart 18). Chart 18Oil Supply Remains Tight
Oil Supply Remains Tight
Oil Supply Remains Tight
Garry Evans Chief Global Asset Allocation Strategist garry@bcaresearch.com Footnotes 1 Please see Global Investment Strategy, Special Report, “Stay Cyclically Overweight Global Equities, But Hedge Near-Term Downside Risks From An Escalation Of A Trade War,” dated May 10, 2019, available at gis.bcaresearch.com 2 Please see, for example, Mary Amiti, Sebastian Heise, and Noah Kwicklis, “The Impact of Import Tariffs on U.S. Domestic Prices,” Federal Reserve Bank of New York Liberty Street Economics, dated 4 January 2019. Recommended Asset Allocation
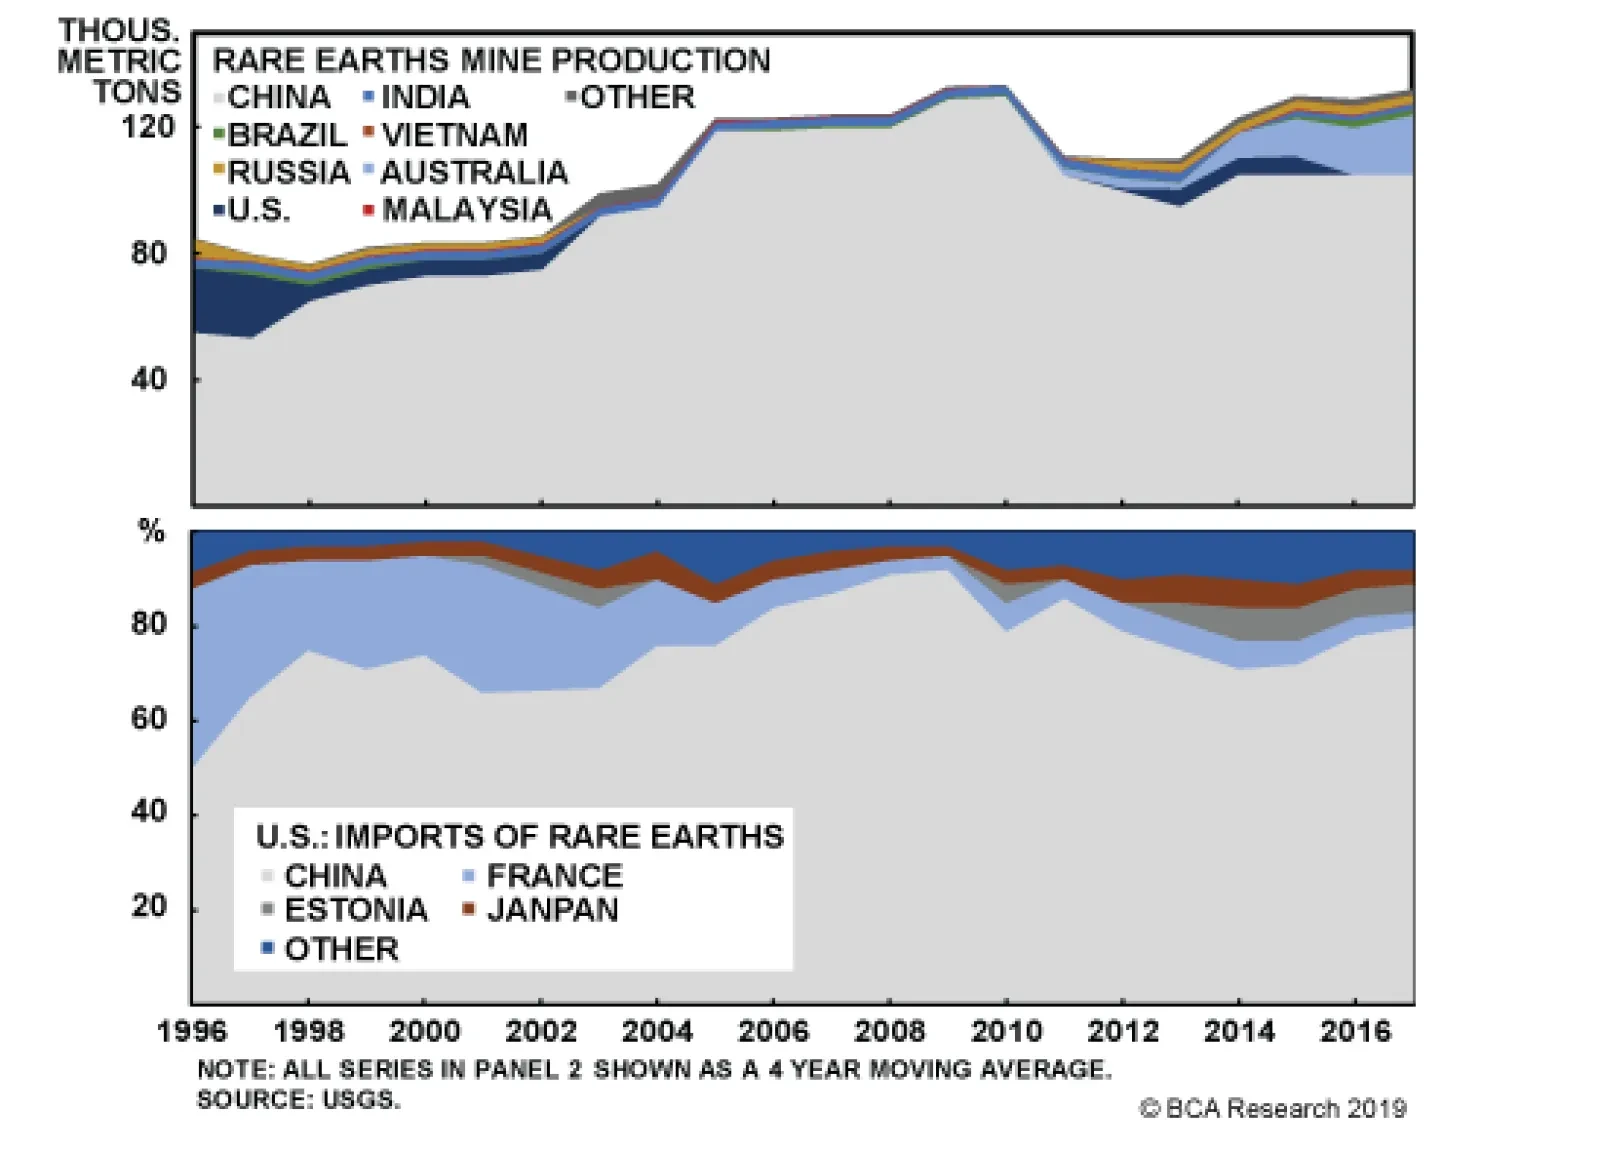
China dominates global production and export markets, so this would be a serious disruption in the near term. Global sentiment would worsen, weighing on all risk assets, and tech companies and manufacturers that rely on rare earth inputs from China would face…
On March 6 our Geopolitical Strategy team argued that a deal had a 50% chance of getting settled by the June 28-29 G20 summit in Japan, with a 30% chance talks would totally collapse. Since then, they have reduced the odds of a deal to 40%, with a collapse at…
The Sino-U.S. trade war is heating up further. After veiled threats of curtailing rare earth shipments to the West, Chinese policymakers are now announcing their preparation of a blacklist of “unreliable” entities. While the content of the list remains…
Highlights Global equities face near-term downside risks from the trade war, but should be higher in 12 months’ time. Its claims to novelty notwithstanding, Modern Monetary Theory is basically indistinguishable from standard Keynesian economics except that MMT assumes that changes in interest rates have no discernible effect on aggregate demand. This straightforward but unrealistic assumption allows MMT’s proponents to argue that the neutral rate of interest does not exist, that crowding out is impossible, and that while fiscal deficits do matter (because too much government spending can stoke inflation), debt levels do not. Despite its many shortcomings, MMT’s focus on financial balances and the role of sovereign-issued money is laudable. A better understanding of these concepts would have made investors a lot of money during the past decade. Today, most economies are still running large private-sector financial surpluses. This surplus of desired savings relative to investment has kept interest rates low, which have allowed governments to finance their budgets at favorable terms. As these surpluses decline, inflation will rise. Feature Greetings From Down Under I have been meeting clients in Australia and New Zealand this week. The mood has been generally negative on the outlook for both the domestic and global economies. As one might imagine, the brewing China-U.S. trade war has been a hot topic of discussion. We went tactically short the S&P 500 on May 10th, a move that for the time being effectively neutralizes our structurally overweight stance on global equities. As we indicated when we initiated the hedge, we will take profits on the position if the S&P 500 drops below 2711. Despite the darkening clouds hanging over the trade war, we still expect a detente to be reached that prevents a further escalation of the conflict. Both sides would suffer from an extended trade war. For China, it is no longer just about losing access to the vast U.S. market. It is also about losing access to vital technology. The blacklisting of Huawei deprives China of critical components needed to realize its dream of becoming a world leader in AI and robotics. The trade war will not harm the U.S. as much as it will China, but it has still raised prices for American consumers, while lowering the prices of key agricultural exports such as soybeans. It has also hurt the stock market, which Trump seems to view as a barometer for his own success as president. If a trade detente is eventually reached, market attention will shift back to the outlook for global growth. We expect the combination of aggressive Chinese fiscal/credit stimulus and the palliative effects of falling global bond yields over the past seven months to lift growth in the back half of the year. As a countercyclical currency, the U.S. dollar is likely to weaken when global growth starts to strengthen. This will provide an opportune time to go overweight EM and European equities as well as the more cyclical sectors of the stock market. Are You Now Or Have You Ever Been A Member Of The MMT Movement? Last week’s report1 argued that a global deflationary ice age is unlikely to transpire because politicians will pursue large-scale fiscal stimulus to preclude this outcome. We noted that many countries are easing fiscal policy at the margin, partly in response to populist pressures. Even in Japan, the likelihood that the government will raise the sales tax this year has diminished, while structural forces will continue to drain savings for years to come. This will set the stage for higher inflation in Japan, something the market is not at all anticipating. Somewhat controversially, we contended that larger budget deficits are unlikely to imperil debt sustainability, at least for countries that are able to issue debt in their own currencies. This implies that any government with its own printing press should simply ease fiscal policy until long-term inflation expectations reach their target level. MMT can best be thought of as a special case of Keynesian economic theory where monetary policy is not just relegated to the back burner, but banished from the kitchen altogether. A number of readers pointed out that our analysis sounded suspiciously supportive of Modern Monetary Theory (MMT). Are we really closet MMT devotees? No, we are not. Our approach shares some commonalities with MMT (so if you want to call me a “MMT sympathizer,” go ahead). However, it also differs from MMT in a number of important respects. As we discuss below, these differences have significant implications for market outcomes, particularly one’s views about the long-term direction of government bond yields. MMT: A “Special Case” Of Keynesian Economics
Chart 1
Modern Monetary Theory is not nearly as novel as its backers claim. In fact, MMT can best be thought of as a special case of Keynesian economic theory where monetary policy is not just relegated to the back burner, but banished from the kitchen altogether. Outside of liquidity trap conditions, most economists believe that monetary policy is an effective aggregate demand management tool. MMT’s supporters reject this. In their view, changes in interest rates have no impact on spending. In the technical parlance of economics, MMT is basically the Hicksian IS/LM model but with a vertical IS curve and an LM curve that intersects the IS curve at an interest rate of zero (Chart 1). This seemingly small variation on the traditional Keynesian framework has far-reaching consequences. For one thing, it renders meaningless the entire concept of the neutral rate of interest. If changes in interest rates have no effect on aggregate demand, then one cannot identify an equilibrium level of interest rates that is consistent with full employment and stable inflation. Given their leftist roots, it is not surprising that most MMTers favor keeping rates low, preferably near zero. Higher rates shift income from borrowers to lenders. The latter tend to be richer than the former. Why reward fat cats when you don’t have to? Low rates also allow the government to spend more without putting the debt-to-GDP ratio on an unsustainable trajectory. If the interest rate at which the government borrows stays below the growth rate of the economy, the government can run a stable Ponzi scheme, perpetually issuing new debt to pay the interest on existing debt (Chart 2). In such a world, budget deficits only matter to the extent that too much fiscal stimulus can stoke inflation. The level of debt, in contrast, never matters.
Chart 2
Interest Rates Do Affect Aggregate Demand Chart 3Mortgage Rate Swings Matter For The Housing Market
Mortgage Rate Swings Matter For The Housing Market
Mortgage Rate Swings Matter For The Housing Market
Despite MMT’s efforts to deny any role for monetary policy in stabilizing the economy, the empirical evidence clearly shows that changes in interest rates do affect consumption and investment decisions. Housing activity, in particular, is very sensitive to movements in mortgage rates. The recent drop in mortgage rates bodes well for U.S. housing activity during the remainder of the year (Chart 3). The dollar, like most currencies, is also influenced by shifts in interest rate differentials (Chart 4). Changes in the dollar affect net exports, and hence overall employment. Once we acknowledge that interest rates affect aggregate demand, we are back in a world of trade-offs between monetary and fiscal policy. One can have easy monetary policy and tight fiscal policy, or tight monetary policy and easy fiscal policy. But outside of liquidity trap conditions, one cannot have both easy monetary and fiscal policies for a prolonged period of time without tolerating higher and rising inflation. Chart 4Historically, The Dollar Has Moved In Line With Interest Rate Differentials
Historically, The Dollar Has Moved In Line With Interest Rate Differentials
Historically, The Dollar Has Moved In Line With Interest Rate Differentials
The Perils Of Accounting Identities MMT proponents love accounting identities. They are particularly fond of saying that government deficits endow the private sector with additional wealth in the form of government bonds or cash. Unfortunately, the penchant to “argue by accounting identity” is almost always a recipe for disaster since such arguments usually fail to identify the causal forces by which one thing affects the other. For example, no competent economist would deny that an increase in the fiscal deficit must tautologically imply an increase in the private sector’s financial balance (the difference between the private sector’s income and spending). What MMT adherents fail to appreciate is that private-sector savings can increase either if incomes rise or spending falls. Ironically, what often gets overlooked is that the predictions made by standard Keynesian economic theory over the past decade have proven to be broadly accurate. When an economy is depressed, fiscal stimulus is likely to increase employment. In such a setting, rising payrolls will boost incomes, leading to a larger private-sector surplus. In contrast, when the economy is operating at full employment, any increase in the private-sector surplus must come about through a decline in private-sector spending. That is to say, if the government consumes more of the economy’s output, the private sector has to consume less. There is a huge difference between the two cases. MMTers tend to gloss over this distinction because they do not really have a theory for why the private-sector financial balance moves around in the first place. To them, private-sector spending is completely exogenous. It is determined by such things as animal spirits that the government has no control over. The government’s only job is to adjust the fiscal balance to ensure that it is the mirror image of the private-sector’s balance. Budget deficits cannot crowd out private-sector spending in this context because the government plays no role in determining how much the private sector wishes to spend. Investment Conclusions Economics gets a bad rap these days. Although most people would not go as far as Nassim Taleb who once mused about running over economists in his Lexus, it is fair to say that there is a lot of disillusionment towards the economics profession. Ostensibly heterodox theories like MMT help fill an intellectual void for those hoping to rewrite the economics textbooks for the 21st century. Ironically, what often gets overlooked is that the predictions made by standard Keynesian economic theory over the past decade have proven to be broadly accurate. Shortly after the financial crisis, when the world was still mired in a deep slump, Keynesian economics predicted that large budget deficits would not push up interest rates and that QE would not lead to runaway inflation. In contrast, Taleb said in early February 2010, when the 10-year Treasury yield was trading at around 3.6%, that Ben Bernanke was “immoral” and that “Every single human being should short Treasury bonds. It’s a no-brainer.” The study of financial balances is not unique to MMT, nor is MMT’s approach to thinking about financial balances the best one. Even so, a basic understanding of the concept would have prevented Taleb and countless others from making the mistakes they did. The fact that MMT has brought the discussion of financial balances, along with related concepts such as the role of sovereign-issued money in an economy, back into the spotlight is its greatest virtue. Today, most economies are still running large private-sector financial surpluses (Chart 5). Given that interest rates are so low, it is difficult to argue that budget deficits are crowding out private spending. This may change over time, however. Falling unemployment is boosting consumer confidence, which will bolster spending. U.S. wage growth has already accelerated sharply among workers at the bottom end of the income distribution (Chart 6). These are the workers with the highest marginal propensity to consume. Chart 5AMost Major Countries Run Private-Sector Surpluses (I)
Most Major Countries Run Private-Sector Surpluses (I)
Most Major Countries Run Private-Sector Surpluses (I)
Chart 5BMost Major Countries Run Private-Sector Surpluses (II)
Most Major Countries Run Private-Sector Surpluses (II)
Most Major Countries Run Private-Sector Surpluses (II)
Meanwhile, baby boomers are leaving the labor force. More retirees means less production, but not necessarily less consumption. Once health care spending is added to the tally, consumption actually increases in old age (Chart 7). If production falls in relation to consumption, excess savings will decline and the neutral rate of interest will rise.
Chart 6
Chart 7Savings Over The Life Cycle
Savings Over The Life Cycle
Savings Over The Life Cycle
When this happens, will governments tighten fiscal policy, as the MMT prescription requires? In a world where entitlement programs are politically sacrosanct, that seems unlikely. The end result is that economies will overheat and inflation will rise. Will central banks tighten monetary policy in response to higher inflation? That depends on what one means by tighten. Central banks will undoubtedly raise rates, but in a world of high debt levels, they will be loath to push interest rates above the growth rate of the economy. Interest rates will rise in nominal terms, but probably very little or not at all in real terms. In such an environment, investors should maintain below-benchmark duration exposure in their fixed-income portfolios, while favouring inflation-linked bonds over nominal bonds. Owning traditional inflation hedges such as gold would also make sense. Peter Berezin, Chief Global Strategist Global Investment Strategy peterb@bcaresearch.com Footnotes 1 Please see Global Investment Strategy Weekly Report, “Ice Age Cometh?” dated May 24, 2019. Strategy & Market Trends MacroQuant Model And Current Subjective Scores
Chart 8
Tactical Trades Strategic Recommendations Closed Trades
Highlights So What? U.S.-China relations are still in free fall as we go to press. Why? The trade war will elicit Chinese stimulus but downside risks to markets are front-loaded. The oil risk premium will remain elevated as Iran tensions will not abate any time soon. The odds of a no-deal Brexit are rising. Our GeoRisk Indicators show that Turkish and Brazilian risks have subsided, albeit only temporarily. Maintain safe-haven trades. Short the CNY-USD and go long non-Chinese rare earth providers. Feature The single-greatest reason for the increase in geopolitical risk remains the United States. The Democratic Primary race will heat up in June and President Trump, while favored in 2020 barring a recession, is currently lagging both Joe Biden and Bernie Sanders in the head-to-head polling. Trump’s legislative initiatives are bogged down in gridlock and scandal. The remaining avenue for him to achieve policy victories is foreign policy – hence his increasing aggressiveness on both China and Iran. The result is negative for global risk assets on a tactical horizon and possibly also on a cyclical horizon. A positive catalyst is badly needed in the form of greater Chinese stimulus, which we expect, and progress toward a trade agreement. Brexit, Italy, and European risks pale by comparison to what we have called “Cold War 2.0” since 2012. Nevertheless, the odds of Brexit actually happening are increasing. The uncertainty will weigh on sentiment in Europe through October even if it does not ultimately conclude in a no-deal shock that prevents the European economy from bouncing back. Yet the risk of a no-deal shock is higher than it was just weeks ago. We discuss these three headline geopolitical risks below: China, Iran, and the U.K. No End In Sight For U.S.-China Trade Tensions U.S.-China negotiations are in free fall, with no date set for another round of talks. On March 6 we argued that a deal had a 50% chance of getting settled by the June 28-29 G20 summit in Japan, with a 30% chance talks would totally collapse. Since then, we have reduced the odds of a deal to 40%, with a collapse at 50%, and a further downgrade on the horizon if a positive intervention is not forthcoming producing trade talks in early or mid-June (Table 1). Table 1U.S.-China Trade War: Probabilities Of A Deal By End Of June 2019
GeoRisk Indicators Update: May 31, 2019
GeoRisk Indicators Update: May 31, 2019
We illustrate the difficulties of agreeing to a deal through the concept of a “two-level game.” In a theoretical two-level game, each country strives to find overlap between its international interests and its rival’s interests and must also seek overlap in such a way that the agreement can be sold to a domestic audience at home. The reason why the “win-win scenario” is so remote in the U.S.-China trade conflict is because although China has a relatively large win set – it can easily sell a deal at home due to its authoritarian control – the U.S. win set is small (Diagram 1). Diagram 1Tiny Win-Win Scenario In U.S.-China Trade Conflict
GeoRisk Indicators Update: May 31, 2019
GeoRisk Indicators Update: May 31, 2019
The Democrats will attack any deal that Trump negotiates, making him look weak on his own pet issue of trade with China. This is especially the case if a stock market selloff forces Trump to accept small concessions. His international interest might overlap with China’s interest in minimizing concessions on foreign trade and investment access while maximizing technological acquisition from foreign companies. He would not be able to sell such a deal – focused on large-scale commodity purchases as a sop to farm states – on the campaign trail. Democrats will attack any deal that Trump negotiates. While it is still possible for both sides to reach an agreement, this Diagram highlights the limitations faced by both players. Meanwhile China is threatening to restrict exports of rare earths – minerals which are critical to the economy and national defense. China dominates global production and export markets (Chart 1), so this would be a serious disruption in the near term. Global sentiment would worsen, weighing on all risk assets, and tech companies and manufacturers that rely on rare earth inputs from China would face a hit to their bottom lines. Chart 1China Dominates Rare Earths Supply
France: GeoRisk Indicator
France: GeoRisk Indicator
Over the long haul, this form of retaliation is self-defeating. First, China would presumably have to embargo all exports of rare earths to the world to prevent countries and companies from re-exporting to the United States. Second, rare earths are not actually rare in terms of quantity: they simply occur in low concentrations. As the world learned when China cut off rare earths to Japan for two months in 2010 over their conflict in the East China Sea, a rare earths ban will push up prices and incentivize production and processing in other regions. It will also create rapid substitution effects, recycling, and the use of stockpiles. Ultimately demand for Chinese rare earths exports would fall. Over the nine years since the Japan conflict, China’s share of global production has fallen by 19%, mostly at the expense of rising output from Australia. A survey of American companies suggests that they have diversified their sources more than import statistics suggest (Chart 2). Chart 2Import Stats May Be Overstating China’s Dominance
U.K.: GeoRisk Indicator
U.K.: GeoRisk Indicator
The risk of a rare earths embargo is high – it fits with our 30% scenario of a major escalation in the conflict. It would clearly be a negative catalyst for companies and share prices. But as with China’s implicit threat of selling U.S. Treasuries, it is not a threat that will cause Trump to halt the trade war. The costs of conflict are not prohibitive and there are some political gains. Bottome Line: The S&P 500 is down 3.4% since our Global Investment Strategists initiated their tactical short on May 10. This is nearly equal to the weighted average impact on the S&P 500 that they have estimated using our probabilities. Obviously the selloff can overshoot this target. As it does, the chances of the two sides attempting to contain the tensions will rise. If we do not witness a positive intervention in the coming weeks, it will be too late to salvage the G20 and the risk of a major escalation will go way up. We recommend going short CNY-USD as a strategic play despite China’s recent assurances that the currency can be adequately defended. Our negative structural view of China’s economy now coincides with our tactical view that escalation is more likely than de-escalation. We also recommend going long a basket of companies in the MVIS global rare earth and strategic metals index – specifically those companies not based in China that have seen share prices appreciate this year but have a P/E ratio under 35. U.S.-Iran: An Unintentional War With Unintentional Consequences? “I really believe that Iran would like to make a deal, and I think that’s very smart of them, and I think that’s a possibility to happen.” -President Donald Trump, May 27, 2019 … We currently see no prospect of negotiations with America ... Iran pays no attention to words; what matters to us is a change of approach and behavior.” -Iranian Foreign Ministry spokesman Abbas Mousavi, May 28, 2019 The U.S. decision not to extend sanction waivers on Iran multiplied geopolitical risks at a time of already heightened uncertainty. Elevated tensions surrounding major producers in the Middle East could impact oil production and flows. In energy markets, this is reflected in the elevated risk premium – represented by the residuals in the price decompositions that include both supply and demand factors (Chart 3). Chart 3The Risk Premium Is Rising In Brent Crude Oil Prices
Germany: GeoRisk Indicator
Germany: GeoRisk Indicator
Tensions surrounding major oil producers ... are reflected in the elevated risk premium – represented by the residuals in the Brent price decomposition. Already Iranian exports are down 500k b/d in April relative to March – the U.S. is acting on its threat to bring Iran’s exports to zero and corporations are complying (Chart 4). Chart 4Iran Oil Exports Collapsing
Italy: GeoRisk Indicator
Italy: GeoRisk Indicator
What is more, the U.S. is taking a more hawkish military stance towards Iran – recently deploying a carrier strike group and bombers, partially evacuating American personnel from Iraq, and announcing plans to send 1,500 troops to the Middle East. The result of all these actions is not only to reduce Iranian oil exports, but also to imperil supplies of neighboring oil producers such as Iraq and Saudi Arabia which may become the victims of retaliation by an incandescent Iran. Our expectation of Iranian retaliation is already taking shape. The missile strike on Saudi facilities and the drone attack on four tankers near the UAE are just a preview of what is to come. Although Iran has not claimed responsibility for the acts, its location and extensive network of militant proxies affords it the ability to threaten oil supplies coming out of the region. Iran has also revived its doomsday threat of closing down the Strait of Hormuz through which 20% of global oil supplies transit – which becomes a much fatter tail-risk if Iran comes to believe that the U.S. is genuinely pursuing immediate regime change, since the first-mover advantage in the strait is critical. This will keep markets jittery. Current OPEC spare capacity would allow the coalition to raise production to offset losses from Venezuela and Iran. Yet any additional losses – potentially from already unstable regions such as Libya, Algeria, or Nigeria – will raise the probability that global supplies are unable to cover demand. Going into the OPEC meeting in Vienna in late June, our Commodity & Energy Strategy expects OPEC 2.0 to relax supply cuts implemented since the beginning of the year. They expect production to be raised by 0.9mm b/d in 2H2019 vs. 1H2019.1 Nevertheless, oil producers will likely adopt a cautious approach when bringing supplies back online, wary of letting prices fall too far. This was expressed at the May Joint Ministerial Monitoring Committee meeting in Jeddah, which also highlighted the growing divergence of interests within the group. Russia is in support of raising production at a faster pace than Saudi Arabia, which favors a gradual increase (conditional on U.S. sanctions enforcement). Both the Iranians and Americans claim that they do not want the current standoff to escalate to war. On the American side, Trump is encouraging Prime Minister Shinzo Abe to try his hand as a mediator in a possible visit to Tehran in June. We would not dismiss this possibility since it could produce a badly needed “off ramp” for tensions to de-escalate when all other trends point toward a summer and fall of “fire and fury” between the U.S. and Iran. If forced to make a call, we think President Trump’s foreign policy priority will center on China, not Iran. But this does not mean that downside risks to oil prices will prevail. China will stimulate more aggressively in June and subsequent months. And regardless of Washington’s and Tehran’s intentions, a wrong move in an already heated part of the world can turn ugly very quickly. Bottom Line: President Trump’s foreign policy priority is China, not Iran. Nevertheless, a wrong move can trigger a nasty escalation in the current standoff, jeopardizing oil supplies coming out of the Gulf region. In response to this risk, OPEC 2.0 will likely move to cautiously raise production at the next meeting in late June. Meanwhile China’s stimulus overshoot in the midst of trade war will most likely shore up demand over the course of the year. Can A New Prime Minister Break The Deadlock In Westminster? “There is a limited appetite for change in the EU, and negotiating it won’t be easy.” - Outgoing U.K. Prime Minister Theresa May Prime Minister Theresa May’s resignation has hurled the Conservative Party into a scramble to select her successor. While the timeline for this process is straightforward,2 the impact on the Brexit process is not. The odds of a “no-deal Brexit” have increased but so has the prospect of parliament passing a soft Brexit prior to any new election or second referendum. The odds of a “no-deal Brexit” have increased. Eleven candidates have declared their entry to the race and the vast majority are “hard Brexiters” willing to sacrifice market access on the continent (Table 2). Prominent contenders such as Boris Johnson and Dominic Raab have stated that they are willing to exit the EU without a deal. Table 2“Hard Brexiters” Dominate The Tory Race
GeoRisk Indicators Update: May 31, 2019
GeoRisk Indicators Update: May 31, 2019
Given that the average Tory MP is more Euroskeptic than the average non-conservative voter or Brit, the final two contenders left standing at the end of June are likely to shift to a more aggressive Brexit stance. They will say they are willing to deliver Brexit at all costs and will avoid repeating Theresa May’s mistakes. This means at the very least the rhetoric will be negative for the pound in the coming months. A clear constraint on the U.K. in trying to negotiate a new withdrawal agreement is that the EU has the upper hand. It is the larger economy and less exposed to the ramifications of a no-deal exit (though still exposed). This puts it in a position of relative strength – exemplified by the European Commission’s insistence on keeping the current Withdrawal Agreement. Whoever the new prime minister is, it is unlikely that he or she will be able to negotiate a more palatable deal with the EU. Rather, the new leader will lead a fractured Conservative Party that still lacks a strong majority in parliament. The no-deal option is the default scenario if an agreement is not finalized by the Halloween deadline and no further extension is granted. However, Speaker of the House of Commons John Bercow recently stated that the prime minister will be unable to deliver a no-deal Brexit without parliamentary support. This will likely manifest in the form of a bill to block a no-deal Brexit. Alternatively, an attempt to force a no-deal exit could prompt a vote of no confidence in the government, most likely resulting in a general election.3 Chart 5British Euroskeptics Made Gains In EP Election
Spain: GeoRisk Indicator
Spain: GeoRisk Indicator
While the Brexit Party amassed the largest number of seats in the European Parliament elections at the expense of the Labour, Conservative, and UKIP parties (Chart 5), the results do not suggest that British voters have generally shifted back toward Brexit. In fact, if we group parties according to their stance, the Bremain camp has a slight lead over the Brexit camp (Chart 6). Thus, it is not remotely apparent that a hard Brexiter can succeed in parliament; that a new election can be forestalled if a no-deal exit is attempted; or that a second referendum will repeat the earlier referendum’s outcome. Chart 6Bremain Camp Still Dominates
Russia: GeoRisk Indicator
Russia: GeoRisk Indicator
Bottom Line: While the new Tory leader is likely to be more on the hard Brexit end of the spectrum than Theresa May, this does not change the position of either the European Commission or the British MPs and voters on Brexit. The median voter both within parliament and the British electorate remains tilted towards a softer exit or remaining in the EU. This imposes constraints on the likes of Boris Johnson and Dominic Raab if they take the helm of the Tory Party. These leaders may ultimately be forced to try to push through something a lot like Theresa May’s plan, or risk a total collapse of their party and control of government. Still, the odds of a no-deal exit – the default option if no agreement is reached by the October 31 deadline – have gone up. In the meantime, the GBP will stay weak, gilts will remain well-bid, and risk-off tendencies will be reinforced. GeoRisk Indicators Update – May 31, 2019 Last month BCA’s Geopolitical Strategy introduced ten indicators to measure geopolitical risk implied by the market. These indicators attempt to capture risk premiums priced into various currencies – except for Euro Area countries, where the risk is embedded in equity prices. A currency or bourse that falls faster than it should fall, as implied by key explanatory variables, indicates increasing geopolitical risk. All ten indicators can be found in the Appendix, with full annotation. We will continue to highlight key developments on a monthly basis. This month, our GeoRisk indicators are picking up the following developments: Trade war: Our Korean and Taiwanese risk indicators are currently the best proxies to measure geopolitical risk implications of the U.S.-China trade war, as they are both based on trade data. Both measures, as expected, have increased more than our other indicators over the past month on the back of a sharp spike in tensions between the U.S. and China. Currently, the moves are largely due to depreciation in currencies, as trade is only beginning to feel the impact. We believe that we will see trade decline in the upcoming months. Brexit: While it is still too early to see the full effect of Prime Minister May’s resignation captured in our U.K. indicator, it has increased in recent days. We expect risk to continue to increase as a leadership race is beginning among the Conservatives that will raise the odds of a “no-deal exit” relative to “no exit.” EU elections: The EU elections did not register as a risk on our indicators. In fact, risk decreased slightly in France and Germany during the past few weeks, while it has steadily fallen in Spain and Italy. Moreover, the results of the election were largely in line with expectations – there was not a surprising wave of Euroskepticism. The real risks will emerge as the election results feed back into political risks in certain European countries, namely the U.K., where the hardline Conservatives will be emboldened, and Italy, where the anti-establishment League will also be emboldened. In both countries a new election could drastically increase uncertainty, but even without new elections the respective clashes with Brussels over Brexit and Italian fiscal policy will increase geopolitical risk. Emerging Markets: The largest positive moves in geopolitical risk were in Brazil and Turkey, where our indicators plunged to their lowest levels since late 2017 and early 2018. Brazilian risk has been steadily declining since pension reform – the most important element of Bolsonaro’s reform agenda – cleared an initial hurdle in Congress. While we would expect Bolsonaro to face many more ups and downs in the process of getting his reform bill passed, we have a high conviction view that the decrease in our Turkish risk indicator is unwarranted. This decrease can be attributed to the fact that the lira’s depreciation in recent weeks is slowing, which our model picks up as a decrease in risk. Nonetheless, uncertainty will prevail as a result of deepening political divisions (e.g. the ruling party’s attempt to overturn the Istanbul election), poor governance, ongoing clashes with the West, and an inability to defend the lira while also pursuing populist monetary policy. Roukaya Ibrahim, Editor/Strategist Geopolitical Strategy roukayai@bcaresearch.com Matt Gertken, Vice President Geopolitical Strategist mattg@bcaresearch.com Ekaterina Shtrevensky, Research Analyst ekaterinas@bcaresearch.com France: GeoRisk Indicator
Image
U.K.: GeoRisk Indicator
Image
Germany: GeoRisk Indicator
Image
Italy: GeoRisk Indicator
Image
Spain: GeoRisk Indicator
Image
Russia: GeoRisk Indicator
Image
Korea: GeoRisk Indicator
Image
Taiwan: GeoRisk Indicator
Image
Turkey: GeoRisk Indicator
Image
Brazil: GeoRisk Indicator
Image
What's On The Geopolitical Radar?
Image
Footnotes 1 Please see BCA Research Commodity & Energy Strategy Weekly Report titled “Policy Risk Sustains Oil’s Unstable Equilibrium,” dated May 23, 2019, available at ces.bcaresearch.com. 2 The long list of candidates will be whittled down to two by the end of June through a series of votes by Tory MPs. Conservative Party members will then cast their votes via a postal ballot with the final result announced by the end of July, before the Parliament’s summer recess. 3 A vote of no confidence would trigger a 14-day period for someone else to form a government, otherwise it will result in a general election. Geopolitical Calendar
Highlights In the political economy of oil, an awareness of the speed at which policy in systematically important states can change can restrain risk taking and investment. This can keep markets in an agitated state of anticipation, awaiting the next policy shift – or the fallout from earlier decisions – and can separate prices from fundamentals. Crude oil markets are in such an agitated state. Fundamentally, oil markets are tight and likely will get tighter, as backwardations in benchmark forward curves indicate (Chart 1). Oil demand continues to grow, with EM growth offsetting DM declines (Chart 2). Production is being restrained by OPEC 2.0, and could remain so in 2H19. U.S. shale-oil producers appear to be taking capital discipline seriously, and prioritizing shareholder interests, which likely will keep production growth within the limits dictated by free cash flow. Chart of the WeekBackwardations In Brent & WTI: Evidence Of Tight Oil Markets
Backwardations In Brent & WTI: Evidence Of Tight Oil Markets
Backwardations In Brent & WTI: Evidence Of Tight Oil Markets
Chart 2EM Continues To Lead Global Oil Demand Growth
EM Continues To Lead Global Oil Demand Growth
EM Continues To Lead Global Oil Demand Growth
The combination of these fundamentals will keep supply growth below demand growth this year, which means balances will remain tight (Table 1 below). This will drain inventories and keep forward curves backwardated (Chart 3). Globally, monetary policy will remain largely accommodative. However, policy risks – chiefly Sino – U.S. trade tensions and rising U.S. – Iran tensions – are taking their toll, increasing uncertainty re demand growth, and raising concerns over the security of oil supply from the Persian Gulf, which accounts for ~ 20% of global output. The combination of these policy-risk factors is putting a bid under the USD, which creates a demand headwind by raising the cost of oil ex-U.S.1 This is, in our view, keeping Brent prices below $70/bbl, vs. the $75/bbl we expect this year. Chart 3Commercial Oil Inventories Will Resume Drawing
Commercial Oil Inventories Will Resume Drawing
Commercial Oil Inventories Will Resume Drawing
Highlights Energy: Overweight. U.S. National Security Adviser John Bolton declared Iran was responsible for naval mines attached to oil tankers off the coast of the UAE earlier this month, which damaged four ships, two of them belonging to Saudi Arabia. Bolton also said the Iranian naval operation was connected to a drone attack on the Saudi East – West pipeline two days later, and an unsuccessful attack on the Saudi Red Sea port of Yanbu.2 Base Metals: Neutral. Global copper markets continue to tighten: Fastmarkets MB’s Asian treatment and refining charges (TC/RC) weekly index dropped to its lowest level since it was launched June 2013 at the end of last week – to $58.30/MT, $0.0583/lb. Lower TC/RC charges reflect lower raw ore supplies available for refining. Global inventories remain low – down 22% y/y at the LME, COMEX, SHFE and Chinese bonded warehouses – and a threatened strike at on of Codelco's Chilean mines could tighten supplies further. We are re-establishing our tactical long July $3.00/lb Comex copper vs. short $3.30/lb Comex copper call spread at tonight’s close, expecting continued tightening in markets. Precious Metals: Neutral. Gold prices appear supported on either side of $1,280/oz, as trade, foreign and monetary policy risks remain elevated. Ags/Softs: Underweight. Heavier-than-expected rains are hampering plantings in the U.S. Midwest, which is driving grain prices higher. Corn, wheat, oats and beans surged Tuesday as markets re-opened from a long holiday weekend in the U.S. Feature Within the context of the political-economy framework we use to frame our analysis of oil markets, foreign policy and trade policy – particularly in the U.S. and China – are dominating fundamentals. Indeed, absent the threat of war in the Persian Gulf between Iran and the U.S., and their respective allies, and an uncertainty surrounding an expanded Sino – U.S. trade war, Brent crude oil would be trading above $75/bbl in 2H19, based on our modeling. As things stand now, we believe markets are under-pricing the risk of war in the Persian Gulf, and are over-estimating the short-term effects of the Sino – U.S. trade war. The longer-term consequences of a deeper and more protracted Sino – U.S. trade war, however, continue to be under-estimated. Table 1BCA Global Oil Supply - Demand Balances (MMb/d, Base Case Balances)
Policy Risk Restrains Oil Prices
Policy Risk Restrains Oil Prices
U.S. – Iran War Risk Is Under-priced We have noted in the past the risk of an escalation in the military confrontation in the Persian Gulf remains acute for global oil markets, most recently in our latest balances report.3 In particular, we believe the risk of this scenario is not fully priced, given market participants’ mark-down of the probability of the price of Brent for December 2019 delivery exceeding $75/bbl and $80/bbl from 39% to 26% and 25% to 16% over the past month in options markets. The probability of Brent for March 2020 delivery exceeding $75/bbl and $80/bbl has similarly been marked down from 38% to 28% and 26% to 19% (Chart 4).
Chart 4
An escalation of attacks on soft targets – specifically Saudi and UAE oil shipping and pipeline networks, as occurred earlier this month – likely would provoke a U.S. response against Iran or its proxies, given U.S. National Security Adviser John Bolton’s declaration this week re Iran, which we noted above. A direct attack on the U.S. military presence in the Gulf would be met with extreme force, according to U.S. President Donald Trump.4 A shooting war in the Gulf would, once again, raise the odds of a closing of the Strait of Hormuz, which has been threatened in the past by Iran. Some 20% of the world’s oil supply transits the Strait daily.5 A credible attack against shipping in the Strait would send oil prices sharply higher. If Iran were to succeed in blocking transit through the Gulf, an even sharper move in prices – above $150/bbl – could be expected. Markets Too Sanguine Re Sino – U.S. Trade War Commodity markets are not fully pricing the recent escalation of Sino – U.S. trade war, which were dialled up recently when Chinese President Xi Jinping declared China is embarking on a “New Long March” at a domestic political visit.6 The size of the tariffs thus far imposed by the U.S. against China and the EU are trivial in the context of global trade flows of ~ $19.5 trillion this year (Chart 5).7 According to the WTO, the USD value of merchandise trade rose 10% last year to $19.5 trillion, partly on the back of higher energy prices, while the value of services increased to $5.8 trillion, an 8% gain. Against this, U.S. tariffs of 25% on $250 billion worth of goods imported from China remain trivial. U.S. tariffs so far on EU imports by the U.S. are de minimis. Trade concerns do matter, however, in the longer run. Our geopolitical strategists make the odds of a no-deal outcome 50%, vs. a 40% chance of a deal being reached, and a 10% chance trade talks extend beyond the G20 talks scheduled for June.
Chart 5
If markets become convinced the current Sino – U.S. trade war will evolve into a larger standoff between the U.S. and China – military or economic – capex and global supply chains will undergo profound changes. Globally, states likely will find themselves in the orbit of one of these powers, which will fundamentally alter investment flows and, ultimately, the profitability of global businesses. A full-blown trade war could become a Cold War, in other words, which would re-order global supply chains.8 Should this occur, an increase in demand for oil, bulks like iron ore, and base metals could ensue, as China ramps its fiscal and monetary stimulus, and the U.S. and others in its sphere of influence bid up commodity prices as they are forced to pay for other higher-cost alternatives for once-cheaper goods and services.9 USD Will Remain A Short-Term Headwind Globally, central banks remain accommodative, which will support aggregate demand domestically. However, the combination of rising U.S. – Iran tensions and the prospect of a widening Sino – U.S. trade war have put a bid under the USD in the short term. Our FX strategists expect the USD will appreciate another 2 – 3% before cresting and heading lower later in the year. In the short term, USD strengthening is a headwind for oil prices. A stronger dollar translates into higher prices in local currencies ex U.S., which reduces demand, all else equal. On the supply side, a stronger dollar lowers local production costs, which stimulates supply ex U.S. at the margin. Together, these militate against higher oil prices. Assuming the USD does weaken later in the year, as our FX strategists expect, oil prices could pick up a slight tailwind. However, policy risk and supply-demand fundamentals will continue to drive oil prices for the balance of the year. Bottom Line: Oil prices are being restrained by policy risk – particularly U.S. and Chinese trade policy and U.S. foreign policy in the Persian Gulf. We believe markets are under-estimating the odds of Brent prices being above $75/bbl for barrels delivering in December 2019, and in March 2020. A resolution of Sino – U.S. trade tensions is less likely than a no-deal outcome (40% vs. 50%), with the odds of trade talks continuing beyond next month’s G20 meeting being very slim (10%). A deepening of the Sino – U.S. trade war will have longer-term consequences for commodity demand – possibly positive in the wake of Chinese fiscal and monetary stimulus. Robert P. Ryan, Chief Commodity & Energy Strategist rryan@bcaresearch.com Footnotes 1 Please see BCA’s Foreign Exchange Strategy Weekly Report titled“President Trump And The Dollar”, dated May 9, 2019, available at fes.bcaresearch.com. 2 Please see “Iranian naval mines likely used in UAE tankers attacks: Bolton,” published by reuters.com on May 29, 2019. See also BCA’s Commodity & Energy Strategy Weekly Report titled “Risk Premium In Oil Prices Rising; KSA Lifts West Coast Export Capacity”, dated October 25, 2018, and BCA’s Geopolitical Strategy and Commodity & Energy Strategy Special Report “U.S.-Iran: This Means War?”, dated May 3, 2019, both available at ces.bcaresearch.com. 3 Please see BCA Research’s Commodity & Energy Strategy Weekly Report titled“Policy Risk Sustains Oil’s Unstable Equilibrium” , dated May 23, 2019, available at cesbcaresearch.com. 4 Please see Trump issues harsh warning to Iran, tweeting it would meet its "official end" if it fights U.S. posted by cbsnews.com on May 20, 2019. 5 Please see BCA’s Geopolitical Strategy and Commodity & Energy Strategy Special Report titled “U.S., OPEC Talk Oil Prices Down; Gulf Tensions Could Become Kinetic”, dated July 19, 2018, available at ces.bcaresearch.com. 6 For an excellent discussion of these developments, please see BCA’s Geopolitical Strategy Weekly Report titled “Is Trump Ready For The New Long March?”, dated May 24, 2019, available at gps.bcaresearch.com. The “New Long March” is a reference to the 8,000-mile retreat of Chinese Communist Party fighters so they could regroup and ultimately prevail in their civil war in 1934-35. In recalling the Long March, “President Xi … told President Trump to ‘bring it on,’ as he apparently believes that a conflict with the U.S. will strengthen his rule,” according to Matt Gertken, BCA Research’s Chief Geopolitical Strategist. 7 Please see “Global trade growth loses momentum as trade tensions persist,” published by the WTO April 2, 2019. The World Trade Organization expects the growth in merchandise trade volume to drop from 3% last year to 2.6% in 2019, with a slight improvement next year back to 3% growth. Importantly, the WTO notes this is “dependent on an easing of trade tensions.” 8 The odds of a “hot war” between the U.S. and China also are rising, particularly in the South China Sea, according to Adm. James Stavridis (USN, Retired). Please see Collision course in the South China Sea published by the Nikkei Asian Review May 22, 2019. 9 Please see BCA’s Commodity & Energy Strategy Weekly Report titled“Expanded Sino – U.S. Trade War Could Be Bullish For Base Metals” dated May 9, 2019, available at ces.bcaresearch.com. Investment Views and Themes Recommendations Strategic Recommendations Tactical Trades TRADE RECOMMENDATION PERFORMANCE IN 2019 Q1
Image
Commodity Prices and Plays Reference Table Trades Closed in 2019 Summary of Closed Trades
Image