China

Highlights Odds are that the recently improved access to financing will allow property developers to boost construction volumes modestly in the coming months. Yet, the outlook for new credit origination and government tolerance of another credit binge is highly uncertain. For now, the completion of previously launched projects will help construction-adjacent industries in the short run. However, these activities will consume real estate developers’ cash augmenting both their liquidity needs and financial vulnerability. That is a basis to underweight the Chinese real estate sectors within both the Chinese MSCI investable universe and the onshore A-share indexes. Feature The emergent divergence among Chinese property sales, starts and completions constitutes an exceptionally bizarre phenomenon. The gaps between these three indicators are currently unprecedented (Chart I-1). Understanding these divergences is critical to correctly gauging the outlook for the Chinese real estate market. This report aims to assess the growth outlook of these three variables. Odds are that these gaps will narrow going forward. Over the next three to six months, the Chinese property market is likely to be characterized by a contraction in floor space sold, a considerable relapse in floor space starts, and a rebound in floor space completions (Chart I-2). Chart I-1An Unprecedented Divergence…
The Unprecedented Divergence
The Unprecedented Divergence
Chart I-2…But A Convergence Looms
Convergence Ahead
Convergence Ahead
In terms of the strength of construction activity in the Chinese property market, the real estate developers’ access to funding has been and remains the key. Over the next three to six months, the Chinese property market is likely to be characterized by a contraction in floor space sold, a considerable relapse in floor space starts, and a rebound in floor space completions. For now, we reckon the improved access to financing in recent months should help property developers to boost construction volumes modestly in the coming months (Chart I-3). Chart I-3Construction Activity Will Modestly Improve In The Coming Few Months
Further Credit Easing Will Likely Lead To Rising Construction Activity
Further Credit Easing Will Likely Lead To Rising Construction Activity
That said, the current round of credit stimulus has probably been front-loaded in the first quarter, and property developers’ access to funding will begin to deteriorate again going forward. This will weigh on their ability to raise construction volumes materially. Understanding The Construction Cycle In China Floor space sold, starts and completions generally move in tandem. Specifically, strong sales lead rising starts, which then with a time lag result in increased completions. However, over the past 15 months, the growth rate of property starts has accelerated to over 20%, while sales have mildly contracted and floor space completions have been shrinking dramatically (Chart I-2). The key reason for these divergences has been the considerable financing difficulties facing property developers. Tighter monetary policy and credit beginning in late 2016 severely impaired developers’ ability to raise funds. This made Chinese real estate developers desperate for any source of possible revenue or financing. Launching new projects aggressively last year – i.e., more property starts – allowed real estate developers to pre-sell and get cash at a time when credit was tight. Property developers were also aiming to conserve cash flow amid tight credit. After investing 25% of the total investment required for a property project (excluding the value of the land), they received a presale permit from the authorities. The permits allowed them to sell housing units in advance. Home-buyers had to pay at least 30% of the total property value at the time they signed the presale contract. This way, developers were able to obtain both deposits and advance payments1 (Chart I-4). This was a welcome addition to scarce financing last year. After this phase, property developers then slowed their investment in construction, installation and equipment purchases – because these would consume precious, limited cash. This depressed construction activity has resulted in a material contraction in floor space completed (Chart I-5). Chart I-4Developers’ Funding Has Improved Due To Deposits & Advanced Payments
Rising Funding From Deposits And Advance Payments
Rising Funding From Deposits And Advance Payments
Chart I-5
Bottom Line: Launching new projects and pre-selling housing units while shrinking construction enabled Chinese real estate developers to stay afloat last year amid tight access to credit. What Does This Mean? There are two important implications related to this unprecedented divergence among property sales, starts and completions. The first is that raising funds via launching property starts along with shrinking completions has resulted in a significant increase in Chinese property developers’ liabilities. This is a form of borrowing money for property developers, and it has been occurring on top of very poor financial health. Specifically, Chinese real estate developers’ debt-to-equity ratio is currently above 4, and continues to surge (Chart I-6). Further, in 2018, 54 out of 131 Chinese property developers had negative free cash flow. This scheme of raising funding via new launches along with postponing building and completions is becoming unsustainable. The divergence between surging property starts and contracting completions suggests that real estate developers have raised funds through selling more uncompleted buildings instead of completed properties (Chart I-7, top panel). Chart I-6Chinese Property Developers Are Very Leveraged
Chinese Property Developers Are Very Leveraged
Chinese Property Developers Are Very Leveraged
Chart I-7A Big Increase In Sales Of Uncompleted Buildings
A Big Increase In Sales Of Uncompleted Buildings
A Big Increase In Sales Of Uncompleted Buildings
Specifically, some 87% of total residential floor space sold in the past 12 months has been sold in advance, much higher than the approximate 77% total recorded in the years prior to 2018 (Chart I-7, bottom panel). The second important implication is that property developers’ ability to raise financing will determine the strength of property construction activities in China going forward. Chinese real estate developers are facing massive funding requirements this year. Developers need considerable amounts of funding this year to speed up their construction activities on delayed projects (launched but not completed ones). It generally takes about two years for real estate developers to complete a construction project and deliver the presold properties. Developers had already slowed their construction progress last year. They must accelerate the pace this year to ensure deliveries are made on time. Developers also need to roll over or repay significant amounts of debt coming due in 2019. On the whole, they have issued nearly RMB3.9 trillion of bonds so far, with most in the three- to five-year duration. Chart I-3 on page 2 shows that further improvements in credit flows in the economy will likely lead to ameliorating construction activity. Credit easing has allowed developers to raise funds through bank loans, bond issuances (both domestic and overseas) and other forms of borrowing (Chart I-8). Property developers’ ability to raise financing will determine the strength of property construction activities in China going forward. As a result, real estate investment in construction, installation and equipment purchases have all ameliorated in recent months (Chart I-9). This reflects a true pickup in real estate construction activities since the beginning of this year. Chart I-8Marginal Credit ##br##Easing
Marginal Credit Easing
Marginal Credit Easing
Chart I-9
However, whether or not this latest improvement develops into full-fledged recovery is contingent on credit flows in the economy in general, and property developers’ access to financing in particular. If the overflow of credit decelerates after the massive binge that took place in the first quarter, it will weigh on construction activity. If the first-quarter credit binge persists, Chinese property developers will likely be able to raise sufficient funds to speed up property completions and roll over their maturing debt this year. In this scenario, construction activity will gather speed, facilitating a recovery in the overall economy. At the current juncture, it is impossible to make a definite conclusion. The outlook for new credit flows and government tolerance of another credit binge is highly uncertain. On the one hand, the Politburo last month reiterated that China will push forward structural deleveraging and prevent speculation in the property market. Preliminary credit flow numbers for April appear to be very weak, not confirming blockbuster credit in the first quarter. Besides, the banking regulator has renewed pressure on banks to recognize non-performing loans and provision for them.2 This will curb banks’ ability to originate new loans and buy corporate bonds. On the other hand, an escalation of tensions between China and the U.S. and the uncertainty it is instilling in the economy and financial markets could lead the authorities to keep the credit taps open for longer, allowing credit to flow into the broader economy. Bottom Line: Real estate developers are extremely leveraged and lack cash to complete launched projects. Hence, property developers’ ability to raise financing holds the key in terms of the strength of property construction activities in China. Further easing in credit will likely lead to rebounding property completions and rising construction activity, and vice versa. What About Chinese Property Demand? Easy credit may alleviate the financing stress facing Chinese real estate developers and lift construction activity temporarily. However, the most important and sustainable source of funding for real estate developers is property sales. Chart I-10 shows that funding from property sales, including deposits, advance payments and mortgages assumed by property buyers, contributes nearly half of the sources of funds raised in that year.
Chart I-10
Self-raised funds are the second-largest component of the source of funds, with a share of 34%. One major component of self-raised funds – retained earnings – are also closely related to property sales. The other major component is equity and bond issuance. Bank loans and foreign investment (including direct equity injections, sales of bonds and equity, and borrowing from foreign banks) together account for only about 15%. Even though there has been some credit easing for Chinese real estate developers, the bad news is that property sales are still in a structural downtrend. Chart I-11Slower PSL Injections Will Negatively Impact Property Demand
Diminishing PSL Scheme Will Be Negative To Property Demand
Diminishing PSL Scheme Will Be Negative To Property Demand
As discussed in our previous reports,3 China’s property market is currently facing structural impediments. Low affordability, slowing rural-to-urban migration, demographic changes, the promotion of the housing rental market and the government’s continuing emphasis on clamping down speculation are together generating strong structural headwinds for property demand in China. Importantly, surging property demand between late 2015 and 2017 was mainly driven by the Chinese central bank’s direct lending to the real estate sector, which is not sustainable. Our calculations indicate that about 20% of floor space sold (in volume terms) in 2017 was due to the Pledged Summary Lending (PSL) facility designed for slum area reconstruction.4 Indeed, the central bank’s PSL injections have already decelerated considerably since last year (Chart I-11). This has resulted in contracting overall property sales. Late last month, the authorities significantly cut their slum-area reconstruction target by more than one-half – from 6.4 million units last year to 2.85 million units this year. This suggests the amount of PSL injections will decline correspondingly (Chart I-12).
Chart I-12
Besides the diminishing PSL scheme, some other factors are also signaling a dismal outlook for Chinese property demand. A deep and long contraction in property demand in rich provinces indicates demand saturation (Chart I-13). Sales outside eastern provinces track PSL injections very closely, as per Chart I-11, and are facing headwinds. Chinese households are more leveraged than U.S. ones, with the former’s debt-to-disposable income ratio having surpassed that of the latter (Chart I-14). Chart I-13Demand Is Saturated In China’s (Richer) Eastern Provinces
Demand Saturation In Rich Eastern Provinces
Demand Saturation In Rich Eastern Provinces
Chart I-14China’s Household Debt Burden Is Very Elevated
Escalated Household Debt In China
Escalated Household Debt In China
Chart I-
In addition, mortgage rates in China have not dropped much, despite monetary policy easing in the past 12 months. Recent data shows the average mortgage rate paid by first-time homebuyers has fallen from 5.71% last November to 5.56% this March, a still-high number. With respect to the ability to service mortgage payments, on a 90-square-meter house with a 30% down payment, our calculations show that annual interest costs account for about 27% of average household disposable income levels (Table I-1). Overall, poor affordability for Chinese homebuyers will constrain property demand in the coming years. Finally, the government is quite determined to implement its property tax in a few years. Local governments’ financing needs will become more acute as revenue from land sales decline substantially. China’s property market is on the way to becoming the market dominated by second-hand properties instead of new buildings – similar to many developed countries. Critically, the progress in establishing property tax laws in China seems to be accelerating. There have been more high-level meetings and discussions about the property tax law, and these meetings/discussions are becoming more detailed and concrete. Bottom Line: Chinese housing demand will be in a structural downtrend, weighing on construction activity beyond any near-term rebound. Investment Implications Based on the above findings, we draw the following investment strategy conclusions: It is reasonable to expect a slight pickup in real estate construction activity in China over the next few months. This will be marginally positive for construction-related commodities demand. Consequently, construction-related commodities markets (steel, cement, and glass) may be supported in the near term (Chart I-15). However, over the longer term, we remain fundamentally negative on construction activity within China’s property markets, as property sales will be in a structural downtrend. BCA’s Emerging Market Strategy service recommends equity investors underweight Chinese property developers within the Chinese equity indexes (Chart I-16). Chart I-15Construction-Related Commodities May Marginally Benefit From A Pickup In Activity
Contraction Commodities Prices May Marginally Benefit
Contraction Commodities Prices May Marginally Benefit
Chart I-16Underweight Real Estate Stocks Relative To The Domestic And Investable Benchmarks
Underweight Real Estate Stocks Within Respective Chinese Investable Universes
Underweight Real Estate Stocks Within Respective Chinese Investable Universes
The completion of previously launched projects will help construction-related industries. Yet, these activities will consume real estate developers’ cash augmenting their liquidity needs and amplifying their financial vulnerability. This is a basis for our recommendation to underweight property stocks, especially following their significant outperformance in the past six months. Further, property stocks respond to marginal changes in financing conditions rather than housing sales or construction activities. The basis is that they are extremely leveraged, and access to funding is key. In the coming months, if credit conditions tighten at a time when real estate developers must commit cash to complete previously launched projects, their cash flow will deteriorate. This will be reflected in their share prices, which will underperform the Chinese broader onshore and offshore indexes. This is likely to occur regardless of the absolute performance of Chinese stocks. Ellen JingYuan He, Associate Vice President ellenj@bcaresearch.com Footnotes 1 Chinese real estate developers could also slow the construction activity after completing 50% of a property project, which allows them to receive at least 60% of the presold property value from house buyers. 2 https://www.bloomberg.com/news/articles/2019-05-06/china-is-said-to-imp… 3 Please see Emerging Markets Strategy Special Report “China Real Estate: A Never-Bursting Bubble?” dated April 6, 2018 and China Investment Strategy Special Report “China’s Property Market: Where Will It Go From Here?” dated September 13, 2018. 4 Please see China Investment Strategy Special Report “China’s Property Market: Where Will It Go From Here?” dated September 13, 2018. Equity Recommendations Fixed-Income, Credit And Currency Recommendations
Feature In lieu of our regular Weekly Report this week, tomorrow we will be publishing a joint Special Report on the Chinese housing market with our Emerging Markets Strategy service, authored by my colleague Ellen JingYuan He. Ellen’s previous housing report was extremely well received,1 and clients should look forward to tomorrow’s update. Chart 1A Full Trade War: Clear Near-Term Risk, But An Uncertain Cyclical Outlook
A Full Trade War: Clear Near-Term Risk, But An Uncertain Cyclical Outlook
A Full Trade War: Clear Near-Term Risk, But An Uncertain Cyclical Outlook
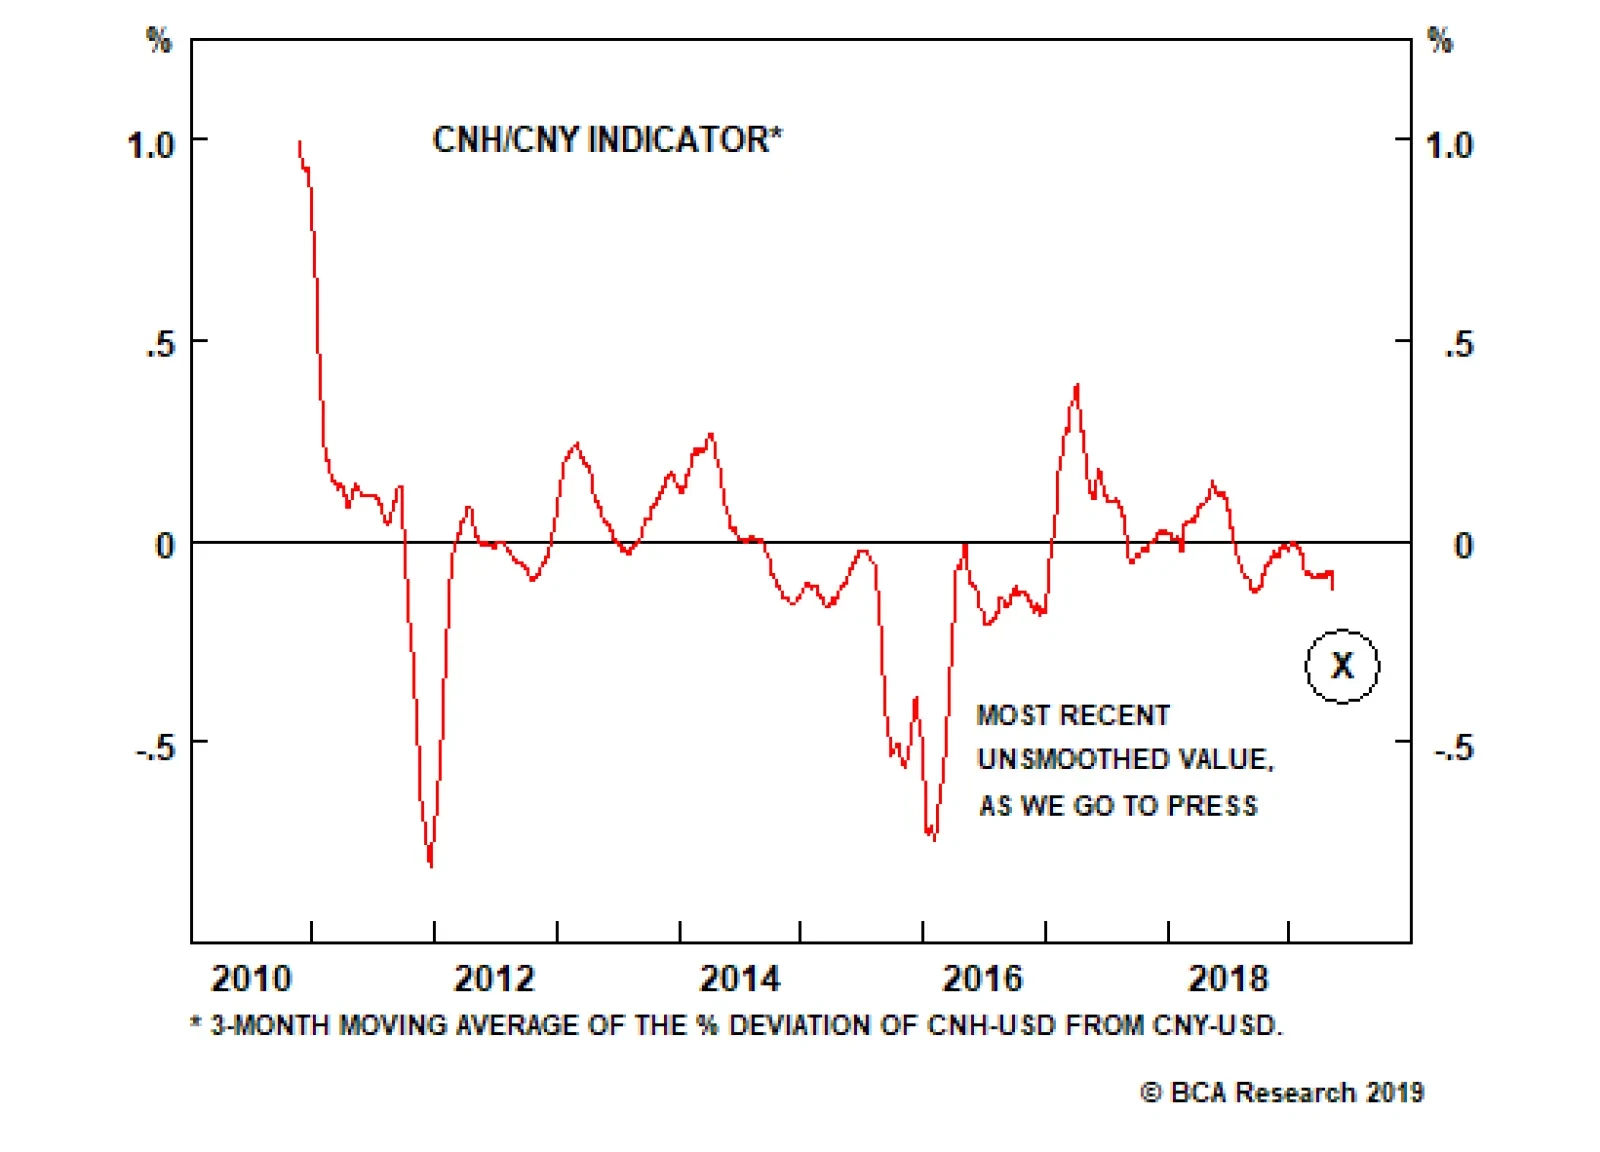
Turning to the financial markets, investors have been squarely focused this week on the sudden escalation in tension between the U.S. and China, caused by President Trump’s renewed threat on May 5 to heighten tariffs on Chinese imports at the end of this week. Specifically, President Trump has claimed that he would increase the current 10% tariff rate on $200 billion worth of Chinese imports to 25%, a move that was originally due on March 1, but was delayed to extend the talks and seek a better agreement. Trump also threatened to raise tariffs on the remaining $325 billion of Chinese imports that are so far untouched. This is the most significant escalation in rhetoric since before the tariff truce agreed on December 1 between Trump and Chinese President Xi Jinping in Buenos Aires. The financial market reaction was swift: Chinese A shares fell nearly 6% on Monday, and USD-CNY surged nearly half a percent (Chart 1). Chinese stocks fared better on Tuesday, but may come under pressure again later in the week as China’s trade delegation returns to the U.S. for talks on Thursday & Friday. Despite this week’s volatility, we would not yet recommend any portfolio strategy changes to investors who are positioned in favor of Chinese stocks or China-related assets more generally. First, we still see the combined odds of a deal or a further extension in talks as being as high as 60%, and investors would view an agreement to extend the negotiations in a positive light after this week’s selloff. At a minimum, investors are likely to get a better chance to sell in such a scenario. Second, over that past year we have steadfastly maintained that China’s economy and its earnings cycle are driven by monetary conditions, money, and credit growth, and two of these three drivers are clearly now pointing to improving economic activity over the coming year. Certainly, the imposition of a 25% import tariff on all Chinese goods would represent a new, negative shock to the Chinese economy, but in this scenario Chinese policymakers would also substantially dial up their reflationary response. As such, while the near-term response in the equity market is likely to be very negative if President Trump follows through with his threat, the cyclical (i.e. 6-12 month outlook) for Chinese relative equity performance is not yet clear. This is only true in local currency (i.e. hedged) terms, however, as we agree that there is meaningful downside potential for the RMB in a full tariff scenario. So while we are likely to advise investors to wait and assess the likely reflationary response if a 25% “second round” tariff rate is imposed this week before changing their equity stance, we would recommend a long USD-CNY/CNH position in the interim as a hedge against a potentially substantial decline in the RMB. Stay tuned. Jonathan LaBerge, CFA, Vice President Special Reports jonathanl@bcaresearch.com Footnotes 1 Please see BCA Research’s China Investment Strategy Special Report, “China’s Property Market: Where Will It Go From Here?,” published September 13, 2018. Available at cis.bcaresearch.com. Cyclical Investment Stance Equity Sector Recommendations
In a March 20 Special Report[1], our China Investment Strategy service presented their framework for estimating Chinese capital outflows, and noted several indicators that we would be monitoring to gauge the risk of another serious episode of capital flight. …
President Donald Trump has threatened to raise tariffs on $250 billion of Chinese imports this Friday. The threat came ahead of a week of meetings in Washington that had been billed as the final round of negotiations. Chinese officials responded to Trump’s…
Feature The U.S.-China trade talks have not yet collapsed but they appear to be reaching a “make it or break it” moment. President Donald Trump renewed his threat of heightening tariffs on Chinese imports on May 5, in the interim between two weeks of shuttle diplomacy in Beijing and next in Washington that have been billed as the final round of negotiations. Chinese officials responded to Trump’s new tariff remarks by threatening to pull out of the talks. The status of the Chinese delegation due in Washington this week is unclear as we go to press. Specifically, President Trump has claimed that he would increase the current 10% tariff rate on $200 billion worth of Chinese imports to 25%, a move that was originally due on March 1, but was delayed to extend the talks and seek a better agreement. Trump also threatened to raise tariffs on the remaining $325 billion of Chinese imports that are so far untouched. This is the most significant escalation in rhetoric since before the tariff truce agreed on December 1 between Trump and Chinese President Xi Jinping in Buenos Aires. True, the threat to increase the tariffs is a last-minute pressure tactic tied to the administration’s attempt to make this week “the final week” of the talks. American advisers have said that at the end of these two weeks they would make a recommendation to the president either to sign a deal or walk away. For this reason, it is not certain that Trump will follow through with the increase. However, we consider the threat credible. The costs of trade war are not prohibitive to the U.S. or China considering the strategic interests at stake in their great power competition (Chart 1). And since December 1, we have argued that a relapse into trade war and rising tariffs was a substantial risk at 30% odds; this threat increases those odds. Chart 1The Era Of U.S.-China Detente Is Over
The Era Of U.S.-China Detente Is Over
The Era Of U.S.-China Detente Is Over
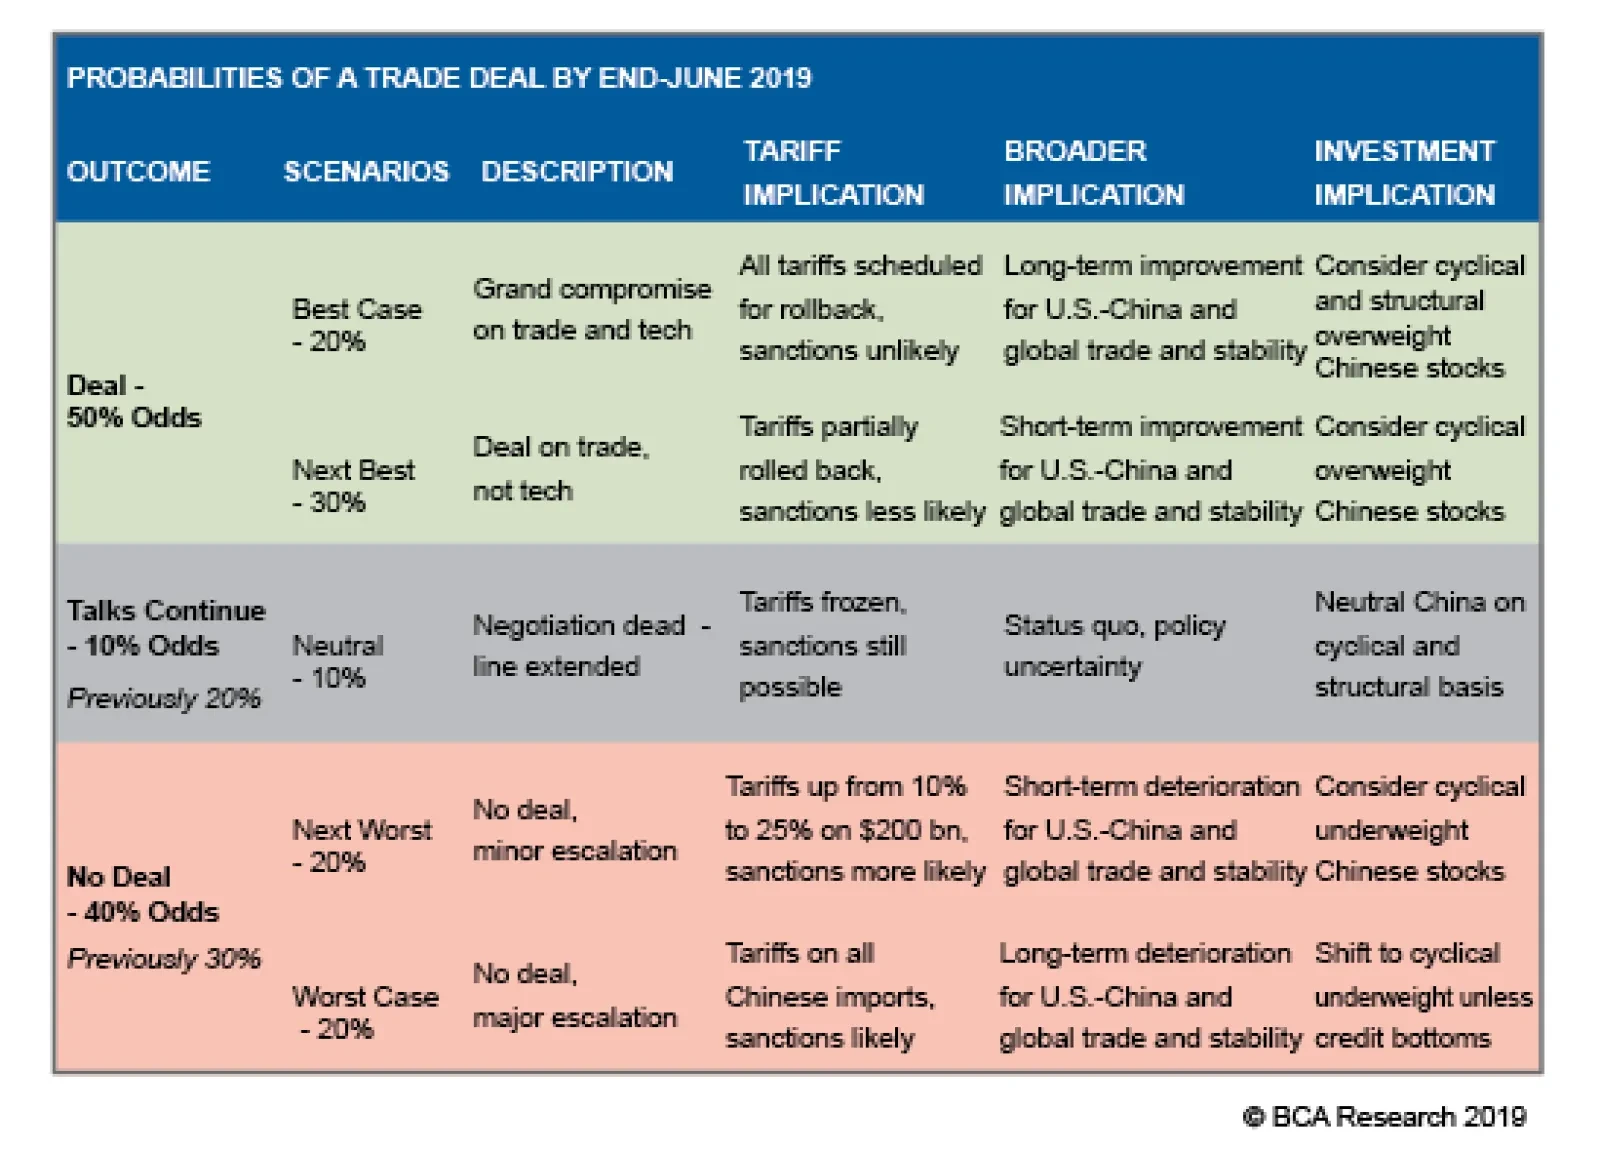
Talks have been deteriorating for the past month at least. First, the trade grievances at the root of the trade war with China – namely corporate espionage, hacking, forced technology transfer, intellectual property theft, and the American-allied restrictions on Chinese telecoms firm Huawei – were always going to be extremely difficult to settle. These are apparently weighing on the ability of Washington and Beijing to close an agreement. Second, tensions have recently flared across the entire range of U.S.-China strategic disagreements, including most importantly North Korea and Iran. In late April, the U.S. demanded that China halt all imports of Iranian oil by the end of May in order to avoid secondary sanctions that, in theory, could affect China’s central bank and other banks. Meanwhile North Korea has conducted two minor but provocative weapon tests (including short-range missiles on May 4) since the failed summit between Trump and Kim Jong Un in Hanoi. Washington expects Beijing to keep North Korea in check and involved in diplomacy as part of the broader strategic negotiation. Taiwan and the South China Sea are also simmering due to U.S.-Taiwan diplomacy and arms sales, Chinese military drills, and the U.S. decision to treat China’s “maritime militia” like its navy. Trump’s latest threat reduces the chances of an extension of the talks beyond June to 10%, while raising the odds of a collapse in talks and escalation of trade war to 40%. As a result of these developments, and the dragging on of talks, we put the odds of a trade deal by the end of June at 50% in our April 10 report. Trump’s latest threat reduces the chances of an extension of the talks beyond June to 10%, while raising the odds of a collapse in talks and escalation of trade war to 40% (Table 1). Table 1Updated Trade War Probabilities (May 2019)
U.S. And China Get Cold Feet
U.S. And China Get Cold Feet
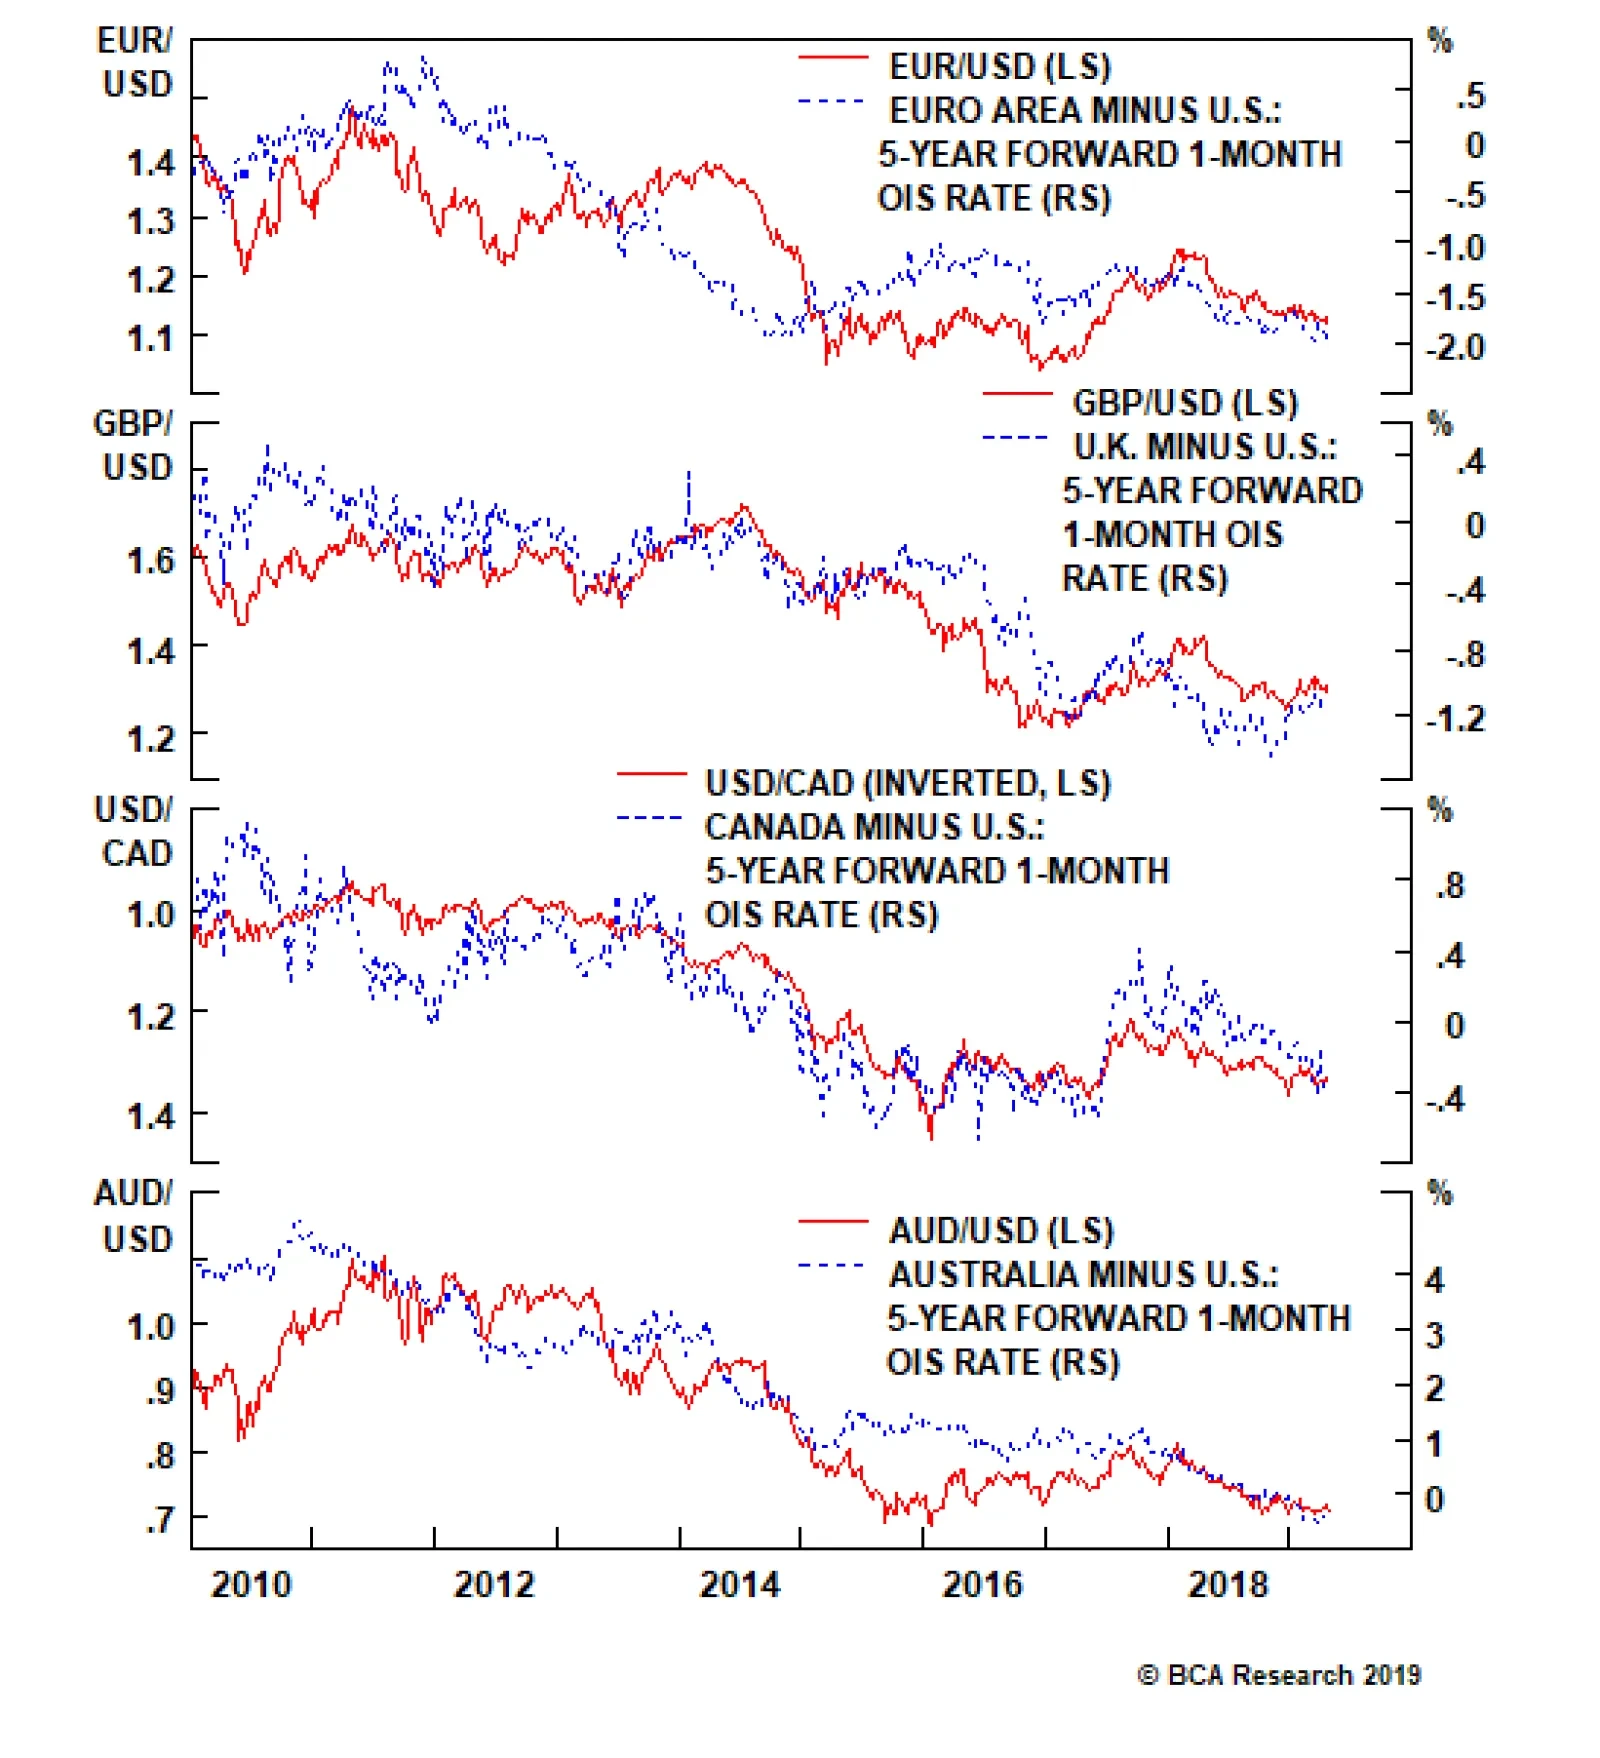
From the Chinese point of view, Trump’s threat makes it harder to clinch a deal. Trump’s use of sweeping, unilateral tariffs on national security grounds has forced China into an awkward position. It is politically and ideologically toxic for Beijing to appear to capitulate to coercion, i.e. nineteenth-century-style tactics of gunboat diplomacy and western imperialism. The tariff truce in Buenos Aires minimized the appearance that China is negotiating under duress, giving Xi Jinping the ability to negotiate and make concessions without losing face. While China is in the weaker position economically, and therefore would prefer a deal, it will batten down the hatches and fight a trade war if forced to do so. The risk of other executive decisions disruptive to markets is going up. The implication for investors is threefold. First, the USD and U.S. equities will continue to outperform global counterparts as trade policy uncertainty shoots back up (Chart 2). The American economy is more insulated from global trade and the dollar is counter-cyclical. But as U.S. equities have rallied and volatility will go up, U.S. equities may simply fall less rapidly than Chinese and others. Chart 2U.S. Will Outperform On Rising Trade Uncertainty
U.S. Will Outperform On Rising Trade Uncertainty
U.S. Will Outperform On Rising Trade Uncertainty
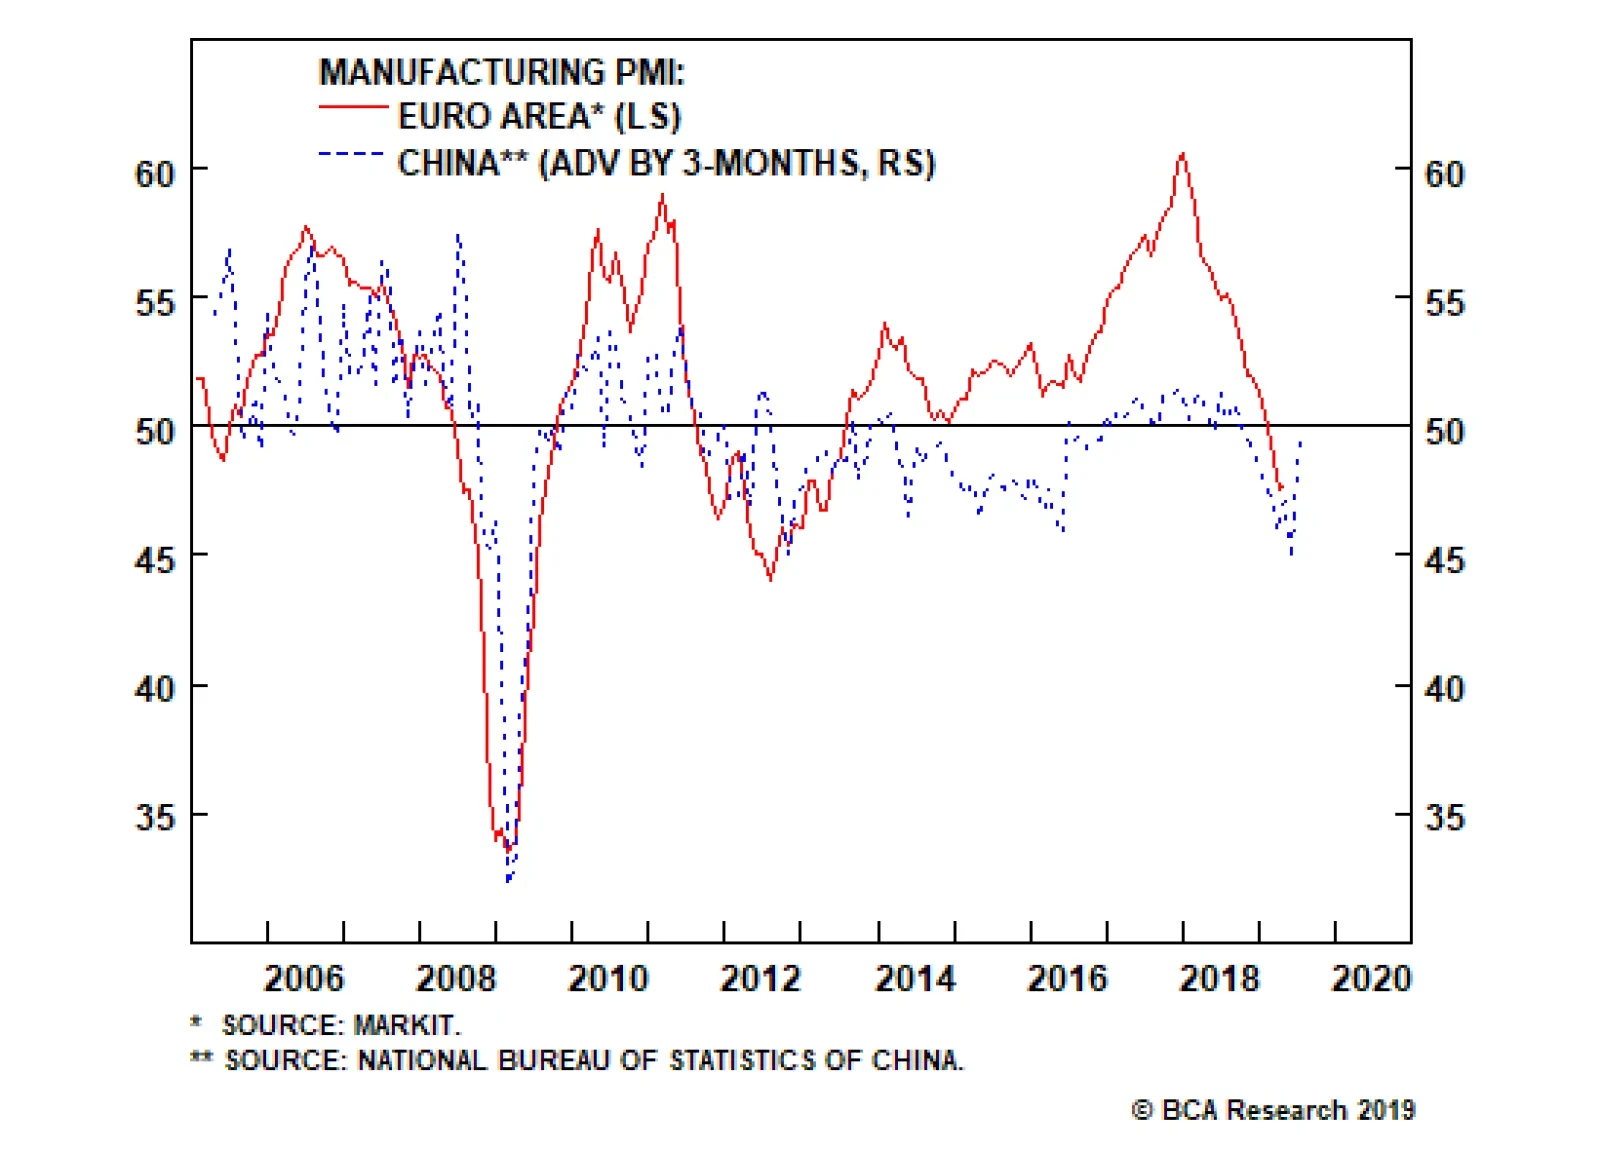
Second, our view that China’s economic stimulus will surprise to the upside is reinforced by this development, as Beijing cannot afford to withdraw or pause stimulus when it still faces such a severe external risk to its manufacturing sector and employment (Chart 3). This will counteract the negative impact to global sentiment and manufacturing expected from any additional tariffs, creating more volatility in commodity and emerging market assets. Third, as we recognized in the case of Trump’s renewed “maximum pressure” tactic on Iran, the president is apparently not concerned with minimizing risks to the economy ahead of the 2020 election. His risk appetite remains voracious. Therefore the risk of other executive decisions disruptive to markets is going up. For instance, our 35% chance that Trump will impose Section 232 tariffs on auto and auto part imports, particularly from Europe, is rising toward 50% (Chart 4). Chart 3China Cannot Afford to Withhold Stimulus
China Cannot Afford to Withhold Stimulus
China Cannot Afford to Withhold Stimulus
Chart 4
Bottom Line: The odds of a re-escalation of the trade war have risen to 40%. American equities should outperform global, while safe-haven assets, such as a portfolio hedge of Swiss bonds and gold, should catch a bid. We are closing out our long copper trade for a loss of 3.58% as well as our long Chinese equities ex-tech trade for a gain of 6.59%. Matt Gertken, Geopolitical Strategist mattg@bcaresearch.com
Feature The U.S.-China trade talks have not yet collapsed but they appear to be reaching a “make it or break it” moment. President Donald Trump renewed his threat of heightening tariffs on Chinese imports on May 5, in the interim between two weeks of shuttle diplomacy in Beijing and next in Washington that have been billed as the final round of negotiations. Chinese officials responded to Trump’s new tariff remarks by threatening to pull out of the talks. The status of the Chinese delegation due in Washington this week is unclear as we go to press. Specifically, President Trump has claimed that he would increase the current 10% tariff rate on $200 billion worth of Chinese imports to 25%, a move that was originally due on March 1, but was delayed to extend the talks and seek a better agreement. Trump also threatened to raise tariffs on the remaining $325 billion of Chinese imports that are so far untouched. This is the most significant escalation in rhetoric since before the tariff truce agreed on December 1 between Trump and Chinese President Xi Jinping in Buenos Aires. True, the threat to increase the tariffs is a last-minute pressure tactic tied to the administration’s attempt to make this week “the final week” of the talks. American advisers have said that at the end of these two weeks they would make a recommendation to the president either to sign a deal or walk away. For this reason, it is not certain that Trump will follow through with the increase. However, we consider the threat credible. The costs of trade war are not prohibitive to the U.S. or China considering the strategic interests at stake in their great power competition (Chart 1). And since December 1, we have argued that a relapse into trade war and rising tariffs was a substantial risk at 30% odds; this threat increases those odds. Chart 1The Era Of U.S.-China Detente Is Over
The Era Of U.S.-China Detente Is Over
The Era Of U.S.-China Detente Is Over
Talks have been deteriorating for the past month at least. First, the trade grievances at the root of the trade war with China – namely corporate espionage, hacking, forced technology transfer, intellectual property theft, and the American-allied restrictions on Chinese telecoms firm Huawei – were always going to be extremely difficult to settle. These are apparently weighing on the ability of Washington and Beijing to close an agreement. Second, tensions have recently flared across the entire range of U.S.-China strategic disagreements, including most importantly North Korea and Iran. In late April, the U.S. demanded that China halt all imports of Iranian oil by the end of May in order to avoid secondary sanctions that, in theory, could affect China’s central bank and other banks. Meanwhile North Korea has conducted two minor but provocative weapon tests (including short-range missiles on May 4) since the failed summit between Trump and Kim Jong Un in Hanoi. Washington expects Beijing to keep North Korea in check and involved in diplomacy as part of the broader strategic negotiation. Taiwan and the South China Sea are also simmering due to U.S.-Taiwan diplomacy and arms sales, Chinese military drills, and the U.S. decision to treat China’s “maritime militia” like its navy. Trump’s latest threat reduces the chances of an extension of the talks beyond June to 10%, while raising the odds of a collapse in talks and escalation of trade war to 40%. As a result of these developments, and the dragging on of talks, we put the odds of a trade deal by the end of June at 50% in our April 10 report. Trump’s latest threat reduces the chances of an extension of the talks beyond June to 10%, while raising the odds of a collapse in talks and escalation of trade war to 40% (Table 1). Table 1Updated Trade War Probabilities (May 2019)
U.S. And China Get Cold Feet
U.S. And China Get Cold Feet
From the Chinese point of view, Trump’s threat makes it harder to clinch a deal. Trump’s use of sweeping, unilateral tariffs on national security grounds has forced China into an awkward position. It is politically and ideologically toxic for Beijing to appear to capitulate to coercion, i.e. nineteenth-century-style tactics of gunboat diplomacy and western imperialism. The tariff truce in Buenos Aires minimized the appearance that China is negotiating under duress, giving Xi Jinping the ability to negotiate and make concessions without losing face. While China is in the weaker position economically, and therefore would prefer a deal, it will batten down the hatches and fight a trade war if forced to do so. The risk of other executive decisions disruptive to markets is going up. The implication for investors is threefold. First, the USD and U.S. equities will continue to outperform global counterparts as trade policy uncertainty shoots back up (Chart 2). The American economy is more insulated from global trade and the dollar is counter-cyclical. But as U.S. equities have rallied and volatility will go up, U.S. equities may simply fall less rapidly than Chinese and others. Chart 2U.S. Will Outperform On Rising Trade Uncertainty
U.S. Will Outperform On Rising Trade Uncertainty
U.S. Will Outperform On Rising Trade Uncertainty
Second, our view that China’s economic stimulus will surprise to the upside is reinforced by this development, as Beijing cannot afford to withdraw or pause stimulus when it still faces such a severe external risk to its manufacturing sector and employment (Chart 3). This will counteract the negative impact to global sentiment and manufacturing expected from any additional tariffs, creating more volatility in commodity and emerging market assets. Third, as we recognized in the case of Trump’s renewed “maximum pressure” tactic on Iran, the president is apparently not concerned with minimizing risks to the economy ahead of the 2020 election. His risk appetite remains voracious. Therefore the risk of other executive decisions disruptive to markets is going up. For instance, our 35% chance that Trump will impose Section 232 tariffs on auto and auto part imports, particularly from Europe, is rising toward 50% (Chart 4). Chart 3China Cannot Afford to Withhold Stimulus
China Cannot Afford to Withhold Stimulus
China Cannot Afford to Withhold Stimulus
Chart 4
Bottom Line: The odds of a re-escalation of the trade war have risen to 40%. American equities should outperform global, while safe-haven assets, such as a portfolio hedge of Swiss bonds and gold, should catch a bid. We are closing out our long copper trade for a loss of 3.58% as well as our long Chinese equities ex-tech trade for a gain of 6.59%. Matt Gertken, Geopolitical Strategist mattg@bcaresearch.com
Highlights The March data brought the first signs of a stabilization in China’s “hard” economic data, albeit from a weak level. The April PMIs disappointed, but they remained in expansionary territory; this is in addition to a continued significant improvement in the trade-related subcomponents of the official survey. Chinese credit growth is unlikely to relapse over the coming year, despite recent investor concerns that Chinese policymakers may dial back their stimulus efforts. The pace of growth may moderate, but halting the uptrend in growth this year would constitute a major policy mistake that we do not expect. Chinese stocks may trend flat-to-down in the very near term as investors await a signed trade deal with the U.S. and further signs of a recovery in activity. Over the next 6-12 months, however, an overweight stance is warranted, barring a major relapse in our leading indicator. Feature Tables 1 and 2 on pages 2 and 3 highlight key developments in China’s economy and its financial markets over the past month. On the growth front, March’s data brought the very first (albeit modest) signs of stabilization in actual Chinese economic activity. While the April manufacturing PMIs released earlier this week disappointed, the trade related components of the official survey continued to improve meaningfully, which implies that an improvement in domestic demand is still early. This conclusion is not particularly surprising given that the first green shoots in the actual data are emerging from a depressed level of activity. Credit growth has only recently picked up, implying that actual activity will strengthen over the coming 6-12 months followed a signed trade deal and a continued (modest) uptrend in credit. Table 1China Macro Data Summary
China Macro And Market Review
China Macro And Market Review
Table 2China Financial Market Performance Summary
China Macro And Market Review
China Macro And Market Review
Within financial markets, the most significant recent development has been that Chinese stocks have sagged somewhat due to concerns that policymakers may meaningfully dial back their stimulus efforts over the coming year. In our view, recent statements from policymakers, as well as the fact that the recovery in activity is only now beginning, underscores that credit growth is unlikely to relapse over the coming year. It may not grow at the breakneck pace observed in the first quarter, but beyond the near-term jitters that this may introduce into the equity market, we do not see it as a threat to an overweight stance towards Chinese stocks over the coming 6-12 months. In reference to Tables 1 and 2, we provide below several detailed observations concerning developments in China’s macro and financial market data: Chart 1 highlights that March brought the first sign of a stabilization in actual Chinese economic activity. When measured on a smoothed basis, the Li Keqiang index itself weakened further in March, but total import growth moved sideways and nominal manufacturing output ticked higher. We noted in our last Macro & Market review that future changes in activity measures were now more likely to reflect actual changes in underlying economic circumstances given that the previously beneficial tariff front-running effect had probably washed out of the data. March’s data confirms this view, and underscores that activity will pickup in the second half of the year. Chart 1The First (Albeit Tentative) Sign Of Economic Stabilization
The First (Albeit Tentative) Sign Of Economic Stabilization
The First (Albeit Tentative) Sign Of Economic Stabilization
Chart 2 shows that the uptrend in our leading indicator for Chinese economic activity is so far modest, but also that it is now at a 2-year high relative to its 12-month moving average. The indicator is being weighed-down by weak money growth (M2 and our definition of M3), even though monetary conditions remain easy and our measures of credit growth picked up sharply in Q1. We doubt that the trend in Chinese money and credit growth can sustainably decouple in a scenario where the latter is sustainably improving, as it would imply that all of the credit improvement was originating from non-bank financial institutions. As such, we expect money growth to catch up to credit growth in the coming months. The annual change in the PBOC’s pledged supplementary lending injection remained in negative territory in March, and both floor space started and sold decelerated modestly further. Construction and sales activity continue to diverge, with the latter still pointing to a further slowdown in the former. We will be updating our Chinese housing outlook in a Special Report next week. April’s Caixin and official manufacturing PMI disappointed, but this overshadowed a continued significant improvement in the new export orders and import components of the official PMI (Chart 3). In our view, this is consistent with a stabilization in the export outlook, but implies that Chinese domestically-oriented manufacturing activity is not yet booming. Nonetheless, a signed trade deal, improving importer/exporter sentiment, and an uptrend in credit growth still implies that activity will pick up meaningfully later in the year. Chart 2Our Leading Indicator Is Now Modestly Trending Higher
Our Leading Indicator Is Now Modestly Trending Higher
Our Leading Indicator Is Now Modestly Trending Higher
Chart 3Trade-Related Components Of The Official PMI Continue To Rise
Trade-Related Components Of The Official PMI Continue To Rise
Trade-Related Components Of The Official PMI Continue To Rise
Over the past month, Taiwanese and domestic Chinese stocks have been the best performers within “Greater China”, relative to the MSCI Hong Kong index, the MSCI China index, and the Hang Seng China Enterprises index. The latter in particular has lagged other Chinese equity indexes since late-March (Chart 4), and may be due for a catch-up. Over the nearer-term, Chinese stocks, especially the domestic market, have sagged due to concerns that Chinese policymakers may meaningfully dial back their stimulus efforts over the coming year. We discussed this risk in our April 17thWeekly Report,1 and noted that while we expected credit growth to moderate somewhat, a more meaningful slowdown, particularly if coupled with signals from policymakers that a much slower pace of growth is desired, could pose a risk to our overweight equity stance. The April manufacturing PMIs disappointed, but the trade-related components of the official survey continued to improve meaningfully. In our view, recent statements from policymakers, particularly from PBOC Deputy Governor Liu Guoqiang,2 underscores that credit growth is unlikely to relapse over the coming year; it will simply not be growing at the breakneck pace observed in the first quarter. Beyond the near-term jitters that this may introduce into the equity market, we do not see it as a threat to an overweight stance towards Chinese stocks over the coming 6-12 months. Chart 5 highlights that Chinese consumer stocks have been the clear winners since the beginning of the year, particularly in the domestic market. Consumer stocks, including staples, sold off substantially in 2H2018 as investors responded to shockingly weak consumer spending data. Stimulus measures targeted to Chinese households, along with a meaningful improvement in some measures of consumer spending, has helped restore investor confidence in consumer stocks (which had previously been viewed as a bullish “no-brainer” structural trade). Chart 4Is An H-Share Catchup##br## Looming?
Is An H-Share Catchup Looming?
Is An H-Share Catchup Looming?
Chart 5Chinese Consumer Stocks Have Been On Fire
Chinese Consumer Stocks Have Been On Fire
Chinese Consumer Stocks Have Been On Fire
The sharp rise in the 7-day interbank repo rate in April fed concerns among equity investors that Chinese policymakers might be in the process of paring back their stimulus efforts. However, as Chart 6 shows, China’s 7-day repo rate is extraordinarily volatile, and is affected by a variety of seasonal and technical factors. The chart shows that a 1-month moving average of the 7-day repo rate is broadly in line with the level that has prevailed over the past 9 months. In addition, the 3-month repo rate (which we have argued has been a more informative predictor of China’s monetary policy stance) remains well on the low end of its range over the past year. In short, despite investor concerns, Chinese interbank repo rates are not signaling a change in China’s monetary policy stance. Tighter monetary policy is not in the cards for this year. After having risen noticeably in late-March, Chinese onshore corporate bond spreads have fallen back to the low end of their trading range over the past 8 months. We continue to recommend that domestic investors hold a diversified portfolio of SOE corporate bonds, on the basis that actual bond defaults over the coming 6-12 months are likely to be materially lower than what investors are pricing in even though they are indeed likely to rise. Chart 7 shows that USD-HKD has eased somewhat over the past month from the top end of the band, and now trades closed at 7.845. This modest appreciation in HKD appears to have been catalyzed by a further reduction in the supply of interbank liquidity by the HKMA. While the appreciation in HKD is some modest good news for Hong Kong’s monetary authority, it remains reluctant to reduce liquidity in the system given how extremely weak loan growth is in Hong Kong. This implies that, barring a meaningful upturn in credit, a significant appreciation in HKD is not likely in the cards. Chart 6Interbank Repo Rates Are Not Trending Higher
Interbank Repo Rates Are Not Trending Higher
Interbank Repo Rates Are Not Trending Higher
Chart 7A Modest Appreciation In HKD (Which Is Not Likely To Continue)
A Modest Appreciation In HKD (Which Is Not Likely To Continue)
A Modest Appreciation In HKD (Which Is Not Likely To Continue)
Jonathan LaBerge, CFA, Vice President Special Reports jonathanl@bcaresearch.com Footnotes 1 Please see China Investment Strategy Weekly Report “In The Wake Of An Upgrade: An Investment Strategy Post-Mortem,” dated April 17, 2019, available at cis.bcaresearch.com 2 During a PBOC briefing on April 25, Deputy Governor Guoqiang noted that “no one can bear it if policy swings back and forth between tightening and loosening many times a year”. Cyclical Investment Stance Equity Sector Recommendations
It’s official, the Italian technical recession is over. Italian GDP growth moved back into positive territory in the first quarter. Additionally, Spanish GDP growth rebounded to 0.7% on a quarterly basis, or 2.4% year-on-year. Thanks to those two surprises,…
European domestic demand should benefit from an easing of fiscal policy of around 0.5% of GDP. Faster growth in the U.S. in relation to the euro area has caused the spread in expected interest rates to widen between the two regions. The spread in…
The upturn we anticipated in China’s industrial output in the wake of fiscal and monetary stimulus is becoming more visible. Accommodative central banks, along with a likely resolution of the Sino – U.S. trade war, will continue to be positive for Chinese growth, which will bolster trade and commodity demand in general, base metals’ demand in particular. However, not all base metals will benefit equally from this fortuitous confluence of fiscal and monetary stimulus, and the renewed credit growth directed at China’s small and mid-sized enterprises (SMEs). Of the metals we follow, copper likely will benefit most from Chinese stimulus and the knock-on effects from increased trade, with aluminum running a close second. Zinc and nickel will not enjoy as much of a lift, based on our analysis. We are adding a tactical long aluminum position to our open long copper position. Highlights Energy: Overweight. The Trump administration’s decision to let waivers expire on U.S. oil-export sanctions leveled on Iran will give OPEC 2.0 greater control over the Brent forward curve. In the near term, markets will not tighten sharply. However, longer term, the continued loss of Iran’s and Venezuela’s exports, further increases in Libyan tensions and unplanned outages will lift the odds refiners will have to draw inventories harder than expected going into the high-demand Northern Hemisphere summer. We expect this to backwardate the Brent curve further, and accelerate the full backwardation of the WTI forward curve. Presently, OPEC 2.0 holds ~ 1.5mm b/d of ready spare capacity, due to recent production cuts made to drain global inventory. There is ~ 1.5mm b/d of additional spare capacity in the Kingdom of Saudi Arabia (KSA) that would take longer to bring on line. The ready spare capacity can cover the ~ 1.3mm b/d or so that could be removed by the Iran waivers’ expiration. But, with global commodity demand remaining robust (see base metals analysis below), further unplanned outages – on top of the falling Venezuelan output and mounting tensions in Libya – will stress the supply side of the market. KSA this week communicated it would coordinate with other producers to keep oil markets balanced.1 Russia’s recent threat to reignite a market-share war also reminded the market OPEC 2.0 has capacity it can quickly bring to the market should it choose to do so. The expiration of waivers on the Iran export sanctions strengthens OPEC 2.0’s hand by allowing it to calibrate the rate of growth in flowing oil supply at a level that forces refiners and traders to draw inventory. The growing backwardation will lift implied volatilities in crude and products markets. Iran’s reaction remains to be seen.2 This geopolitical uncertainty also will contribute to price volatility as well. We will be publishing a Special Report on the implications of the Trump administration’s waivers decision next week with our colleagues at BCA’s Geopolitical Strategy. Base Metals: Neutral. We expect copper to benefit from Chinese fiscal and monetary stimulus, moreso than the other base metals we follow (aluminum, nickel and zinc). We explore this in depth below. Precious Metals: Neutral. Gold prices continue to face downward pressures, the latest coming from Venezuela’s sale of ~ $400 million worth of the metal (~ 9 tons) last week, despite international sanctions.3 Going forward, China’s credit stimulus should revive global growth, which will negatively affect the counter-cyclical U.S. dollar. Our Global Investment strategists closed their long U.S. dollar recommendation last week. This will support gold in the 2H19. Feature The evolution of China’s credit cycle is key to our base-metals view, and integral to our high-conviction call commodity demand will surprise to the upside. Globally, the real economy is once again finding its groove. Maybe not as groovy as 2017, but still better than 2018. China is implementing tax cuts amounting to almost $300 billion (~ 2 trillion RMB), and loosening the credit screws that last year ground economic activity lower.4 Central banks around the world either are accommodative, or are not aggressively tightening. The evolution of China’s credit cycle is key to our base-metals view, and integral to our high-conviction call commodity demand will surprise to the upside beginning in the current quarter and extending into 2H19. And China’s credit growth has been stout this year. Aggregate China financing came in stronger than expected for March, registering a 12.3% year-over-year gain, versus an increase of 11.6% in February, based on calculations made by our colleagues in BCA’s Global Investment Strategy (GIS) service.5 The pick-up in the rate of growth – the so-called credit impulse – typically leads the import component of China’s manufacturing PMI, according to our GIS colleagues. This is good news for firms exporting to China, as well, as it indicates industrial activity ex-China also will pick up as fiscal and monetary stimulus take hold in the Middle Kingdom. So, putting it together: China’s fiscal and monetary stimulus will radiate outward to EM markets generally and DM export-oriented economies, which will lift base metals markets generally. China’s demand still dominates global demand, which means it also impacts prices globally (Chart of the Week).
Chart 1
Base Metals Sensitivity To Fundamental Information Given its importance to global growth, we again look at China’s effect on base metals prices – via demand – by ranking the metals we closely follow based on their sensitivity to China’s industrial activity and credit, along with our BCA Global Industrial Activity (GIA) Index. Table 1 shows the relationships between the year-on-year (y/y) percent changes in base metals, and the LME index versus the big correlates we have identified over the years with these metals: BCA’s GIA Index, our China credit policy gauge, China construction proxy, internally developed risky-versus-safe haven currency ratio and the Li Keqiang Index (LKI) of domestic Chinese industrial activity. We look at these from 2000 to now, and in the post-GFC period (2010 to now). Table 1Correlations Of Base Metals’ Prices (y/y % Change) Vs. Key Economic Variables
Copper Will Benefit Most From Chinese Stimulus
Copper Will Benefit Most From Chinese Stimulus
Two things stand out in this analysis: The GIA index, which is heavily weighted to EM demand, is a key driver for all of the LME base metals prices, and the LME Index itself;6 Copper is the most sensitive to all of these variables vs. the other base metals. The LME Index (LMEX) is the next-most-sensitive gauge. In the case of the latter, it likely is copper’s weight in the index driving this result (copper is 31.2% of the LMEX), and the fact that other metals tend to follow copper’s lead. Post-GFC, the correlations with BCA’s GIA index, our China Construction proxy and the LKI index all become stronger, suggesting rising Chinese demand and the global quantitative easing have had a fundamental effect on base metals prices. The weakening of the correlations once the analysis moves beyond copper and the LMEX indicates either the other base metals are not processing information from the market – supply-demand fundamentals and global monetary data – or these commodities’ fundamentals are more opaque than those available from the copper market. The other outstanding feature of this analysis is that post-GFC, the correlations with BCA’s GIA index, our China Construction proxy and the LKI index all become stronger, suggesting rising Chinese demand and the global quantitative easing have had a fundamental effect on base metals prices. We will be examining this in future research. Bottom Line: China’s impact on base metals prices is complex. Its internal demand obviously is significant, which is not unexpected for the market that accounts for ~ 50% of base metals demand globally. We also see evidence China’s economy influences EM ex-China, and DM economies – most likely those heavily reliant on exports to China. Fiscal and monetary stimulus in China will radiate outward and influence global growth – in EM and DM economies. This is a positive fundamental for base metals. Robert P. Ryan, Chief Commodity & Energy Strategist rryan@bcaresearch.com Hugo Bélanger, Senior Analyst Commodity & Energy Strategy HugoB@bcaresearch.com Appendix: Global Base Metals Balances
Image
Image
Image
Image
Footnotes 1 Please see “Saudi Arabia says to coordinate with other producers to ensure adequate oil supply,” published by reuters.com April 22, 2019. 2 According to the state-run Fars news agency, Iran’s head of the Revolutionary Guard Corps Navy force threatened it will close the Strait of Hormuz if the country is prevented from using it. Please see “Iran Raises Stakes in U.S. Showdown With Threat to Close Hormuz,” published April 22, 2019 by bloomberg.com. 3 Please see “Venezuela Is Said to Sell $400 Million in Gold Amid Sanctions,” published April 15, 2019 by bloomberg.com. 4 We added a measure of China’s credit cycle to our Global Industrial Activity (GIA) index last month. We noted China’s credit cycle was showing signs of bottoming. We now are expecting to see growth in the current quarter. Please see “Bottoming Of China’s Credit Cycle Bullish For Copper Over Near Term,” published by BCA Research’s Commodity & Energy Strategy March 14, 2019. It is available at ces.bcaresearch.com. 5 GIS’s aggregate financing measure excludes equity financing and other items but includes local government bond issuance. Please see “Chinese Debt: A Contrarian View,” published by BCA Research’s Global Investment Strategy April 19, 2019. It is available at gis.bcaresearch.com. 6 This is because the index is constructed to be sensitive to EM industrial-commodity demand growth. Please see “Oil, Copper Demand Worries Are Overdone,” where we introduce and discuss the GIA index. The article was published February 14, 2019, in BCA Research’s Commodity & Energy Strategy. It is available at ces.bcaresearch.com. Investment Views and Themes Recommendations Strategic Recommendations Tactical Trades TRADE RECOMMENDATION PERFORMANCE IN 2019 Q1
Image
Commodity Prices and Plays Reference Table Trades Closed in 2019 Summary of Closed Trades
Image