China
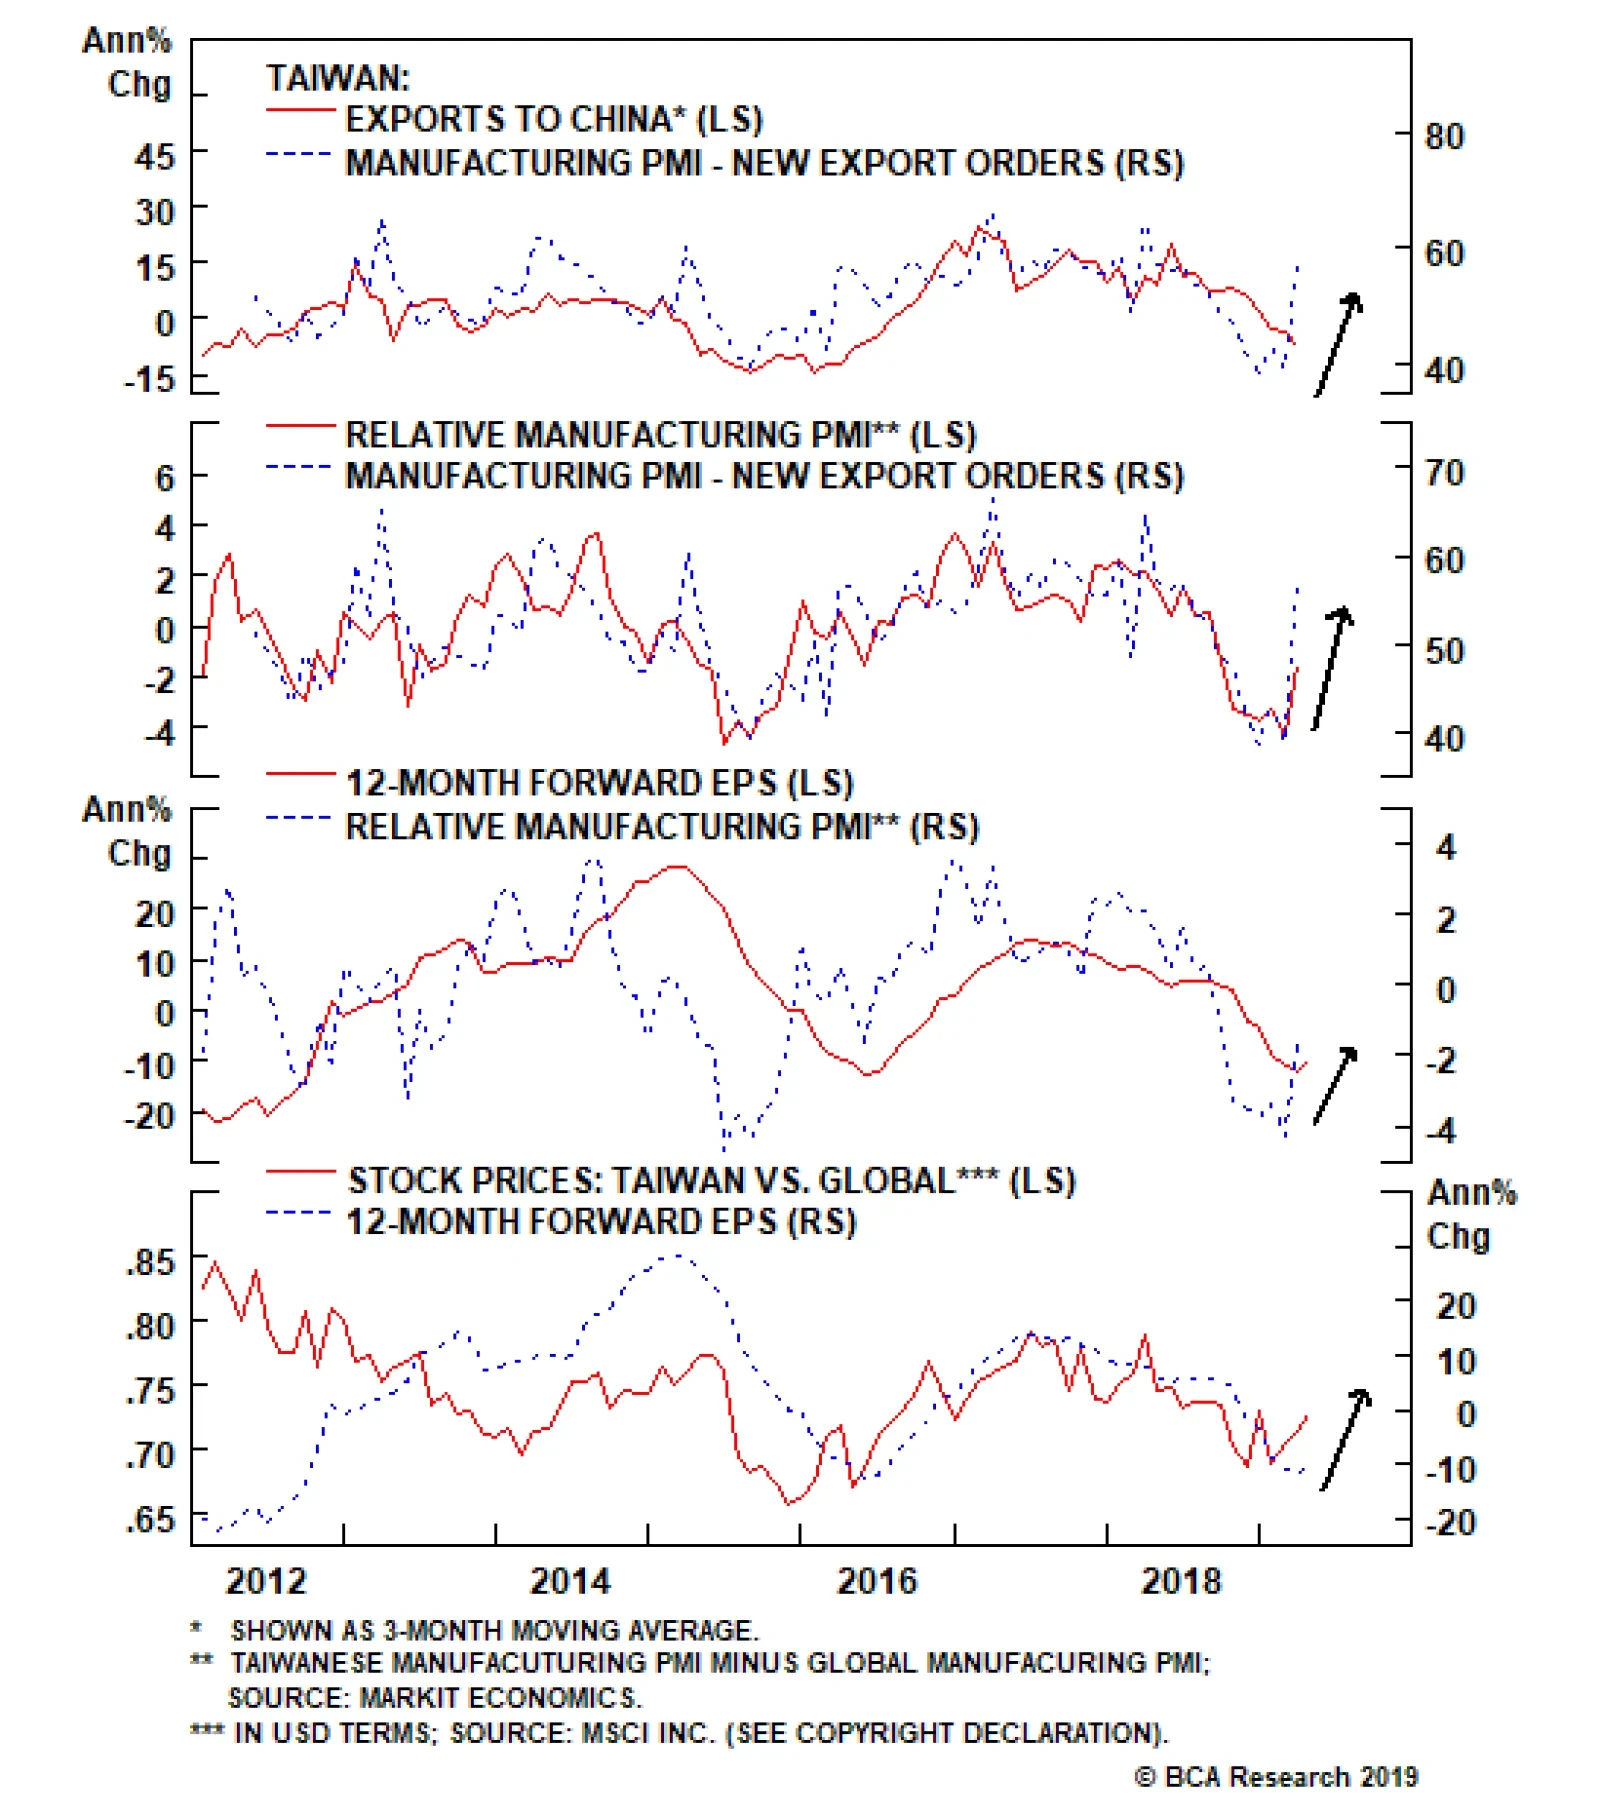
Taiwanese relative performance already reflects some expected improvement in Chinese growth, but we believe that investors stand to gain further over the coming year. The chart above presents the cyclical case for Taiwanese stocks in a nutshell. Panels 1…

Highlights The short-term trade is to overweight the DAX or Euro Stoxx 50… …versus German bunds or the S&P 500. These trades have outperformed since late last year and can continue to do so for a while longer. But moving into the second half of the year, it will be time to take profits in these growth-sensitive trades. The long-term position is to own German real estate equities. The hedged position is long German real estate equities, short Swedish real estate equities. Feature Let’s begin with a trivia question. What do Germany, Finland, and Ireland have in common, that the other EU28 countries do not have? Chart of the WeekEuro Stoxx 50 Vs. S&P500 And EM Vs. DM Have Followed Near Carbon Copy Profiles
Euro Stoxx 50 Vs. S&P500 And EM Vs. DM Have Followed Near Carbon Copy Profiles
Euro Stoxx 50 Vs. S&P500 And EM Vs. DM Have Followed Near Carbon Copy Profiles
The answer: Germany, Finland, and Ireland are the only three European countries that have a trade surplus with China.1 Germany Catches A Cold When China Sneezes… Chart 2Slowdown In Germany And Finland, No Slowdown In France And Spain
U.S. GDP Growth Slowed By 1.5 Percent Slowdown In Germany And Finland, No Slowdown In France And Spain
U.S. GDP Growth Slowed By 1.5 Percent Slowdown In Germany And Finland, No Slowdown In France And Spain
Germany and Finland are the European economies most exposed to China, with 17 percent and 14 percent respectively of their extra-EU28 exports heading to the dominant emerging economy (for Ireland it is only 7 percent). This equates to almost 3 percent of GDP for Germany and around 1.5 percent for Finland. Hence, when China sneezes – as it did last year – Germany and Finland are the European economies most likely to catch a cold. It is not a coincidence that Germany and Finland suffered near identical short-term slowdowns in 2018 with the pain focussed in the third quarter. By contrast, the European economies with much less exposure to China – say, France and Spain – suffered no discernible slowdown (Chart I-2). In fact, Spain seemed completely unaffected, growing at a steady and robust 2 percent clip throughout 2018! The corollary is that when China rebounds – as it has recently – Germany and Finland are the European countries most likely to benefit. Since early January, Germany’s DAX has outperformed the 10-year German bund by 15 percent. For the past three months, the DAX has also outperformed the S&P 500, albeit modestly. The trends can continue for a while, but be warned: these short-term cyclical moves are likely to reverse later in the year, perhaps viciously. More about this later. …But Germany’s Structural Growth Model Has Changed Germany’s gross exports of €1.6 trillion equate to almost half of its €3.4 trillion economy. Inevitably, this makes the German economy highly vulnerable to down-oscillations in global growth as, for example, when China sneezes. But here’s the paradox: while the level of German exports is very high, it has been flat-lining at this elevated level since 2012 (Chart I-3). Hence, Germany is no longer deriving any structural growth from its export sector. All of Germany’s post-2012 structural growth has come from domestic demand. Germany’s structural growth model has changed. Through 1999-2007, Germany’s net export contribution accounted for the vast majority of its structural growth; and in 2008, net exports accounted for two-thirds of Germany’s severe economic contraction. But remarkably, since 2012, net exports have made no contribution to Germany’s structural growth (Chart I-4). Meaning that all of Germany’s post-2012 structural growth has come from domestic demand. Chart 3The Level Of German Exports Is High But Flat-Lining
The Level Of German Exports Is High But Flat-Lining
The Level Of German Exports Is High But Flat-Lining
Chart 4Since 2012, Net Exports Have Made No Contribution To Germany's Structural Growth
Since 2012, Net Exports Have Made No Contribution To Germanys Structural Growth
Since 2012, Net Exports Have Made No Contribution To Germanys Structural Growth
One manifestation of this is the post-2012 recovery in Germany’s real estate market. When Germany was deriving most of its growth from external demand, the domestic real estate market withered. In recent years, when growth has come from domestic demand, Germany’s real estate market has started to flourish (Chart I-5). Chart 5German Real Estate Prices Still Need To Catch Up
German Real Estate Prices Still Need To Catch Up
German Real Estate Prices Still Need To Catch Up
Chart 6German Real Estate Book Values Have Trebled
German Real Estate Book Values Have Trebled
German Real Estate Book Values Have Trebled
With Germany’s average house price, in real terms, at the same level as it was in 1995, there is still considerable upside outside the major cities such as Berlin, Frankfurt, and Munich. Especially so, because one of the main enemies of the real estate market – substantially higher bond yields – will be absent for some time.2 The strong performance of German real estate equities – a near trebling since 2012 – is just tracking the strong performance of their book values (Chart I-6), which itself is a leveraged function of real estate prices. On the basis that the real estate sector is benefiting from a structural tailwind, the sector is a long-term hold, but for those who want to hedge their exposure, the recommendation is: long German real estate equities, short Swedish real estate equities. What Is Driving Euro Stoxx Outperformance? In response to this week’s title question, some people will ask: has Euro Stoxx 50 outperformance even started? The answer is a clear yes. Relative to both global equities and the S&P 500, the Euro Stoxx 50 has been in a well-established – though modest – uptrend since last September. Interestingly, emerging markets (EM) versus developed markets (DM) has followed a near carbon copy profile, albeit the outperformance was front-end loaded (Chart of the Week and Chart I-7). Euro Stoxx 50 has been gently outperforming. Can this continue? Recent history is not very encouraging. Since the Global Financial Crisis, no bout of Euro Stoxx 50 outperformance has lasted more than a year (Chart I-8). If this pattern continues to hold, it implies that the current bout of Euro Stoxx 50 outperformance will be exhausted within another four months. Chart 7Euro Stoxx 50 Has Been Gently Outperforming
Euro Stoxx 50 Has Been Gently Outperforming
Euro Stoxx 50 Has Been Gently Outperforming
Chart 8Euro Stoxx 50 Vs. S&P500 ##br##Follows…
Euro Stoxx 50 Vs. S&P500 Follows
Euro Stoxx 50 Vs. S&P500 Follows
Chart 9…Euro Area Banks Vs. U.S. Tech
Euro Area Banks Vs. U.S. Tech
Euro Area Banks Vs. U.S. Tech
Could it be different this time? We think not. Euro Stoxx 50 performance relative to the S&P 500 lines up almost perfectly with the relative performance of euro area banks versus U.S. tech (Chart I-9). Given that this defines the sector skew ‘fingerprint’ of the relative position, this defining relationship is fundamental. Meaning that for the Euro Stoxx 50 to outperform the S&P 500 on a sustained basis, euro area banks have to outperform U.S. tech. Likewise, EM versus DM lines up almost perfectly with the relative performance of global resources versus global healthcare (Chart I-10 and Chart I-11). Again, this is not surprising as this just defines the sector skew fingerprint of EM versus DM. Admittedly, in this case the causality could sometimes run from the EM economy to the sector performance – given China’s role in driving resource demand – rather than from sector relative performance to EM versus DM. Nevertheless, for EM to outperform DM, resources have to outperform healthcare. EM versus DM lines up almost perfectly with the relative performance of global resources versus global healthcare. Since last autumn, Euro Stoxx 50 versus S&P 500 and EM versus DM have followed near carbon copy profiles because growth-sensitive financials and resources have outperformed less growth-sensitive technology and healthcare. Chart 10EM Vs. DM Follows…
10. EM Vs. DM Follows
10. EM Vs. DM Follows
Chart 11…Basic Resources Vs. Healthcare
Basic Resources Vs. Healthcare
Basic Resources Vs. Healthcare
From Sweet Spot To Weak Spot Nevertheless, there is a puzzle: why have growth-sensitive sectors, the DAX, Euro Stoxx 50, and EM outperformed since late last year when the high-profile hard economic data – such as GDP growth and CPI inflation – have been unambiguously weak? High-profile hard data are a record of what happened in the past. The simple answer is that these high-profile hard data are a record of what happened in the past, sometimes the distant past. Yet they matter because central banks’ increasingly ‘data dependent’ reaction functions have become slaves to this backward-looking data. Here’s the paradox: the ‘sweet spot’ for growth-sensitive sectors and markets is when the high-profile backward-looking data – GDP and inflation – are actually weak, while real-time measures of growth – such as short-term credit impulses – are strengthening. This creates a win-win for markets because the dovish pivot by data-dependent central banks lifts asset valuations and the acceleration in real-time growth lifts profit expectations. Sound familiar? It describes the situation since last autumn, and explains why the DAX, Euro Stoxx 50, and EM have outperformed. Now comes the unfortunate corollary: the ‘weak spot’ for growth-sensitive sectors and markets is when the high-profile backward-looking data are strong, while real-time measures of growth – such as short-term credit impulses – are weakening. This is a lose-lose for markets because the hawkish pivot by central banks weighs on asset valuations and the deceleration in real-time growth depresses profit expectations. Almost certainly, this will be the situation later in the year as the high-profile hard data starts to perk up – removing some of the central bank support for valuations – just as short-term credit impulses inevitably roll over – weighing on profit growth expectations. To sum up, growth-sensitive sectors, the DAX, and Euro Stoxx 50 have outperformed since late last year, especially versus bonds and cash – in line with our house view. These trends can continue for a while longer. But moving into the second half of the year, these growth-sensitive positions will transition from sweet spot to weak spot, and it will be time to take profits. As ever, we will tell you when. Stay tuned. Dhaval Joshi, Chief European Investment Strategist dhaval@bcaresearch.com Fractal Trading System* This week, we note that that the 65-day fractal dimension for technology versus healthcare is at an all-time low – implying that the recent strong outperformance is highly vulnerable to a technical reversal. Accordingly, this week’s recommended trade is short technology versus healthcare with a profit target of 6.5 percent and a symmetrical stop-loss. In other trades, we are pleased to report that long aluminium versus tin achieved its 6.5 percent profit target at which it was closed. This leaves five open positions. For any investment, excessive trend following and groupthink can reach a natural point of instability, at which point the established trend is highly likely to break down with or without an external catalyst. An early warning sign is the investment’s fractal dimension approaching its natural lower bound. Encouragingly, this trigger has consistently identified countertrend moves of various magnitudes across all asset classes. Chart I-10
Short Tech Versus Healthcare
Short Tech Versus Healthcare
The post-June 9, 2016 fractal trading model rules are: When the fractal dimension approaches the lower limit after an investment has been in an established trend it is a potential trigger for a liquidity-triggered trend reversal. Therefore, open a countertrend position. The profit target is a one-third reversal of the preceding 13-week move. Apply a symmetrical stop-loss. Close the position at the profit target or stop-loss. Otherwise close the position after 13 weeks. Use the position size multiple to control risk. The position size will be smaller for more risky positions. * For more details please see the European Investment Strategy Special Report “Fractals, Liquidity & A Trading Model,” dated December 11, 2014, available at eis.bcaresearch.com. Footnotes 1 Based on the EU28 net exports of goods to China in 2018 by Member State. 2 Please see the European Investment Strategy Weekly Report ‘Monetarists, Keynesians, And Modern Monetary Theory’ April 11 2019 available at eis.bcaresearch.com. Recommendations Asset Allocation Equity Regional and Country Allocation Equity Sector Allocation Bond and Interest Rate Allocation Currency and Other Allocation Closed Fractal Trades Trades Closed Trades Asset Performance Currency & Bond Equity Sector Country Equity Indicators Bond Yields Chart II-1Indicators To Watch - Bond Yields
Indicators To Watch - Bond Yields
Indicators To Watch - Bond Yields
Chart II-2Indicators To Watch - Bond Yields
Indicators To Watch - Bond Yields
Indicators To Watch - Bond Yields
Chart II-3Indicators To Watch - Bond Yields
Indicators To Watch - Bond Yields
Indicators To Watch - Bond Yields
Chart II-4Indicators To Watch - Bond Yields
Indicators To Watch - Bond Yields
Indicators To Watch - Bond Yields
Interest Rate Chart II-5Indicators To Watch - Interest Rate Expectations
Indicators To Watch - Interest Rate Expectations
Indicators To Watch - Interest Rate Expectations
Chart II-6Indicators To Watch - Interest Rate Expectations
Indicators To Watch - Interest Rate Expectations
Indicators To Watch - Interest Rate Expectations
Chart II-7Indicators To Watch - Interest Rate Expectations
Indicators To Watch - Interest Rate Expectations
Indicators To Watch - Interest Rate Expectations
Chart II-8Indicators To Watch - Interest Rate Expectations
Indicators To Watch - Interest Rate Expectations
Indicators To Watch - Interest Rate Expectations
3. Chinese Debt Growth Is Sustainable Much of China’s debt stock is composed of state-owned enterprise, local government, and other forms of quasi-public sector debt. Credit policy in China is often indistinguishable from fiscal policy. Given the abundant…
Long-term investors should steer clear of any growth-sensitive assets. It is a seductive argument. But our Global Investment Strategy service argues that it is wrong. Chinese re-leveraging is: 1) inevitable; 2) desirable; and 3) sustainable. 1. Chinese…
In reality, however, economic and especially financial market mini-cycles are not symmetric, and investors can make money only if they time them properly. In fact, this decade Chinese share prices – both in absolute terms and relative to global stocks – have…
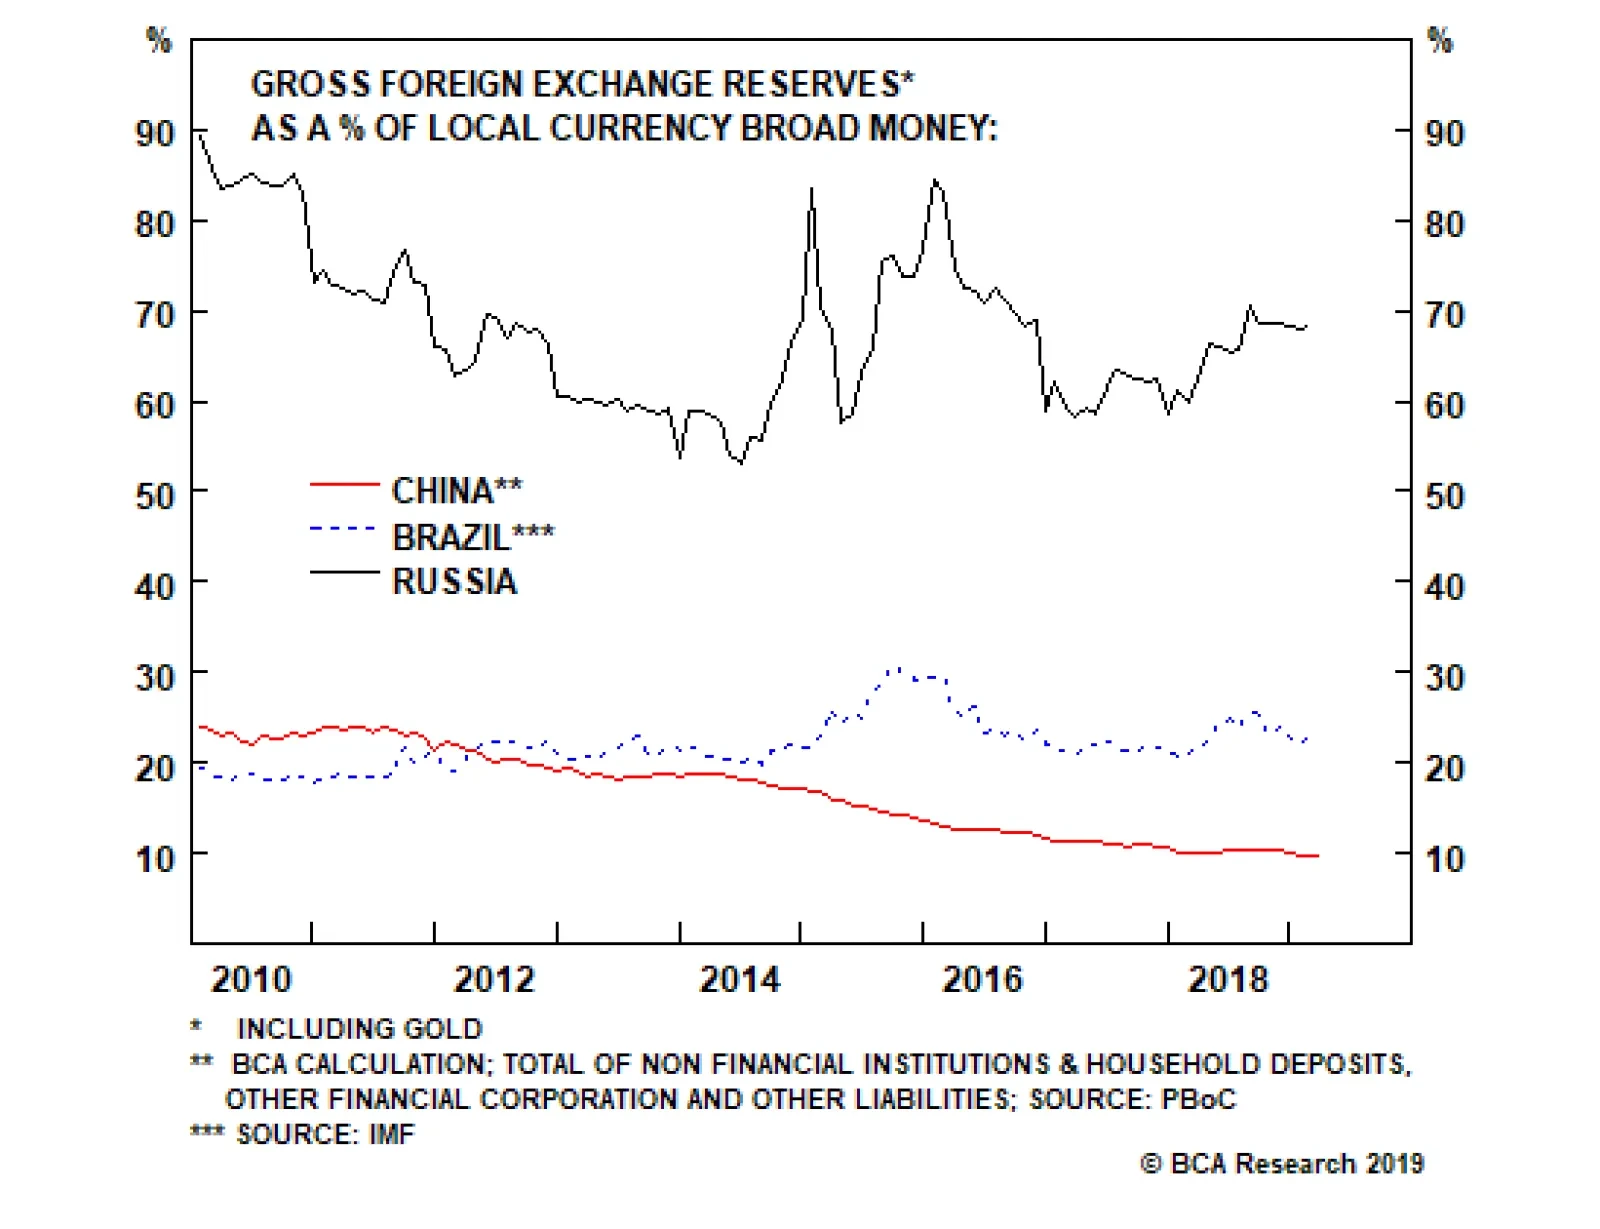
Chinese households and businesses are eager to diversify their copious and mushrooming renminbi deposits into foreign currencies and assets. The PBoC’s foreign exchange reserves of $3 trillion are equal to only 10% of the amount of yuan deposits and cash in…
China holds the world record with respect to corporate sector leverage. Households in China are more leveraged than those in the U.S. Given that borrowing costs for households are higher in China than in the U.S., interest payments take up a larger share of…
Highlights Chinese credit origination surpassed expectations in March. Credit growth is now clearly trending higher, and the latest data suggest that economic activity is rebounding. This bodes well for global growth. The conventional wisdom is that China’s releveraging efforts represent “short-term gain for long-term pain.” We disagree. For the most part, Chinese releveraging is inevitable, desirable, and sustainable. Credit growth is inevitable because rising debt is necessary for transforming the country’s copious savings into fixed-asset investment. It is desirable for ensuring that GDP growth stays close to trend. It is broadly sustainable because the interest rate at which the government and much of the private sector are able to borrow is well below the economy’s growth rate. In fact, under a plausible set of assumptions, faster credit growth in China could lead to a lower debt-to-GDP ratio. Stronger global growth later this year should weaken the U.S. dollar. We are closing our long DXY trade for a carry-adjusted gain of 16.4% and exiting our long USD/CNY trade for a loss of 3.1%. We are also taking profits on our short AUD/CAD, short EUR/CAD, and short EUR/RUB trades of 1.6%, 3.9%, and 8.6%, respectively, and initiating two new currency trades: short USD/RUB and long EUR/JPY. The combination of a weaker dollar and faster Chinese growth should benefit EM and European stocks. Gold hit our limit buy order of $1275/ounce and we are now long the yellow metal. Feature A Blockbuster Month For Chinese Credit Growth After turning cautious for about six months, we moved back to being bullish on global equities in late December. We also sold our put on the EEM ETF on January 3rd for a gain of 104% in anticipation of a wave of Chinese credit stimulus. Credit growth blew past expectations in January, but surprised on the downside in February. This made the March release particularly important. In the end, the March data did not disappoint those who were hoping for a solid reading. New CNY loans rose by RMB 1690 billion, above Bloomberg consensus estimates of RMB 1250 billion. Our adjusted aggregate financing measure, which excludes a number of items such as equity financing but includes local government bond issuance, rose by 12.3% year-over-year, up from 11.6% in February (Chart 1). China’s credit impulse leads the import component of its manufacturing PMI (Chart 2). The credit impulse bottomed in November 2018, which should feed into higher imports over the coming months. This week’s release of better-than-expected data on industrial production, retail sales, and housing activity all suggest that the rebound in Chinese growth is already afoot. Chart 1Chinese Credit Growth Is Rebounding...
Chinese Credit Growth Is Rebounding...
Chinese Credit Growth Is Rebounding...
Chart 2...Which Should Bode Well For Global Exports To China
...Which Should Bode Well For Global Exports To China
...Which Should Bode Well For Global Exports To China
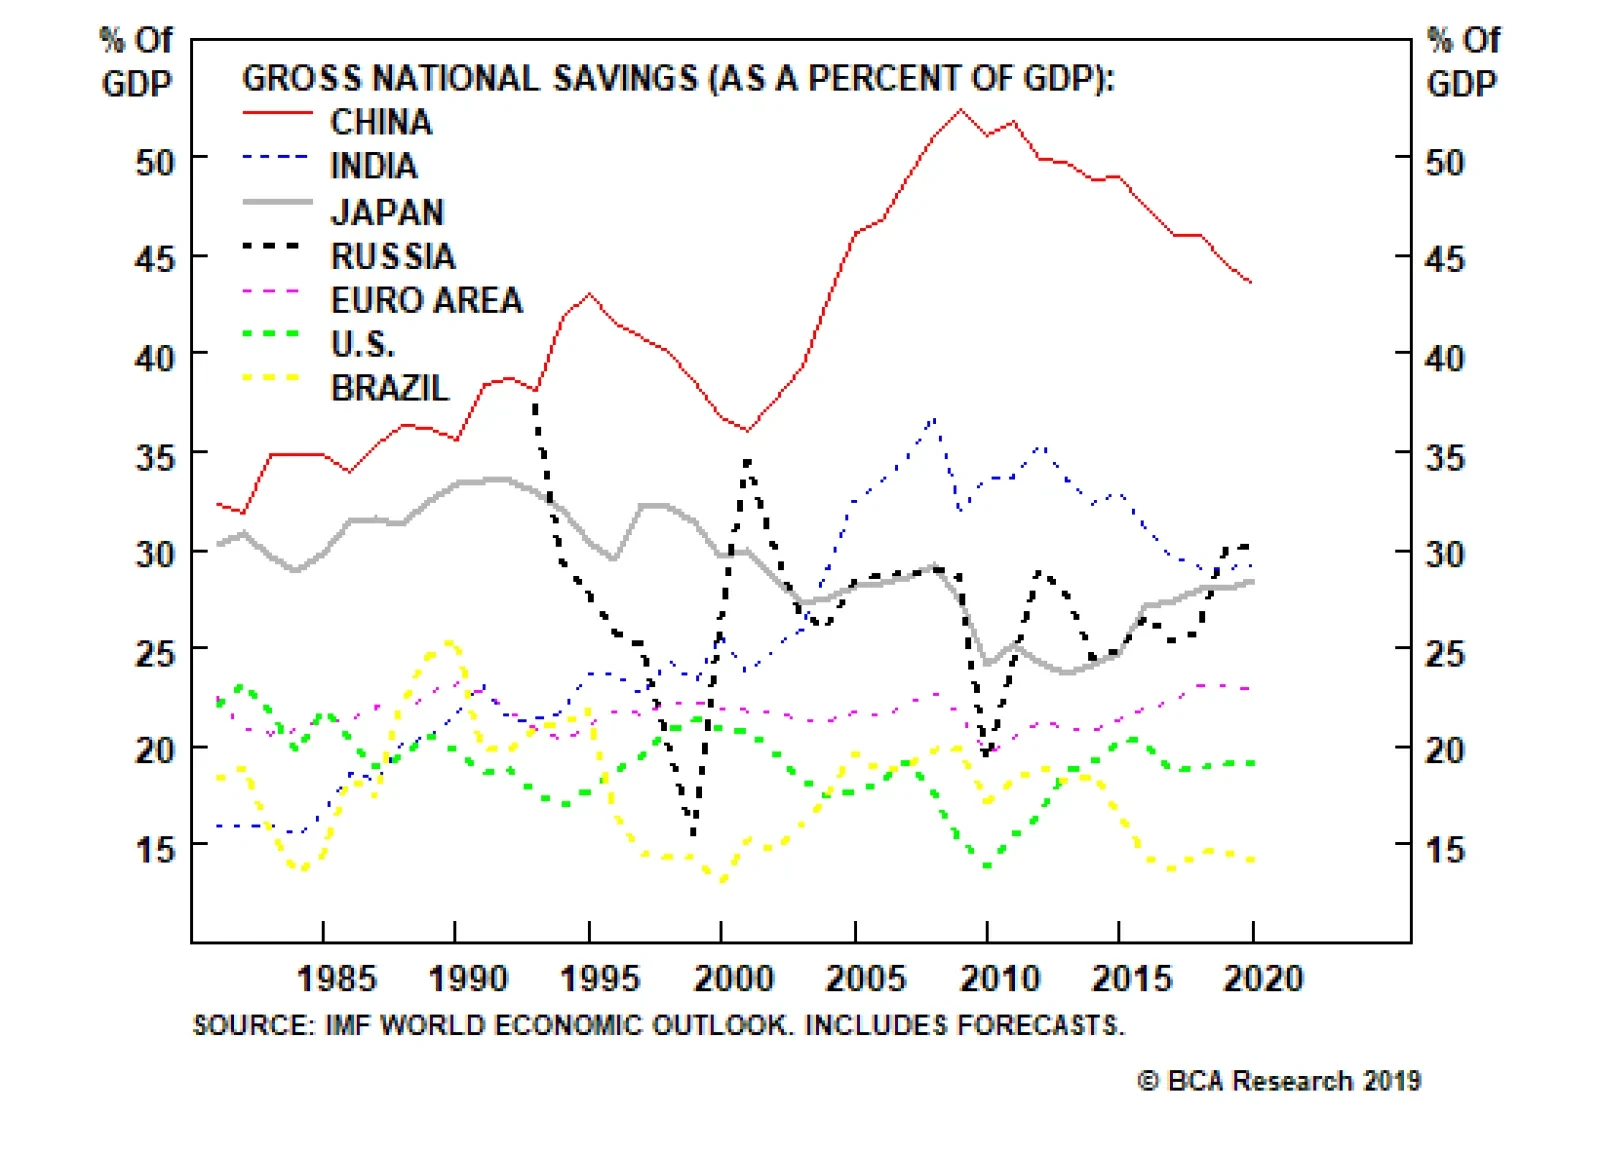
Short-Term Gain For Long-Term Pain? At times like these, the bears are always ready with their standby argument: Sure, China may be stimulating, but all that credit growth will just make the debt bubble even bigger. Once the bubble bursts, there will be hell to pay. Long-term investors should steer clear of any growth-sensitive assets. It is a seductive argument. But it is wrong. Chinese releveraging is: 1) inevitable; 2) desirable; and 3) sustainable. The fundamental macroeconomic problem that China faces is that it consumes too little of what it produces. 1. Chinese Debt Growth Is Inevitable The fundamental macroeconomic problem that China faces is that it consumes too little of what it produces. The result is a national savings rate of 45%, by far the highest of any major economy (Chart 3). Chart 3China Still Saving A Lot
China Still Saving A Lot
China Still Saving A Lot
Chart 4From Exporting Savings To Investing Domestically And Building Up Debt
From Exporting Savings To Investing Domestically And Building Up Debt
From Exporting Savings To Investing Domestically And Building Up Debt
There was a time when China was able to export a large part of its excess production. Its current account surplus reached nearly 10% of GDP in 2007. As its economy has grown in relation to the rest of the world, running massive trade surpluses has become more difficult. This is especially true today, when the country is being targeted by the Trump administration and much of the international community for alleged unfair trade practices. As China’s ability to churn out large current account surpluses declined, the government moved to Plan B: propping up growth by recycling the country’s copious savings into fixed-asset investment. This process saw households park their savings in banks and other financial institutions which, in turn, lent the money out to companies and local governments in order to finance various investment projects. Not surprisingly, debt levels exploded higher (Chart 4). As China’s population ages and more workers leave the labor force, savings will decline. However, this is likely to be a slow process. In the meantime, further debt growth is inevitable. 2. Chinese Debt Growth Is Desirable In an ideal world, Chinese households would consume more of their incomes, leaving only enough savings to finance high-quality private and public investment projects. That is not the world we are living in. In a far-from-ideal world, we need to think about second-best solutions. Yes, a sizable share of Chinese investment spending goes towards projects of dubious value. Yet, the same could have been said about Japan’s fabled “bridges to nowhere.” One may regard the construction of a seldom-used bridge as a misallocation of capital. But what is the counterfactual? If the bridge had not been built, would the workers have found productive work? If not, then there also would have been a misallocation of capital – human capital – which is arguably a much more serious problem. In any case, keep in mind that the rate of return on private investment depends on the state of the economy. If an economy is suffering from chronic lack of demand, only the most worthwhile projects will be undertaken. As the economic outlook improves, the set of viable projects will expand. It is only when all excess private-sector savings have been depleted, and interest rates are rising, that public spending starts to crowd out private investment. 3. Chinese Debt Growth Is Sustainable Even if one accepts the proposition that China needs continued debt growth to maintain full employment, is it still possible that all this additional debt will push the economy into a full-blown debt crisis? Most self-professed “serious-minded” observers would say yes. But then again, many of these same observers were predicting that Japan was heading for a debt crisis when government debt reached 100% of GDP in the late 1990s. Today, Japan’s government debt-to-GDP ratio stands at about 240% of GDP, and yet interest rates remain at rock-bottom levels. China will avoid a debt crisis for the same reason Japan has been able to avoid one. Much of China’s debt stock is composed of state-owned enterprise, local government, and other forms of quasi-public sector debt. Credit policy in China is often indistinguishable from fiscal policy. Given the abundant supply of savings in the economy, most of this debt can be internally financed at fairly low interest rates. The standard equation for government debt dynamics says that the change in the debt-to-GDP ratio, D/Y, can be expressed as:1
Image
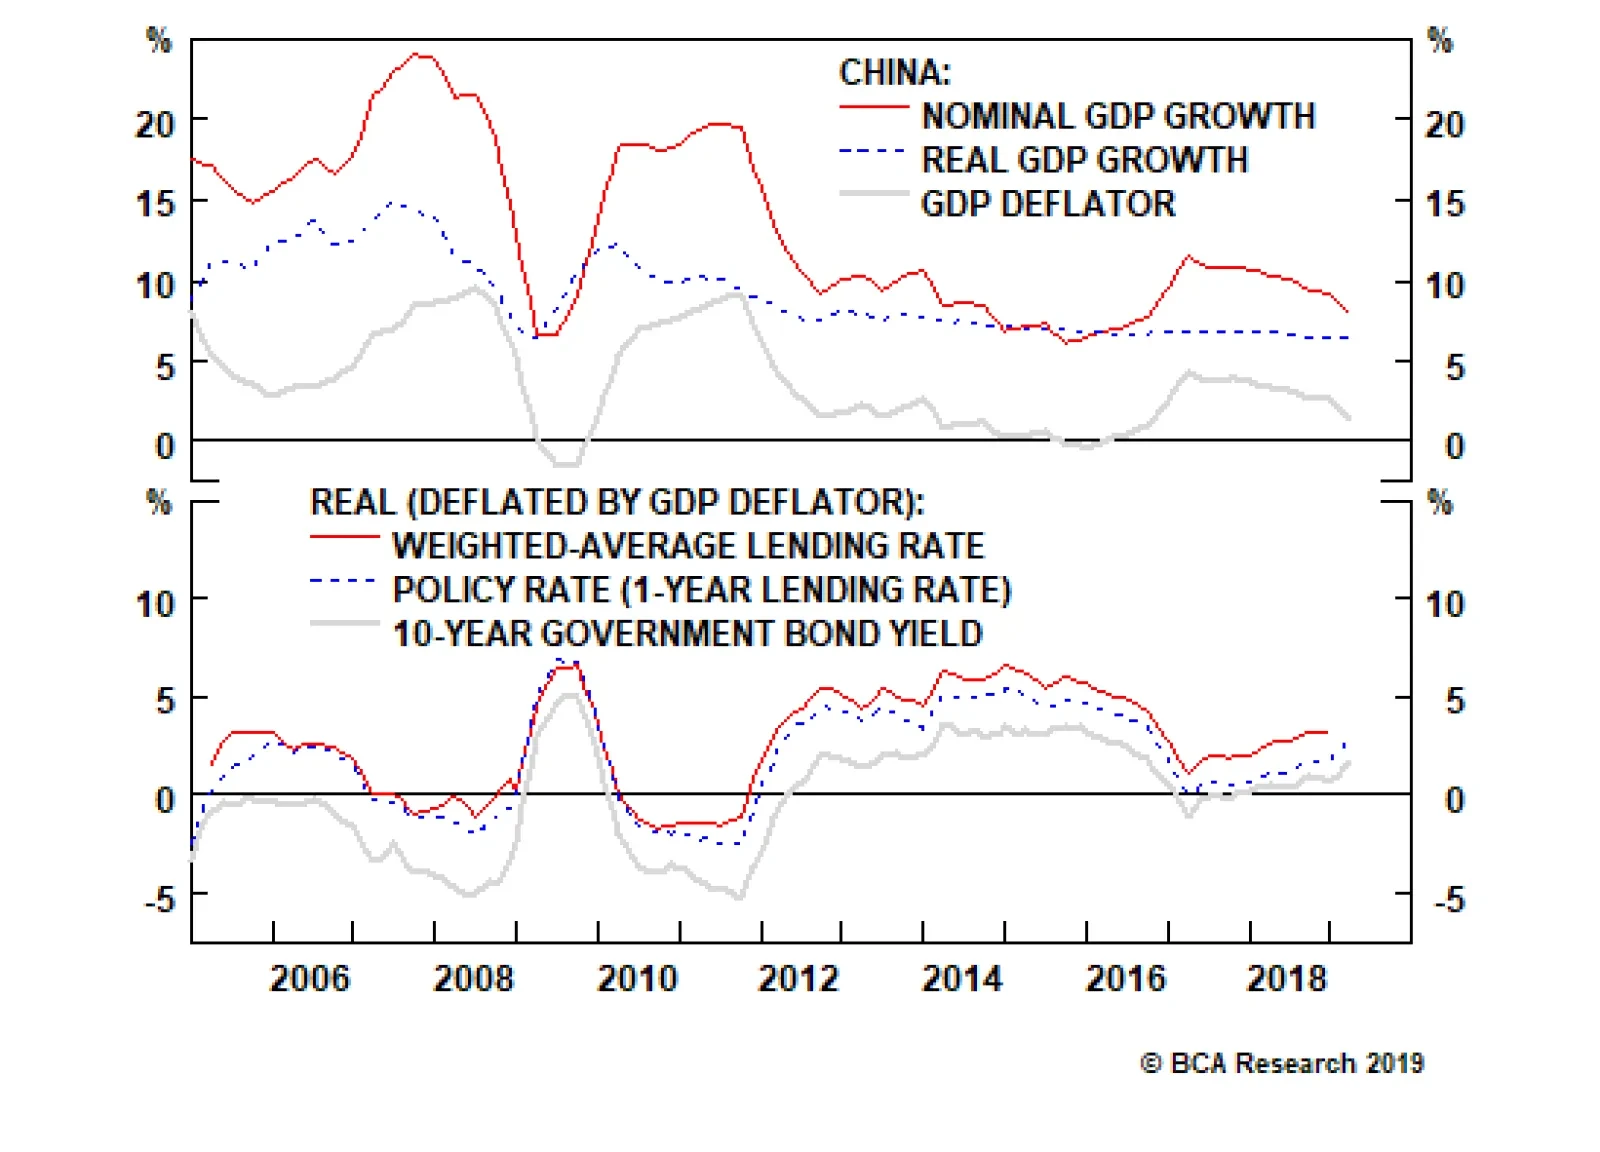
G - T is the primary budget deficit, r is the borrowing rate, and g is the growth rate of the economy (it is irrelevant whether r and g are defined in nominal or real terms, as long as they are both expressed the same way). China will avoid a debt crisis for the same reason Japan has been able to avoid one. The Chinese 10-year government bond yield is currently four percentage points below projected GDP growth over the next decade, which is one of the biggest gaps among the major economies (Chart 5). Arithmetically, this means that China can have as large a primary fiscal deficit as it wants. As long as r remains below g, the debt-to-GDP ratio will converge to a stable level. Chart 6 shows this point analytically.
Chart 5
Chart 6
In fact, it is possible that a permanently larger budget deficit could lead to a decline in the equilibrium debt-to-GDP ratio. How could that be? The answer is revealed by the equation above. If the debt-to-GDP ratio is fairly high to begin with and an increase in the primary budget deficit leads to higher inflation (and hence, lower real rates and/or faster nominal GDP growth), this could more than fully counteract the increase in the deficit. Chart 7Stronger Growth Coincided With Accelerating Inflation And Lower Real Rates
Stronger Growth Coincided With Accelerating Inflation And Lower Real Rates
Stronger Growth Coincided With Accelerating Inflation And Lower Real Rates
This is not just a theoretical curiosity. Historically, Chinese inflation has risen while real rates have fallen whenever GDP growth has accelerated (Chart 7). Given China’s high debt levels, even a modest amount of additional inflation could put significant downward pressure on the debt-to-GDP ratio.2 Of course, all this is predicated on the assumption that faster credit growth will not cause interest rates to rise above the growth rate of the economy. For the portion of China’s debt stock that is either directly or indirectly backstopped by the central government, this seems like a safe assumption. After all, if credit/fiscal stimulus is simply being undertaken in response to inadequate demand, there is no need for policymakers to hike rates. Things get trickier when we look at private debt. In the past, the government has encouraged state-owned banks to roll over souring loans for fear that a wave of defaults would undermine the economy and endanger social stability. More recently, however, policymakers have been backing away from this strategy due to the well-founded view that it encourages moral hazard. Faster growth in China in the second half of this year will lift Chinese imports. This will be welcome news for the rest of the world. We expect the authorities to continue taking steps to instill market discipline by allowing failing firms to, well, fail. Realistically, however, the transition to a full market-based economy will take quite a bit of time. In the interim, the government will keep cutting taxes and increasing on-budget spending in order to ensure that any decline in employment among failing firms is offset by employment growth elsewhere. In such an environment, neither a debt crisis nor a deep economic slowdown appear likely. Investment Conclusions Faster growth in China in the second half of this year will lift Chinese imports. This will be welcome news for the rest of the world.
Chart 8
Chart 9Germany Welcomes The Upturn In Chinese Credit Growth
Germany Welcomes The Upturn In Chinese Credit Growth
Germany Welcomes The Upturn In Chinese Credit Growth
While the U.S. will benefit from a revival in Chinese growth, Europe will gain even more (Chart 8). Germany, in particular, should see a pronounced acceleration in growth. China’s credit impulse leads Chinese automobile spending which, in turn, reliably leads euro area automobile exports, as well as overall exports (Chart 9). The recent rebound in the expectations component of the German ZEW index, as well as in the manufacturing output component of the April flash PMI, suggests that green shoots are starting to sprout (Chart 10). Italy should also benefit from the steep drop in bond yields since last October (Chart 11). Italian industrial production strongly surprised to the upside in February, suggesting that the euro area’s third biggest economy may have finally turned the corner. Chart 10Tentative Green Shoots Out Of Germany
Tentative Green Shoots Out Of Germany
Tentative Green Shoots Out Of Germany
Chart 11Italy: The Drop In Bond Yields Should Boost The Economy
Italy: The Drop In Bond Yields Should Boost The Economy
Italy: The Drop In Bond Yields Should Boost The Economy
The ECB will not hike rates this year even if growth shifts into higher gear, but the market will probably price in a bit more monetary tightening in 2020 and 2021. This should help lift the euro. We recommend that investors position themselves for this by going long EUR/JPY. Relatedly, we are closing our short EUR/CAD trade for a gain of 3.9%. The U.S. dollar tends to be a countercyclical currency, meaning that it moves in the opposite direction of the global business cycle (Chart 12). This countercyclicality stems from the fact that the U.S. is more geared towards services than manufacturing compared with most other economies (Chart 13). As such, when global growth accelerates, capital tends to flow from the U.S. to the rest of the world, translating into more demand for foreign currency and less demand for dollars. Chart 12The Dollar Is A Countercyclical Currency
The Dollar Is A Countercyclical Currency
The Dollar Is A Countercyclical Currency
Chart 13The U.S. Is A Low-Beta Play On Global Growth
The U.S. Is A Low-Beta Play On Global Growth
The U.S. Is A Low-Beta Play On Global Growth
A “patient” Fed and the prospect of stronger global growth in the second half of this year are bearish for the dollar. As such, we are closing our long DXY trade for a carry-adjusted gain of 16.4% and exiting our long USD/CNY trade for a loss of 3.1%. We are also closing our short AUD/CAD trade for a gain of 1.6%. Faster Chinese growth will boost metal prices, which is bullish for the Aussie dollar. Lastly, we are switching our short EUR/RUB trade (which is currently up 8.6%) into a short USD/RUB trade. A weaker greenback and stronger global growth will be manna from heaven for international stocks, especially when priced in U.S. dollars. Investors should prepare to move European and EM equities to overweight within a global equity portfolio during the coming weeks. A “patient” Fed and the prospect of stronger global growth in the second half of this year are bearish for the dollar. We are less keen on upgrading Japanese equities. While Japanese exporters will benefit from stronger Chinese growth, the domestic economy will be weighed down by the upcoming hike in the sales tax, which is slated to take place in October. Moreover, the yen is likely to experience headwinds as global bond yields rise in relation to JGB yields. Investors contemplating buying Japanese stocks should hedge any currency risk. Finally, the price of gold fell to $1275/ounce earlier this week, triggering our buy order. With the Fed on pause, the U.S. economy starting to overheat, and the dollar likely to trend lower, bullion could shine over the coming months. Peter Berezin, Chief Global Strategist Global Investment Strategy peterb@bcaresearch.com Footnotes 1 Please see Global Investment Strategy Weekly Report, “Is There Really Too Much Government Debt In The World?” dated February 22, 2019, for a fuller discussion of this debt sustainability equation.
Image
Strategy & Market Trends MacroQuant Model And Current Subjective Scores
Chart 14
Tactical Trades Strategic Recommendations Closed Trades
Feature Last week’s China credit and money data affirmed that Chinese banks have engaged in another round of massive credit and money injection into the economy. In the first quarter alone, aggregate credit rose by RMB 8.5 trillion (US$1.3 trillion). Aggregate credit growth accelerated to 11.6%, well above first-quarter nominal GDP growth of 8% (Chart I-1). This is in spite of numerous pledges by many of China’s top policymakers that they have no plans to resort to “floodgate irrigation” style stimulus, and that credit/money growth will be kept on par with nominal GDP growth. Our credit and fiscal spending impulse has spiked up, pointing to a potential improvement in economic data in the months ahead (Chart I-2). Chart I-1China: No Deleveraging At All
China: No Deleveraging At All
China: No Deleveraging At All
What’s more, there is anecdotal evidence of a revival of housing demand in March, and that property developers have once again commenced bidding up land prices in certain parts of the country. Chart I-2China: Leading Economic Indicators
China: Leading Economic Indicators
China: Leading Economic Indicators
Regarding investment strategy, two weeks ago we put a stop-buy limit on the MSCI EM stock index at 1125. If this index breaks above this level we will turn tactically positive on EM risk assets. Below are the pros and cons of upgrading the EM outlook at the current juncture. Pros The credit impulse in China leads both the mainland’s business cycle and the global manufacturing cycle by an average of nine months. Given its bottom was in December 2018, the trough in the mainland business and global industrial cycles should have been around August 2019 (Chart I-3). Chart I-3Global Manufacturing PMI Has Not Led Global Stocks
Global Manufacturing PMI Has Not Led Global Stocks
Global Manufacturing PMI Has Not Led Global Stocks
Our assessment has been that the bottom in EM equities that occurred in late December 2018 was too early. Our basis has been that the Chinese and global manufacturing cycles were not likely to bottom before August 2019, according to their previous relationship with China’s credit and fiscal spending impulse. Consequently, we have been expecting China-related plays in financial markets to experience a setback before a more sustainable buying opportunity emerged. However, as China’s credit recovery is now gaining momentum and infrastructure spending financed by local government special bonds is accelerating, the window of downside risk for share prices is narrowing. There have been no recent major stimulus measures directed at China’s property market, but it appears banks have substantially boosted mortgage loan origination and their financing of property developers by loosening lending standards. Easy financing for both homebuyers and property developers makes a revival in real estate more likely. The property market and construction activity are critical to the mainland’s business cycle. If green shoots in the property market multiply, the odds of an overall growth recovery will rise substantially. Finally, if the EM equity index breaks above our stop-buy limit, it would clear an important technical resistance level, confirming the sustainability of this rally (Chart I-4). Cons EM corporate profit growth is contracting in U.S. dollar terms, and the pace of contraction will deepen into the end of this year. This assessment is based on the previous decline in China’s credit impulse. The latter suggests a bottom in EM EPS in December 2019 (Chart I-5). It is still unclear whether EM share prices can ignore this profit contraction and advance through the entire year without major bumps. Chart I-4EM Stocks Are Facing Technical Resistance
EM Stocks Are Facing Technical Resistance
EM Stocks Are Facing Technical Resistance
Chart I-5EM Profits Will Continue Contracting
EM Profits Will Continue Contracting
EM Profits Will Continue Contracting
As of March, Chinese domestic smartphone sales (Chart I-6), as well as Korean, Japanese, Singaporean and Taiwanese exports to the mainland, are all still shrinking at double-digit rates from a year ago (Chart I-7). Chart I-6China: Consumer Spending In March Was Still Weak
China: Consumer Spending In March Was Still Weak
China: Consumer Spending In March Was Still Weak
Chart I-7Exports To China Contracted At A Double-Digit Rate In March
Exports To China Contracted At A Double-Digit Rate In March
Exports To China Contracted At A Double-Digit Rate In March
Chart I-8China: Marginal Propensity To Spend By Consumers And Enterprises
China: Marginal Propensity To Spend By Consumers And Enterprises
China: Marginal Propensity To Spend By Consumers And Enterprises
Our indicators for marginal propensity to consume for Chinese households and companies remain in a downtrend as of March (Chart I-8). An upturn in these indicators is needed to validate that the fiscal and credit stimulus is accompanied by a greater multiplier effect. Finally, financial markets’ aggregate volatility is extremely low (Chart I-9). This is especially true for the currency markets (Chart I-10, top panel). Typically, this is a sign of both complacency and a forthcoming major regime shift in financial markets. Chart I-9Low Vol Precedes A Regime Shift
Low Vol Precedes A Regime Shift
Low Vol Precedes A Regime Shift
We would be much more comfortable upgrading the EM outlook if the broad trade-weighted U.S. dollar broke down, corroborating the improvement in global/EM growth. So far, the greenback has been moving sideways along its 200-day moving average (Chart I-10, bottom panel). Chart I-10The Dollar Is Poised To Break Out Or Break Down
The Dollar Is Poised To Break Out Or Break Down
The Dollar Is Poised To Break Out Or Break Down
If the dollar breaks out, it would confirm the negative outlook for EM. Investors should closely watch foreign exchange markets and adjust their investment strategy accordingly. “Helicopter” Money Forever = A Socialist Put China’s forthcoming recovery is good news for financial markets. Nonetheless, the long-term outlook for the Chinese economy is deteriorating because the credit and money, as well as property bubbles, will keep expanding. First, China holds the world record with respect to corporate sector leverage (Chart I-11). Second, households in China are more leveraged than those in the U.S. (Chart I-12). Given that borrowing costs for households are higher in China than in the U.S., interest payments take up a larger share of Chinese households’ disposable income. Chart I-11Corporate Sector Leverage: China Holds The World Record
Corporate Sector Leverage: China Holds The World Record
Corporate Sector Leverage: China Holds The World Record
Chart I-12Chinese Households Are More Leveraged Than Americans
Chinese Households Are More Leveraged Than Americans
Chinese Households Are More Leveraged Than Americans
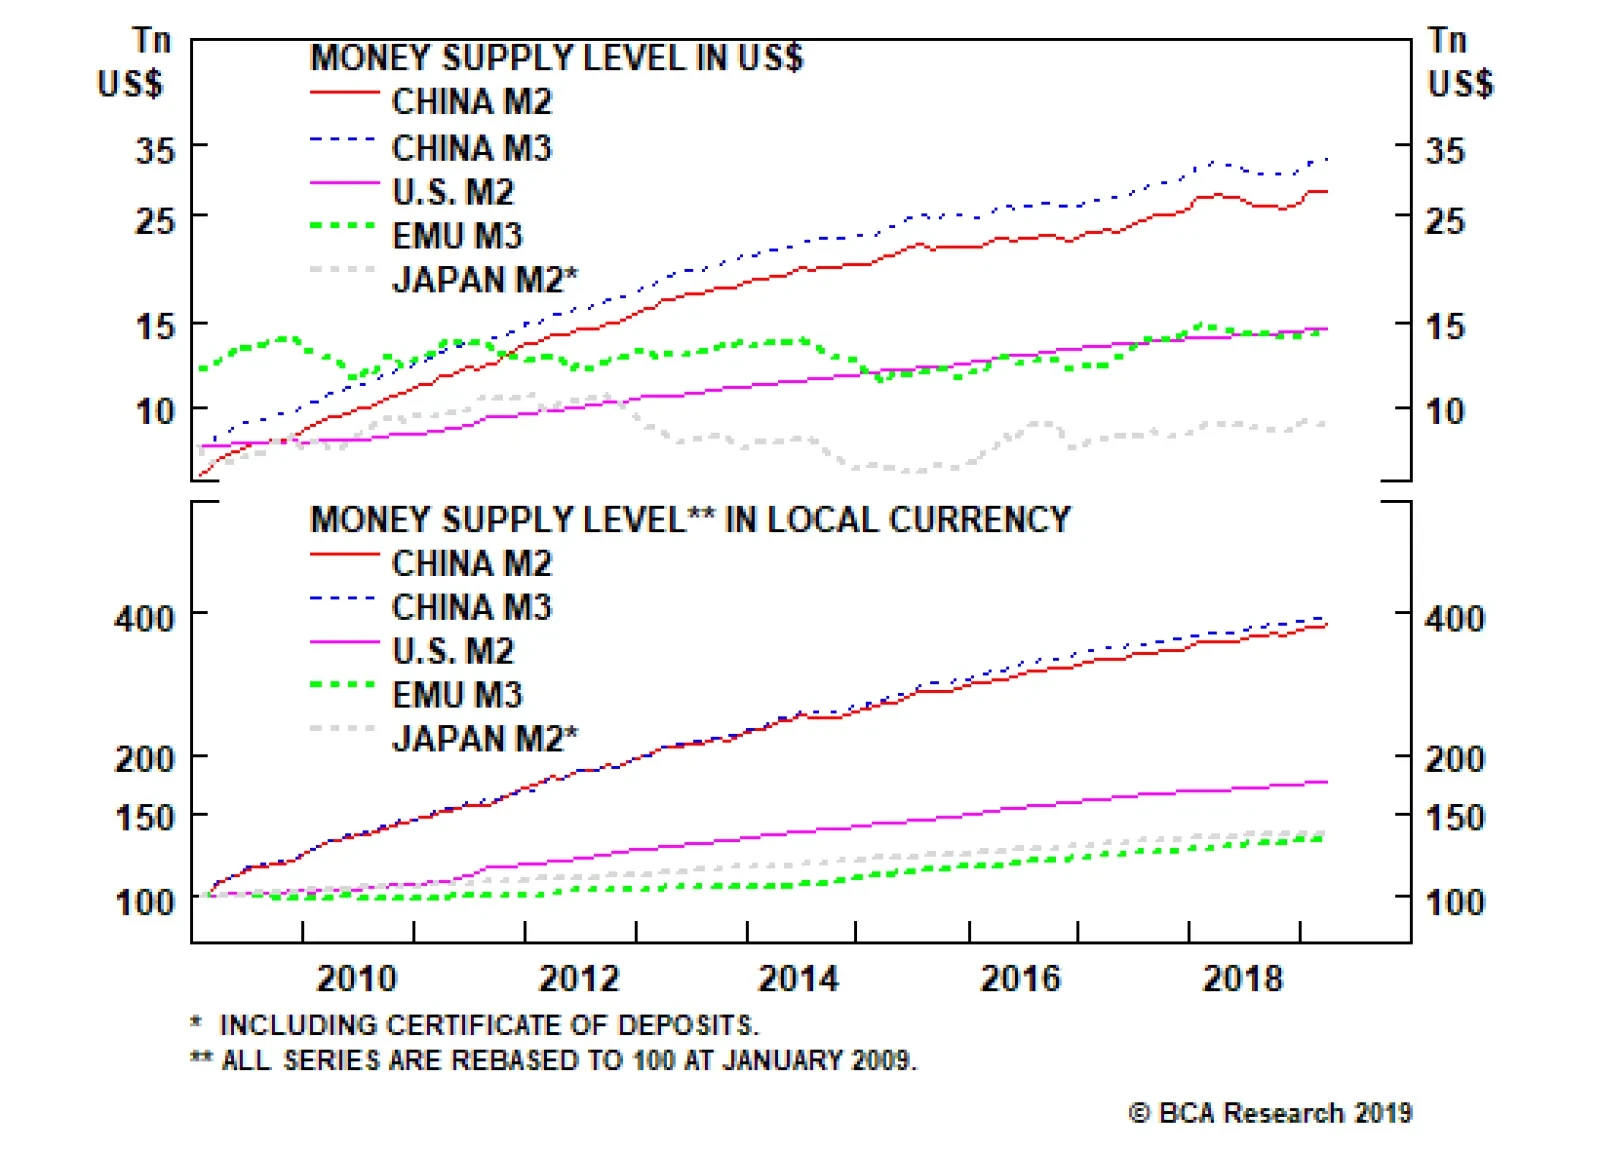
Third, contrary to popular belief, banks do not channel savings/deposits into credit. They create deposits/money supply when they lend to or buy assets from non-banks. Money supply is the sum of deposits and cash in circulation. In a nutshell, credit and money excesses in China are not natural outcomes of the nation’s high savings rate but are the result of reckless credit origination by China’s commercial banks. We have elaborated on this point in a series of reports we have written on credit, money and savings.1 When commercial banks originate a loan, they create new money and new purchasing power “out of thin air.” Nobody needs to save for a bank to make a loan or buy assets. Consequently, new purchasing power for goods and services boosts demand in the real economy and inflates asset prices. Chinese banks have literally been dropping “helicopter” money over the past 10 years. Since January 2009 – the onset of the country’s massive credit binge – banks have created 165 trillion yuan ($25 trillion) of new broad money, based on our measure of M3 broad money. This is triple of the $8.3 trillion broad money supply created in the U.S., the euro area and Japan combined during the same period (Chart I-13, top panel). Chart I-13Helicopter Money In China
Helicopter Money In China
Helicopter Money In China
China’s broad (M3) money supply now stands at 220 trillion yuan, equivalent to $32.5 trillion. What’s astonishing is that Chinese broad money is larger than the sum of broad money in both the U.S. and the euro area (i.e. all outstanding U.S. dollars and euros in the world combined) (Chart I-13, bottom panel). Yet China’s nominal GDP is only 38% of U.S. and euro area’s GDP combined. In a market-based economy, the constraints on banks doing “helicopter” money are bank shareholders, regulators and central banks. Bank shareholders are the primary and largest losers from credit booms because they are highly exposed to non-performing loans. That is why they should be the first to cut credit flows to the economy when they sense non-payments on loans could rise. In China, neither bank shareholders nor bank regulators or the People’s Bank of China have prevented banks from expanding credit/money. Moreover, the authorities have not forced banks to acknowledge non-performing loans. This scenario – whereby banks expand credit without taking responsibility for collecting the loans – only occurs in a socialist system. This is the ultimate socialist put. China’s Potential Growth Roadmaps We have been arguing for several years that China is facing a historic choice between: (1) Moving toward a more market-based economic system that entails making creditors and borrowers take responsibility for their lending/borrowing and investment decisions. If lenders and borrowers are made explicitly accountable for their business/financial decisions, then credit flows will decelerate considerably, bankruptcies will mushroom and a period of deleveraging will be inevitable. However, the quality of capital allocation will improve, enhancing the country’s productivity and potential growth in the long run (Chart I-14).
Chart I-14
Chart I-15China: Structural Growth Tailwinds Have Dissipated
China: Structural Growth Tailwinds Have Dissipated
China: Structural Growth Tailwinds Have Dissipated
This is a scenario of medium-term pain, long-term gain. The recent ramp-up in credit growth does not suggest the authorities are willing to embrace this option. (2) “Helicopter money” and a socialist put scenario entails lower potential GDP growth and rising inflation. If China continues opting to keep the socialist put in place, its potential growth rate – which is equivalent to the sum of growth rates in productivity and the labor force – will drop significantly. In the long run, this socialist put discourages innovation and breeds capital misallocation, reducing productivity growth. In fact, the industrialization ratio is 85% – not 60% as many contend(Chart I-15, top panel). Further, China’s labor force growth has stalled and will be mildly negative in the years to come (Chart I-15, bottom panel). Together, these circumstances point to a slower potential growth rate. Meanwhile, recurring stimulus via “helicopter” money will create mini-cycles around a falling potential growth rate (Chart I-16). Below we discuss the investment strategy this scenario entails.
Chart I-16
Implications Of The Socialist Put For The Currency… Slowing productivity and rampant money/purchasing power creation ultimately lead to rising inflation. Higher inflation and low interest rates - required to sustain an ever-rising debt burden - are a recipe for currency depreciation. Chinese households and businesses are eager to diversify their copious and mushrooming renminbi deposits into foreign currencies and assets. The PBoC’s foreign exchange reserves of $3 trillion are equal to only 10% of the amount of yuan deposits and cash in circulation. Foreign exchange reserves’ coverage of local currency money supply is much higher in many other EM countries, including Brazil and Russia (Chart I-17). Chart I-17China's FX Reserves Cover Less Local Currency Deposits Than Peers
China's FX Reserves Cover Less Local Currency Deposits Than Peers
China's FX Reserves Cover Less Local Currency Deposits Than Peers
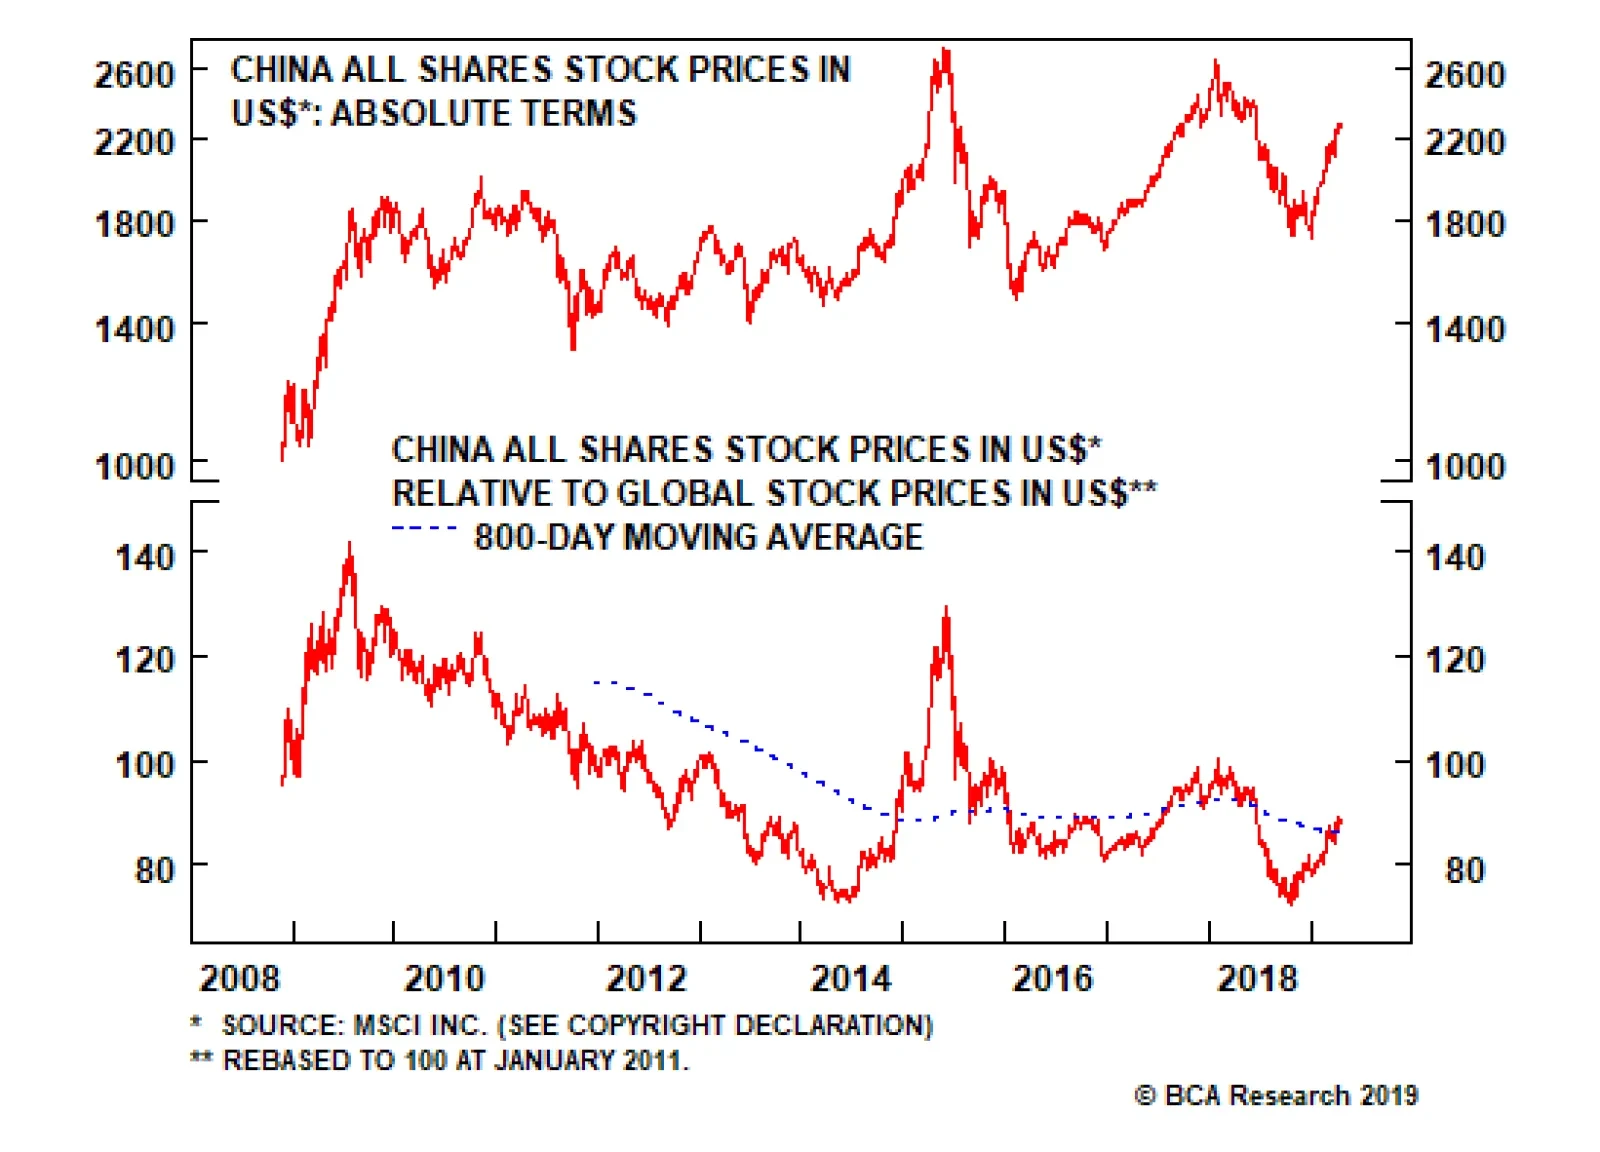
The enormous amount of money supply/deposits in China is “the sword of Damocles” on the yuan’s exchange rate in the long run. It is therefore inconceivable that China can fully open its capital account in the foreseeable future. On the contrary, capital account restrictions will be further tightened. Plus, the current account will become much more regulated so that there is no leakage of capital via trade transactions – such as over-invoicing of imports or under-invoicing of exports. The inability to repatriate capital when needed and structural RMB depreciation are the key risks to long-term investors in China’s onshore capital markets. …And Chinese Stocks In the socialist put scenario, a buy-and-hold strategy is inappropriate for Chinese stocks: Investors should attempt to play the resultant mini-cycles (Chart I-16). In reality, however, economic and especially financial market mini-cycles are not symmetric, and investors can make money only if they time them properly. In fact, this decade Chinese share prices – both in absolute terms and relative to global stocks – have experience wild swings (Chart I-18). Chart I-18Chinese Stocks Are Following Mini-Cycles
Chinese Stocks Are Following Mini-Cycles
Chinese Stocks Are Following Mini-Cycles
Concerning the current outlook for Chinese investable stocks, our take is as follows: On absolute performance, we will turn positive on Chinese share prices if our stop-buy on EM equities is triggered, as per our discussion above. As for their relative performance within EM and global equity portfolios, simply because the stimulus originates in China does not warrant an overweight position in Chinese stocks. The primary losers from credit bubbles are banks and other financial companies. The basis is that they will carry the burden of potential rising non-performing loans unless the government bails them out by purchasing bad assets at par. The latter has not been the case so far this decade. Hence, an underweight position in Chinese banks/financials is currently warranted. Furthermore, the large debtors in the non-financial corporate sector should also be underweighted. When a company increases its debt but its new investments produce little net new cash flow, its equity value declines. It is difficult to find so many high-return investment projects, especially in a slowing economy. Therefore, another round of considerable capital misallocation is currently underway, and shareholders of the companies that are undertaking these investments will end up losing. In a socialist system, shareholders typically do not make money. They lose money. This is the rationale to underweight Chinese stocks within both EM and global equity portfolios. Yet, there is a caveat: This framework may not be pertinent to the two largest companies in the Chinese investable equity index Ali-Baba and Tencent - each of which accounts for 13% of the index. These two companies score well on the above issues but face different non-macro hazards including regulatory, business model and other risks. Weighing the pros and cons, we recommend maintaining a market weight allocation in Chinese equities within an EM equity portfolio. This is the view of BCA’s Emerging Markets Strategy team, which differs from the recommendations of other BCA services that are currently advocating an overweight position in Chinese stocks within a global equity portfolio. A New Trade: Short Chinese Bank / Long U.S. Bank Stocks Chinese banks’ equity value will erode as they once again expand their balance sheets aggressively, as per our discussion above. Chinese banks’ EPS have been and will continue to be diluted by the need to raise more capital. U.S. banks are better capitalized, and their asset quality is much better. Since the 2007-08 credit crisis, they have been much more prudent in expanding their balance sheets. U.S. bank stocks have underperformed the S&P 500 index since August 2018 because of falling U.S. interest rate expectations. The odds are high that U.S. bond yields are bottoming and will rise considerably – because the drag from China’s slowdown on the global economy is diminishing. This will help U.S. bank stocks. Although Chinese bank stocks optically appear undervalued, they are “cheap” for a reason. The fact that they have been “cheap” since 2011 and have failed to re-rate confirms that they suffer from chronic problems that have not been addressed yet (Chart I-19). Chart I-19Chinese Banks Are Cheap For A Reason
Chinese Banks Are Cheap For A Reason
Chinese Banks Are Cheap For A Reason
Chart I-20A New Trade: Short Chinese Banks / Long U.S. Banks
A New Trade: Short Chinese Banks / Long U.S. Banks
A New Trade: Short Chinese Banks / Long U.S. Banks
Finally, their relative performance is facing a major resistance level, and will likely relapse (Chart I-20). Take Profits On Short Chinese Property Developers / Long U.S. Homebuilders Position “Helicopter” money might be temporary positive for mainland property developers. In the meantime, share prices of U.S. homebuilders will be hurt due to rising U.S. bond yields. We are closing this position to protect profits. This recommendation has produced a 90% gain since its initiation on March 6, 2012. Arthur Budaghyan Chief Emerging Markets Strategist arthurb@bcaresearch.com 1 Please see Emerging Markets Strategy Special Report "Misconceptions About China's Credit Excesses," dated October 26, 2016 and Emerging Markets Strategy Special Report "The True Meaning Of China's Great 'Savings' Wall," dated December 20, 2017, available at ems.bcaresearch.com
Highlights In China, “helicopter” money and the socialist put are positive for growth in the medium term but will prove harmful for the economy over the long run. In the socialist put scenario, a buy-and-hold strategy is inappropriate for Chinese stocks. The enormous amount of money supply in China is “the sword of Damocles” on the yuan’s exchange rate. A new equity trade: Short Chinese banks / long U.S. banks. Take profits on our short Chinese property developers / long U.S. homebuilders equity position. Feature Last week’s China credit and money data affirmed that Chinese banks have engaged in another round of massive credit and money injection into the economy. In the first quarter alone, aggregate credit rose by RMB 8.5 trillion (US$1.3 trillion). Aggregate credit growth accelerated to 11.6%, well above first-quarter nominal GDP growth of 8% (Chart I-1). This is in spite of numerous pledges by many of China’s top policymakers that they have no plans to resort to “floodgate irrigation” style stimulus, and that credit/money growth will be kept on par with nominal GDP growth. Our credit and fiscal spending impulse has spiked up, pointing to a potential improvement in economic data in the months ahead (Chart I-2). Chart I-1China: No Deleveraging At All
China: No Deleveraging At All
China: No Deleveraging At All
What’s more, there is anecdotal evidence of a revival of housing demand in March, and that property developers have once again commenced bidding up land prices in certain parts of the country. Chart I-2China: Leading Economic Indicators
China: Leading Economic Indicators
China: Leading Economic Indicators
Regarding investment strategy, two weeks ago we put a stop-buy limit on the MSCI EM stock index at 1125. If this index breaks above this level we will turn tactically positive on EM risk assets. There is anecdotal evidence of a revival of housing demand in March, and that property developers have once again commenced bidding up land prices in certain parts of the country. Below are the pros and cons of upgrading the EM outlook at the current juncture. Pros The credit impulse in China leads both the mainland’s business cycle and the global manufacturing cycle by an average of nine months. Given its bottom was in December 2018, the trough in the mainland business and global industrial cycles should have been around August 2019 (Chart I-3). Chart I-3Global Manufacturing PMI Has Not Led Global Stocks
Global Manufacturing PMI Has Not Led Global Stocks
Global Manufacturing PMI Has Not Led Global Stocks
Our assessment has been that the bottom in EM equities that occurred in late December 2018 was too early. Our basis has been that the Chinese and global manufacturing cycles were not likely to bottom before August 2019, according to their previous relationship with China’s credit and fiscal spending impulse. Consequently, we have been expecting China-related plays in financial markets to experience a setback before a more sustainable buying opportunity emerged. However, as China’s credit recovery is now gaining momentum and infrastructure spending financed by local government special bonds is accelerating, the window of downside risk for share prices is narrowing. There have been no recent major stimulus measures directed at China’s property market, but it appears banks have substantially boosted mortgage loan origination and their financing of property developers by loosening lending standards. Easy financing for both homebuyers and property developers makes a revival in real estate more likely. The property market and construction activity are critical to the mainland’s business cycle. If green shoots in the property market multiply, the odds of an overall growth recovery will rise substantially. Finally, if the EM equity index breaks above our stop-buy limit, it would clear an important technical resistance level, confirming the sustainability of this rally (Chart I-4). Cons EM corporate profit growth is contracting in U.S. dollar terms, and the pace of contraction will deepen into the end of this year. This assessment is based on the previous decline in China’s credit impulse. The latter suggests a bottom in EM EPS in December 2019 (Chart I-5). It is still unclear whether EM share prices can ignore this profit contraction and advance through the entire year without major bumps. Chart I-4EM Stocks Are Facing Technical Resistance
EM Stocks Are Facing Technical Resistance
EM Stocks Are Facing Technical Resistance
Chart I-5EM Profits Will Continue Contracting
EM Profits Will Continue Contracting
EM Profits Will Continue Contracting
As of March, Chinese domestic smartphone sales (Chart I-6), as well as Korean, Japanese, Singaporean and Taiwanese exports to the mainland, are all still shrinking at double-digit rates from a year ago (Chart I-7). Chart I-6China: Consumer Spending In March Was Still Weak
China: Consumer Spending In March Was Still Weak
China: Consumer Spending In March Was Still Weak
Chart I-7Exports To China Contracted At A Double-Digit Rate In March
Exports To China Contracted At A Double-Digit Rate In March
Exports To China Contracted At A Double-Digit Rate In March
Our indicators for marginal propensity to consume for Chinese households and companies remain in a downtrend as of March (Chart I-8). An upturn in these indicators is needed to validate that the fiscal and credit stimulus is accompanied by a greater multiplier effect. Chart I-8China: Marginal Propensity To Spend By Consumers And Enterprises
China: Marginal Propensity To Spend By Consumers And Enterprises
China: Marginal Propensity To Spend By Consumers And Enterprises
Chart I-9Low Vol Precedes A ##br##Regime Shift
Low Vol Precedes A Regime Shift
Low Vol Precedes A Regime Shift
Finally, financial markets’ aggregate volatility is extremely low (Chart I-9). This is especially true for the currency markets (Chart I-10, top panel). Typically, this is a sign of both complacency and a forthcoming major regime shift in financial markets. Chart I-10The Dollar Is Poised To Break Out Or Break Down
The Dollar Is Poised To Break Out Or Break Down
The Dollar Is Poised To Break Out Or Break Down
We would be much more comfortable upgrading the EM outlook if the broad trade-weighted U.S. dollar broke down, corroborating the improvement in global/EM growth. So far, the greenback has been moving sideways along its 200-day moving average (Chart I-10, bottom panel). If the dollar breaks out, it would confirm the negative outlook for EM. Investors should closely watch foreign exchange markets and adjust their investment strategy accordingly. “Helicopter” Money Forever = A Socialist Put China’s forthcoming recovery is good news for financial markets. Nonetheless, the long-term outlook for the Chinese economy is deteriorating because the credit and money, as well as property bubbles, will keep expanding. First, China holds the world record with respect to corporate sector leverage (Chart I-11). Second, households in China are more leveraged than those in the U.S. (Chart I-12). Given that borrowing costs for households are higher in China than in the U.S., interest payments take up a larger share of Chinese households’ disposable income. Chart I-11Corporate Sector Leverage: China Holds The World Record
Corporate Sector Leverage: China Holds The World Record
Corporate Sector Leverage: China Holds The World Record
Chart I-12Chinese Households Are More Leveraged Than Americans
Chinese Households Are More Leveraged Than Americans
Chinese Households Are More Leveraged Than Americans
Third, contrary to popular belief, banks do not channel savings/deposits into credit. They create deposits/money supply when they lend to or buy assets from non-banks. Money supply is the sum of deposits and cash in circulation. Financial markets’ aggregate volatility is extremely low. This is especially true for the currency markets. In a nutshell, credit and money excesses in China are not natural outcomes of the nation’s high savings rate but are the result of reckless credit origination by China’s commercial banks. We have elaborated on this point in a series of reports we have written on credit, money and savings.1 When commercial banks originate a loan, they create new money and new purchasing power “out of thin air.” Nobody needs to save for a bank to make a loan or buy assets. Consequently, new purchasing power for goods and services boosts demand in the real economy and inflates asset prices. Chinese banks have literally been dropping “helicopter” money over the past 10 years. Since January 2009 – the onset of the country’s massive credit binge – banks have created 165 trillion yuan ($25 trillion) of new broad money, based on our measure of M3 broad money. This is triple of the $8.3 trillion broad money supply created in the U.S., the euro area and Japan combined during the same period (Chart I-13, top panel). Chart I-13Helicopter Money In China
Helicopter Money In China
Helicopter Money In China
China’s broad (M3) money supply now stands at 220 trillion yuan, equivalent to $32.5 trillion. What’s astonishing is that Chinese broad money is larger than the sum of broad money in both the U.S. and the euro area (i.e. all outstanding U.S. dollars and euros in the world combined) (Chart I-13, bottom panel). Yet China’s nominal GDP is only 38% of U.S. and euro area’s GDP combined. Credit and money excesses in China are not natural outcomes of the nation’s high savings rate but are the result of reckless credit origination by China’s commercial banks. In a market-based economy, the constraints on banks doing “helicopter” money are bank shareholders, regulators and central banks. Bank shareholders are the primary and largest losers from credit booms because they are highly exposed to non-performing loans. That is why they should be the first to cut credit flows to the economy when they sense non-payments on loans could rise. In China, neither bank shareholders nor bank regulators or the People’s Bank of China have prevented banks from expanding credit/money. Moreover, the authorities have not forced banks to acknowledge non-performing loans. This scenario – whereby banks expand credit without taking responsibility for collecting the loans – only occurs in a socialist system. This is the ultimate socialist put. China’s Potential Growth Roadmaps We have been arguing for several years that China is facing a historic choice between: (1) Moving toward a more market-based economic system that entails making creditors and borrowers take responsibility for their lending/borrowing and investment decisions. If lenders and borrowers are made explicitly accountable for their business/financial decisions, then credit flows will decelerate considerably, bankruptcies will mushroom and a period of deleveraging will be inevitable. However, the quality of capital allocation will improve, enhancing the country’s productivity and potential growth in the long run (Chart I-14).
Chart I-14
This is a scenario of medium-term pain, long-term gain. The recent ramp-up in credit growth does not suggest the authorities are willing to embrace this option. Chart I-15China: Structural Growth Tailwinds Have Dissipated
China: Structural Growth Tailwinds Have Dissipated
China: Structural Growth Tailwinds Have Dissipated
(2) “Helicopter money” and a socialist put scenario entails lower potential GDP growth and rising inflation. If China continues opting to keep the socialist put in place, its potential growth rate – which is equivalent to the sum of growth rates in productivity and the labor force – will drop significantly. In the long run, this socialist put discourages innovation and breeds capital misallocation, reducing productivity growth. In fact, the industrialization ratio is 85% – not 60% as many contend(Chart I-15, top panel). Further, China’s labor force growth has stalled and will be mildly negative in the years to come (Chart I-15, bottom panel). Together, these circumstances point to a slower potential growth rate. Meanwhile, recurring stimulus via “helicopter” money will create mini-cycles around a falling potential growth rate (Chart I-16). Below we discuss the investment strategy this scenario entails.
Chart I-16
Implications Of The Socialist Put For The Currency… Slowing productivity and rampant money/purchasing power creation ultimately lead to rising inflation. Higher inflation and low interest rates - required to sustain an ever-rising debt burden - are a recipe for currency depreciation. Chinese households and businesses are eager to diversify their copious and mushrooming renminbi deposits into foreign currencies and assets. The PBoC’s foreign exchange reserves of $3 trillion are equal to only 10% of the amount of yuan deposits and cash in circulation. Foreign exchange reserves’ coverage of local currency money supply is much higher in many other EM countries, including Brazil and Russia (Chart I-17). Chart I-17China's FX Reserves Cover Less Local Currency Deposits Than Peers
China's FX Reserves Cover Less Local Currency Deposits Than Peers
China's FX Reserves Cover Less Local Currency Deposits Than Peers
The enormous amount of money supply/deposits in China is “the sword of Damocles” on the yuan’s exchange rate in the long run. It is therefore inconceivable that China can fully open its capital account in the foreseeable future. On the contrary, capital account restrictions will be further tightened. Plus, the current account will become much more regulated so that there is no leakage of capital via trade transactions – such as over-invoicing of imports or under-invoicing of exports. The inability to repatriate capital when needed and structural RMB depreciation are the key risks to long-term investors in China’s onshore capital markets. …And Chinese Stocks In the socialist put scenario, a buy-and-hold strategy is inappropriate for Chinese stocks: Investors should attempt to play the resultant mini-cycles (Chart I-16). In reality, however, economic and especially financial market mini-cycles are not symmetric, and investors can make money only if they time them properly. In fact, this decade Chinese share prices – both in absolute terms and relative to global stocks – have experience wild swings (Chart I-18). Chart I-18Chinese Stocks Are Following Mini-Cycles
Chinese Stocks Are Following Mini-Cycles
Chinese Stocks Are Following Mini-Cycles
Concerning the current outlook for Chinese investable stocks, our take is as follows: On absolute performance, we will turn positive on Chinese share prices if our stop-buy on EM equities is triggered, as per our discussion above. As for their relative performance within EM and global equity portfolios, simply because the stimulus originates in China does not warrant an overweight position in Chinese stocks. The primary losers from credit bubbles are banks and other financial companies. The basis is that they will carry the burden of potential rising non-performing loans unless the government bails them out by purchasing bad assets at par. The latter has not been the case so far this decade. Hence, an underweight position in Chinese banks/financials is currently warranted. Furthermore, the large debtors in the non-financial corporate sector should also be underweighted. When a company increases its debt but its new investments produce little net new cash flow, its equity value declines. It is difficult to find so many high-return investment projects, especially in a slowing economy. Therefore, another round of considerable capital misallocation is currently underway, and shareholders of the companies that are undertaking these investments will end up losing. In a socialist system, shareholders typically do not make money. They lose money. This is the rationale to underweight Chinese stocks within both EM and global equity portfolios. Yet, there is a caveat: This framework may not be pertinent to the two largest companies in the Chinese investable equity index Ali-Baba and Tencent - each of which accounts for 13% of the index. These two companies score well on the above issues but face different non-macro hazards including regulatory, business model and other risks. Weighing the pros and cons, we recommend maintaining a market weight allocation in Chinese equities within an EM equity portfolio. This is the view of BCA’s Emerging Markets Strategy team, which differs from the recommendations of other BCA services that are currently advocating an overweight position in Chinese stocks within a global equity portfolio. A New Trade: Short Chinese Bank / Long U.S. Bank Stocks Chinese banks’ equity value will erode as they once again expand their balance sheets aggressively, as per our discussion above. Chinese banks’ EPS have been and will continue to be diluted by the need to raise more capital. U.S. banks are better capitalized, and their asset quality is much better. Since the 2007-08 credit crisis, they have been much more prudent in expanding their balance sheets. U.S. bank stocks have underperformed the S&P 500 index since August 2018 because of falling U.S. interest rate expectations. The odds are high that U.S. bond yields are bottoming and will rise considerably – because the drag from China’s slowdown on the global economy is diminishing. This will help U.S. bank stocks. Although Chinese bank stocks optically appear undervalued, they are “cheap” for a reason. The fact that they have been “cheap” since 2011 and have failed to re-rate confirms that they suffer from chronic problems that have not been addressed yet (Chart I-19). Finally, their relative performance is facing a major resistance level, and will likely relapse (Chart I-20). Chart I-19Chinese Banks Are Cheap##br## For A Reason
Chinese Banks Are Cheap For A Reason
Chinese Banks Are Cheap For A Reason
Chart I-20A New Trade: Short Chinese Banks / Long U.S. Banks
A New Trade: Short Chinese Banks / Long U.S. Banks
A New Trade: Short Chinese Banks / Long U.S. Banks
Take Profits On Short Chinese Property Developers / Long U.S. Homebuilders Position “Helicopter” money might be temporary positive for mainland property developers. In the meantime, share prices of U.S. homebuilders will be hurt due to rising U.S. bond yields. We are closing this position to protect profits. This recommendation has produced a 90% gain since its initiation on March 6, 2012. Arthur Budaghyan Chief Emerging Markets Strategist arthurb@bcaresearch.com Footnotes 1 Please see Emerging Markets Strategy Special Report "Misconceptions About China's Credit Excesses," dated October 26, 2016 and Emerging Markets Strategy Special Report "The True Meaning Of China's Great 'Savings' Wall," dated December 20, 2017, available at ems.bcaresearch.com Equity Recommendations Fixed-Income, Credit And Currency Recommendations