China
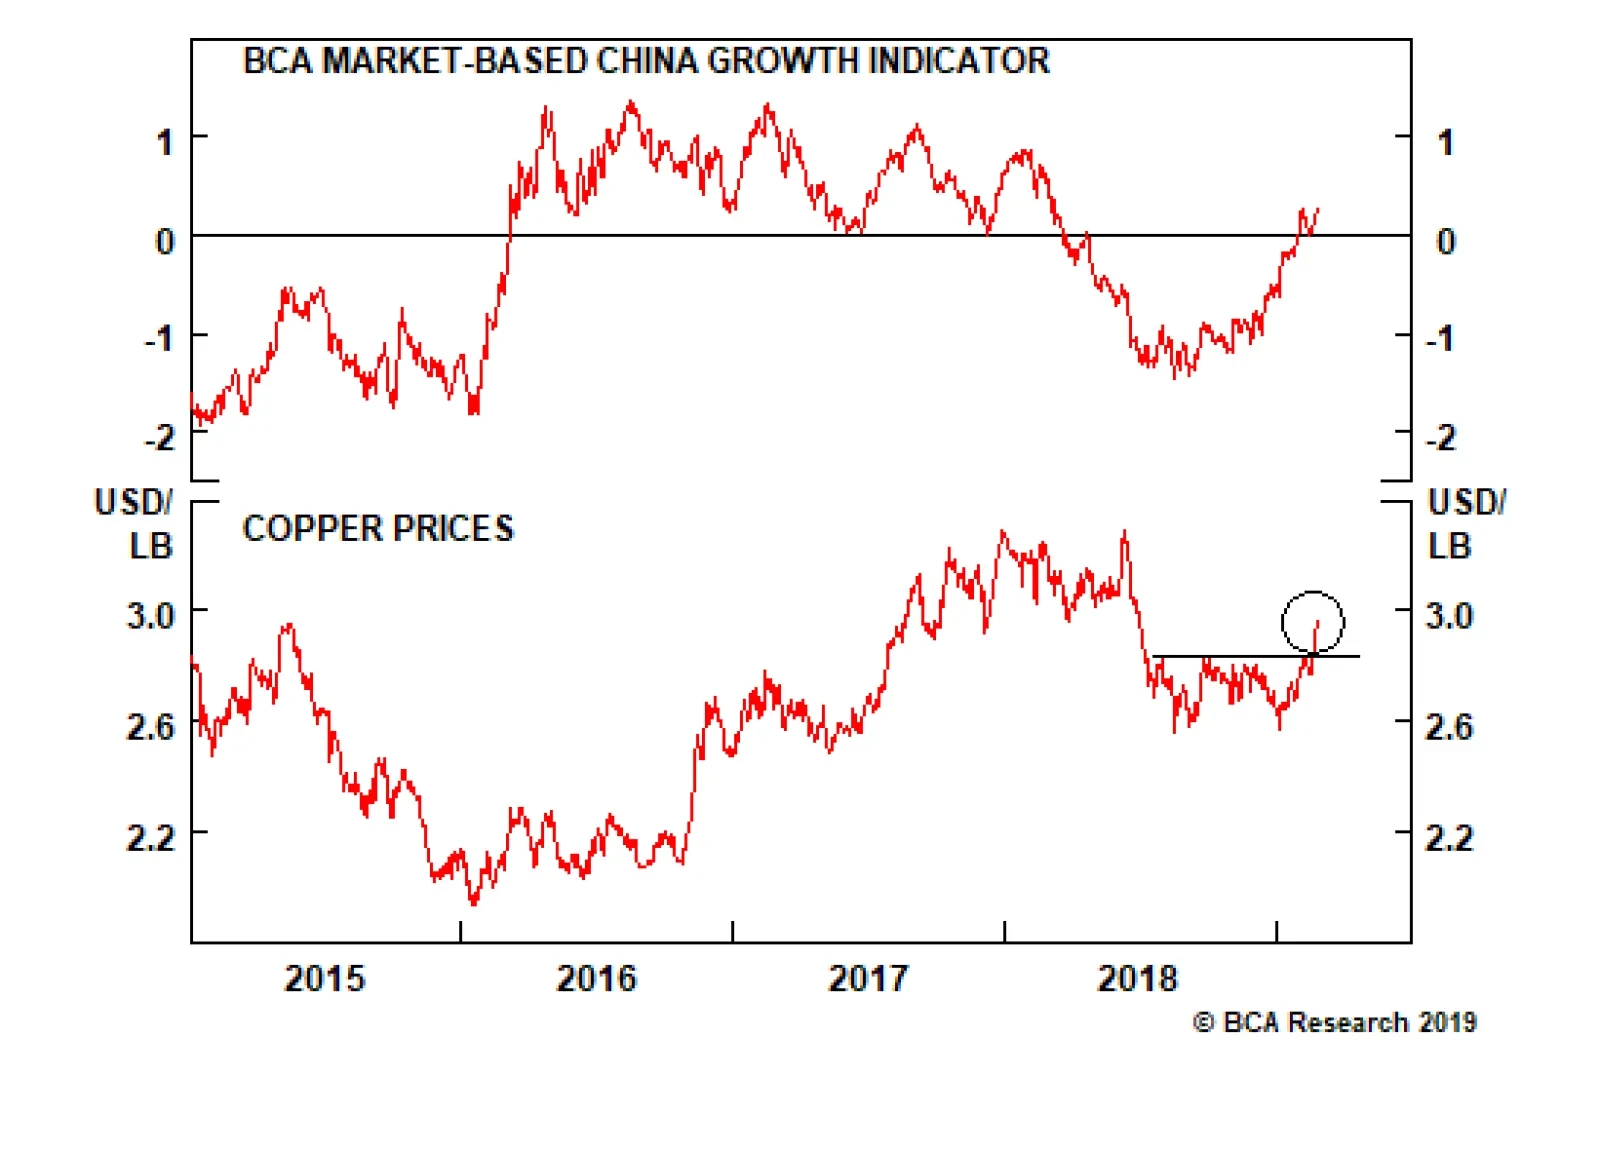
On Monday Chinese A-shares surged by nearly 6%, their best daily performance in three years. In many corners of the investment community, EM assets and China related assets have interpreted these developments as a positive omen. Nobody can deny that not…
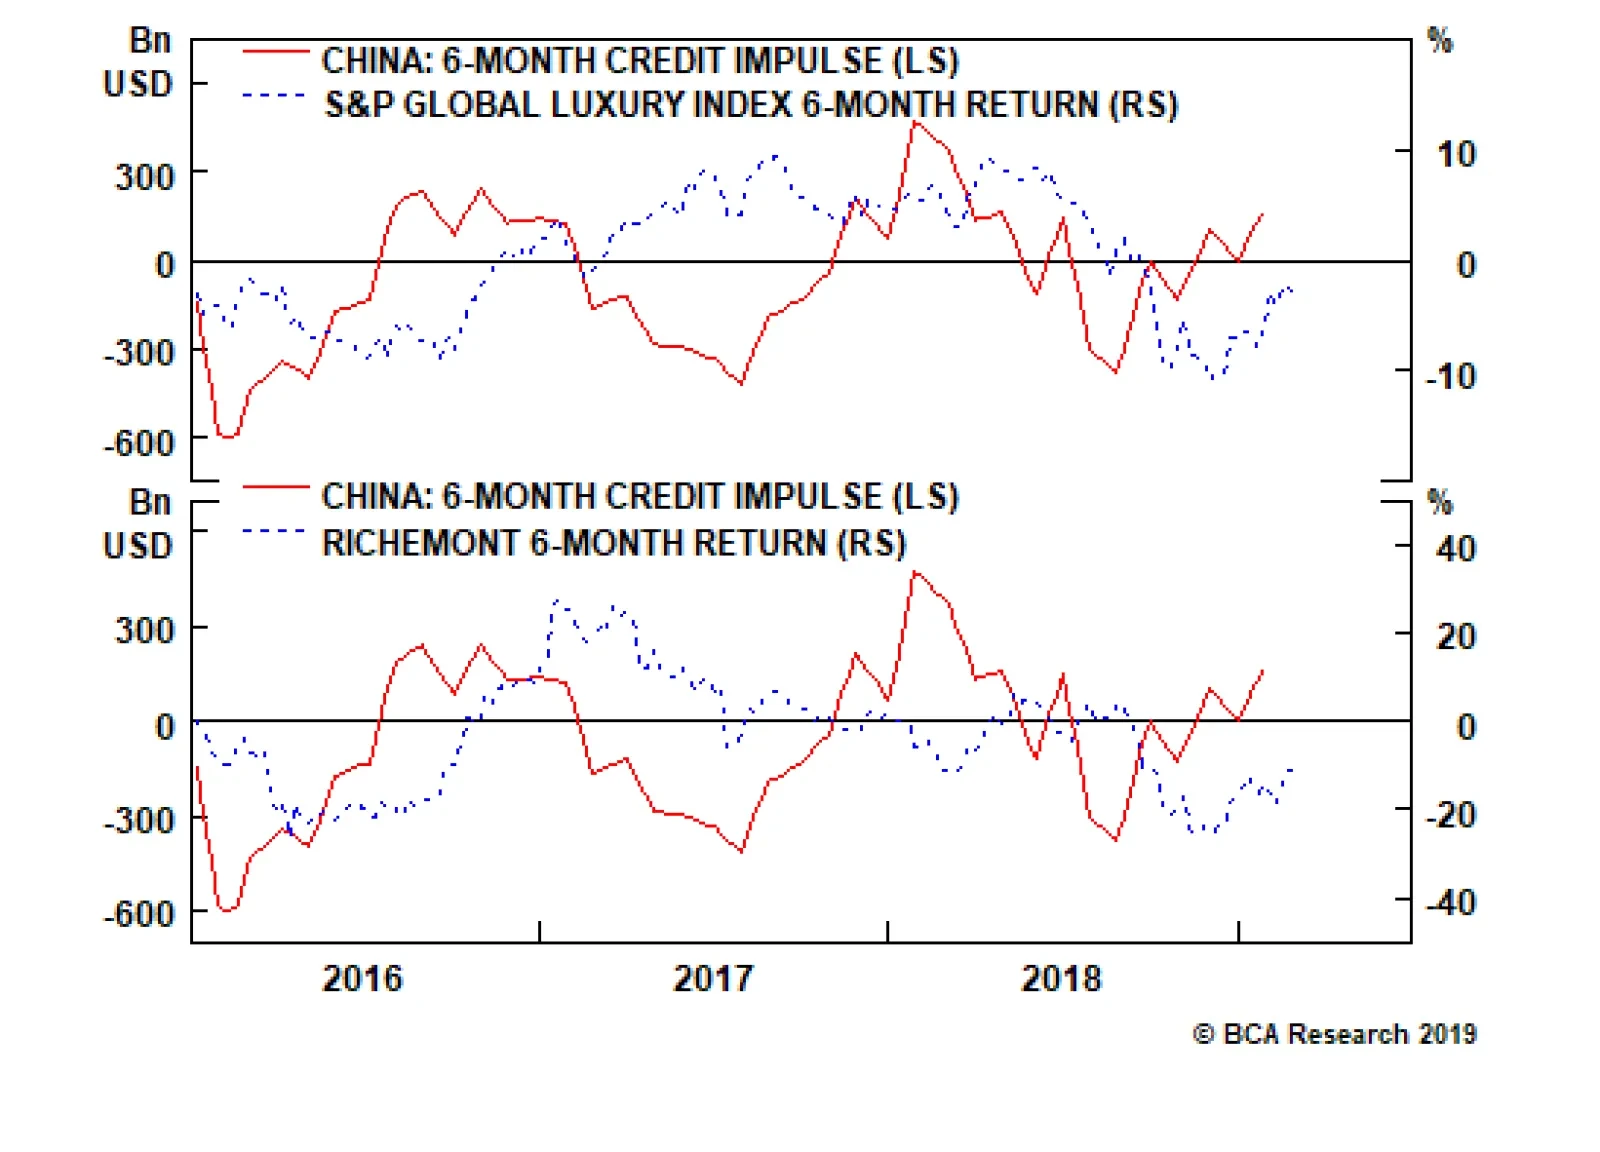
Regarding the European luxury goods sector, we often get following question: is it, just like the basic resources sector, a direct play on China’s growth cycle? The answer is no. Recently, the connection between the fortunes of ‘soft’ luxury goods brands like…
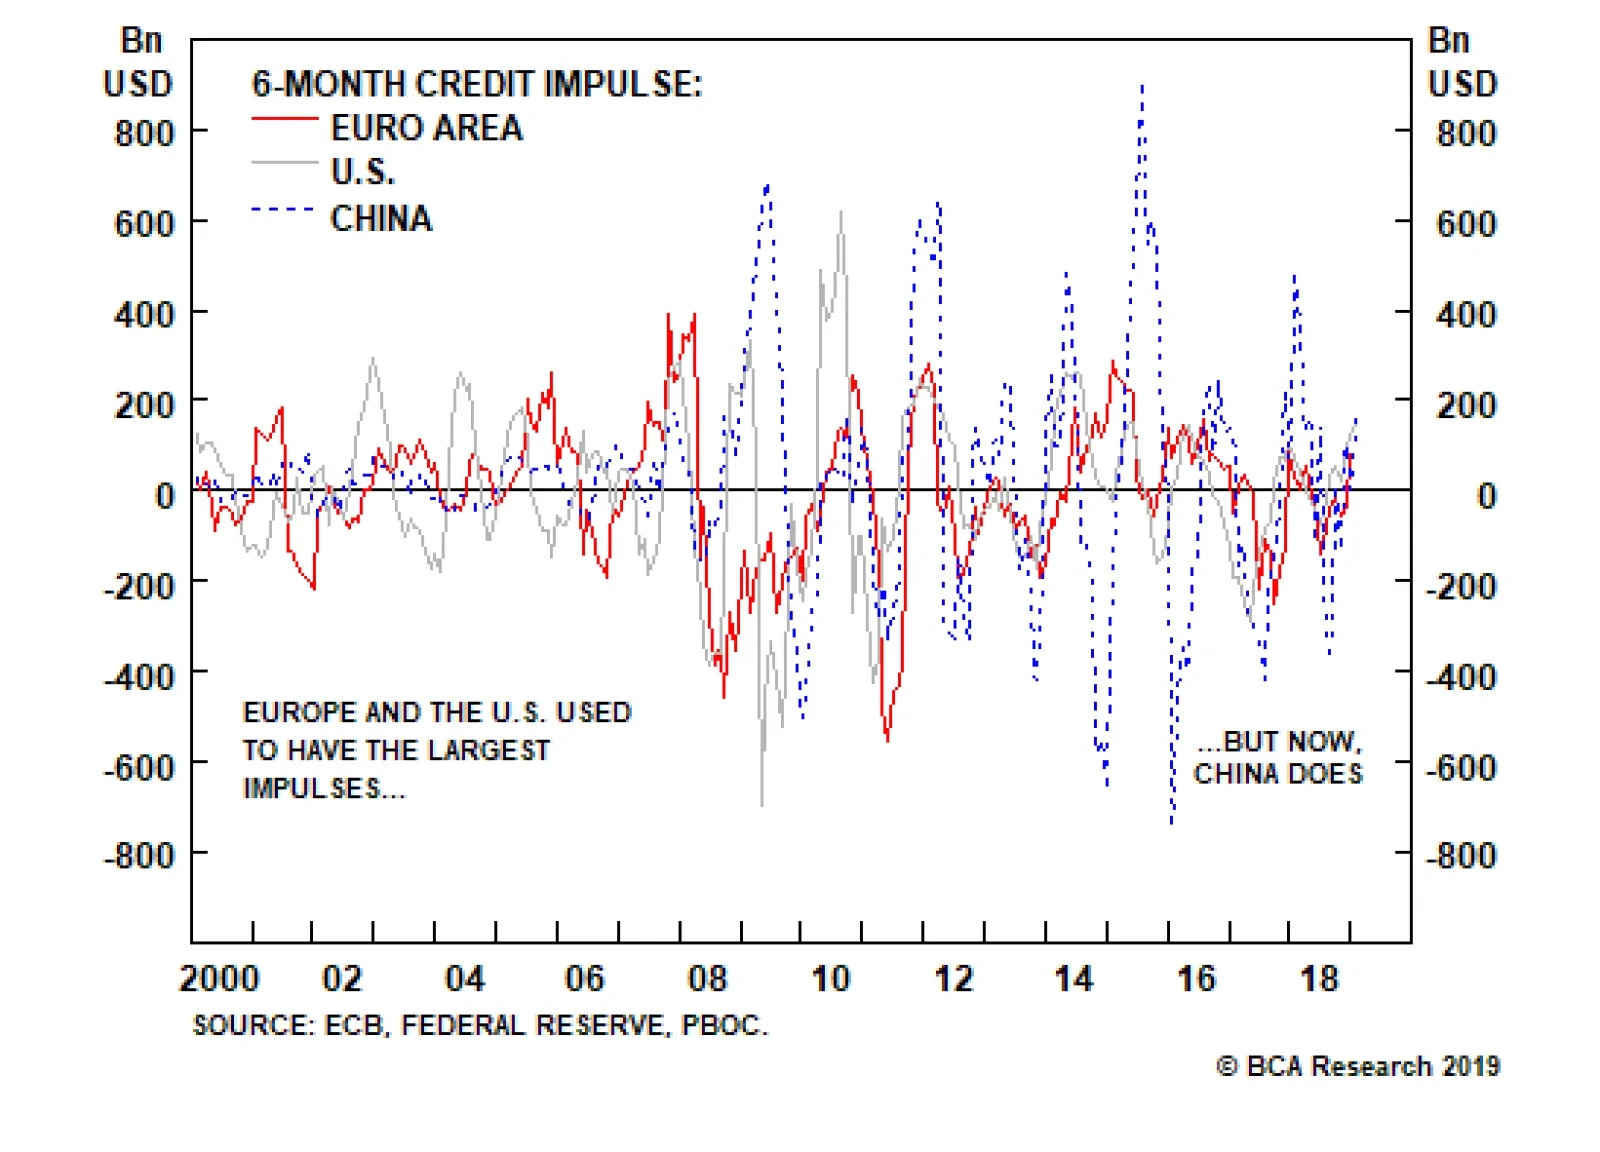
The chart above shows the short-term credit impulses, expressed in USD terms, for the euro area, U.S., and China through the past twenty years. The comparison reveals that the dominant short-term impulse – the one with the highest amplitude – illustrates the…

Highlights A sooner-than-anticipated end to the Federal Reserve’s balance-sheet runoff should give a welcome boost to international liquidity conditions. Moreover, reflationary efforts in China, cautious global central banks, and easing global financial conditions all point to a rebound in economic surprises. This will support pro-cyclical versus defensive currencies and argues against a strong USD. At this point, it is too early to tell how long a pro-cyclical FX stance will be warranted. Sell NZD/CAD. Feature Since the turn of the year, this publication has argued that a correction in the dollar was increasingly likely, and that the main beneficiaries of this move should be the more pro-cyclical currencies. Because U.S. domestic fundamentals remain much stronger than the rest of the G10’s, our preference has been to favor commodity currencies versus the yen instead of playing dollar weakness outright. This theme remains in place for now. However, we are increasingly concerned about the dollar and think the outperformance of commodity currencies could last longer than originally expected. Essentially, an end to the Federal Reserve’s balance-sheet runoff, more cautious central banks, and easier global financial conditions could set the stage for a significant rebound in commodity currencies. U.S. Excess Reserves Vs. Commodity Currencies Whether it is from Governor Lael Brainard, Cleveland Fed President Loretta Mester, or the FOMC minutes, the message is clear: The days of the Fed’s balance sheet runoff are numbered. Ryan Swift, BCA’s Chief U.S. Bond Strategist, has written at length that the Fed’s balance sheet attrition has had a limited direct impact on U.S. growth. However, Ryan and the FOMC members both agree that a smaller balance sheet impacts the ability of the Fed to control the level of the fed funds rate.1 With less excess reserves in the banking system, the New York Fed has to intervene more often to keep the policy rate below its ceiling. This might seem like a very technical point, but it is an important one for many FX markets. Prior to the financial crisis, expanding excess reserves on U.S. commercial banks would coincide with improving dollar-based liquidity. Moreover, since 2011, reserves even lead our financial liquidity index (Chart I-1). Since there is 14 trillion of USD-denominated foreign-currency debt around the world, these fluctuations in U.S. excess reserves, and thus global liquidity, can have an impact on the price of assets most levered to global growth conditions. Chart I-1U.S. Excess Reserves Contribute To The Global Liquidity Backdrop
U.S. Excess Reserves Contribute To The Global Liquidity Backdrop
U.S. Excess Reserves Contribute To The Global Liquidity Backdrop
Chart I-2 illustrates that commodity currencies are indeed very responsive to changes in U.S. excess reserves, particularly when these pro-cyclical currencies are compared to counter-cyclical ones like the JPY. Meanwhile, the trade-weighted dollar tends to move in the opposite direction of excess reserves, reflecting the dollar’s countercyclical nature (Chart I-3). This relationship, however, is not as tight as the one between commodity currencies and the reserves. Chart I-2Improving Growth In Excess Reserves Leads To Stronger Commodity Currencies...
Improving Growth In Excess Reserves Leads To Stronger Commodity Currencies...
Improving Growth In Excess Reserves Leads To Stronger Commodity Currencies...
Chart I-3...And To A Weaker Greenback
...And To A Weaker Greenback
...And To A Weaker Greenback
A corollary to the growing consensus within the FOMC to end the balance-sheet runoff sooner than later is that the contraction in excess reserves will end. A bottoming in the rate of change of the reserves is consistent with a rebound in commodity currencies, especially against the yen, and with a correction in the dollar. Gold prices are very sensitive to global liquidity conditions. Today, not only is the yellow metal moving closer to the US$1350-US$1370 zone that marked its previous highs in 2016, 2017, and 2018, but also, the gold rally is broadening, as exemplified by the advance / decline line of gold prices versus nine currencies, which is making new highs (Chart I-4, top panel). This indicates that the precious metal could punch above this resistance level. Gold is probably sniffing out an improvement in global liquidity conditions. Since rising gold prices tend to lead EM high-yield bond prices higher (Chart I-4, bottom panel), investors need to monitor this move closely. Chart I-4A Broadening Gold Rally Is Consistent With Easing Liquidity Conditions
A Broadening Gold Rally Is Consistent With Easing Liquidity Conditions
A Broadening Gold Rally Is Consistent With Easing Liquidity Conditions
Bottom Line: The growing chorus among FOMC members singing the praises of the end of the Fed’s balance-sheet runoff points toward a significant slowdown in U.S. excess reserves attrition. While this may not be a significant development for U.S. domestic economic variables, it should help liquidity conditions outside the U.S. While this could weigh on the greenback, the probability is higher that it will help commodity currencies in the short run, especially against the yen. Global Policy And Commodity Currencies In China, new total social financing hit CNY 4.6 trillion in January, well above the normal seasonal strength. Accordingly, the Chinese fiscal and credit impulse is starting to improve (Chart I-5). While this rebound is currently embryonic, our Geopolitical Strategy team has argued that a massive increase in Chinese credit this January would indicate a change in Beijing’s economic priorities.2 The Chinese government may be trying to limit the downside to growth, and reflation may expand. This would result in a further pick-up in the credit impulse. Chart I-5The Chinese Credit Impulse May Be Bottoming
The Chinese Credit Impulse May Be Bottoming
The Chinese Credit Impulse May Be Bottoming
Easing EM financial conditions – courtesy of rebounding EM high-yield bond prices – and rising Chinese credit flows should ultimately lead to improving growth conditions across EM. As a result, our diffusion index of EM economic activity – which tallies improvements across 23 EM economic variables – should bounce from currently very depressed levels. Such a recovery is normally associated with a weaker trade-weighted dollar, a stronger euro, rising commodity prices and rising commodity currencies – both against the USD and the JPY (Chart I-6). Chart I-6IF EM Growth Conditions Improve, This Will Have A Profound Impact On the FX Market
IF EM Growth Conditions Improve, This Will Have A Profound Impact On the FX Market
IF EM Growth Conditions Improve, This Will Have A Profound Impact On the FX Market
We can expand this line of thinking to the global economy. Our Leading Economic Indicator Diffusion Index, which compares the number of countries with a rising LEI versus those with a falling LEI, already rebounded five months ago. Historically, this signals an upcoming rebound in the BCA global LEI. Additionally, other major central banks are also sounding an increasingly cautious tone. This should accentuate the easing in global financial conditions that began in late December, creating another support for global growth. However, global investors remain very pessimistic on global growth, as exemplified by this week’s very poor global growth expectations computed from the German ZEW survey (Chart I-7). This dichotomy between depressed growth expectations and burgeoning green shoots suggests that risk asset prices have room to rally further in the coming quarter or two. Chart I-7Investors Remain Pessimistic About Growth, Yet Green Shoots Are Popping Up
Investors Remain Pessimistic About Growth, Yet Green Shoots Are Popping Up
Investors Remain Pessimistic About Growth, Yet Green Shoots Are Popping Up
These dynamics are positive for commodity currencies and negative for the dollar. This cycle, the pattern has been for the trade-weighted dollar to correct and hypersensitive pro-cyclical currencies like the AUD and the NZD to perk up only after our Global LEI diffusion index has trough, and around the same time as risk asset prices rebound (Chart I-8). Chart I-8Thinking About Growth, Asset Prices, The Dollar, And Commodity Currencies
Thinking About Growth, Asset Prices, The Dollar, And Commodity Currencies
Thinking About Growth, Asset Prices, The Dollar, And Commodity Currencies
Treasury yields will most likely also be forced higher by improving risk asset prices and economic activity, especially as bond market flows suggest T-notes currently are a coiled spring. The U.S. Treasury International Capital System data released at the end of last week was very revealing. The press emphasized the large-scale selling of Treasurys from the Cayman Islands – interpreted as selling by hedge funds. Missing from the picture was the enormous buying from these same players over the past 12 months, which corresponded with falling yields and a rallying trade-weighted dollar (Chart I-9). It was a sign of growing fear that pushed up the price of bonds. Chart I-9Hedge Funds Have Room To Liquidate Their Treasury Holdings
Hedge Funds Have Room To Liquidate Their Treasury Holdings
Hedge Funds Have Room To Liquidate Their Treasury Holdings
If, as we expect, global growth beats dismal expectations and risk assets rebound further, the countercyclical dollar should correct. This will further ease global financial conditions and justifying even more a wholesale liquidation of stale bond holdings by hedge funds and further pushing the Fed toward resuming its hiking campaign faster than the market is currently anticipating. This combination is highly bond bearish. Unsurprisingly, this means that the yen, which normally trades closely in line with U.S. Treasury yields, is likely to weaken. Hence, USD/JPY and EUR/JPY could experience significant upside over the coming months (Chart I-10). Chart I-10A Bond Bearish Backdrop Is Also Bad For The Yen
A Bond Bearish Backdrop Is Also Bad For The Yen
A Bond Bearish Backdrop Is Also Bad For The Yen
Bottom Line: Global growth conditions are evolving away from a dollar-bullish, commodity currency-bearish backdrop. Not only is the dollar-based liquidity set to improve, but China is also releasing the proverbial brake. Additionally, a generally more cautious tone among global central banks will contribute to easing global financial conditions. These developments are likely to result in a period of positive global economic surprises – and an environment where the greenback weakens and where pro-cyclical currencies outperform. But For How Long? It remains a question mark as to how long this pro-growth cycle will last. Parts of the dynamics described above are very self-defeating. If global growth conditions and asset prices rebound strongly, the Fed will be in a better position to increase rates once again. This could quickly curtail the improvement in global financial conditions and favor a strong dollar. Additionally, it is not clear how far Beijing will go in terms of pushing reflation through the Chinese economy. Chinese policymakers are worried about too-pronounced a slowdown but are equally worried about too much debt in their economy, and do not want to repeat the debt binge witnessed in 2010 and 2016. Therefore, they may be much quicker to lift their foot off the gas pedal. This conflicting attitude is best illustrated by recent opposing remarks made by Chinese policymakers. On the one hand, Premier Li-Keqiang expressed concerns regarding the January credit surge, suggesting that some Chinese policymakers are already trying to dampen expectations that stimulus will be substantial. On the other hand, the PBoC sounded utterly unconcerned. Moreover, as our Emerging Markets Strategy service highlights, EM earnings are likely to continue to suffer from the lagged effect of China’s previous tightening. This creates the risk that even if global growth rebounds, EM stock prices, EM FX and all related plays do not follow. This would maintain the dollar-bullish environment and hurt pro-cyclical commodity currencies while supporting the yen. Despite these risks, it is nonetheless too early to tell how short-lived this period of dollar softness and commodity currency strength will be. After all, the dollar is a momentum currency. If the dollar weakness gathers steam, a virtuous cycle could emerge: improving global growth begets a weaker dollar, a weaker dollar begets easier global financial conditions, easier global financial conditions beget stronger growth, and so on. Gold prices may hold the key to cut this Gordian knot. If gold cannot maintain its recent gains, then the pro-cyclical positioning will not be valid for more than three months. However, if gold prices can remain at elevated levels or even rally further, then this pro-cyclical positioning will stay appropriate for at least six to nine months. What is clear is that for now, buying risk in the FX space makes sense. Bottom Line: At this point, too many crosscurrents are at play to evaluate confidently the length of any rally in pro-cyclical currencies relative to defensive ones. Since easier financial conditions ultimately force the Fed to resume hiking and since it is far from clear how committed to reflation Chinese policymakers are, our base case remains that this move will last a quarter or so. However, the fact that a falling dollar further eases global financial conditions, fomenting greater global growth in the process, suggests that a virtuous circle that create additional dollar downside can also emerge. Gold may provide early signals as to when investors should once again adopt a defensive posture. Sell NZD/CAD Something exceptional happened three months ago. For the second time in 25 years, Canadian policy rates fell in line with New Zealand’s. As Chart I-11 shows, this last happened from 1998 to 1999, when NZD/CAD subsequently depreciated 26%. However, today Canada’s and New Zealand’s current accounts are roughly in line while back then New Zealand had a substantially larger deficit, such a decline is unlikely to repeat itself. Nonetheless, we posit that NZD/CAD possesses ample downside. Chart I-11Bad News For NZD/CAD
Bad News For NZD/CAD
Bad News For NZD/CAD
First, like in 1998-‘99, the real trade-weighted NZD exhibits a larger premium to its fair value than the real trade-weighted CAD (Chart I-12). In fact, the relative premium of the NZD to the CAD is roughly comparable as it was back then. Moreover, our Intermediate-Term Timing Model for NZD/CAD reinforces this message as it suggests that short-term valuations are also stretched (Chart I-13). Chart I-12NZD/CAD Is Pricey...
NZD/CAD Is Pricey...
NZD/CAD Is Pricey...
Chart I-13...And Our Short-Term Valuation Metric Agrees
...And Our Short-Term Valuation Metric Agrees
...And Our Short-Term Valuation Metric Agrees
Second, the New Zealand economy is currently weaker than that of Canada. Relative consumer confidence and business confidence have been in a downward trend for three years. Historically, while NZD/CAD can deviate from such dynamics, ultimately this cross tends to revert toward relative growth trends. The recent collapse in New Zealand’s economic surprises relative to Canada’s suggests that the timing for such a reversion is increasingly ripe, as there is currently scope for investors to discount a more hawkish Bank of Canada than Reserve Bank of New Zealand. Indeed, 1-year/1-year forward yields in Canada have fallen much more relative to the BoC overnight rate than similar forwards have fallen relative to the RBNZ policy rate. Third, New Zealand real bond yields have collapsed relative to Canada’s. As Chart I-14 illustrates, NZD/CAD tends to follow real yield differentials. So far, NZD/CAD has been less-weak than the real-yield gap would imply, but from late 2003 to early 2005 this cross also managed to defy gravity for an extended time, only to ultimately succumb to the inevitable. Chart I-14Falling Real Yield Spreads Will Weigh On NZD/CAD
Falling Real Yield Spreads Will Weigh On NZD/CAD
Falling Real Yield Spreads Will Weigh On NZD/CAD
Fourth, as the top panel of Chart I-15 illustrates, the performance of kiwi stocks relative to Canadian equities tend to lead NZD/CAD, especially at tops. While tentative, the ratio of New Zealand to Canadian stocks seems to have peaked in early 2016. Supporting this judgment, kiwi profits have fallen relative to their Canadian counterparts and relative net earnings revisions are following a similar path – a move normally associated with a weaker NZD/CAD (Chart I-15, bottom panel). Chart I-15Relative Stock Market Dynamics Look Poor
Relative Stock Market Dynamics Look Poor
Relative Stock Market Dynamics Look Poor
Fifth, terms of trades are becoming a growing headwind for NZD/CAD (Chart I-16). The price of agricultural commodities relative to energy products drives this pair, reflecting the comparative advantages of the two countries. BCA’s Commodity & Energy service is currently much more positive on the outlook for the energy complex than the agricultural complex. NZD/CAD is a perfect instrument to implement this view, especially now that the NZD suffers from a very rare negative carry against the CAD. Chart I-16A Negative Tems-Of-Trade Shock For NZD/CAD
A Negative Tems-Of-Trade Shock For NZD/CAD
A Negative Tems-Of-Trade Shock For NZD/CAD
Bottom Line: NZD/CAD is set to experience an important fall. The NZD currently suffers from a very rare negative carry against the CAD. The last time this happened, a large depreciation ensued. Moreover, valuations and economic trends argue in favor of shorting this pair. Finally, relative bond yields, equity dynamics and term-of-trade outlooks also point to a lower NZD/CAD. Sell at 0.900, with a stop at 0.927 for a target of 0.800. Mathieu Savary, Vice President Foreign Exchange Strategy mathieu@bcaresearch.com Footnotes 1 Please see U.S. Bond Strategy Weekly Report, titled “Caught Offside”, dated February 12, 2019, and the U.S. Bond Strategy Weekly Report, titled “The Great Unwind”, dated September 19, 2017, available at usbs.bcaresearch.com 2 Please see Geopolitical Strategy Special Report titled “China: Stimulating Amid The Trade Talks,” dated February 20, 2019 available at gps.bcaresearch.com Currencies U.S. Dollar Chart II-1USD Technicals 1
USD Technicals 1
USD Technicals 1
Chart II-2USD Technicals 2
USD Technicals 2
USD Technicals 2
Recent data in the U.S. has been mixed: Capacity Utilization underperformed expectations, coming in at 78.2%. However, Michigan Consumer Sentiment outperformed expectations, coming in at 95.5. Finally, the NAHB Housing Market Index also surprised to the upside, coming in at 62. The DXY has fallen by 0.2% this week. We remain bullish on the U.S. dollar on a cyclical basis, given that the Fed will end up hiking rates more than expected. However, the current easing of monetary conditions by Chinese authorities should tactically hurt the dollar and help commodity currencies. Moreover, the fact that the Fed announced that it might bring about an end to the balance sheet runoff sooner than expected will further help global liquidity conditions. The real question now is how long the coming dollar correction will last? Report Links: Balance Of Payments Across The G10 - February 15, 2019 A Simple Attractiveness Ranking For Currencies - February 8, 2019 Global Liquidity Trends Support The Dollar, But... - January 25, 2019 The Euro Chart II-3EUR Technicals 1
EUR Technicals 1
EUR Technicals 1
Chart II-4EUR Technicals 2
EUR Technicals 2
EUR Technicals 2
Recent data in the euro area has been mixed: The annual growth in construction output underperformed expectations, coming in at 0.7%. The current account balance also surprised to the downside, coming in at 33 billion euros. However, the Zew Survey – Economic sentiment, though negative, surprised to the upside, coming in at -16.6. EUR/USD has risen by 0.4% this week. We remain bearish on EUR/USD on a cyclical basis; given that, we expect real rates to rise much faster in the U.S. than in the euro area. This is because we think that the U.S. economy will remain stronger than Europe’s, a consequence of the fact that the former has experienced a significant private sector deleveraging since 2008 while the latter has not. Report Links: Balance Of Payments Across The G10 - February 15, 2019 A Simple Attractiveness Ranking For Currencies - February 8, 2019 2019 Key Views: The Xs And The Currency Market - December 7, 2018 The Yen Chart II-5JPY Technicals 1
JPY Technicals 1
JPY Technicals 1
Chart II-6JPY Technicals 2
JPY Technicals 2
JPY Technicals 2
Recent data in Japan has been mixed: Machinery orders yearly growth outperformed to the upside, coming in at 0.9%. Hurt by a very sharp contraction in shipments to China, the yearly growth of Japanese exports also surprised to the downside, coming in at -8.4%. However, imports yearly growth outperformed to the upside, coming in at -0.6%. USD/JPY has risen by 0.2% this week. We are bearish towards the yen on a tactical basis as the current upturn in liquidity conditions should hurt safe haven currencies. Moreover, reflationary efforts by Chinese Authorities should provide a boon to risk assets and make low yield currencies like the yen even less attractive. Report Links: Balance Of Payments Across The G10 - February 15, 2019 A Simple Attractiveness Ranking For Currencies - February 8, 2019 Yen Fireworks - January 4, 2019 British Pound Chart II-7GBP Technicals 1
GBP Technicals 1
GBP Technicals 1
Chart II-8GBP Technicals 2
GBP Technicals 2
GBP Technicals 2
Recent data in the U.K. has been strong: Retail sales and retail sales ex-fuel yearly growth both outperformed expectations, coming in at 4.2% and 4.1%. Moreover, the yearly growth of average hourly earnings excluding bonus also surprised positively, coming in at 3.4%. GBP/USD has risen by 0.9% this week. We expect that a soft Brexit deal remains the most probable outcome out of Westminster. Thus, this factor, along with how cheap the pound is, make us bullish on the pound on a long-term basis. Report Links: Balance Of Payments Across The G10 - February 15, 2019 A Simple Attractiveness Ranking For Currencies - February 8, 2019 Deadlock In Westminster - January 18, 2019 Australian Dollar Chart II-9AUD Technicals 1
AUD Technicals 1
AUD Technicals 1
Chart II-10AUD Technicals 2
AUD Technicals 2
AUD Technicals 2
Recent data in Australia has been mixed: The wage price index yearly growth underperformed expectations, coming in at 0.5%. However, the employment change surprised to the upside, coming in at 39.1 thousand in January. The participation rate also surprised positively, coming in at 65.7%. AUD/USD has fallen 0.7% this week. We are positive on the AUD on a tactical basis. Global monetary conditions have eased thanks to the rising Chinese credit and more cautious global central banks. Moreover, the announcement that the Fed is looking to halt its balance sheet reduction sooner than expected has provided further relief. However, the fundamentals of Australia remain poor, and thus long-term investors should continue to avoid this currency, Report Links: Balance Of Payments Across The G10 - February 15, 2019 A Simple Attractiveness Ranking For Currencies - February 8, 2019 CAD And AUD: Jumping Higher To Plunge Deeper - February 1, 2019 New Zealand Dollar Chart II-11NZD Technicals 1
NZD Technicals 1
NZD Technicals 1
Chart II-12NZD Technicals 2
NZD Technicals 2
NZD Technicals 2
The recent data in New Zealand has been mixed: The business PMI in January fell to 53.1. However, the input of the producer price index on a quarter-over-quarter basis surprised to the upside, coming in at 1.6%. NZD/USD depreciated by 0.7% this week. While NZD/USD might have some upside in the short term, we remain bearish on the NZD/USD on a cyclical basis. Both the short-term and long-term interest rates in New Zealand are lower than in the U.S., while the real trade-weighted NZD is trading at 7% premium to its fair value. Thus, the kiwi is relatively overvalued which means that any tactical upside of NZD won’t have legs. Report Links: Balance Of Payments Across The G10 - February 15, 2019 A Simple Attractiveness Ranking For Currencies - February 8, 2019 Updating Our Intermediate Timing Models - November 2, 2018 Canadian Dollar Chart II-13CAD Technicals 1
CAD Technicals 1
CAD Technicals 1
Chart II-14CAD Technicals 2
CAD Technicals 2
CAD Technicals 2
The recent data in Canada has been neutral: The December new housing price index stays unchanged at 0%, on both month-over-month and year-over-year basis. The CAD has risen by 0.2% against USD this week. As BCA anticipates oil prices to strengthen more, we also expect the CAD to outperform the AUD and the NZD over the next few months. However, we remain bearish on CAD/USD on a structural basis. The unhealthy housing market in Canada could be a potential risk to the Canadian financial industry and the economy as a whole. Report Links: Balance Of Payments Across The G10 - February 15, 2019 A Simple Attractiveness Ranking For Currencies - February 8, 2019 CAD And AUD: Jumping Higher To Plunge Deeper - February 1, 2019 Swiss Franc Chart II-15CHF Technicals 1
CHF Technicals 1
CHF Technicals 1
Chart II-16CHF Technicals 2
CHF Technicals 2
CHF Technicals 2
The recent data in Switzerland has been positive: The December exports increased to 19,682 million, while the imports increased to 16,639 million. The trade balance in December thus increased to 3,043 million, surprised to the upside. EUR/CHF has been flat this week. We are bullish on EUR/CHF on a cyclical basis. Easy global financial conditions should hurt safe haven currencies like the franc. Moreover, we believe that the SNB will continue to play a heavily dovish bias in order to counteract the fall in inflation caused by the surge in the franc last year. Report Links: Balance Of Payments Across The G10 - February 15, 2019 A Simple Attractiveness Ranking For Currencies - February 8, 2019 Waiting For A Real Deal - December 7, 2018 Norwegian Krone Chart II-17NOK Technicals 1
NOK Technicals 1
NOK Technicals 1
Chart II-18NOK Technicals 2
NOK Technicals 2
NOK Technicals 2
Recent data in Norway has been positive: January trade balance increased to 28.8 million, from previous 25 billion. USD/NOK was flat this week. In general, we are overweight the krone, since we believe the pickup in oil prices will help the Norwegian economy, ultimately boosting the performance of NOK against the EUR, the SEK, the AUD and the NZD. Moreover, the NOK is undervalued and currently trading at a large discount to its fair value, which could further lift the performance of the NOK on a cyclical basis. Report Links: Balance Of Payments Across The G10 - February 15, 2019 A Simple Attractiveness Ranking For Currencies - February 8, 2019 Global Liquidity Trends Support The Dollar, But... - January 25, 2019 Swedish Krona Chart II-19SEK Technicals 1
SEK Technicals 1
SEK Technicals 1
Chart II-20SEK Technicals 2
SEK Technicals 2
SEK Technicals 2
Recent data in Sweden has been negative: January unemployment rate has increased to 6.5%. Moreover, the monthly inflation rate comes in at -1%, surprising to the downside. USD/SEK rallied by more than 1% this week. We remain bearish on EUR/SEK since the SEK is currently trading at a discount to its long-term fair value. Moreover, there are many signs pointing to a Swedish economy rebound. The negative rate in the country and easy financial conditions could stimulate the domestic demand and if global growth perks up, the weak inflation readings will prove transitory. The Riksbank has already abandoned it pledge to suppress the krona and it will move this year to lift rates again. Report Links: Balance Of Payments Across The G10 - February 15, 2019 A Simple Attractiveness Ranking For Currencies - February 8, 2019 Global Liquidity Trends Support The Dollar, But... - January 25, 2019 Trades & Forecasts Forecast Summary Core Portfolio Tactical Trades Closed Trades
Highlights Please note that analysis on India is published below. Even if the recent upturn in the Chinese credit impulse is sustained, there will likely still be a six- to nine-month lag between the impulse’s trough and the bottom in the mainland’s business cycle. EM corporate earnings cycles typically lag Chinese stimulus efforts by about nine months. Therefore, EM profits will be contracting in the first three quarters of 2019. This will short-circuit the current rebound in EM share prices. EM equity valuations are not cheap enough to shield stocks from profit contraction. Feature China’s credit growth was very strong in January. We contend that even if the upturn in the credit impulse proves to be persistent, there will likely be a six- to nine-month lag between its low point and the bottom in the mainland’s business cycle. Chart I-1 demonstrates that the credit impulse leads both nominal manufacturing output growth and the manufacturing PMI’s import subcomponent by roughly nine months. Chinese imports are the most pertinent variable to gauge China’s economic impact on the rest of the world. Chart I-1China: Credit Impulse Leads Business Cycle By Nine Months
China: Credit Impulse Leads Business Cycle By Nine Months
China: Credit Impulse Leads Business Cycle By Nine Months
In the meantime, will financial markets exposed to Chinese growth look through the valley of the ongoing growth deceleration and continue to rally? Or will they experience a major relapse in the coming months? In our opinion, corporate profits will be the key to broader financial market performance. So long as corporate profits do not shrink, investors will likely look beyond weak macro data, and any weakness in stocks will be minor. However, if corporate profits contract in the next nine months, then share prices will plummet anew. EM Profits Are Heading Into Contraction Chart I-2 illustrates that China’s credit impulse leads both EM and Chinese corporate earnings per share (EPS) by at least nine months and that it currently foreshadows EPS contraction in the first three quarters of 2019. Even if the recent upturn in the credit impulse is sustained, EM and Chinese EPS growth will likely bottom only in August – while they are in negative territory. Chart I-2EM EPS Is Beginning To Contract
EM EPS Is Beginning To Contract
EM EPS Is Beginning To Contract
EM corporate earnings growth has already dropped to zero and will turn negative in 2019. Chart I-3A reveals that EPS in U.S. dollar terms are already contracting in six out of 10 sectors – industrials, consumer staples, consumer discretionary, telecom, utilities and health care. Chart I-3AEM EPS By Sector
EM EPS By Sector
EM EPS By Sector
Chart I-3BEM EPS By Sector
EM EPS By Sector
EM EPS By Sector
EPS growth has not yet turned negative for financials, technology, energy and materials (Chart I-3B). Notably, corporate earnings within these four sectors collectively account for 70% of EM total corporate earnings, as shown in Table I-1.
Chart I-
Over the course of 2019, these sectors’ EPS are also set to shrink: Technology (accounts for 20% of MSCI EM corporate earnings): NAND semiconductor prices have been plunging for some time, and DRAM prices are also beginning to drop (Chart I-4). This reflects broad-based weakness in global trade – global auto sales are shrinking for the first time since the 2008 global financial crisis, global semiconductor sales are relapsing and global mobile phones shipments are falling (Chart I-5). Chart I-4Semiconductor Prices Are Falling
Semiconductor Prices Are Falling
Semiconductor Prices Are Falling
Chart I-5Broad-Based Weakness In Global Trade
Broad-Based Weakness In Global Trade
Broad-Based Weakness In Global Trade
Semiconductors accounted for 77% of Samsung’s operating profits in the first three quarters of 2018, suggesting the potential drop in DRAM prices will be devastating for its profits. Next week we will publish a Special Report on Korea and discuss the outlook for both semiconductors and Korean profits in more detail. In addition, the ongoing contraction in Taiwanese exports of electronics parts confirms downside risks to EM tech earnings (please refer to top panel of Chart I-3B). In brief, the ongoing decline in semiconductor prices will bring about EPS contraction in the EM technology sector. Financials/Banks (financials make up 31% of EM corporate earnings): Banks’ profits often correlate with fluctuations in economic activity, because the latter drive non-performing loan (NPL) cycles (Chart I-6). NPL cycles outside Brazil, Russia and India – where the banking systems have already gone through substantial NPL recognition and provisioning – will deteriorate, and push banks to increase their provisions. The latter will be a major drag on EM banks’ profits. Chart I-6EM Banks EPS And Economic Activity
EM Banks EPS And Economic Activity
EM Banks EPS And Economic Activity
Regarding Chinese banks in particular, if the credit revival in January is sustained, it would strongly suggest that the government is resorting to its old, credit-driven growth playbook. Following 10 years of an enormous credit frenzy and a 20-year capital spending boom, it is currently difficult to find many financially viable projects. Hence, a renewed credit binge will once again be associated with further capital misallocation and more NPLs. Many of these projects will fail to generate sufficient cash flow to service debt. NPLs will thus rise considerably and the need to raise capital will dilute the banks’ existing shareholders. Of course, this will happen with a time lag. Chart I-7 shows that the gap between Chinese banks’ EPS and non-diluted profits has once again widened, and that EPS are beginning to contract. Chart I-7Chinese Banks: Earnings Dilution
Chinese Banks: Earnings Dilution
Chinese Banks: Earnings Dilution
Chinese banks could issue perpetual bonds – discussed in great detail in last week’s report – to recapitalize themselves. Nevertheless, this will be negative for existing shareholders. In a nutshell, despite low multiples, share prices of Chinese banks will drop because more credit expansion amid the lingering credit bubble is negative for existing shareholders. The basis is that it will ultimately lead to their dilution. Chinese banks make up 4.5% of the MSCI’s EM equity market cap and 10% of aggregate EM profits. Hence, their EPS contraction will have a non-trivial impact on overall EM EPS. Resource sectors (energy and materials together make 20% of EM corporate earnings): The ongoing slowdown in China will exert renewed selling pressure in commodities markets. As shown in Chart I-9 on page 8, base metals prices lag the turning points in the Chinese credit impulse by several months and are still at risk of renewed price decline. Hence, profits of firms in the materials sector are at risk. Energy companies’ trailing EPS growth is still positive because the late-2018 carnage in oil prices has not yet filtered through to corporate earnings announcements (Chart I-3B on page 3). More importantly, the recent oil price rebound can be attributed to both Saudi Arabia’s output cuts as well as stronger demand – in the form of a surge in Chinese imports of oil and petroleum products. Chart I-8 illustrates that growth rates of China’s intake of oil and related products approached zero when crude prices were rising but has dramatically accelerated following their plunge. This is consistent with China’s pattern of buying commodities on dips. The point is that the upside in oil prices will be capped by China, which will likely moderate its oil purchases going forward, as crude prices have recently rallied. Chart I-8China And Oil
bca.ems_wr_2019_02_21_s1_c8
bca.ems_wr_2019_02_21_s1_c8
Bottom Line: EM profit cycles lag Chinese’s stimulus by about nine months. EM profits will be contracting in the first three quarters of 2019. This will short-circuit the current rebound in EM share prices. China’s Credit Cycles And Financial Markets What has been the relationship between China’s credit cycle and related financial markets over the past 10 years? The time lag between turning points in China’s credit impulse and relevant financial markets can be anywhere from zero to 18 months. Chart I-9 illustrates historical time lags between the Chinese credit impulse on the one hand and EM share prices, base metals prices and the global manufacturing PMI on the other. The time lag has not been consistent over time. Chart I-9Chinese Credit Impulse And Financial Markets: Understanding Time Lags
Chinese Credit Impulse And Financial Markets: Understanding Time Lags
Chinese Credit Impulse And Financial Markets: Understanding Time Lags
In late 2015-early 2016, the rebound in China’s credit impulse led financial markets by six months. At the recent market peak in January 2018, the credit impulse led financial markets and the global manufacturing PMI by about 18 months. In the meantime, in the 2012-13 mini cycle, EM share prices and commodities markets did not rally much, despite the meaningful upturn in China’s credit impulse. Finally, at the 2010-2011 peak, the credit impulse led EM stocks and base metals prices by 12 months. In short, the credit impulse led those financial markets by a few months to as much as a year and a half. Further, not only do time lags to the stimulus vary, but the impact on both economic activity and financial markets varies as well. This is because both economic activity and financial markets are driven by human psychology and behavior; iterations in stimulus, economic activity and financial markets are chaotic and complex in nature and do not follow well-defined patterns. Given the poor state of sentiment among Chinese consumers, business managers and entrepreneurs, more stimulus and more time may be required to turn the mainland’s business cycle this time around. Besides, unlike in previous episodes, there has not been any stimulus for the property market and no tax reductions on auto sales. Finally, although China and the U.S. may strike a deal on trade, it is unlikely to be a comprehensive agreement that is sustainable in the long run. This would be consistent with our Geopolitical Strategy team’s view that China and the U.S. are in a long-term and broad geopolitical confrontation – not a trade war. The trade war and tariffs are just one dimension of this. Hence, Chinese consumers and businesses, as well as the global business community may well look through this potential deal and not significantly alter their cautious behavior, at least for some time. In other words, the genie of geopolitical confrontation is out of the bottle, and the presidents of the U.S. and China are unlikely to succeed in putting it back. Bottom Line: Turning points in China’s credit impulse generally lead financial markets exposed to Chinese growth by several months. Given that the improvement in the credit impulse is both very recent and modest, odds are that China-related plays including EM risk assets will go through a major selloff before putting in a durable bottom.1 EM Equity Valuations In terms of the ability of EM stocks to withstand profit contraction, would cheap valuations not shield share prices from a considerable drop? We do not think EM equities are cheap; their valuations are neutral. Hence, there is no real valuation cushion in EM stocks to help them endure a period of negative EPS growth. We have written frequently about valuations and will touch on the topic only briefly here. Market cap-based multiples indeed appear very low. However, some segments of the EM universe such as Chinese banks and state-owned companies in Russia, Brazil, China and India have had low multiples for years. In other words, they are a value trap and their multiples are low for a reason. We elaborated above why Chinese banks are chronically “cheap”. For many other companies, low multiples are due to structural issues such as the lack of focus on profitability and shareholder value, or the high cyclicality of profits. Many of these stocks have large market caps, which pull down the EM index’s aggregate multiple. To remove market-cap bias, we have calculated 20% trimmed-mean multiples by ranking 50 MSCI EM industry groups (sub-sectors) and cutting off the top and bottom 10%. Then, we calculate the equal-weighted average of the remaining 80% of the sub-sectors. We did this calculation for the following five ratios: trailing P/E, forward P/E, price-to-cash earnings, price-to-book value and price-to-dividend. Then, we combined them into a composite valuation indicator (Chart I-10, top panel). This indicator shows that EM equity valuations are neutral. Chart I-10EM Equity Valuations In Absolute Terms
bca.ems_wr_2019_02_21_s1_c10
bca.ems_wr_2019_02_21_s1_c10
In addition, we calculated the median and equal-weighted composite valuation indicators (Chart I-10, middle and bottom panels). They also remove market cap bias and tell the same message: EM stocks are trading close to their fair value. EM equities are also close to their historical average relative to developed markets (DM). Chart I-11 illustrates relative EM versus DM valuation indicators based on 20%-trimmed mean, median and equal-weighted metrics. Chart I-11EM Equity Valuations Versus DM
bca.ems_wr_2019_02_21_s1_c11
bca.ems_wr_2019_02_21_s1_c11
In sum, EM valuations are not cheap neither in absolute terms, nor relative to DM. According to both measures, valuations are neutral. Hence, valuations will not prevent share prices from falling as profits begin to contract. This is why we continue to recommend a defensive strategy for absolute-return investors, and we continue to underweight EM versus DM within a global equity portfolio. Arthur Budaghyan, Senior Vice President Emerging Markets Strategy arthurb@bcaresearch.com India: Beware Of Rural Growth Lapse Indian share prices are weak and are underperforming the emerging markets benchmark in U.S. dollar terms (Chart II-1, top panel). Small cap stocks are in a full-fledged bear market (Chart II-1, bottom panel). Chart II-1Indian Stocks Are Weak
Indian Stocks Are Weak
Indian Stocks Are Weak
The latest earnings season turned out to be disappointing. Many companies missed their earnings estimates. Chart II-2 shows that net profit margins of listed non-financial companies have turned down and overall EPS growth is weakening. Chart II-2Indian Corporate Profits Are Sluggish
Indian Corporate Profits Are Sluggish
Indian Corporate Profits Are Sluggish
Disappointing corporate earnings are confirmed by macro data as well. Chart II-3A shows that manufacturing production is decelerating and intermediate goods production is contracting. Further, sales of two-wheelers, three-wheelers, passenger and commercial vehicles, as well as tractors, are either slowing or contracting (Chart II-3B). Chart II-3ACyclical Spending Is Decelerating
Cyclical Spending Is Decelerating
Cyclical Spending Is Decelerating
Chart II-3BCyclical Spending Is Decelerating
Cyclical Spending Is Decelerating
Cyclical Spending Is Decelerating
This weakness emanates from rural areas. The basis is that food prices have been falling since the summer of 2018 – and are deflating for the first time since the early 2000s. This is hurting rural incomes. Several indicators confirm considerable weakness in rural income growth and the latter’s underperformance versus urban income and spending: The top panel of Chart II-4 illustrates that our proxy for spending in rural areas relative to urban areas has deteriorated massively along with the decline in Indian food prices. Chart II-4Rural Spending Is Weaker Than Urban One
Rural Spending Is Weaker Than Urban One
Rural Spending Is Weaker Than Urban One
This measure is calculated as revenue growth of four rural-exposed listed companies minus the revenue growth of four urban-exposed listed companies. In both cases, the companies largely operate in the consumer goods space. Credit growth in rural areas has lagged that of urban areas, explaining the underperformance of rural spending (Chart II-4, bottom panel). Corroborating this, stock prices of these urban-exposed companies have outperformed their rural peers substantially (Chart II-5). Chart II-5Urban-Exposed Stocks Have Outperformed Rural Ones
Urban-Exposed Stocks Have Outperformed Rural Ones
Urban-Exposed Stocks Have Outperformed Rural Ones
Such a slump in rural income is posing a challenge to Modi’s re-election in May. His government – which lost three key state elections in late 2018 – is aware of these ominous trends and is acting boldly to revive income growth in rural areas. The government announced an expansionary budget that appeases rural voters. In particular, the budget aims to strengthen farmers’ support schemes, cut taxes for low- and middle-income earners and introduce a pension scheme for social security coverage of unorganized labor. However, there is a significant risk that the authorities’ fiscal and monetary stimulus are too late to lift growth before May’s elections. According to the past relationship between fiscal spending and India’s business cycle, higher government expenditure growth will only begin to have an effect on the economy in the second half of this year – i.e. after the elections are held (Chart II-6). Hence, the BJP could lose its majority, meaning it would either rule in a minority government or be forced to turn over power to the Congress Party and its allies. Chart II-6Government Expenditures To Lift Growth In H2 2019
Government Expenditures To Lift Growth In H2 2019
Government Expenditures To Lift Growth In H2 2019
Beyond the elections, food prices might be approaching their lows. Well-below average rain will likely result in weak agricultural production and, hence, higher food prices in the second half of 2019 (Chart II-7). Chart II-7Below Trend Monsoon = Food Prices Will Likely Rise
Below Trend Monsoon = Food Prices Will Likely Rise
Below Trend Monsoon = Food Prices Will Likely Rise
Therefore, in the second half of 2019, both fiscal easing and higher food prices will revive rural incomes and spending. In the meantime, monetary easing and credit growth acceleration will support demand in urban areas. Overall, Indian financial markets will likely remain in a risk zone until the elections as economic growth and corporate profits will continue to disappoint. If the opposition Congress Party’s alliance wins the election, Indian stocks and the currency will initially sell off. After this point, Indian assets could offer a buying opportunity because growth will likely revive in the second half of 2019. Bottom Line: For now, we continue to recommend an underweight position in Indian equities relative to the EM equity benchmark. Weakening growth, the very low interest rate differential versus U.S. rates and political uncertainty ahead of the general elections, pose risks of renewed rupee depreciation. A weaker rupee will continue to benefit India’s export-oriented software companies. Therefore, we also reiterate our long Indian software / short EM stocks recommendation. Finally, fixed-income investors should stay with the yield curve steepening trade. The central bank could further cut rates in the near term. However, long-term bond yields will not fall substantially and will likely start drifting higher sooner than later. The widening fiscal deficit, expectations of growth revival in the second half of 2019, and eventually higher food prices and inflation expectations, will all lead to a continuous steepening in the local yield curve. Ayman Kawtharani, Associate Editor ayman@bcaresearch.com Footnotes 1 This is the view of BCA’s Emerging Markets Strategy team and it is different from BCA’s house view on China-related assets and the global business cycle. The primary source of the difference is the outlook for China’s growth. Equity Recommendations Fixed-Income, Credit And Currency Recommendations
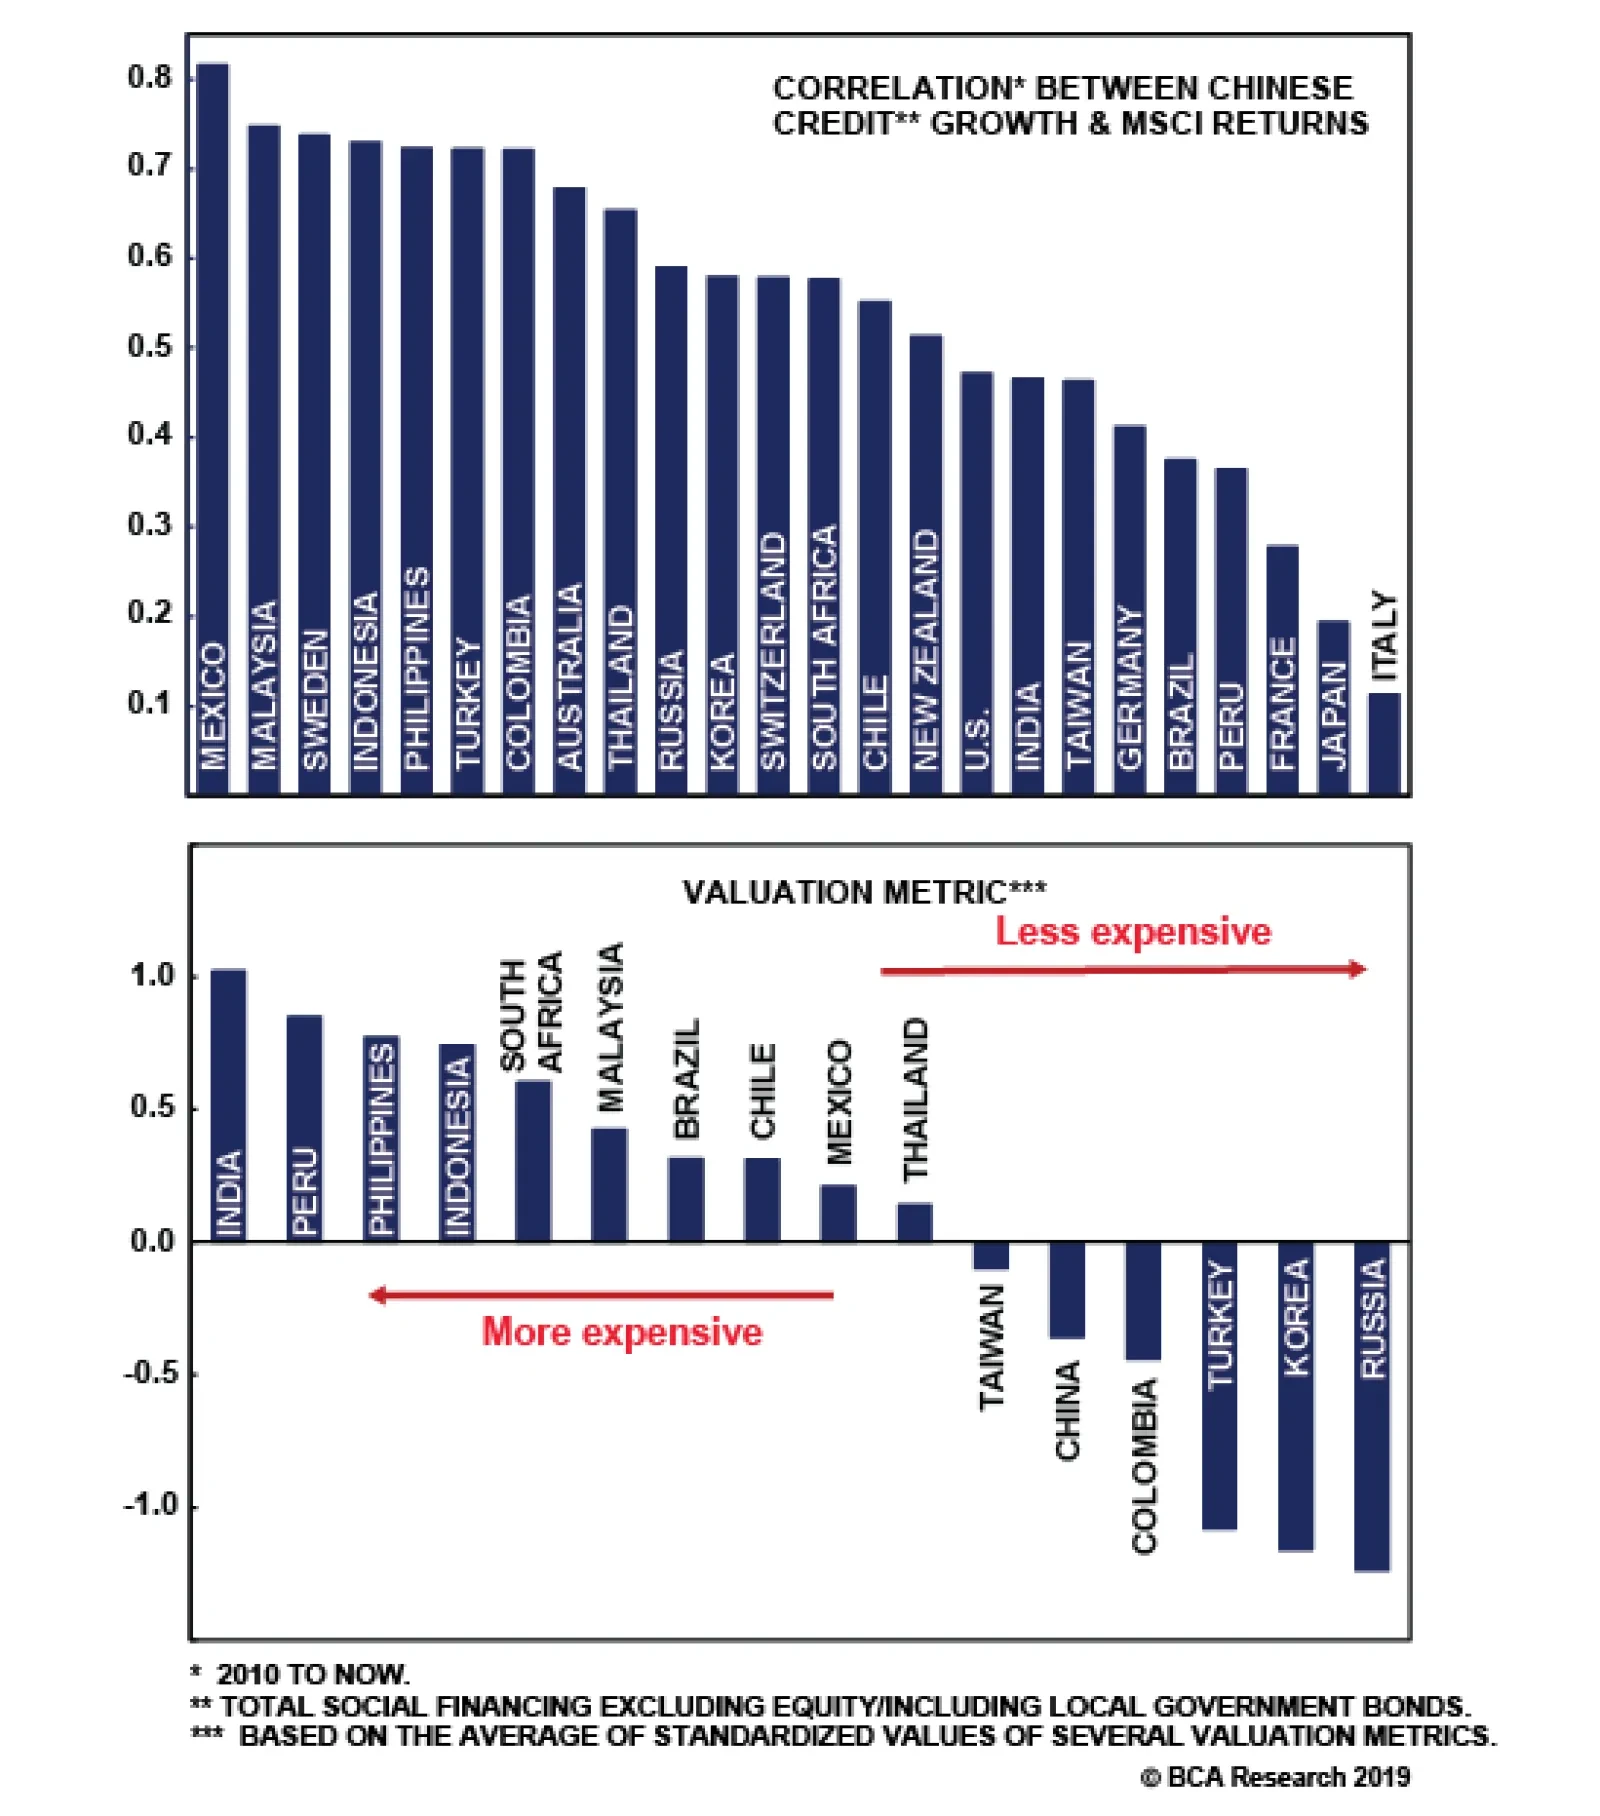
Our Geopolitical Strategy service examines the relationship between Chinese credit and MSCI equity returns of various countries. We find that Malaysian, Australian, South Korean, and Indonesian equities are the most highly correlated with Chinese…
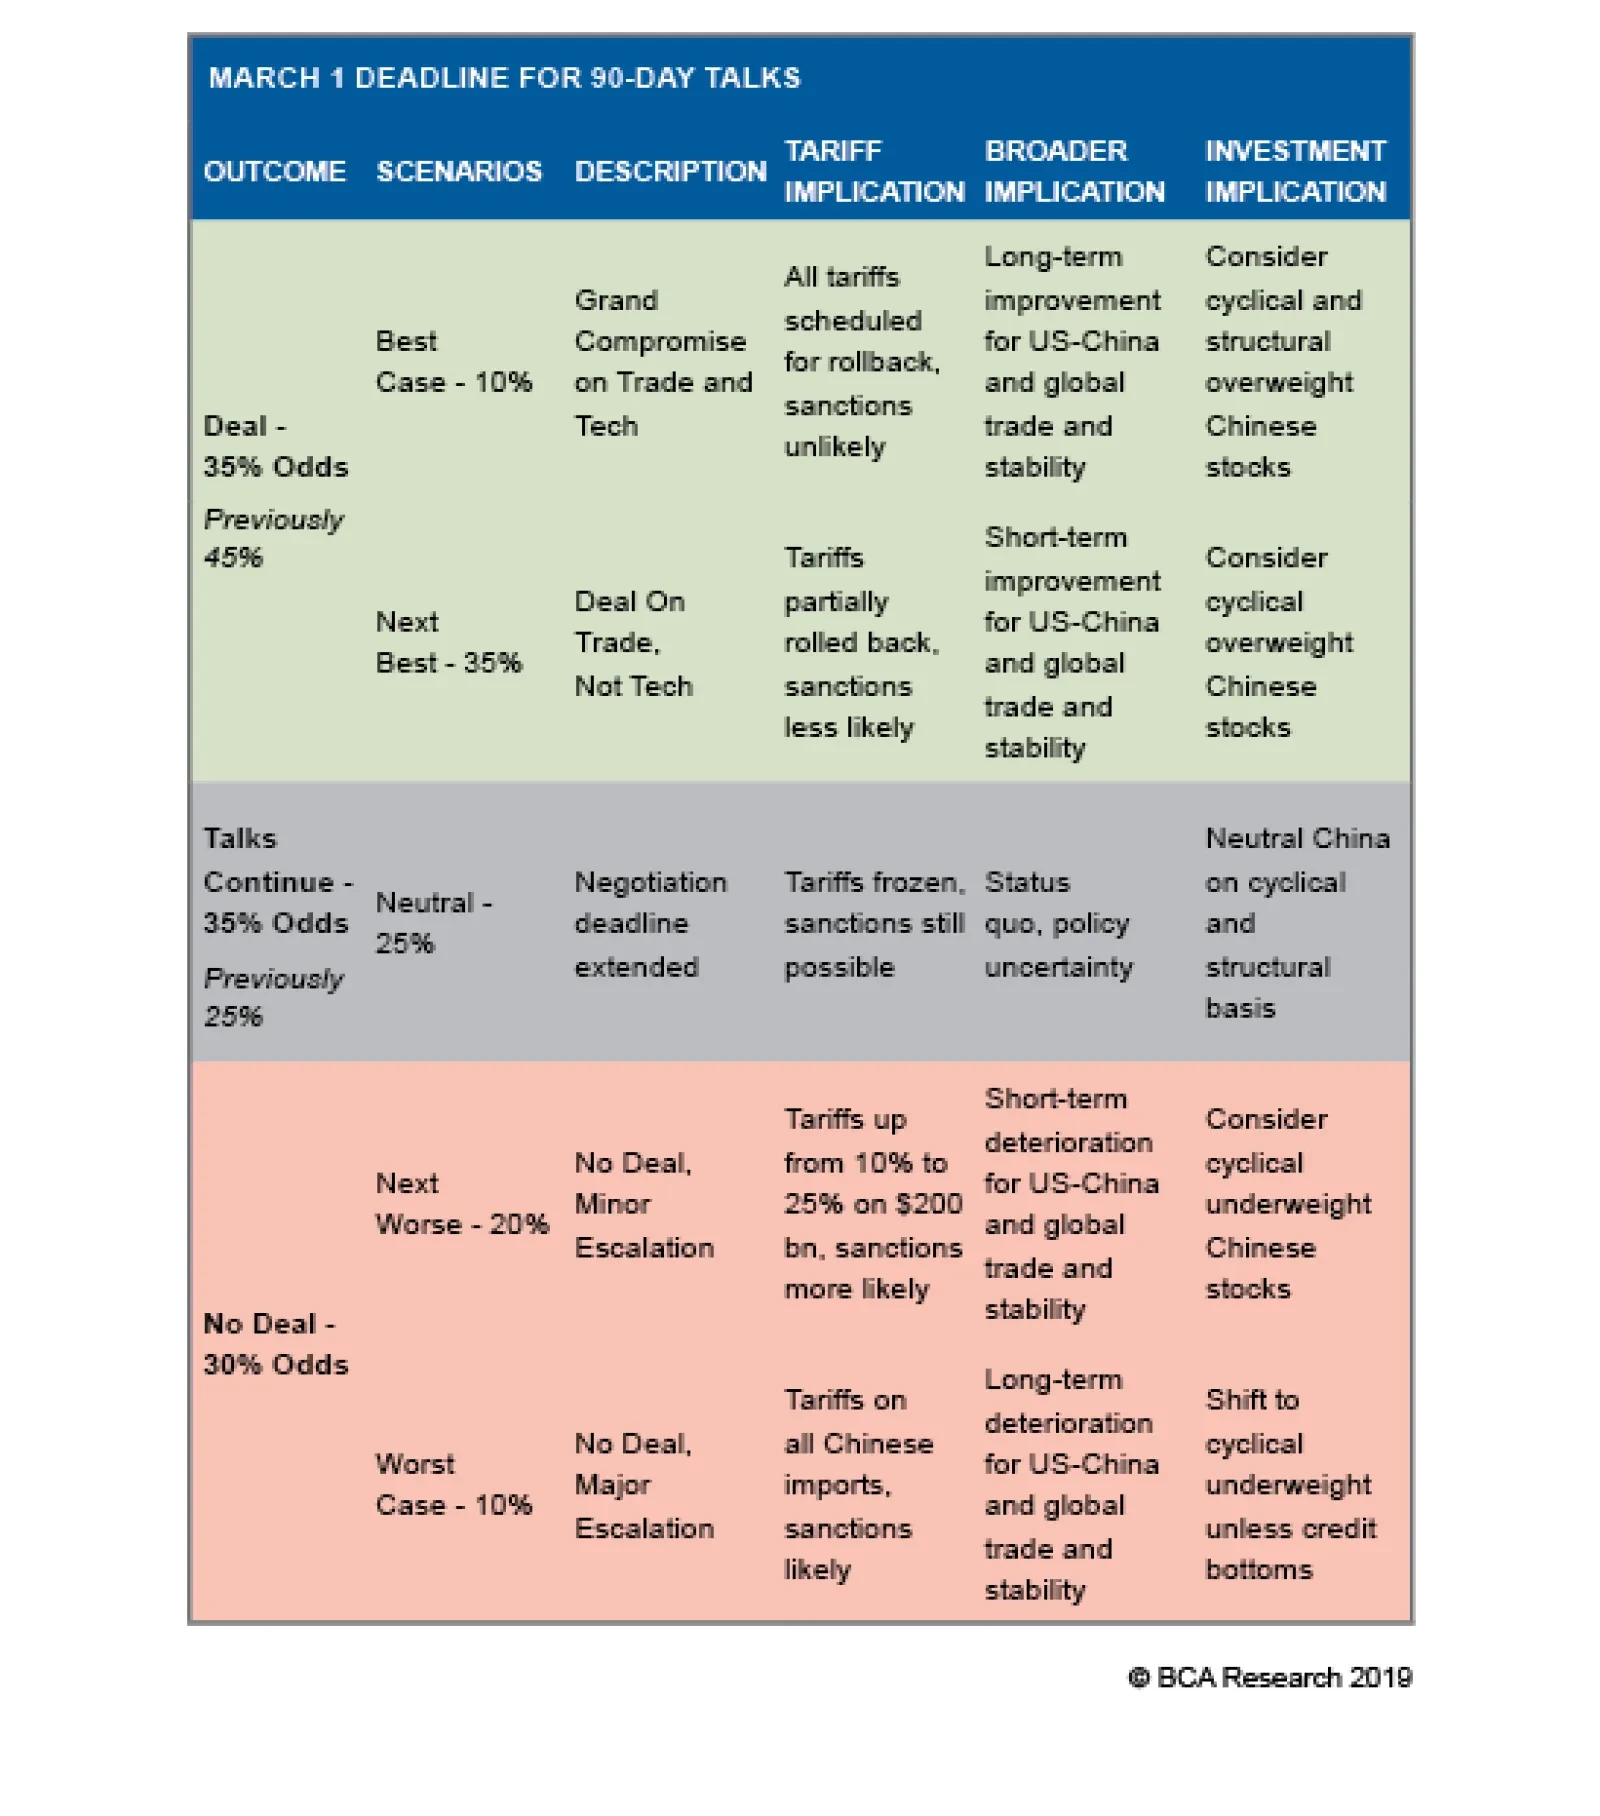
The latest news flow is mildly positive for the odds of getting a framework deal sometime this year. President Trump visited the Chinese negotiators in Washington, while President Xi reciprocated with the American negotiators in Beijing. Trump has signaled…
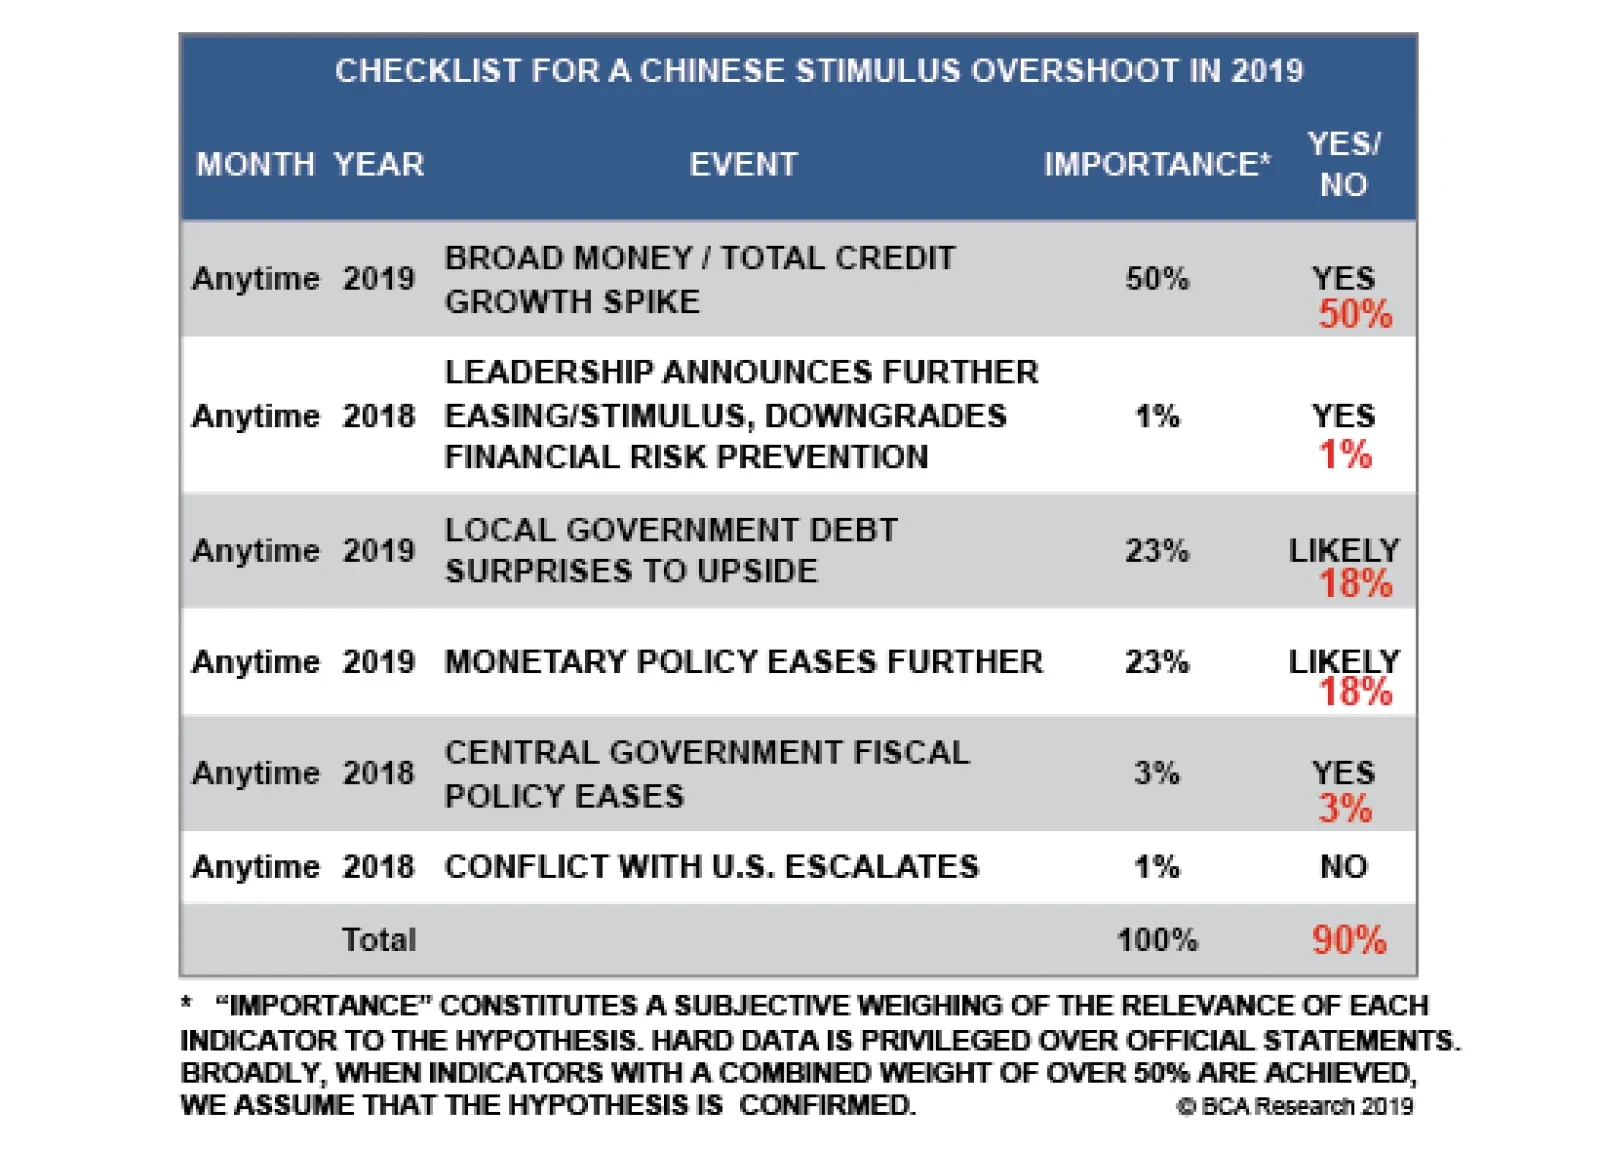
A spike in new credit is the single most important criterion in our “Checklist For A Stimulus Overshoot.” From a policy perspective, we are now at higher risk of an overshoot. Both informal lending and overall credit saw a surge in January, implying that the…
Highlights So What? China’s January credit data suggest that stimulus is here. Why? January credit growth was a blowout number. Trade uncertainty is likely to be prolonged with an extension of talks. Equity bourses in South Korea and Russia are the most likely to benefit from Chinese stimulus. Industrial metals such as copper will also benefit – with a delay. Feature New credit data for China in January improves the chances that Beijing’s stimulus measures will overshoot this year, causing China’s economy to bottom in 2019 and jumpstart global growth. In our annual outlook for this year we argued that while China was stimulating the economy, the magnitude of stimulus would be the decisive factor for the global macro environment in 2019. We argued that the type of stimulus would remain primarily fiscal – tax cuts for households and small and medium-sized enterprises – and hence that it would be modest as fiscal easing would merely offset relatively weak credit growth. This view stemmed from our assessment of the Xi Jinping administration, highlighted in April 2017, as an “elitist” (not populist) administration. Its policy priorities are to discipline the Chinese economy, and in particular to contain systemic financial risk, which President Xi has cited as a national security threat. This view is not wrong, but the latest data clearly show that Xi has decided to pause these painful efforts at limiting leverage and rebalancing China’s economy. Witness January’s decisive uptick in both total social financing (total private credit) and local government bond issuance (Chart 1). Chart 1Higher Risk Of An Overshoot
Higher Risk Of An Overshoot
Higher Risk Of An Overshoot
A massive spike in new credit is the single most important criterion in our “Checklist For A Stimulus Overshoot.” Thus, from a policy perspective, we are now at higher risk of an overshoot (Table 1). Not only credit as a whole but also informal lending saw a surge in January, implying that the government is relenting in its crackdown on the shadow banks. The approval of local government bond issuance for early in the year – and the People’s Bank of China’s announcement of a “Central Bank Bills Swap” program – reinforce this policy shift.1 Table 1Checklist For A Chinese Stimulus Overshoot In 2019
China: Stimulating Amid The Trade Talks
China: Stimulating Amid The Trade Talks
A stimulus overshoot is positive for Chinese demand in the short run but negative for potential GDP in the long run. A “traditional” credit surge of this nature cannot be surgically targeted at SMEs or households. It will go to state-owned enterprises, privileged corporations, property developers, and the like, which have always had the advantage in China’s financial system. SOEs have taken a much larger share of new loans than private companies in recent years,2 and the only silver lining of this trend was the possibility that tighter credit controls would discipline the SOEs. That silver lining is now fading, barring some new and surprising development on the reform front. China needs to create 26 trillion renminbi in new credit over the course of the year to avoid a corporate earnings contraction. These January numbers put China on track to do just that (Chart 2), assuming that President Xi and U.S. President Donald Trump agree to a short-term, framework trade deal this year. Chart 2On Track To Avoid An Earnings Contraction
On Track To Avoid An Earnings Contraction
On Track To Avoid An Earnings Contraction
Of course, a few caveats are in order. First, January’s credit number is only one data point and credit growth is always abnormally strong in the first month of the year. Early in the year, banks seek to expand their assets rapidly in a bid to get as much market share as possible before administrative credit quotas kick in. Because of Chinese New Year, it is best to combine January and February data to get a sense of the rate of credit expansion in the first part of the year. To do that, investors will have to wait for mid-March when the February data is out. This year’s January numbers are very strong relative to previous Januaries (Chart 3) and the context is more accommodative than the 2017 January credit surge, when authorities were beginning to tighten rather than ease macroprudential policy. Still a rapid rate of credit expansion will have to be sustained in the coming months in order to meet the 26 trillion RMB requirement highlighted above.
Chart 3
Second, there is some risk that China’s households and private businesses will not respond as positively today as in the past. The intensification of Communist Party control over the society and economy, President Xi’s cancellation of term limits, and the strategic confrontation with the United States have created a bearish sentiment in the private sector. Our Emerging Markets Strategy would point out that if the propensity to consume, and money velocity,3 do not accelerate, then a surge in new credit may fail to ignite a reacceleration in China (Chart 4). Chart 4Chinese Are Holding On To Their Money
Chinese Are Holding On To Their Money
Chinese Are Holding On To Their Money
Still, what we now know is that Xi Jinping and his top economic adviser, Vice Premier Liu He, are not initiating the “assault phase of reform” that their predecessors initiated in the late 1990s in order to cleanse China’s economy of bad loans and zombie companies. Instead, they are likely reestablishing the “Socialist Put” in order to reverse the current deceleration, demonstrate China’s continued economic might and face down the United States’ threat of tariffs. Bottom Line: China’s stimulus measures are increasingly likely to overshoot, with positive implications for both Chinese and global growth. China is still facing a corporate earnings recession, but the odds of averting it are increasing. Trade Deadline More Likely To Be Extended What of the trade war? First, we would warn clients that China’s annual credit origination is a much bigger factor for the global economy than China’s exports to the United States (Chart 5). The trade war can escalate from here and yet, if China’s stimulus works as it has in the past, the results will be manageable for China’s economy save for Chinese companies expressly exposed to the U.S. economy through exports. In reality, both the U.S. and China are now effectively stimulating their economies and in this sense global trade as a whole will benefit regardless of bilateral tariffs. Chart 5Watch China Credit, Not So Much The Trade War
Watch China Credit, Not So Much The Trade War
Watch China Credit, Not So Much The Trade War
But it is possible that just as global equity markets ignored China’s economic slowdown and only sold off when the tariffs were levied (Chart 6), they may not continue to rally much on China’s credit data. Given the already considerable rally in global risk assets since October, markets may not be satisfied merely with one or two months of solid credit data out of China without a clear resolution to the trade conflict. After all, if a collapse in U.S.-China trade talks portends a new Cold War, then institutional investors may be justified in taking a wait-and-see approach despite China’s credit cycle upswing. Chart 6Will Equities Ignore China Data (Again)?
Will Equities Ignore China Data (Again)?
Will Equities Ignore China Data (Again)?
In the past, we have highlighted that the U.S. and China are not economically prohibited from engaging in a trade war – the export exposure is too small – and China’s new stimulus reinforces this point. However, President Trump is concerned about causing a sell-off in the tech sector and hence the broad equity market which could translate into a bear market and raise the probability of a recession occurring prior to November 2020. Meanwhile, in China, given Beijing’s reported trade concessions, there is apparently a desire to pacify the relationship and discourage U.S. unilateral tariffs and sanctions that could become seriously destabilizing for the Chinese economy and society. The need to have a happy 2021 centenary celebration for the Communist Party may factor into policymakers’ thinking. The latest news flow is mildly positive for the odds of getting a framework deal sometime this year. President Trump visited the Chinese negotiators in Washington, D.C. while President Xi reciprocated with the American negotiators in Beijing. Trump has signaled that an extension of the March 1 deadline is possible, and a two-month extension is being bandied about in the press. China’s National People’s Congress is likely to pass a new Foreign Investment Law that ostensibly guarantees many of the American demands on forced tech transfer, intellectual property theft, and discriminatory treatment of U.S. companies (Table 2). Even the second Trump summit with Kim Jong Un, this time in Vietnam, should be seen as a mild positive for U.S.-China negotiations. Table 2New Foreign Investment Law Would Be A Positive For U.S.-China Negotiations
China: Stimulating Amid The Trade Talks
China: Stimulating Amid The Trade Talks
However, Presidents Trump and Xi have yet to schedule a new summit, which is probably necessary for a final deal. And there are murmurs from the press suggesting that China’s new law and other concessions are not going to satisfy the U.S. negotiators on the critical point of “structural changes” and a verification process. This leaves us inclined to change our trade war probabilities to increase the odds of an extension (Table 3). The improvement in U.S. financial conditions and China’s stimulus, if anything, make it more likely that negotiations will be extended, as both sides feel their economic and financial constraints less acutely. Table 3Updated Trade War Probabilities
China: Stimulating Amid The Trade Talks
China: Stimulating Amid The Trade Talks
Bottom Line: Global and Chinese risk assets should rally on China’s credit uptick, but the lack of resolution of the trade war could continue to inhibit animal spirits – and the odds of a March 1 resolution are declining. Who Are The Equity Winners Of China’s Stimulus? China’s strong January credit number is supportive of global equity markets. That much is obvious. But which equity markets will benefit the most? In what follows we examine the relationship between Chinese credit and MSCI equity returns of various countries. We find that Malaysian, Australian, South Korean, and Indonesian equities are the most highly correlated with Chinese credit growth and are thus most likely to benefit from the recent upturn (Chart 7). On the other hand, France and Italy stand out as countries whose bourses are more insulated.
Chart 7
Out of the markets that are positively correlated, South Korea and Russia stand out as relatively cheap (Chart 8). Thus we expect these equities to do especially well. By contrast, while Indonesia and the Philippines are highly leveraged to China, these markets are currently relatively expensive. BCA’s Emerging Markets Strategy is currently overweight Korean and Russian equities within the EM space, neutral Turkey (although recently upgraded from underweight), and underweight Indonesia and the Philippines.
Chart 8
In addition to credit stimulus, we expect Chinese household consumption to also gain support going forward. This will likely be driven by policy stimulus targeting the consumer specifically and is best exemplified by the recently announced tax cuts (Chart 9), which we expect to trickle down to greater consumer demand and growth in retail sales. Our base case calls for 8%-10% growth in household consumption over the coming 12 months, up from the current 3.5%.
Chart 9
However, consumer sentiment in China is weak. BCA’s Emerging Markets Strategy’s proxy for household marginal propensity to spend ticked up recently, after falling since early last year (see Chart 4 above). A resumption in the decline would highlight that households are increasingly unwilling to spend, which would translate into weaker retail sales despite policy efforts to boost consumption. Such a scenario – in which credit growth accelerates without a substantial uptick in consumer spending – is plausible, given that it occurred between mid-2015 and mid-2016 (Chart 10). In any case, whether Chinese stimulus comes in the form of the traditional credit channel, or instead in the form of fiscal stimulus to household consumption, the same equity markets will generally benefit the most (Chart 11). Chart 10...But Flattish Retail Sales Are Also A Possibility
...But Flattish Retail Sales Are Also A Possibility
...But Flattish Retail Sales Are Also A Possibility
Chart 11
Indeed, global equity markets react the same way regardless of the type of stimulus implemented. For instance, MSCI returns for the Philippines, Sweden, Malaysia, Indonesia, and Turkey are more closely correlated to both Chinese credit growth and retail sales growth compared to Italy, Japan, and France. The same conclusion is reached when we look at the correlations between Chinese credit growth or consumption growth and individual MSCI sectors such as industrials and consumer discretionary (Chart 12).
Chart 12
The relatively stronger correlation between Chinese credit growth and equity returns – as opposed to Chinese retail sales and equity returns – can be put down to the nature of Chinese imports. While industrial goods account for the bulk of China’s purchases of foreign goods, consumer goods excluding autos make up only 15% of China’s imports (Table 4). However, as Chart 12 illustrates, the relationship between China’s retail sales growth and global equities is much tighter in the case of the consumer discretionary sector, whether the latter is compared to global industrials sectors or the overall MSCI index. Table 4Import Composition Of Chinese Imports
China: Stimulating Amid The Trade Talks
China: Stimulating Amid The Trade Talks
Equity market exposure to China is not always in line with the extent of each country’s trade exposure to China (Chart 13).
Chart 13
There are some clear exceptions – most notably Mexico, which has the highest correlation coefficient with Chinese credit and consumption variables since 2010. However, this is likely due to idiosyncratic factors.4 Correlation does not imply causation, and we cannot conclude with certainty that Mexican equities will outperform amid China’s new round of stimulus. Nevertheless, given that Mexico is a very deeply liquid market that benefits amid EM bull markets, this may not be entirely coincidental. The correlations between global equity markets and Chinese credit peak two months after the stimulus measures are first implemented (Chart 14). This is more or less in line with adjusted total social financing’s correlation versus industrial metals. However BCA’s Commodity & Energy Strategy has shown that copper’s correlations versus other measures of Chinese money and credit peak after roughly three quarters (Chart 15).5 This is evident in both the 2012 and 2015-16 stimulus episodes in which the bottom in copper prices lagged the bottom in China’s credit growth. Thus we may witness a rebound in equity markets on the back of China’s credit splurge before we see an improvement in annual returns on copper prices.
Chart 14
Chart 15Copper Rallies Lag China Credit Stimulus
Copper Rallies Lag China Credit Stimulus
Copper Rallies Lag China Credit Stimulus
Bottom Line: South Korean and Russian equities are best positioned to benefit from the positive surprise in China’s credit data. France and Italy are the worst positioned. Copper prices will rebound with a delay. Investment Implications BCA’s Geopolitical Strategy recommends that investors stay long Chinese equities ex-tech relative to the emerging market benchmark. This is a tactical call initiated in August 2018 that is now becoming a cyclical call on the basis of the credit upswing. We also remain long the “China Play Index,” a basket of China-sensitive assets, and long China’s “Big Five” banks relative to other banks. A rebound in China’s credit data and stronger global growth will support copper demand. Prices are still 15% below the mid-2018 peak and are poised to benefit in this environment, especially given that global inventories are already falling. BCA’s Geopolitical Strategy recommends that investors go long copper. Meanwhile, BCA’s China Investment Strategy recommends (for now) staying only tactically overweight Chinese equities relative to the global benchmark, pending higher conviction that the pace of credit growth will be strong enough to overwhelm the negative ramifications of a continued deceleration in actual activity over the coming few months on sentiment and 12-month forward earnings expectations. Over the long run, Geopolitical Strategy would look to underweight Chinese equities, as we are not optimistic about China’s productivity and potential GDP. This is because of the negative structural consequences of continuing the Socialist Put (i.e., bad loans, zombie companies, trade protectionism). We would expect CNY/USD to remain relatively buoyant in the context of both trade negotiations with the U.S. and fiscal-and-credit stimulus. The trade talks can hardly succeed if CNY/USD is falling. Depending on whether and how soon China’s stimulus results in a durable economic bottom, global growth could stabilize and the USD could see a substantial countertrend selloff. Matt Gertken, Vice President Geopolitical Strategy mattg@bcaresearch.com Roukaya Ibrahim, Editor/Strategist roukayai@bcaresearch.com Footnotes 1 Please see Emerging Markets Strategy Special Report titled “China: Prepping A Bazooka?” dated February 14, 2019 available at ems.bcaresearch.com 2 Please see Nicholas Lardy, “The State Strikes Back: The End Of Economic Reform In China?” Peterson Institute For International Economics, January 29, 2019, available at piie.com. 3 Please see Emerging Markets Strategy Weekly Report titled “Dissecting China’s Stimulus,” dated January 17, 2019 available at ems.bcaresearch.com 4 The 2012 election of President Enrique Peña Nieto caused Mexican equities to outperform their EM counterparts. Similarly in 2015-16, U.S. outperformance relative to EM also supported Mexico relative to EM because Mexico’s economy is highly leveraged to its northern neighbor. In both periods Mexico’s outperformance was not caused by – but instead coincided with – Chinese credit stimulus. These idiosyncratic events biased the correlation between Mexico’s equity markets and Chinese credit growth to the upside. 5 Please see Commodity & Energy Strategy Weekly Report titled “Trade Wars, China Credit Policy Will Roil Global Copper Markets,” dated June 21, 2018, available at ces.bcaresearch.com.
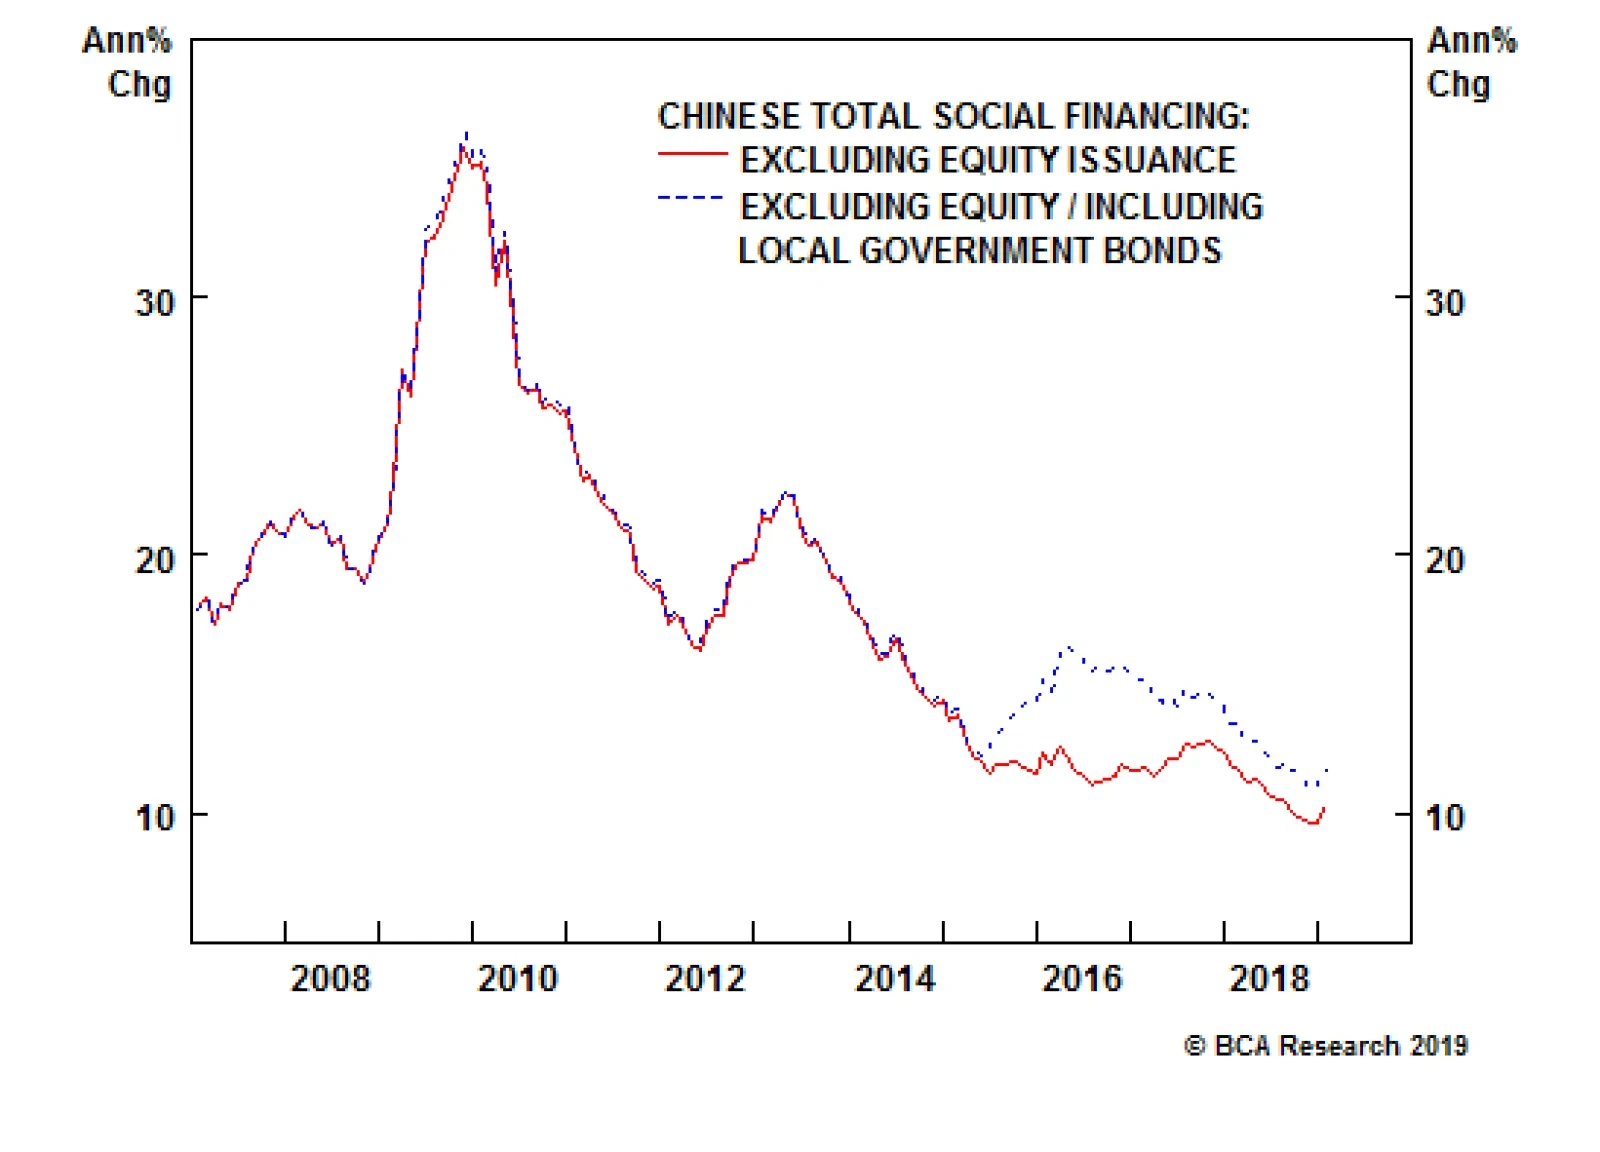
China’s total social financing numbers for January came in at CNY 4.6 trillion, a stunning number even when taking into account the seasonal strength evident every January. In fact, in a recent webcast, our geopolitical strategists argued that any number…