China
Under the CBS program, Chinese banks can buy each other’s perpetual bonds, then exchange these bonds for central bank bills and pledge those bills at the People Bank of China (PBoC) in order to receive funding. Insurance companies are also allowed to purchase…

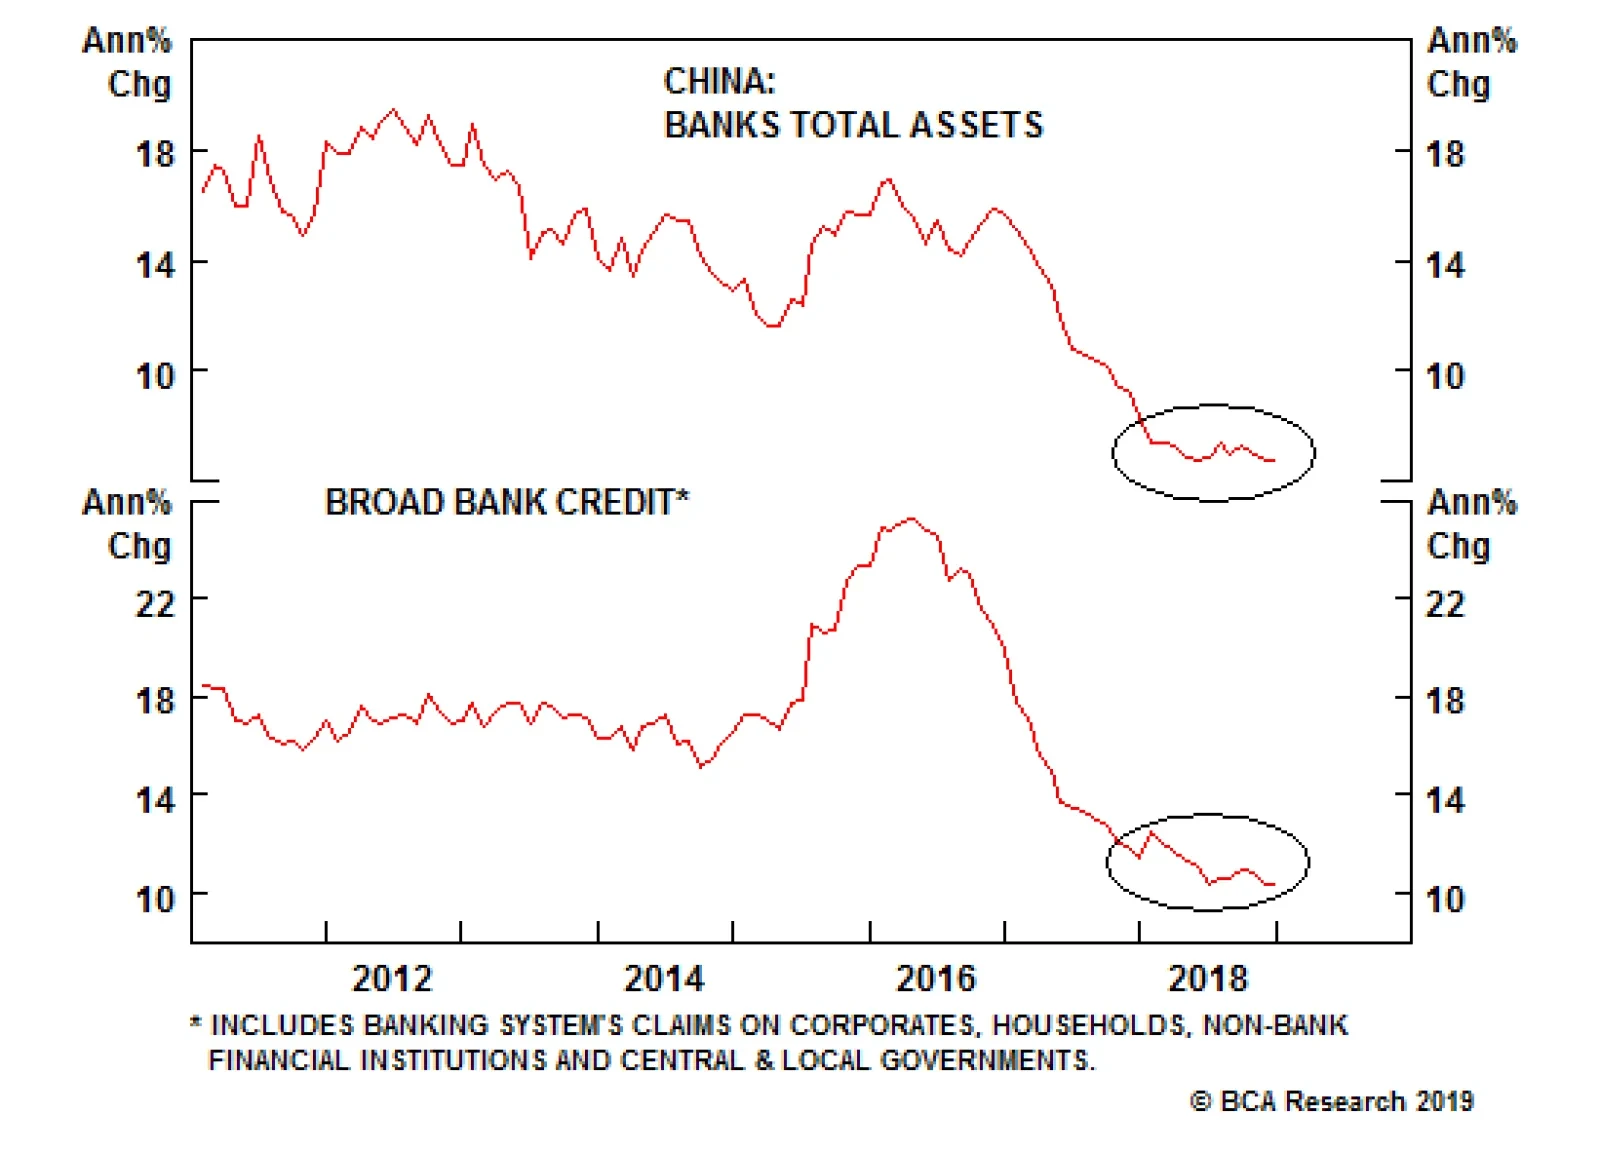
Highlights In their current form and size, perpetual bonds issuance and the central bank bills swap program are unlikely game-changers for the banking system in China. However, this mechanism constitutes monetization of banks’ capital and bad assets, i.e., recapitalization of banks, by the PBoC via quantitative easing. Hence, this scheme can be presently viewed as a bazooka that has not yet been loaded by the government. If the authorities pursue this program on a large scale without forcing banks to acknowledge and write off bad assets, banks would regain power to expand their balance sheets, fostering a cyclical economic recovery. Nevertheless, the growth model based on continuous “out of thin air” money and credit expansion inevitably leads to falling productivity growth and rising inflation. Therefore, the economic outcome over the course of several years would be stagflation, which is profoundly bearish for the currency. Feature The Chinese authorities recently launched a Central Bank Bills Swap (CBS) program to boost liquidity and facilitate issuance of commercial banks’ perpetual bonds. Box I-1 on pages 12-13 elaborates on the scheme and provides more detail about the program. Under the CBS program, Chinese banks can buy each other’s perpetual bonds, then exchange these bonds for central bank bills and pledge those bills at the People Bank of China (PBoC) to receive funding. Insurance companies are also allowed to purchase perpetual bonds, but they cannot pledge them with the central bank for funding. What are the macro implications of this program? Can the government use this scheme to recapitalize the banking system? Does the CBS program amount to quantitative easing? Will it be sufficient to boost credit growth in China in 2019? We have conditional answers to these questions – i.e., they all depend on the extent to which the scheme is actually utilized by the authorities. Chart I-1Chinese Banks: Total Assets And Broad Credit Growth
Chinese Banks: Total Assets And Broad Credit Growth
Chinese Banks: Total Assets And Broad Credit Growth
On the one hand, the CBS program could potentially become a proverbial bazooka used by the government to recapitalize the banking system via the PBoC monetizing banks’ bad assets. By doing so, the PBoC would be expanding its balance sheet by injecting excess reserves into the banking system – i.e., quantitative easing. Consequently, it could help banks accelerate credit and money growth, in turn helping the economy. The long-run collateral damage in this scenario, however, would be an RMB depreciation. On the other hand, the authorities could limit the usage of the scheme via various regulatory approvals and norms. In such a case, the impact of the program on money/credit growth and the real economy as well as on the exchange rate would be limited. In other words, it might end up being no more than a tool to help the four large banks meet BIS's TLAC requirements. At the moment, there is not enough information to determine whether the program will be a game changer for the banking system in China, leading to a surge in credit and broader economic recovery. Both total assets and broad credit growth among banks remain very weak for now (Chart I-1). In other words, it is a bazooka that has not been loaded, and may never be loaded because of the potential for seriously negative ramifications over the long term. Consequently, we maintain our view that China’s growth will continue to disappoint in the first half of 2019, and that China-related plays, including many emerging markets (EM), remain at risk of a renewed selloff. Bank Recapitalization? Chart I-2Chinese Banks Are Massively Under-Provisioned
Chinese Banks Are Massively Under-Provisioned
Chinese Banks Are Massively Under-Provisioned
In theory, the issuance of perpetual bonds along with the CBS program can be used to recapitalize the banking system. Each bank can buy perpetual bonds issued by other banks up to 10% of their core Tier-1 capital. These banks can get cheap financing from the PBoC by swapping these perpetual bonds with central bank bills, and then pledging those bills at the central bank to get funding. Hence, under this scheme, the PBoC will be financing purchases of perpetual bonds, which means the monetary authorities will indirectly be funding banks’ recapitalization. It is an “open secret” that Chinese banks would be considerably undercapitalized if they were forced to recognize non-performing assets. The non-performing loan (NPL) ratio currently stands at 1.9%, and the special-mention loans ratio is at 3.2%; and the sum of both is at 5.1% of total loans (Chart I-2, top panel). NPL provisions presently amount to 3.4% of total loans. When expressed as a share of total risk-weighted assets, the aggregate NPLs and special-mention loans are equal to 4.2% (Chart I-2, bottom panel). At 2.8% of risk-weighted assets, NPL provisions are extremely inadequate. Assuming non-performing assets turn out to be 10% of total risk-weighted assets, some 40% of banks' capital would be wiped out, according to our simulation presented in Table I-1. This is after accounting for existing provisions and assuming a 20% recovery rate of non-performing assets.
Chart I-
Provided that risk-weighting assigns a zero weight to banks’ claims on the government, a 50% risk weight to claims on households and a 100% weight to claims on companies, the assumption of 10% of non-performing assets in total risk-weighted assets is reasonable. This is especially the case when the enormous credit boom of the past 10 years is taken into consideration. As a result, in this scenario the capital adequacy ratio (CAR) will drop from its current level of 13.8% to 9.4%. This will bring the CAR below the regulatory minimum of 11%. To raise the CAR to the regulatory minimum of 11%, the banking system would require RMB 2 trillion of capital. This is greater than the maximum potential demand for perpetual bonds that we estimate to be up to RMB 1.4 trillion. To estimate this number, we assumed all banks purchase perpetual bonds in amounts equal to 5% of their core Tier-1 capital and all insurance companies buy perpetual bonds in an amount equal to 5% of assets. This is not an underestimation of potential demand for perpetual bonds since there are currently limitations on banks’ ability to issue and purchase these bonds as elaborated in Box I-1 on pages 12-13. In short, it is not clear if perpetual bond issuance and the CBS will be sufficient to undertake full recapitalization of the banking system and allow banks to accelerate their balance sheet expansion to finance an economic recovery. Bottom Line: In their current form and shape, perpetual bonds and the CBS program are unlikely to be a game-changer for the banking system in China. However, if the authorities eliminate limitations and change regulatory norms, the scheme could potentially be used to recapitalize China’s banking system. This is why this scheme can presently be viewed as a bazooka that has not yet been loaded by the government. Does CBS Represent QE? Its Impact On Liquidity And Money Supply The CBS program is a form of quantitative easing (QE). It will expand the PBoC’s balance sheet and banking system liquidity (excess reserves at the central bank), as elaborated in Box I-1 and Diagram I-1 on pages 12-14. If pursued on a large scale, this scheme would constitute monetization of banks’ capital and their bad assets by the central bank. The mechanism is already in place, but the extent to which authorities will use it to recapitalize banks remains unclear. Even though the CBS program will expand banking system liquidity – i.e., excess reserves at the central bank – it will not – however - affect broad money supply. The basis is simple: Banks’ excess reserves at the central bank are not part of the broad money supply in any country. Banks use excess reserves to settle payments between one another and with the central bank. Banks do not lend out excess reserves. Further, only a central bank can create excess reserves, and it does so “out of thin air.” In brief, excess reserves rather than corporate and individual deposits constitute genuine banking system liquidity. Barring lending to or buying assets from non-banks – which does not typically occur outside of QE programs – central banks do not create broad money or deposits.1 Money/deposits, the ultimate purchasing power for economic agents, is created by commercial banks “out of thin air,” as we have discussed and illustrated in our series of reports on money, credit and savings.2 Chart I-3China: Excess Reserves And Broad Money
China: Excess Reserves And Broad Money
China: Excess Reserves And Broad Money
Having adequate capital and liquidity as well as positive risk appetite, banks can expand their balance sheets, i.e., originate loans and buy various securities. When banks make loans or purchase assets from non-banks, they simultaneously create deposits and new purchasing power. Chart I-3 demonstrates that in recent years, excess reserves in China’s banking system have been flat, yet banks’ assets and the supply of money has expanded tremendously. The opposite can also occur: Banks’ excess reserves can mushroom, but banks may actually be reluctant to grow their balance sheets. This was the case after the Lehman crisis with U.S. banks and in the wake of the European debt crisis with euro area banks. Finally, we have elaborated at great length in our past reports that China’s money and credit excesses do not stem from its high household savings rate. Rather, like any credit bubble in any country, China’s leverage is due to the creation of credit/money “out of thin air.”2 Bottom Line: Perpetual bond issuance and the CBS program will expand the banking system’s excess reserves, but not broad money supply. Besides, it is not certain that excess reserves will accelerate loan growth. Credit origination by banks depends on many other factors such as banks’ willingness to expand their risk assets, loan demand and the regulatory regime and norms. Deleveraging Has Not Yet Started Chart I-4China: Deleveraging Has Not Even Begun
China: Deleveraging Has Not Even Begun
China: Deleveraging Has Not Even Begun
One cannot discuss the potential for a monetary bazooka in China without an update on the status of deleveraging. The fact is that deleveraging in China has not even begun: Credit is still expanding faster than nominal GDP growth. The most common way to measure leverage/debt is to compare it with the cash flow that is used to service debt. Nominal GDP is a measure of cash flow in an economy from a macro perspective. The debt-to-asset ratio is a poor measure of leverage because asset valuations are often subjective: Assets are valued by debtors themselves. Besides, apart from distressed credit investors, one does not want to be a creditor to a country or company that has to sell assets to service its debt. Stock and bond prices of debtor countries or companies tailspin when the latter have to sell assets to service debt. The top panel of Chart I-4 illustrates that China’s enterprise and household domestic credit/debt is still expanding at an annual rate of close to 10% at a time when nominal GDP growth has slowed to 8%. Consistently, the debt to GDP ratio has not declined at all (Chart I-4, bottom panel). In this context, a rhetorical question is in order: Should China ramp up money/credit growth and monetize banks’ NPLs, given that deleveraging has yet to take place? Economic Ramifications Of Deploying The Bazooka Chart I-5Symptoms Of Rising Inefficiencies
Symptoms Of Rising Inefficiencies
Symptoms Of Rising Inefficiencies
What would be the economic ramifications if the Chinese authorities once again promote and allow unrelenting money/credit expansion “out of thin air” to bail out zombie banks and companies? Cyclically: If the authorities compel banks to acknowledge NPLs and write them off as and when the PBoC finances their recapitalization, banks may not be in a position to accelerate loan growth. This scenario entails that credit growth and hence cyclical sectors in China would remain weak for a while. In contrast, if the authorities pursue recapitalization of banks without forcing them to acknowledge and write off bad assets, banks would regain their power to expand their balance sheets, fostering a cyclical economic recovery. Structurally (in the long term): The growth model based on continuous “out of thin air” money and credit expansion inevitably breeds economic inefficiencies, falling productivity growth and rising inflation. In short, the economic outcome over the course of several years would be stagflation. Chart I-5 illustrates that China’s ICOR (incremental capital-to-output ratio) is rising, or inversely that the output-to-capital ratio is falling. This entails worsening economic efficiency and slowing productivity growth. Chart I-6 shows a potential stylized roadmap for the Chinese economy in the years ahead if the credit and money bubbles are inflated further without corporate restructuring, bankruptcies, the imposition of hard budget constraints and meaningfully improved capital/credit allocation. The red line represents potential GDP growth, and the dotted red line is our projection.
Chart I-6
In any economy, the potential growth rate is equal to the sum of growth rates of the labor force and productivity. China’s labor force is no longer expanding and will begin shrinking in the coming years (Chart I-7). Hence, going forward, the sole source of potential GDP growth in China will be productivity growth. Productivity growth has been slowing and will continue to do so if structural market-oriented reforms are not implemented (Chart I-8, top panel). Besides, the industrialization ratio has already risen a lot (Chart I-8, bottom panel). Chart I-7China: No Tailwind From Labor Force
China: No Tailwind From Labor Force
China: No Tailwind From Labor Force
Chart I-8China: Productivity Is Slowing
China: Productivity Is Slowing
China: Productivity Is Slowing
With the potential GDP growth rate in China declining, future fiscal and credit stimulus may lead to higher nominal – but not real – growth. The latter will be constrained by a slowing rate of potential real GDP growth. Higher nominal but weaker potential (real) growth entails rising inflation. The combination of higher inflation along with the need to maintain very low nominal interest rates to assist debtors is bearish for the currency. In such a scenario, there will be intensifying depreciation pressure on the yuan from the tremendous overhang of RMBs in the banking system (Chart I-9). The PBoC’s foreign exchange reserves of $3 trillion will not be sufficient to backstop the enormous amount of RMB (money) supply of RMB 210 trillion – which is equivalent to US$30 trillion (Chart I-10). Chart I-9Helicopter Money In China
Helicopter Money In China
Helicopter Money In China
Chart I-10PBoC FX Reserves Are Equal To 10% Of Broad Money Supply
PBoC FX Reserves Are Equal To 10% Of Broad Money Supply
PBoC FX Reserves Are Equal To 10% Of Broad Money Supply
If broad money supply continues to expand at an annual rate of close to 9-10% or above, downward pressure on the yuan will escalate immensely, and the Chinese authorities will have no choice but to close the capital account completely and also heavily regulate current account transactions. Bottom Line: If the authorities do not restrain the PBoC’s financing of perpetual bond issuance via the CBS and in the interim do not force banks to write off bad assets, the upshot will be the monetization of banks’ bad assets by the PBoC. This will constitute the ultimate socialist put for banks and zombie debtors, as well as for the entire economy. Business cycle swings, bankruptcies and deflation are inherent features of a market-driven/capitalist economy. A socialist put via promoting unlimited money and credit creation entails long-term stagflation – lower productivity growth and rising inflation. This is very bearish for the currency. Investment Conclusions Chart I-11Dollar And EM / Commodities: Mirror Images
Dollar And EM / Commodities: Mirror Images
Dollar And EM / Commodities: Mirror Images
To be sure, the above analysis suggests that the bazooka has not been loaded and the Chinese economy is not about to stage an imminent recovery. BCA’s Emerging Markets Strategy team maintains its bearish stance on China-related plays worldwide. We are closely monitoring China’s money and credit aggregates as well as indicators from the real economy to gauge when China’s business cycle will revive. So far, these indicators continue to point south. EM risk assets and currencies have recently been boosted by the Federal Reserve’s dovish turn. But as we argued in last week’s report, this will prove short-lived. Global trade, China’s growth and commodities prices are the key drivers of EM financial markets, not the Fed. Provided our negative outlook for these three factors due to the ongoing slowdown in China, we continue to recommend a negative stance on EM in absolute terms, and underweighting EM stocks and credit versus their U.S. peers. The dollar’s weakness stemming from the downshift in U.S. interest rate expectations is running out of steam. Chart I-11 shows that the broad trade-weighted dollar is trying to find support at its 200-day moving average. Conversely, the EM stocks index and copper prices are struggling to break above their 200-day moving averages (Chart I-11, middle and bottom panels). We believe the dollar is poised for a breakout, and EM and copper are due for a breakdown. Arthur Budaghyan, Senior Vice President Emerging Markets Strategy arthurb@bcaresearch.com Lin Xiang, Research Analyst linx@bcaresearch.com Box 1 Issuance Of Perpetual Bonds And CBS Program The authorities are promoting the issuance of perpetual bonds and the CBS program as a scheme for the country’s big-four banks to raise capital to meet BIS ’s Total Loss-absorbing Capacity (TLAC) requirements for globally systemically important banks. Limitations and other details on the perpetual bonds issuance and CBS program: 24 out of 30 banks listed on the A-share market are presently qualified to issue perpetual bonds as their assets exceed RMB 200 billion, a threshold established by the PBoC. Perpetual bonds will boost the Tier-1 capital of issuing banks. Banks are allowed to purchase perpetual bonds issued by other banks in amounts up to 10% of their core Tier-1 capital. Only primary dealers (46 banks and 2 brokers) can exchange qualified perpetual bonds they hold for PBoC bills, with a maximum exchange period of three years. The incentive for banks to purchase perpetual bonds will for now be low because these bonds consume large amounts of capital. The risk weights for these perpetual bonds ranges between 150-250%. How Does It Work? As Diagram I-1 on page 14 illustrates, when Bank B purchases perpetual bonds from Bank A, the former transfers excess reserves to the latter. The amount of outstanding deposits, i.e., money supply, is not affected at all. Hence, there is no direct impact on the broad money supply.
Chart I-
Banks do not require deposits to make loans and buy securities. Banks need excess reserves at the central bank to pay for or settle payments with other banks. When Bank B transfers excess reserves to Bank A, the aggregate amount of excess reserves in the banking system does not change. Bank B can swap these perpetual bonds with central bank bills, and then pledge these bills at the PBoC to get excess reserves. As it does so, Bank B will replenish its excess reserves. Consequently, the amount of excess reserves in the banking system will expand, as will the PBoC’s balance sheet. Overall, the issuance of perpetual bonds and CBS swaps lead to both bank recapitalization and banking system liquidity (excess reserves) expansion. Why has the PBoC decided to fund the issuance of perpetual bonds? Without PBoC funding, demand for perpetual bonds might be very low, and yields on them could spike. Higher yields could lure away capital from other corporate bonds, producing higher borrowing costs in credit markets. On the positive side, the monetary authorities will not only recapitalize a number of large banks but will also do so by capping borrowing costs in the credit markets and injecting more liquidity into the banking system. On the negative side, yields of these perpetual bonds will not be determined by the market. Rather they will be artificially suppressed by potential open-ended PBoC funding. This will preserve China’s inefficient credit allocation system and misallocation of capital in general. In a market economy, the authorities will typically force banks to raise capital in securities markets or privately. More issuance, especially when it comes from many banks simultaneously, typically pushes down the prices of bank stocks and bonds. The basis is securities issuance often dilutes existing shareholders and is also negative for bondholders. This threat of dilution and losing money incentivizes existing shareholders and bondholders of a bank to impose discipline on the bank’s management. Consequently, banks would be better run and capital allocation would be more efficient than it would otherwise be in a system where such oversight and incentives are absent. In brief, the market mechanism deters banks from risky and speculative behavior and contributes to the long-term health of the banking system, as well as the efficiency of capital allocation in the real economy. By allowing banks to purchase each other’s bonds, and with the PBoC financing it, China is not imposing the much-needed market discipline on bank shareholders, bondholders and by extension, bank management. This does not promote efficient capital allocation and higher productivity growth in the long run. Footnotes 1 Money supply is the sum of all deposits in the banking system. Hence, we use terms money and deposits interchangeably. 2 Please see the Emerging Markets Strategy Special Report “Misconceptions About China's Credit Excesses”, dated October 26, 2016, Special Report “China's Money Creation Redux And The RMB?”, dated November 23, 2016, Special Report “Do Credit Bubbles Originate From HIgh National Savings?”, dated January 18, 2017, Special Report “The True Meaning Of China's Great 'Savings Wall'”, dated December 20, 2017 Special Report “Is Investment Constrained By Savings? Tales Of China and Brazil”, dated March 22, 2018, available at www.bcaresearch.com
Highlights In their current form and size, perpetual bonds issuance and the central bank bills swap program are unlikely game-changers for the banking system in China. However, this mechanism constitutes monetization of banks’ capital and bad assets, i.e., recapitalization of banks, by the PBoC via quantitative easing. Hence, this scheme can be presently viewed as a bazooka that has not yet been loaded by the government. If the authorities pursue this program on a large scale without forcing banks to acknowledge and write off bad assets, banks would regain power to expand their balance sheets, fostering a cyclical economic recovery. Nevertheless, the growth model based on continuous “out of thin air” money and credit expansion inevitably leads to falling productivity growth and rising inflation. Therefore, the economic outcome over the course of several years would be stagflation, which is profoundly bearish for the currency. Feature The Chinese authorities recently launched a Central Bank Bills Swap (CBS) program to boost liquidity and facilitate issuance of commercial banks’ perpetual bonds. Box I-1 on pages 12-13 elaborates on the scheme and provides more detail about the program. Under the CBS program, Chinese banks can buy each other’s perpetual bonds, then exchange these bonds for central bank bills and pledge those bills at the People Bank of China (PBoC) to receive funding. Insurance companies are also allowed to purchase perpetual bonds, but they cannot pledge them with the central bank for funding. What are the macro implications of this program? Can the government use this scheme to recapitalize the banking system? Does the CBS program amount to quantitative easing? Will it be sufficient to boost credit growth in China in 2019? We have conditional answers to these questions – i.e., they all depend on the extent to which the scheme is actually utilized by the authorities. On the one hand, the CBS program could potentially become a proverbial bazooka used by the government to recapitalize the banking system via the PBoC monetizing banks’ bad assets. By doing so, the PBoC would be expanding its balance sheet by injecting excess reserves into the banking system – i.e., quantitative easing. Consequently, it could help banks accelerate credit and money growth, in turn helping the economy. The long-run collateral damage in this scenario, however, would be an RMB depreciation. On the other hand, the authorities could limit the usage of the scheme via various regulatory approvals and norms. In such a case, the impact of the program on money/credit growth and the real economy as well as on the exchange rate would be limited. In other words, it might end up being no more than a tool to help the four large banks meet BIS's TLAC requirements. At the moment, there is not enough information to determine whether the program will be a game changer for the banking system in China, leading to a surge in credit and broader economic recovery. Both total assets and broad credit growth among banks remain very weak for now (Chart I-1). In other words, it is a bazooka that has not been loaded, and may never be loaded because of the potential for seriously negative ramifications over the long term. Chart I-1Chinese Banks: Total Assets And Broad Credit Growth
Chinese Banks: Total Assets And Broad Credit Growth
Chinese Banks: Total Assets And Broad Credit Growth
Consequently, we maintain our view that China’s growth will continue to disappoint in the first half of 2019, and that China-related plays, including many emerging markets (EM), remain at risk of a renewed selloff. Bank Recapitalization? In theory, the issuance of perpetual bonds along with the CBS program can be used to recapitalize the banking system. Each bank can buy perpetual bonds issued by other banks up to 10% of their core Tier-1 capital. These banks can get cheap financing from the PBoC by swapping these perpetual bonds with central bank bills, and then pledging those bills at the central bank to get funding. Hence, under this scheme, the PBoC will be financing purchases of perpetual bonds, which means the monetary authorities will indirectly be funding banks’ recapitalization. It is an “open secret” that Chinese banks would be considerably undercapitalized if they were forced to recognize non-performing assets. The non-performing loan (NPL) ratio currently stands at 1.9%, and the special-mention loans ratio is at 3.2%; and the sum of both is at 5.1% of total loans (Chart I-2, top panel). NPL provisions presently amount to 3.4% of total loans. Chart I-2Chinese Banks Are Massively Under-Provisioned
Chinese Banks Are Massively Under-Provisioned
Chinese Banks Are Massively Under-Provisioned
When expressed as a share of total risk-weighted assets, the aggregate NPLs and special-mention loans are equal to 4.2% (Chart I-2, bottom panel). At 2.8% of risk-weighted assets, NPL provisions are extremely inadequate. Assuming non-performing assets turn out to be 10% of total risk-weighted assets, some 40% of banks' capital would be wiped out, according to our simulation presented in Table I-1. This is after accounting for existing provisions and assuming a 20% recovery rate of non-performing assets.
Chart I-
Provided that risk-weighting assigns a zero weight to banks’ claims on the government, a 50% risk weight to claims on households and a 100% weight to claims on companies, the assumption of 10% of non-performing assets in total risk-weighted assets is reasonable. This is especially the case when the enormous credit boom of the past 10 years is taken into consideration. As a result, in this scenario the capital adequacy ratio (CAR) will drop from its current level of 13.8% to 9.4%. This will bring the CAR below the regulatory minimum of 11%. To raise the CAR to the regulatory minimum of 11%, the banking system would require RMB 2 trillion of capital. This is greater than the maximum potential demand for perpetual bonds that we estimate to be up to RMB 1.4 trillion. To estimate this number, we assumed all banks purchase perpetual bonds in amounts equal to 5% of their core Tier-1 capital and all insurance companies buy perpetual bonds in an amount equal to 5% of assets. This is not an underestimation of potential demand for perpetual bonds since there are currently limitations on banks’ ability to issue and purchase these bonds as elaborated in Box I-1 on pages 12-13. In short, it is not clear if perpetual bond issuance and the CBS will be sufficient to undertake full recapitalization of the banking system and allow banks to accelerate their balance sheet expansion to finance an economic recovery. Bottom Line: In their current form and shape, perpetual bonds and the CBS program are unlikely to be a game-changer for the banking system in China. However, if the authorities eliminate limitations and change regulatory norms, the scheme could potentially be used to recapitalize China’s banking system. This is why this scheme can presently be viewed as a bazooka that has not yet been loaded by the government. Does CBS Represent QE? Its Impact On Liquidity And Money Supply The CBS program is a form of quantitative easing (QE). It will expand the PBoC’s balance sheet and banking system liquidity (excess reserves at the central bank), as elaborated in Box I-1 and Diagram I-1 on pages 12-14. If pursued on a large scale, this scheme would constitute monetization of banks’ capital and their bad assets by the central bank. The mechanism is already in place, but the extent to which authorities will use it to recapitalize banks remains unclear. Even though the CBS program will expand banking system liquidity – i.e., excess reserves at the central bank – it will not – however - affect broad money supply. The basis is simple: Banks’ excess reserves at the central bank are not part of the broad money supply in any country. Banks use excess reserves to settle payments between one another and with the central bank. Banks do not lend out excess reserves. Further, only a central bank can create excess reserves, and it does so “out of thin air.” In brief, excess reserves rather than corporate and individual deposits constitute genuine banking system liquidity. Barring lending to or buying assets from non-banks – which does not typically occur outside of QE programs – central banks do not create broad money or deposits.1 Money/deposits, the ultimate purchasing power for economic agents, is created by commercial banks “out of thin air,” as we have discussed and illustrated in our series of reports on money, credit and savings.2 Having adequate capital and liquidity as well as positive risk appetite, banks can expand their balance sheets, i.e., originate loans and buy various securities. When banks make loans or purchase assets from non-banks, they simultaneously create deposits and new purchasing power. Chart I-3 demonstrates that in recent years, excess reserves in China’s banking system have been flat, yet banks’ assets and the supply of money has expanded tremendously. The opposite can also occur: Banks’ excess reserves can mushroom, but banks may actually be reluctant to grow their balance sheets. This was the case after the Lehman crisis with U.S. banks and in the wake of the European debt crisis with euro area banks. Chart I-3China: Excess Reserves And Broad Money
China: Excess Reserves And Broad Money
China: Excess Reserves And Broad Money
Finally, we have elaborated at great length in our past reports that China’s money and credit excesses do not stem from its high household savings rate. Rather, like any credit bubble in any country, China’s leverage is due to the creation of credit/money “out of thin air.”2 Bottom Line: Perpetual bond issuance and the CBS program will expand the banking system’s excess reserves, but not broad money supply. Besides, it is not certain that excess reserves will accelerate loan growth. Credit origination by banks depends on many other factors such as banks’ willingness to expand their risk assets, loan demand and the regulatory regime and norms. Deleveraging Has Not Yet Started One cannot discuss the potential for a monetary bazooka in China without an update on the status of deleveraging. The fact is that deleveraging in China has not even begun: Credit is still expanding faster than nominal GDP growth. The most common way to measure leverage/debt is to compare it with the cash flow that is used to service debt. Nominal GDP is a measure of cash flow in an economy from a macro perspective. The debt-to-asset ratio is a poor measure of leverage because asset valuations are often subjective: Assets are valued by debtors themselves. Besides, apart from distressed credit investors, one does not want to be a creditor to a country or company that has to sell assets to service its debt. Stock and bond prices of debtor countries or companies tailspin when the latter have to sell assets to service debt. The top panel of Chart I-4 illustrates that China’s enterprise and household domestic credit/debt is still expanding at an annual rate of close to 10% at a time when nominal GDP growth has slowed to 8%. Chart I-4China: Deleveraging Has Not Even Begun
China: Deleveraging Has Not Even Begun
China: Deleveraging Has Not Even Begun
Consistently, the debt to GDP ratio has not declined at all (Chart I-4, bottom panel). In this context, a rhetorical question is in order: Should China ramp up money/credit growth and monetize banks’ NPLs, given that deleveraging has yet to take place? Economic Ramifications Of Deploying The Bazooka What would be the economic ramifications if the Chinese authorities once again promote and allow unrelenting money/credit expansion “out of thin air” to bail out zombie banks and companies? Cyclically: If the authorities compel banks to acknowledge NPLs and write them off as and when the PBoC finances their recapitalization, banks may not be in a position to accelerate loan growth. This scenario entails that credit growth and hence cyclical sectors in China would remain weak for a while. In contrast, if the authorities pursue recapitalization of banks without forcing them to acknowledge and write off bad assets, banks would regain their power to expand their balance sheets, fostering a cyclical economic recovery. Structurally (in the long term): The growth model based on continuous “out of thin air” money and credit expansion inevitably breeds economic inefficiencies, falling productivity growth and rising inflation. In short, the economic outcome over the course of several years would be stagflation. Chart I-5 illustrates that China’s ICOR (incremental capital-to-output ratio) is rising, or inversely that the output-to-capital ratio is falling. This entails worsening economic efficiency and slowing productivity growth. Chart I-5Symptoms Of Rising Inefficiencies
Symptoms Of Rising Inefficiencies
Symptoms Of Rising Inefficiencies
Chart I-6 shows a potential stylized roadmap for the Chinese economy in the years ahead if the credit and money bubbles are inflated further without corporate restructuring, bankruptcies, the imposition of hard budget constraints and meaningfully improved capital/credit allocation. The red line represents potential GDP growth, and the dotted red line is our projection.
Chart I-6
In any economy, the potential growth rate is equal to the sum of growth rates of the labor force and productivity. China’s labor force is no longer expanding and will begin shrinking in the coming years (Chart I-7). Hence, going forward, the sole source of potential GDP growth in China will be productivity growth. Productivity growth has been slowing and will continue to do so if structural market-oriented reforms are not implemented (Chart I-8, top panel). Besides, the industrialization ratio has already risen a lot (Chart I-8, bottom panel). Chart I-7China: No Tailwind From Labor Force
China: No Tailwind From Labor Force
China: No Tailwind From Labor Force
Chart I-8China: Productivity Is Slowing
China: Productivity Is Slowing
China: Productivity Is Slowing
With the potential GDP growth rate in China declining, future fiscal and credit stimulus may lead to higher nominal – but not real – growth. The latter will be constrained by a slowing rate of potential real GDP growth. Higher nominal but weaker potential (real) growth entails rising inflation. The combination of higher inflation along with the need to maintain very low nominal interest rates to assist debtors is bearish for the currency. In such a scenario, there will be intensifying depreciation pressure on the yuan from the tremendous overhang of RMBs in the banking system (Chart I-9). The PBoC’s foreign exchange reserves of $3 trillion will not be sufficient to backstop the enormous amount of RMB (money) supply of RMB 210 trillion – which is equivalent to US$30 trillion (Chart I-10). Chart I-9Helicopter Money In China
Helicopter Money In China
Helicopter Money In China
Chart I-10PBoC FX Reserves Are Equal To 10% Of Broad Money Supply
PBoC FX Reserves Are Equal To 10% Of Broad Money Supply
PBoC FX Reserves Are Equal To 10% Of Broad Money Supply
If broad money supply continues to expand at an annual rate of close to 9-10% or above, downward pressure on the yuan will escalate immensely, and the Chinese authorities will have no choice but to close the capital account completely and also heavily regulate current account transactions. Bottom Line: If the authorities do not restrain the PBoC’s financing of perpetual bond issuance via the CBS and in the interim do not force banks to write off bad assets, the upshot will be the monetization of banks’ bad assets by the PBoC. This will constitute the ultimate socialist put for banks and zombie debtors, as well as for the entire economy. Business cycle swings, bankruptcies and deflation are inherent features of a market-driven/capitalist economy. A socialist put via promoting unlimited money and credit creation entails long-term stagflation – lower productivity growth and rising inflation. This is very bearish for the currency. Investment Conclusions To be sure, the above analysis suggests that the bazooka has not been loaded and the Chinese economy is not about to stage an imminent recovery. BCA’s Emerging Markets Strategy team maintains its bearish stance on China-related plays worldwide. We are closely monitoring China’s money and credit aggregates as well as indicators from the real economy to gauge when China’s business cycle will revive. So far, these indicators continue to point south. EM risk assets and currencies have recently been boosted by the Federal Reserve’s dovish turn. But as we argued in last week’s report, this will prove short-lived. Global trade, China’s growth and commodities prices are the key drivers of EM financial markets, not the Fed. Provided our negative outlook for these three factors due to the ongoing slowdown in China, we continue to recommend a negative stance on EM in absolute terms, and underweighting EM stocks and credit versus their U.S. peers. The dollar’s weakness stemming from the downshift in U.S. interest rate expectations is running out of steam. Chart I-11 shows that the broad trade-weighted dollar is trying to find support at its 200-day moving average. Conversely, the EM stocks index and copper prices are struggling to break above their 200-day moving averages (Chart I-11, middle and bottom panels). Chart I-11Dollar And EM / Commodities: Mirror Images
Dollar And EM / Commodities: Mirror Images
Dollar And EM / Commodities: Mirror Images
We believe the dollar is poised for a breakout, and EM and copper are due for a breakdown. Arthur Budaghyan, Senior Vice President Emerging Markets Strategy arthurb@bcaresearch.com Lin Xiang, Research Analyst linx@bcaresearch.com Box 1 Issuance Of Perpetual Bonds And CBS Program The authorities are promoting the issuance of perpetual bonds and the CBS program as a scheme for the country’s big-four banks to raise capital to meet BIS ’s Total Loss-absorbing Capacity (TLAC) requirements for globally systemically important banks. Limitations and other details on the perpetual bonds issuance and CBS program: 24 out of 30 banks listed on the A-share market are presently qualified to issue perpetual bonds as their assets exceed RMB 200 billion, a threshold established by the PBoC. Perpetual bonds will boost the Tier-1 capital of issuing banks. Banks are allowed to purchase perpetual bonds issued by other banks in amounts up to 10% of their core Tier-1 capital. Only primary dealers (46 banks and 2 brokers) can exchange qualified perpetual bonds they hold for PBoC bills, with a maximum exchange period of three years. The incentive for banks to purchase perpetual bonds will for now be low because these bonds consume large amounts of capital. The risk weights for these perpetual bonds ranges between 150-250%. How Does It Work? As Diagram I-1 on page 14 illustrates, when Bank B purchases perpetual bonds from Bank A, the former transfers excess reserves to the latter. The amount of outstanding deposits, i.e., money supply, is not affected at all. Hence, there is no direct impact on the broad money supply.
Chart I-
Banks do not require deposits to make loans and buy securities. Banks need excess reserves at the central bank to pay for or settle payments with other banks. When Bank B transfers excess reserves to Bank A, the aggregate amount of excess reserves in the banking system does not change. Bank B can swap these perpetual bonds with central bank bills, and then pledge these bills at the PBoC to get excess reserves. As it does so, Bank B will replenish its excess reserves. Consequently, the amount of excess reserves in the banking system will expand, as will the PBoC’s balance sheet. Overall, the issuance of perpetual bonds and CBS swaps lead to both bank recapitalization and banking system liquidity (excess reserves) expansion. Why has the PBoC decided to fund the issuance of perpetual bonds? Without PBoC funding, demand for perpetual bonds might be very low, and yields on them could spike. Higher yields could lure away capital from other corporate bonds, producing higher borrowing costs in credit markets. On the positive side, the monetary authorities will not only recapitalize a number of large banks but will also do so by capping borrowing costs in the credit markets and injecting more liquidity into the banking system. On the negative side, yields of these perpetual bonds will not be determined by the market. Rather they will be artificially suppressed by potential open-ended PBoC funding. This will preserve China’s inefficient credit allocation system and misallocation of capital in general. In a market economy, the authorities will typically force banks to raise capital in securities markets or privately. More issuance, especially when it comes from many banks simultaneously, typically pushes down the prices of bank stocks and bonds. The basis is securities issuance often dilutes existing shareholders and is also negative for bondholders. This threat of dilution and losing money incentivizes existing shareholders and bondholders of a bank to impose discipline on the bank’s management. Consequently, banks would be better run and capital allocation would be more efficient than it would otherwise be in a system where such oversight and incentives are absent. In brief, the market mechanism deters banks from risky and speculative behavior and contributes to the long-term health of the banking system, as well as the efficiency of capital allocation in the real economy. By allowing banks to purchase each other’s bonds, and with the PBoC financing it, China is not imposing the much-needed market discipline on bank shareholders, bondholders and by extension, bank management. This does not promote efficient capital allocation and higher productivity growth in the long run. Footnotes 1 Money supply is the sum of all deposits in the banking system. Hence, we use terms money and deposits interchangeably. 2 Please see the Emerging Markets Strategy Special Report “Misconceptions About China's Credit Excesses”, dated October 26, 2016, Special Report “China's Money Creation Redux And The RMB?”, dated November 23, 2016, Special Report “Do Credit Bubbles Originate From HIgh National Savings?”, dated January 18, 2017, Special Report “The True Meaning Of China's Great 'Savings Wall'”, dated December 20, 2017 Special Report “Is Investment Constrained By Savings? Tales Of China and Brazil”, dated March 22, 2018, available at www.bcaresearch.com Equity Recommendations Fixed-Income, Credit And Currency Recommendations
First, there is no sales tax reduction measure in this round of stimulus. The most important driver for the auto market recovery in 2009 and 2016 was a sales tax reduction from 10% to 5% for passenger cars with cylinder capacity equal to or less than 1.6L. …
Highlights China’s recently released pro-auto-consumption policy will lead to a moderate 5-8% recovery in auto sales/production this year. However, the impact from the stimulus will be much less than the previous two episodes in 2009 and 2016. The value of Chinese auto sales is likely to increase by RMB 200 billion to 350 billion, which is about 0.2-0.4% of the country’s nominal GDP in 2018. New-energy cars will continue to gain market share with supportive policies. Meanwhile, domestic brand car manufacturers will likely benefit most from the upcoming recovery in the Chinese auto market, while American car producers will benefit the least. We recommend preparing to go long Chinese auto stocks in the domestic market in absolute terms, subject to the terms of a trade agreement with the U.S. In addition, we continue to overweight domestic consumer discretionary stocks versus the benchmark, and versus domestic consumer staples. Feature China is the world’s largest car producer and consumer – its domestic sales account for about 30% of global auto sales (Chart 1, top panel). The country experienced a 3% contraction in auto sales and production through last year, the first year of negative annual growth in 28 years. The contraction rapidly accelerated into the double digits over the past few months (Chart 1, bottom panel). Chart 1Chinese Auto Industry: Policy Stimulus = Recovery In 2019
Chinese Auto Industry: Policy Stimulus = Recovery In 2019
Chinese Auto Industry: Policy Stimulus = Recovery In 2019
As the auto sector is an important driver of China’s economic growth, whenever the industry has shown signs of weakness, the central government has typically implemented a series of supportive policies designed to stimulate the domestic auto market. The authorities successfully did this in 2009-2010 and 2016-2017. Late last month, they again announced a set of pro-auto-consumption policies. The question going forward is how effective these measures will be in boosting auto sales. We believe the recovery will be rather moderate compared with the 2009-2010 and 2016-2017 episodes. Chances are that the growth of auto sales and production will recover to 5-8% in 2019. As a result, we recommend preparing to go long Chinese auto stocks in absolute terms, subject to the terms of a trade agreement with the U.S. Cyclical And Secular Forces Shaping Auto Sales A comparison of the current auto market to the one that prevailed in 2009 and 2016 is helpful to gauge the extent of the strength of the pending auto sales recovery expected this year. Box 1 shows the recently released pro-auto-consumption plan by the Chinese government, which focuses on six aspects, including promoting auto replacement, NEV sales, auto sales in rural areas, pick-up truck sales, development of the second-hand car market, and auto sales in cities that have restricted auto sales policies. BOX 1: China’s Stimulus Package For Domestic Auto Industry The recently released pro-auto-consumption plan by the Chinese government includes: Promoting auto replacement: Providing subsidies to consumers who scrap their older, higher-polluting cars for new, lower-emission or zero-emission cars; Encouraging NEV sales: Providing subsidies to advanced NEV sales and giving more privileges to new energy trucks; Promoting auto sales in rural areas: Providing subsidies to rural residents who scrap their tricycles to buy a truck with cylinder capacity equal or less than 3.5 tons, or a passenger car with cylinder capacity equal or less than 1.6L; Promoting pick-up truck sales: Widening access areas within cities for pick-up trucks; Accelerating the development of the second-hand car market: Allowing second-hand car trades across different cities and provinces; Loosening auto sales restrictions in cities that have restricted auto sales policies. Regarding the amount of subsidies, the government did not provide details. Putting it all together, we believe that this time the impact from the stimulus will be much more muted than the previous two episodes in 2009 and 2016. First, there is no sales tax reduction measure in this round of stimulus. The most important driver for the auto market recovery in 2009 and 2016 was a sales tax reduction in passenger cars with cylinder capacity equal to or less than 1.6L from 10% to 5% (Chart 2). However, this time, there is no such cut. While the government is maintaining zero sales tax on new energy vehicles (NEV), the sales tax on all automobiles remains at 10% this year. Chart 2The Lessons From The 2009 And 2016 Episodes
The Lessons From The 2009 And 2016 Episodes
The Lessons From The 2009 And 2016 Episodes
Second, domestic pent-up demand for automobiles is much lower than it was in both 2009 and 2016. The car ownership rate, defined as the number of passenger cars per 1000 households, has risen significantly to 453 in 2018 (Chart 3). This means that nearly half of Chinese households already own at least one car as of 2018. In comparison, the car ownership rate was only 91 in 2008 and 318 in 2015. Chart 3Less Pent-Up Demand For Autos In 2019 Than Before
Less Pent-Up Demand For Autos In 2019 Than Before
Less Pent-Up Demand For Autos In 2019 Than Before
Third, Chinese households’ debt levels have surged in the past few decades, constraining their ability to purchase cars and other goods (Chart 4, top panel). While many investors compare the cross-country household debt burden relative to GDP, Chinese household debt has already risen to nearly 120% of households’ disposable income, surpassing the U.S. (Chart 4, bottom panel). Chart 4Increasing Households' Debt Burden Constrains Ability To Buy A Car
Increasing Households' Debt Burden Constrains Ability To Buy A Car
Increasing Households' Debt Burden Constrains Ability To Buy A Car
Fourth, while the recent stimulus packages aim to promote auto sales in rural areas, the difficulty of getting auto loans is much higher for the average rural household than for the average urban household, as the former generally have much lower income levels. In addition, peer-to-peer lending, which has become a major source of auto loans in recent years due to lower lending standards compared with banks, has collapsed since last year (Chart 5). With tightening regulations, the difficulty of acquiring auto loans through peer-to-peer lending is currently higher than before. Chart 5Rising Difficulty To Get An Auto Loan
Rising Difficulty To Get An Auto Loan
Rising Difficulty To Get An Auto Loan
Lastly, there has been a structural decline in consumers’ willingness to buy cars due to increasing traffic congestion, limited parking space and more advanced public transportation. Moreover, more mature car rental markets and the rising use of car-sharing services have also helped reduce the need to buy a car, to some extent. This is a major difference from 2009-2010 and 2016. In Chart 6, both falling households’ marginal propensity to consume and declining consumption loan growth suggest a decreasing willingness to consume among Chinese consumers. Chart 6Chinese Consumers: Falling Willingness To Consume
Chinese Consumers: Falling Willingness To Consume
Chinese Consumers: Falling Willingness To Consume
With all the aforementioned cyclical and structural forces in place, the impact on domestic auto sales from the recent stimulus package will be smaller in 2019 than in 2009 and 2016. That said, these policies will still be supportive, and likely sufficient to lift auto sales from contraction back to positive growth this year. Estimating the magnitude of the impact remains challenging, however, due to lingering uncertainty about the size of government subsidies. Based on all six measures listed in Box 1, the scale of subsidies provided by the government will be the major determinant for auto sales growth in China in 2019. In general, the bigger the subsidies, the stronger the push on auto sales. In 2009, both the central government and local government provided subsidies for stimulating auto sales. This time, while the financing sources could still be both central and local governments, local governments’ ability to finance auto consumption stimulus is diminishing due to their much higher debt levels and weaker revenues from land sales than in the past. For now, our view is that the impact from the stimulus will be much less significant than the previous two episodes in 2009 and 2016. Auto sales growth was 4.7% and 3% in 2015 and 2017, respectively. With recently announced stimulus, we expect the growth will be higher than in those years. Bottom Line: We expect that the growth of Chinese auto sales/production volumes will rebound to 5-8% this year, much slower than the 45% growth seen in 2009 and 14% growth in 2016. With a similar growth rate in value terms, Chinese auto sales are likely to increase by RMB 200 to 350 billion, which is about 0.2-0.4% of the country’s 2018 nominal GDP. The Winners And Losers At 5-8%, growth will be equivalent to a 1.5-2 million-unit increase in domestic auto sales. This will lead to a similar increase in auto production, as most cars are domestically produced. In terms of fuel use, automobiles can be classified as gasoline cars, diesel cars and new-energy cars. Chart 7 shows that gasoline cars currently hold 84% market share.
Chart 7
Chart 8
In terms of brand, automobiles can be categorized as Chinese brands, Japanese brands, German brands, American brands, Korean brands and others. Chart 8 shows their market structure, with Chinese brands currently accounting for 42% of total market share. As the Chinese auto market is set to have a moderate recovery this year, which kinds of cars will benefit most, and which will benefit least? Even though China plans to gradually reduce its subsidies on NEVs to zero in 2021, several factors suggest that NEVs will still be the biggest winner, taking more market share from both gasoline and diesel cars. The government is aiming to increase the NEV market share from 4.5% currently to 20% by 2025. Assuming total sales rise to 32 million units in 2025 from current levels of 28 million (about 2% annual growth), this would imply that NEV sales will surge to 6.4 million units from 1.3 million currently, which is equal to 26% annual growth over the next seven years (Chart 9). Chart 9NEV Sales: Plenty Of Upside
NEV Sales: Plenty Of Upside
NEV Sales: Plenty Of Upside
In addition to governments continuing subsidies, the sales tax on NEVs will be held at zero until the end of 2020, a big advantage over non-NEV vehicles, which carry the 10% sales tax. In addition, in cities that have license restrictions on car sales or have time or area restrictions on on-road autos, NEVs are not constrained by such policies, which is an attractive privilege for car buyers to consider. For example, in Shanghai, it costs over 80,000 RMB to buy a license plate for a non-NEV car if the potential buyer is lucky enough to be selected by random draw. In comparison, buying a NEV allows the buyer to have a free license plate. Current NEVs can achieve recharge mileage of 300-450 kilometers, with a price of RMB 100,000 to RMB 150,000 per unit. While the recharge mileage is sufficient for most daily use, prices are no longer substantially higher than prices for traditional gasoline or diesel cars. Major global and local NEV producers are expanding their production in China. For example, Tesla last month started building its mega electric car manufacturing plant in Shanghai, which will initially produce 250,000 cars per year, and eventually ramp up to half a million. This will be about five times the number of vehicles the company currently produces in the U.S. Most NEVs that have been sold in China are Chinese-brand NEVs. However, with China further opening up its auto sector and allowing more foreign NEV producers to invest and produce cars in China, Chinese NEV producers will face increasing competition and may lose some market share to foreign NEV producers. Meanwhile, Chinese NEV-related supportive policies will likely benefit both local and foreign NEV producers as the government is determined to develop the domestic NEV market and encourage NEV sales. That said, local producers will still enjoy slightly more favorable policies than foreign ones. Given that the government is promoting smaller-engine passenger car sales in rural areas and encouraging the replacement of old diesel cars with NEVs, sales and production of gasoline cars may also increase slightly, while diesel cars are likely to rise the least. In terms of brand, Chinese and American brands lost share to Japanese and German brands last year. We believe Chinese brands will benefit most from this year’s government-led auto market recovery for two reasons (Chart 10, top panel): Chart 10Chinese Brands Will Benefit Most From This Year’s Policy Stimulus
Chinese Brands Will Benefit Most From This Year’s Policy Stimulus
Chinese Brands Will Benefit Most From This Year’s Policy Stimulus
The authorities will likely favor local brand producers in terms of benefitting from the subsidies they give to car buyers. In addition, local brand cars in general have lower prices than foreign brands, which could be the most attractive feature for price-sensitive rural residents. In the meantime, as the government encourages local auto replacement, this may benefit Japanese and German brands (Chart 10, second and third panels), as buyers with replacement needs will likely upgrade their cars to ones of higher quality and better reputation. Among American cars, while we are positive on American NEV car sales in China, we still expect American cars to continue to lose market share due to weakening sales of American non-NEV car sales (Chart 10, bottom panel). American cars are generally more expensive than Chinese-brand cars, and they are often perceived as slightly lower quality than either Japanese or German brands. Moreover, the ongoing trade dispute may bias Chinese buyers against buying an American car. Bottom Line: We believe NEV producers and Chinese-brand car producers will benefit most from this year’s government-led auto market recovery. Investment Implications There are several important conclusions that stem from our research. First, while rebounding auto production will likely lift demand for many metals, housing construction is artificially supporting demand and is set to decelerate over the coming year (Chart 11). Consequently, we do not believe that accelerating auto production alone is a license to be long industrial metals over the coming year. Chart 11Weakening Property Market Weighs More On Commodity Market
Weakening Property Market Weighs More On Commodity Market
Weakening Property Market Weighs More On Commodity Market
Second, within the equity space, we recommend that global investors prepare to go long domestic auto stocks on an absolute basis after the outcome of the U.S.-China trade talks emerges later this month. Rebounding auto production will likely lead to a cyclical improvement in auto producer earnings, which in combination with deeply oversold conditions bodes well for the 6-12 month outlook (Chart 12). Chart 12Look To Long Domestic Auto Stocks In An Absolute Term
Look To Long Domestic Auto Stocks In An Absolute Term
Look To Long Domestic Auto Stocks In An Absolute Term
U.S. negotiators are seeking increased access to the Chinese auto market, which implies that the outcome of the negotiations carries some event risk for domestic producers (particularly if China’s concessions on this front turn out to be large). But our sense is that we are likely to recommend an outright long position favoring domestic automakers barring a trade deal with deeply negative implications for domestic producer market share. Third, our bullish bias towards Chinese auto producers and our constructive outlook for the home appliance market supports two of our existing trades favoring consumer discretionary stocks. Chart 13 highlights that production and sales volume for several home appliance products is depressed, and stands to benefit from a flurry of policy announcements late last month that were intended to support the industry. Chart 13Home Appliances: Rebound Soon On Stimulus As Well
Home Appliances: Rebound Soon On Stimulus As Well
Home Appliances: Rebound Soon On Stimulus As Well
Both auto producers and home appliance manufacturers belong to the consumer discretionary sector, and we recommend maintaining a long domestic consumer discretionary position versus both the domestic benchmark and relative to consumer staples (both trades were initiated on November 141). While domestic consumer discretionary stocks are expensive vs. the domestic benchmark on a P/B basis (Chart 14), the sector’s relative P/E ratio is trading at the very low end of its historical range and the trade has eked out modest positive gains since initiation. Chart 14Remain Overweighting Consumer Discretionary Sector
Remain Overweighting Consumer Discretionary Sector
Remain Overweighting Consumer Discretionary Sector
Our long discretionary / short staples trade has faired much worse, down 11% since initiation due to a significant rally in consumer staples stocks (rather than losses in the discretionary sector). We recommend that investors stick with the trade over the coming 6-12 months despite the loss, as Chart 15 highlights that the discretionary / staples trade could not be more extreme in terms of relative performance or valuation. Our bet is that this trade will reverse course in 2019, for a meaningful period, in response to a cyclical tailwind from policy. Chart 15Stay Long Discretionary / Short Staples
Remain Overweighting Consumer Discretionary Sector
Remain Overweighting Consumer Discretionary Sector
Ellen JingYuan He, Associate Vice President Emerging Markets Strategy EllenJ@bcaresearch.com Footnotes 1 Please see BCA Research’s China Investment Strategy Special Report “Chinese Household Consumption: Full Steam Ahead?”, published November 14, 2018. Available at cis.bcaresearch.com. Cyclical Investment Stance Equity Sector Recommendations
According to our emerging markets team, China’s credit and fiscal spending impulse leads the earnings growth of companies included in the EM MSCI equity index by nine months, and it currently points to a continued deceleration and even a contraction in EM EPS…
Highlights The current trajectory in global share prices resembles what took place in 2000 and early 2001. The early 2001 rebound in global and EM stocks lasted several weeks only, despite ongoing easing by the Federal Reserve. Corporate profits – not the Fed – was the key driver in 2001 and remains the principal driver of global and EM stocks today. EM corporate profits are set to contract this year due to China’s continuing slowdown and weakening global trade. This suggests the current EM rally is unsustainable; continue underweighting EM. In Chile, bet on lower swap rates. Continue shorting the peso but overweight the local bourse within an EM equity portfolio. Feature The dovish shift by the U.S. Federal Reserve in the past month has boosted EM risk assets and currencies. Yet, we find that in the medium and long term there is a very low correlation between Fed policy and U.S. interest rates, on the one hand, and EM financial markets on the other. Instead, EM risk assets and currencies correlate with EM/China business cycles and global trade (Chart I-1). We have not detected any improvement in China/EM growth, nor in global trade (Chart I-1). What’s more, we expect Chinese growth and world trade to continue to weaken in the coming six months. Therefore, the EM rebound and outperformance will be reversed sooner than later. Chart I-1Global Growth Indicators Do No Confirm EM Rally
Global Growth Indicators Do No Confirm EM Rally
Global Growth Indicators Do No Confirm EM Rally
Please note this is the view of BCA’s Emerging Markets Strategy team. BCA’s house view is presently positive on global risk assets and global growth. The basis for this difference between our current position and that of the majority of our colleagues is the outlook for China’s growth. A Replay Of 2016 Or 2001? Most investors are betting that 2019 will be a replay of 2016, when the Fed’s dovish turn and China’s stimulus propelled the EM and global equity rallies. It is enticing to compare the current episode in financial markets to the one that occurred only three years ago. To be sure, there are a lot of similarities: the global trade slowdown driven by China/EM, selloffs in global equity and credit markets, a dovish shift in the Fed’s stance and policy stimulus in China are all reminiscent of early 2016. Not surprisingly, this has created a stampede into EM. According to the most recent Bank of America Merrill Lynch survey, as of mid-January some 29% of investors were overweight EM stocks compared to 1% overweight in the U.S., 11% underweight in the euro area and 1% underweight in Japan. By now, the overweight in EM equities is most likely even higher, given the stampede into EM assets that has occurred over the past several weeks. This stands in contrast to the 33% underweight in EM equities in January 2016. It is apparent that the majority of investors are indeed extrapolating 2016 into 2019. We hold a different view and believe China’s slowdown will be more protracted than in 2015-’16, and that EM corporate earnings are set to contract (please refer to Chart I-5 on page 6). A key distinction between China’s current policy efforts and what was implemented in 2015-‘16 is the absence of stimulus for real estate. The odds are that China’s property market will continue to languish, weighing on household and business sentiment as well as spending. Further, the efficiency of monetary transmission mechanisms could be lower today than it was in 2016 due to the regulatory tightening on both banks and non-banks. The fiscal multiplier could also be lower due to the fragile sentiment among consumers and businesses. We discussed these issues in detail in our January 17, 2019 report. Remarkably, it appears that global share prices are tracking the pattern of 1998-2001 – their trajectories are identical in terms of both magnitude and duration (Chart I-2). Chart I-2Global Stocks Are Tracking Pattern Of 1998-2001 In Magnitude And Duration
Global Stocks Are Tracking Pattern Of 1998-2001 In Magnitude And Duration
Global Stocks Are Tracking Pattern Of 1998-2001 In Magnitude And Duration
That said, there are substantial differences between today and 2001 in respect to the economic backdrops in the U.S. and China. Our focal point is to demonstrate that the Fed easing is not sufficient to prop up share prices if it does not lead to a recovery in corporate earnings. We conclude that the latest rebound in EM risk assets is probably late because neither the Fed’s pause nor China’s stimulus will revive EM corporate profits in the next nine months. In terms of market action, one can draw a number of parallels between the trajectory in global share prices today and in 2000-’01. Following an exponential rally in 1999, the global equity index peaked in January 2000 (Chart I-3). The equity selloff accelerated in the last quarter of 2000, with stocks plunging in December of that year. Chart I-3Is Rebound In Global And EM Stocks Late?
Is Rebound In Global And EM Stocks Late?
Is Rebound In Global And EM Stocks Late?
Oversold conditions in global share prices and the Fed’s intra-meeting 50-basis-point rate cut on January 3, 2001, generated a 7% and 15% rebound in global and EM stocks, respectively. The bounce lasted from late December 2000 until early February 2001. The current trajectory in global share prices – the rollover in late January 2018, the top formation lasting several months followed by a dramatic plunge, the bottom in late December, 2018 and the subsequent rebound – closely resemble the path global share prices took in 2000 and early 2001 (Chart I-3, top panel). The same holds true for EM share prices (Chart I-3, bottom panel). Critically, the Fed continued to cut interest rates in 2001 and 2002, yet the bear market in global equities, including EM, persisted until March 2003 (Chart I-4A and I-4B, top panels). The culprit was shrinking corporate profits (Chart I-4A and Chart I-4B, bottom panels). Chart I-4AFed Easing Did Not Help Global Stocks In 2001
Fed Easing Did Not Help Global Stocks In 2001
Fed Easing Did Not Help Global Stocks In 2001
Chart I-4BFed Easing Did Not Help EM Stocks In 2001
Fed Easing Did Not Help EM Stocks In 2001
Fed Easing Did Not Help EM Stocks In 2001
Odds are that EM earnings are set to contract this year as discussed below and shown in Chart I-5. As a result, this view bolsters our conviction that EM equities are likely to roll over soon and plunge anew in absolute terms, and certainly underperform U.S. stocks. Bottom Line: There are many economic differences between today and 2001. Our main point is that the Fed easing-inspired rally in global equities in early 2001 lasted several weeks only and was followed by a new cycle low. The key factor was not Fed policy but corporate profits. Provided our view that corporate earnings in EM and global cyclical sectors will contract this year, the rally in these segments is not sustainable regardless of Fed policy. What Drives EM: Chinese Or U.S. Growth? Predicting the outlook for China and global trade correctly is key to getting the EM call right. First, China’s credit and fiscal spending impulse leads EPS growth of companies included in the EM MSCI equity index by nine months, and it currently points to continued deceleration and contraction in EM EPS in the months ahead (Chart I-5, top panel). The average of new and backlog orders within China’s manufacturing PMI also portends a negative outlook for EM corporate earnings (Chart I-5, bottom panel). Chart I-5EM Profits Are Heading Into Contraction
EM Profits Are Heading Into Contraction
EM Profits Are Heading Into Contraction
The primary linkage between China’s credit and fiscal spending impulse and EM profits is as follows: China impacts EM and the rest of the world via its imports. This explains why EM share prices correlate with Chinese PMI imports (Chart I-6). Chart I-6Chinese Imports And EM Equities
Chinese Imports And EM Equities
Chinese Imports And EM Equities
Second, China’s imports are to a large extent driven by capital spending, especially construction. Some 85% of mainland imports are composed of various commodities, industrial goods and materials, and autos. Consumer goods make up only about 15% of imports. Major capital expenditures in general and construction, in particular, cannot be undertaken without financing. This is why the country’s credit and fiscal spending impulse leads its imports cycles (Chart I-7). This impulse is presently foreshadowing a deepening slump in mainland imports and by extension its suppliers’ revenues and profits. Chart I-7Chinese Imports Are Heading South
bca.ems_wr_2019_02_07_s1_c7
bca.ems_wr_2019_02_07_s1_c7
Third, as EM shipments to China dwindle, not only will EM corporate revenues and profits disappoint but EM currencies will also depreciate. The latter bodes ill for EM U.S. dollar and local currency bonds. The basis is that exchange rate depreciation makes U.S. dollar debt more expensive to service, and also pushes up local bond yields in high-yielding EM fixed-income markets. Fourth, The majority of developing economies sell more to China than to the U.S. Remarkably, global trade and global manufacturing decelerated in 2018, even though U.S. goods imports were booming (Chart I-8). Crucially, the more recent strength in the U.S.’s intake of goods was in part due to frontloading of shipments to the U.S. before the import tariffs went into effect on January 1, 2019. Chart I-8U.S. Imports Are Very Robust
U.S. Imports Are Very Robust
U.S. Imports Are Very Robust
Yet despite robust U.S. demand, aggregate exports of Korea, Taiwan, and Japan have done poorly and their manufacturing have slumped (Chart I-9A and Chart I-9B). Chart I-9AAsian Exports: Flirting With Contraction
Asian Exports: Flirting With Contraction
Asian Exports: Flirting With Contraction
Chart I-9BAsian Manufacturing: Flirting With Contraction
Asian Manufacturing: Flirting With Contraction
Asian Manufacturing: Flirting With Contraction
This highlights the increased significance of Chinese demand and the diminished importance of U.S. domestic demand in world trade. In particular, at $6 trillion, EM aggregate goods and services imports, including Chinese imports (but excluding China’s imports for processing and re-exporting), is greater than the combined imports of the U.S. and EU, which currently stand at $4.7 trillion ($2.5 trillion plus $2.2 trillion, respectively). Finally, the media and many investors have exaggerated the impact of U.S. tariffs on the Chinese economy. We are not implying that the tariffs are not relevant at all, or that they have not damaged sentiment among mainland businesses and households. They have. The point is that China’s exports to the U.S. constitute 3.8% of Chinese GDP only (Chart I-10). This compares to Chinese capital spending amounting to 42% of GDP and total annual credit origination and fiscal spending of 26% of GDP. Chart I-10China's Exports To U.S. Are Small (3.8% of GDP)
China's Exports To U.S. Are Small (3.8% of GDP)
China's Exports To U.S. Are Small (3.8% of GDP)
Overall, China’s growth slowdown in 2018 was not due to its plunging shipments to the U.S. – actually, the latter were rising strongly till December due to frontloading – but due to weakness in credit origination, primarily among non-banks (shadow banking). Bottom Line: The Chinese business cycle – not the U.S.’s – is the key driver of EM share prices and currencies and more important than the Fed. EM And The Fed On the surface, it seems that EM is tracking Fed policy. To us, however, this is akin to“not seeing the forest for the trees”. Investors need to stand back and examine the medium- and long-term relationships between U.S. interest rates, DM central banks’ balance sheets, and EM financial markets. In this broader context, the following becomes apparent: There is no stable correlation between EM share prices, EM currencies and EM sovereign credit, on the one hand, and U.S. 10-year bond yields, on the other (Chart I-11). Chart I-11EM And U.S. Bond Yields: No Stable Correlation
EM And U.S. Bond Yields: No Stable Correlation
EM And U.S. Bond Yields: No Stable Correlation
Historically, the correlation between EM share prices and the Fed funds rate has been mixed, albeit more positive than negative (Chart I-12). On this 40-year chart, we shaded the periods when EM stocks did well during periods of a rising fed funds rate. These time spans are 1983-1984, 1988-1989, 1999-2000, 2003-2007 and 2017. Chart I-12EM Stocks And Fed Funds Rate: A Historical Perspective
EM Stocks And Fed Funds Rate: A Historical Perspective
EM Stocks And Fed Funds Rate: A Historical Perspective
The only two episodes when EMs crashed amid rising U.S. interest rates were the 1982 Latin America debt crisis and the 1994 Mexican peso crisis. Yet, it is essential to emphasize that these crises occurred because of poor EM fundamentals: elevated foreign currency debt levels, negative terms-of-trade shocks, large current account deficits and pegged exchange rates. Dire EM fundamentals also prevailed before the Asian/EM crises of 1997-1998. However, these late-1990s crises occurred without much in the way of Fed tightening or rising U.S. bond yields. Remarkably, there is also no correlation between the size and the rate of change of DM central banks’ balance sheets, on the one hand, and EM risk assets and currencies on the other. In particular, Chart I-13 validates that the annual growth rate of G4 central banks’ balance sheets does not correlate with either EM share prices or EM local currency bonds’ total returns in U.S. dollars. Chart I-13Pace Of QEs And EM: No Correlation
Pace Of QEs And EM: No Correlation
Pace Of QEs And EM: No Correlation
Finally, there is a low correlation between U.S. real interest rates and the real broad trade-weighted dollar (Chart I-14). Notably, Chart I-15 illustrates that the greenback often acts as a countercyclical currency, appreciating when global growth is slowing and depreciating when the global business cycle accelerating. Please note that the dollar is shown inverted on this chart. Chart I-14The U.S. Dollar And U.S. Real Rates
The U.S. Dollar And U.S. Real Rates
The U.S. Dollar And U.S. Real Rates
Chart I-15The U.S. Dollar Is Countercyclical
The U.S. Dollar Is Countercyclical
The U.S. Dollar Is Countercyclical
Bottom Line: Many analysts and investors assign more significance to the Fed policy’s impact on EM risk assets than historical evidence warrants. Unless Fed policy easing coincides with EM growth recovery, the Fed’s positive impact on EM will prove to be fleeting. Investment Considerations Widespread bullish bias on EM among investors currently and a continuous slew of poor growth data in China and global trade give us the conviction to argue that the current EM rally is not sustainable. Even if the S&P 500 drifts higher, EM stocks and credit will underperform their U.S. counterparts (Chart I-16). Chart I-16Stay Short EM / Long S&P 500
Stay Short EM / Long S&P 500
Stay Short EM / Long S&P 500
The EM equity index is sitting at a major technical resistance, and a decisive break above this level will challenge our view (Chart I-17, top panel). The same holds true for many EM currencies and copper (Chart I-17, bottom panel). However, for now, we are maintaining our negative bias. Chart I-17EM Equities And Copper Are Facing Resistance
EM Equities And Copper Are Facing Resistance
EM Equities And Copper Are Facing Resistance
Within the EM equity universe, our overweights are Brazil, Mexico, Chile, Russia, central Europe, Korea, and Thailand. Our underweights are Indonesia, India, Philippines, South Africa, and Peru. We continue to recommend shorting the following EM currency basket versus the U.S. dollar: ZAR, IDR, MYR, CLP, and KRW. The full list of our recommended positions across EM equities, local rates, credit, and currencies is available on pages 17-18. Arthur Budaghyan, Senior Vice President Emerging Markets Strategy arthurb@bcaresearch.com Chile: Favor Bonds Over Stocks Local currency bonds will outperform equities in Chile over the next six to nine months (Chart II-1). Chart II-1Chile: Favor Bonds Over Stocks
Chile: Favor Bonds Over Stocks
Chile: Favor Bonds Over Stocks
The central bank is raising interest rates to cap inflation. However, we believe this is misguided because China’s ongoing deceleration along with lower copper prices, will slow growth in Chile over the course of this year. In addition, the current domestic inflation dynamics are less worrisome than the central bank contends. There is ongoing debate in the policy circles of Santiago over whether the recent large net immigration wave, particularly from Venezuela, is inflationary or disinflationary. On the one hand, net immigration expands the supply of labor and puts downward pressure on wages, and hence is disinflationary (Chart II-2). On the other hand, net immigration bolsters demand, and thereby inflation. Chart II-2Chile: Labor Force Is Expanding At 2%
Chile: Labor Force Is Expanding At 2%
Chile: Labor Force Is Expanding At 2%
The central bank has acknowledged both effects but has cited that the latter will overwhelm the former. We disagree with this assessment and believe that current immigration in Chile will be more disinflationary. There are a number of factors that make us believe so: Both nominal and real wage growth are cooling off rapidly (Chart II-3). This corroborates the thesis that the expanding supply of labor is capping wage increases. Chart II-3Chile: Wage Growth Is Decelerating
Chile: Wage Growth Is Decelerating
Chile: Wage Growth Is Decelerating
Central banks in any country need to be concerned with rising unit labor costs and service sector inflation. Energy and food prices are beyond a central bank’s control. Monetary policy should not respond to fluctuations in these prices unless there are second-round effects on wages and other prices. There is presently no genuine inflationary pressures in Chile. The average of Chile’s core and trimmed mean inflation rates stands at 2.5%, and service sector inflation is at 3.7% (Chart II-4). This is within the central bank’s inflation target range of 3% +/-1%. Chart II-4Chile: Inflation Is Within Target Range
Chile: Inflation Is Within Target Range
Chile: Inflation Is Within Target Range
Finally, Chile’s exports are set to shrink due to the ongoing deceleration in China and lower copper prices (Chart II-5). With exports accounting for 30% of GDP, a negative external shock will slow domestic demand too. This will be disinflationary. Chart II-5Chilean Exports Are About To Contract
Chilean Exports Are About To Contract
Chilean Exports Are About To Contract
The fixed-income market in Chile is pricing in rate hikes (Chart II-6). We continue to recommend receiving 3-year swap rates. Even if the central bank continues to tighten, long-term interest rates will decline, anticipating rate cuts down the road. Chart II-6Chile: Receive 3-Year Swap Rates
Chile: Receive 3-Year Swap Rates
Chile: Receive 3-Year Swap Rates
Chilean share prices, in absolute terms, are at risk from the EM and commodities selloff. However, we recommend dedicated EM equity portfolios overweight Chile. The economy is fundamentally and structurally solid, and local equity markets are supported by large local investment pools. Importantly, unlike many other commodity producers, currency depreciation in Chile does not stop the central bank from cutting interest rates. Banco Central de Chile does not target the exchange rate and will cut rates to mitigate the adverse external shock. This will ensure that business cycle fluctuations in Chile will be milder than in other developing economies where central banks tighten to defend their currencies. This is positive for Chilean stocks versus other EM bourses. Finally, the peso is at risk of depreciation from lower copper prices. Bottom Line: Local investors should favor domestic bonds over stocks. Fixed-income traders should bet on lower three-year swap rates. Dedicated EM investors should overweight Chilean equities. Currency traders should maintain a short CLP / long USD trade. Footnotes Equity Recommendations Fixed-Income, Credit And Currency Recommendations
Chinese investable stocks have rallied significantly in absolute US$ terms since the beginning of 2019, up over 11% year-to-date. Given that Chinese stocks are comparatively high-beta, most of this performance can be attributed to the rally in global stocks…
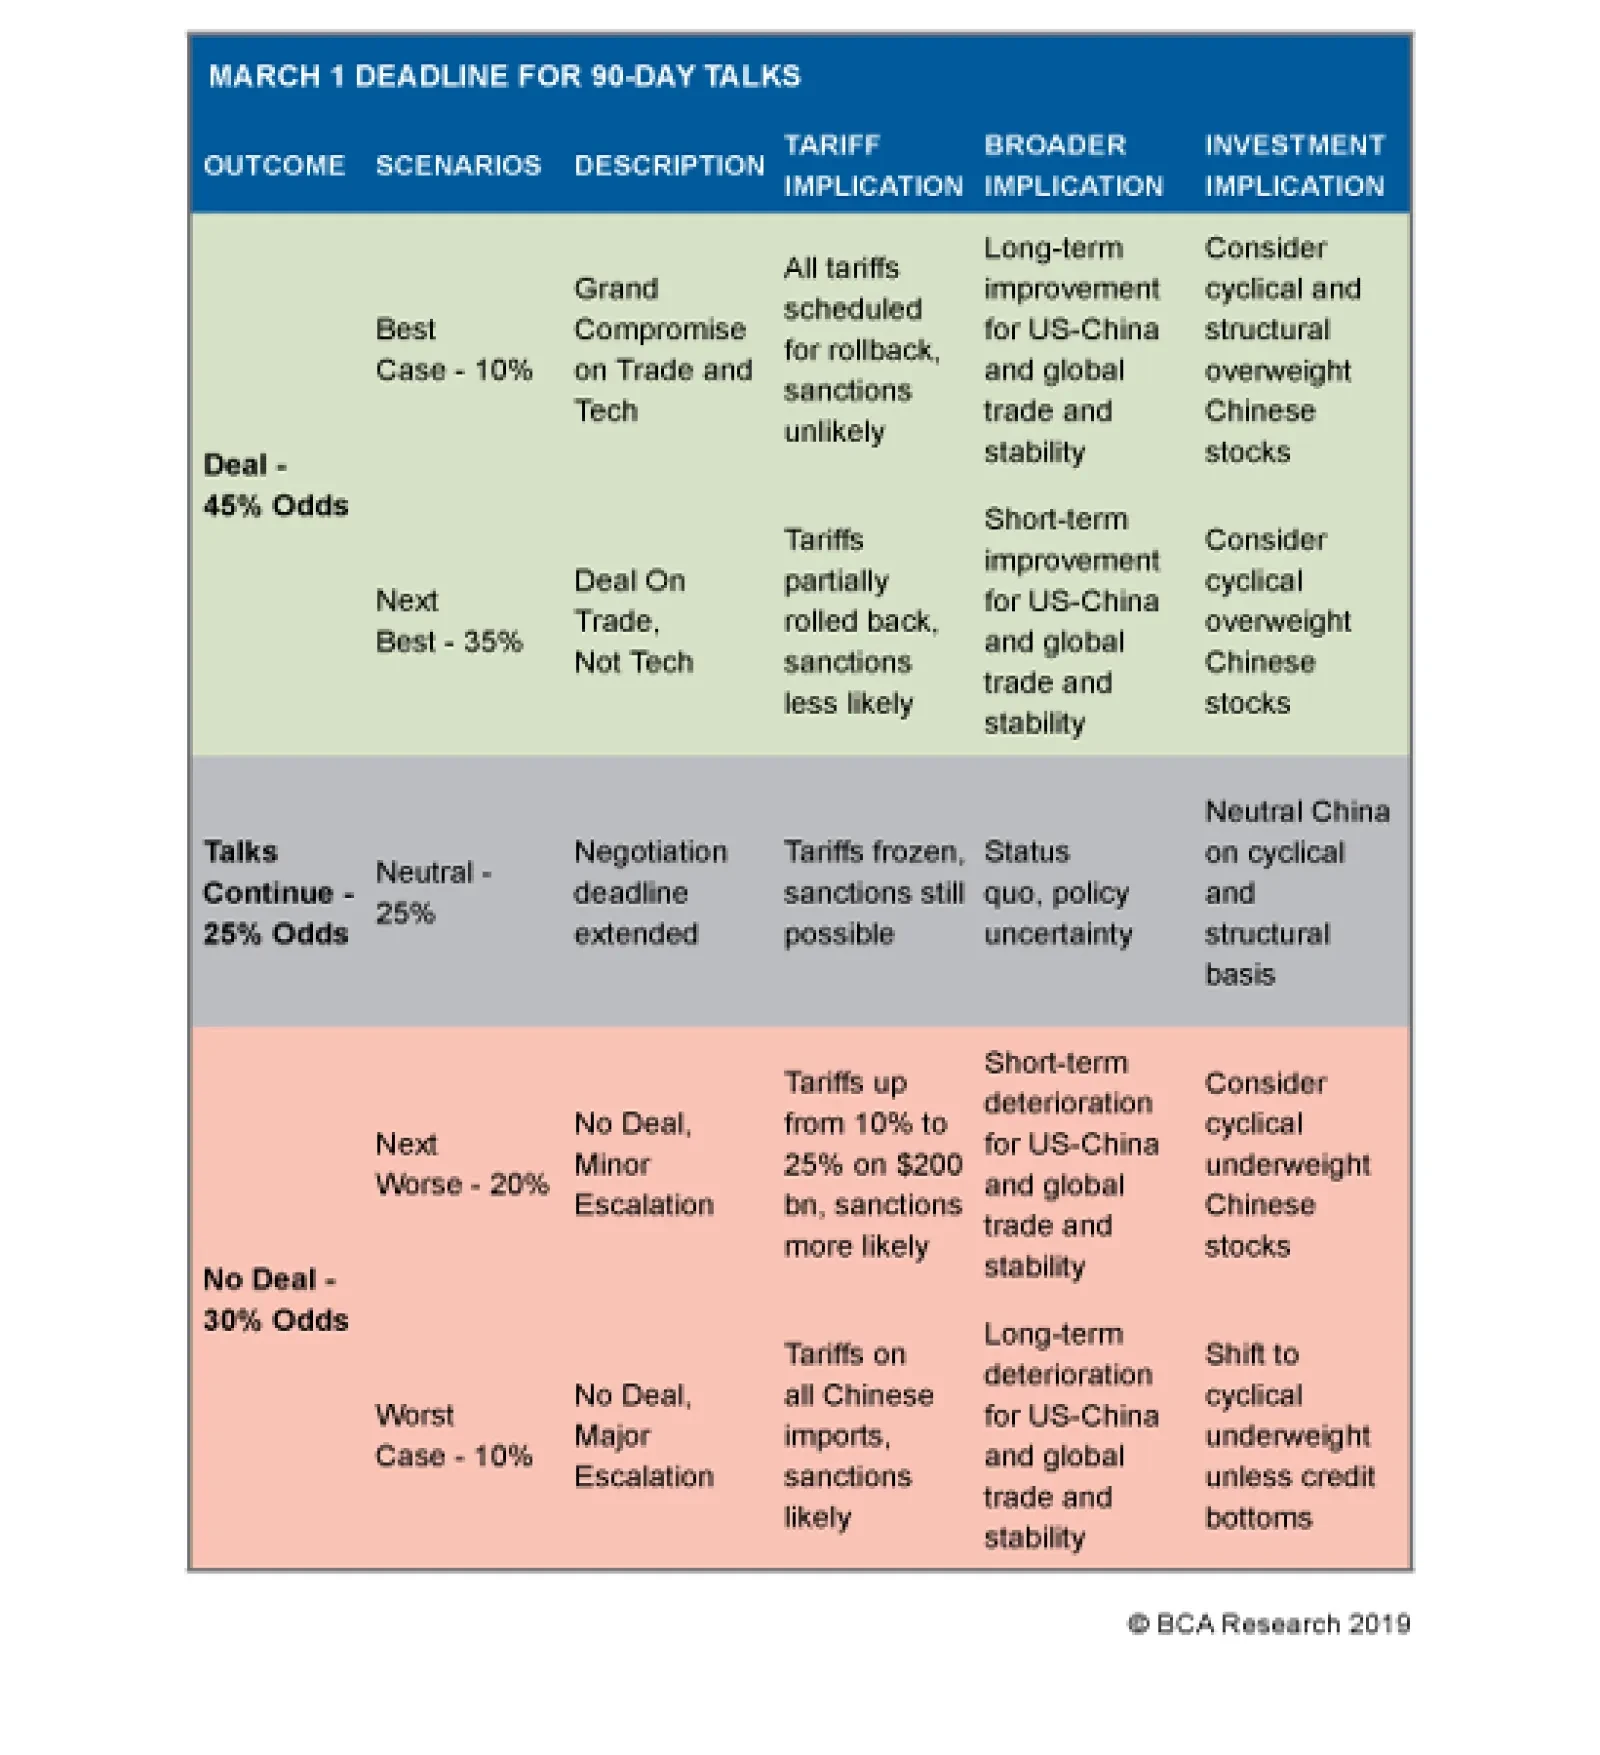
The above table presents our geopolitical strategists latest expectations of where the U.S. and China will be on March 1. We assign only 10% each to the “black and white” outcomes: a “Grand Compromise” or a “No deal, with major escalation.” The remaining 80%…
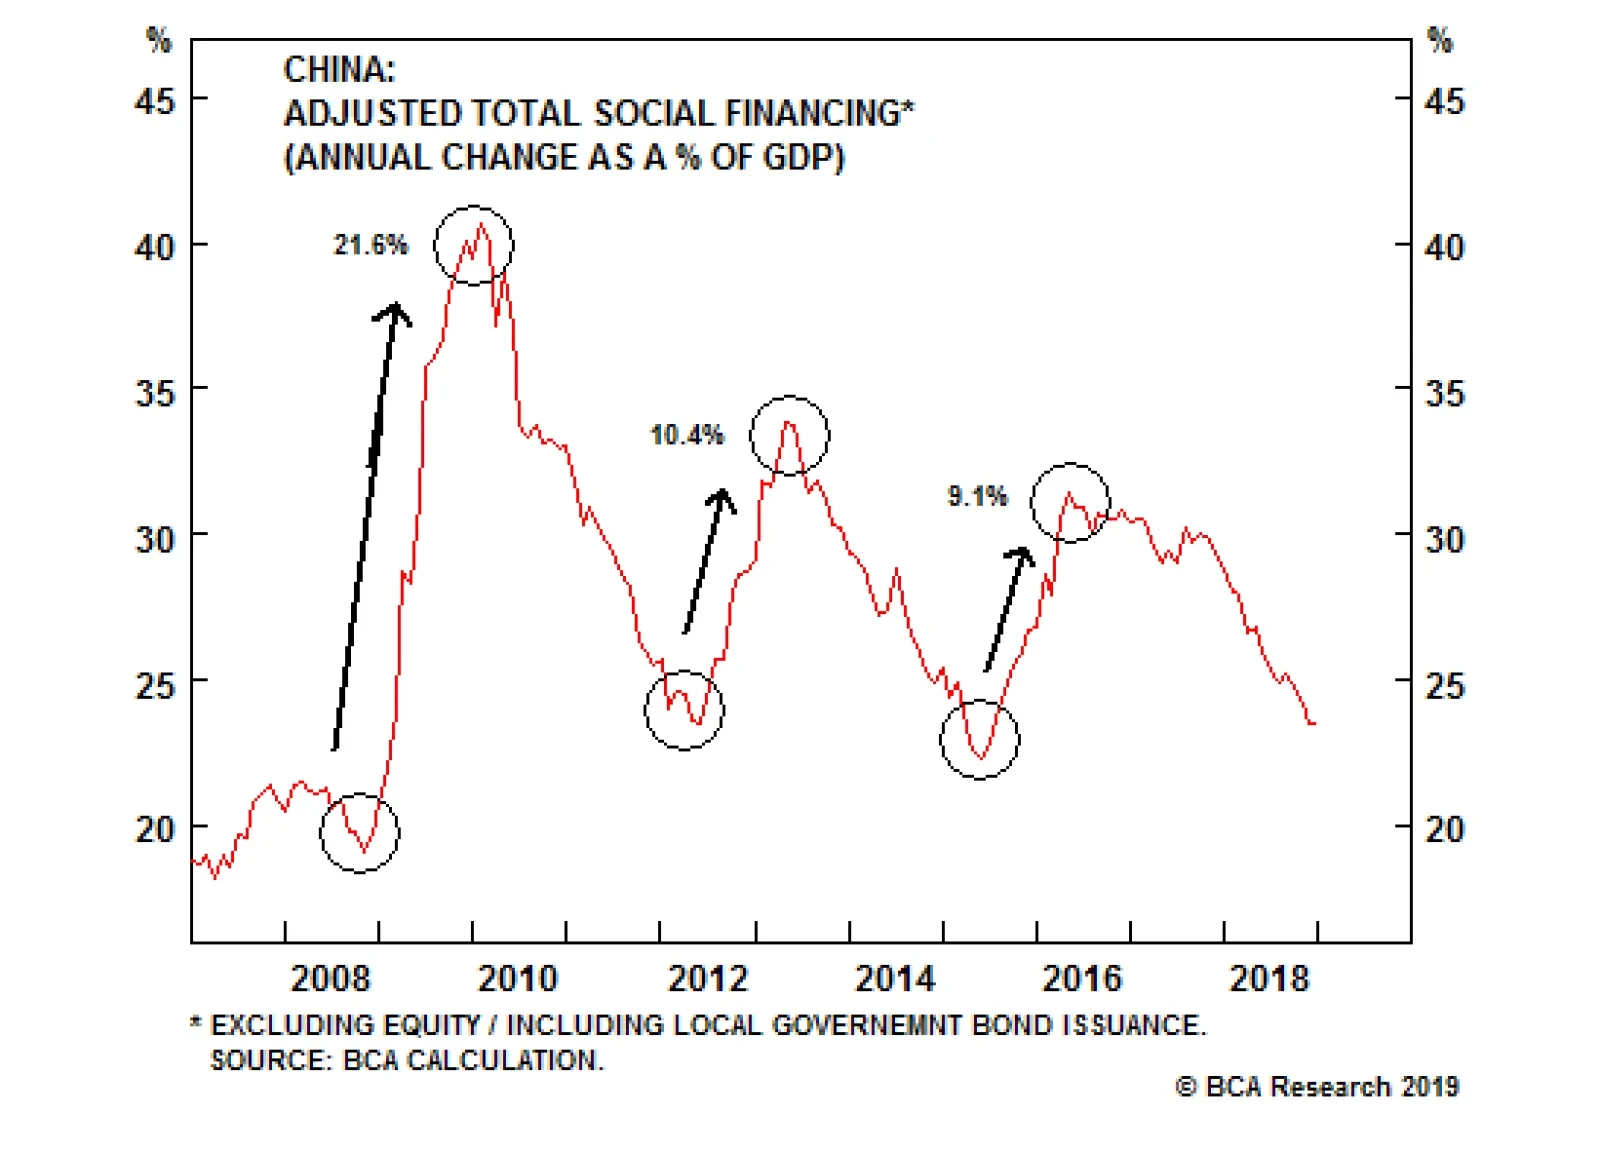
There is no doubt that Chinese policymakers are stimulating the economy, but the question is whether they are willing to pull the credit lever as aggressively as they have done in the past. So far, all of the evidence we have reviewed point to a cautious…