China
Unfortunately for China, as the size of its economy has grown in relation to the rest of the world, running massive trade surpluses has become increasingly difficult. This is especially true today, when the Trump administration and much of the international…

Dear Client, I will be meeting clients in Europe next week. Instead of our usual weekly bulletin, I will be sending you a Special Report discussing how “The Most Important Trend In The World” – a trend that has been around for thousands of years and accounts for all of the economic growth the world has ever experienced – has recently reversed, and what this means for your investment decisions. This is one report you will not want to miss. Best regards, Peter Berezin, Chief Global Strategist Highlights China’s debt problem is a symptom of a deeper ailment: The country’s excessively high saving rate. While the authorities are taking steps to boost consumption, this is likely to be a drawn-out process. In the meantime, the economy will have to continue recycling savings into fixed-asset investment. Now that credit growth has fallen close to nominal GDP growth, the need to further suppress credit growth has abated. The 6-month credit impulse is already moving higher, and the 12-month impulse should follow suit by the middle of the year. As Chinese growth bottoms out this summer, global growth will start to reaccelerate. This will help boost global cyclical stocks as well as EM shares. Feature Global Growth Worries Weigh On Risk Sentiment Global growth is clearly slowing (Chart 1). Our tactical MacroQuant model, which did an exemplary job of flagging the Q4 selloff in stocks, is flashing amber again, after having turned more constructive in late December (Chart 2). Chart 1Growth Is Slowing
Growth Is Slowing
Growth Is Slowing
Chart 2
As we discussed last week, the world economy should stabilize by mid-year, paving the way for global equities to rise further from current levels.1 Until then, volatility will remain elevated. Many factors will influence the trajectory of global growth over next 12 months, but perhaps none more important than what happens to China. In this week’s report, we focus on one of the most critical problems facing the Chinese economy – a problem that surprisingly gets very little attention from market participants. China’s Savings Problem Saving is usually considered a virtue. At the individual level, that is certainly true. However, at the economy-wide level, saving can be a vice if it leads to a shortfall of spending, resulting in higher unemployment. This is precisely the problem that China confronts today. Simply put, the country consumes too little of what it produces. The result is a national saving rate of 45% of GDP, higher than any other major economy in the world (Chart 3). Chart 3China Saves A Lot
China Saves A Lot
China Saves A Lot
The reasons for China’s high saving rate are long and varied. Just as the Great Depression instilled a sense of thrift among Americans who came of age in the 1930s, memories of the abject poverty that many older Chinese citizens endured during the Cultural Revolution have restrained the desire to spend needlessly. While the younger generation is more willing to live it up, it also faces severe constraints to spending more. The labor market remains challenging, even for those with a university degree. Sky-high property prices require young people to save a large fraction of their incomes in order to have any hope of owning a home. Looking out, there is little reason to expect China’s saving rate to fall rapidly. While the number of people entering retirement is steadily increasing, the share of the population in their prime savings years – ages 30-to-59 – has yet to peak (Chart 4). Chart 4China: Share Of Population In Its High Savings Years Has Yet To Peak
China: Share Of Population In Its High Savings Years Has Yet To Peak
China: Share Of Population In Its High Savings Years Has Yet To Peak
In addition, an increasingly skewed male-female sex ratio has created an "arms race" of sorts among Chinese bachelors hoping to accumulate enough wealth to find a bride. One academic study concluded that this factor accounts for half of the increase in the household saving rate since the late-1970s.2 Unfortunately, China’s gender imbalance is only likely to worsen, given that the ratio of men between the ages of 25-and-39 and women between the ages of 20-and-34 – a proxy for gender imbalances in the marriage market – is projected to rise from 1.06 in 2011 to 1.34 by the middle of the next decade (Chart 5). Chart 5Not Enough Chinese Brides
Not Enough Chinese Brides
Not Enough Chinese Brides
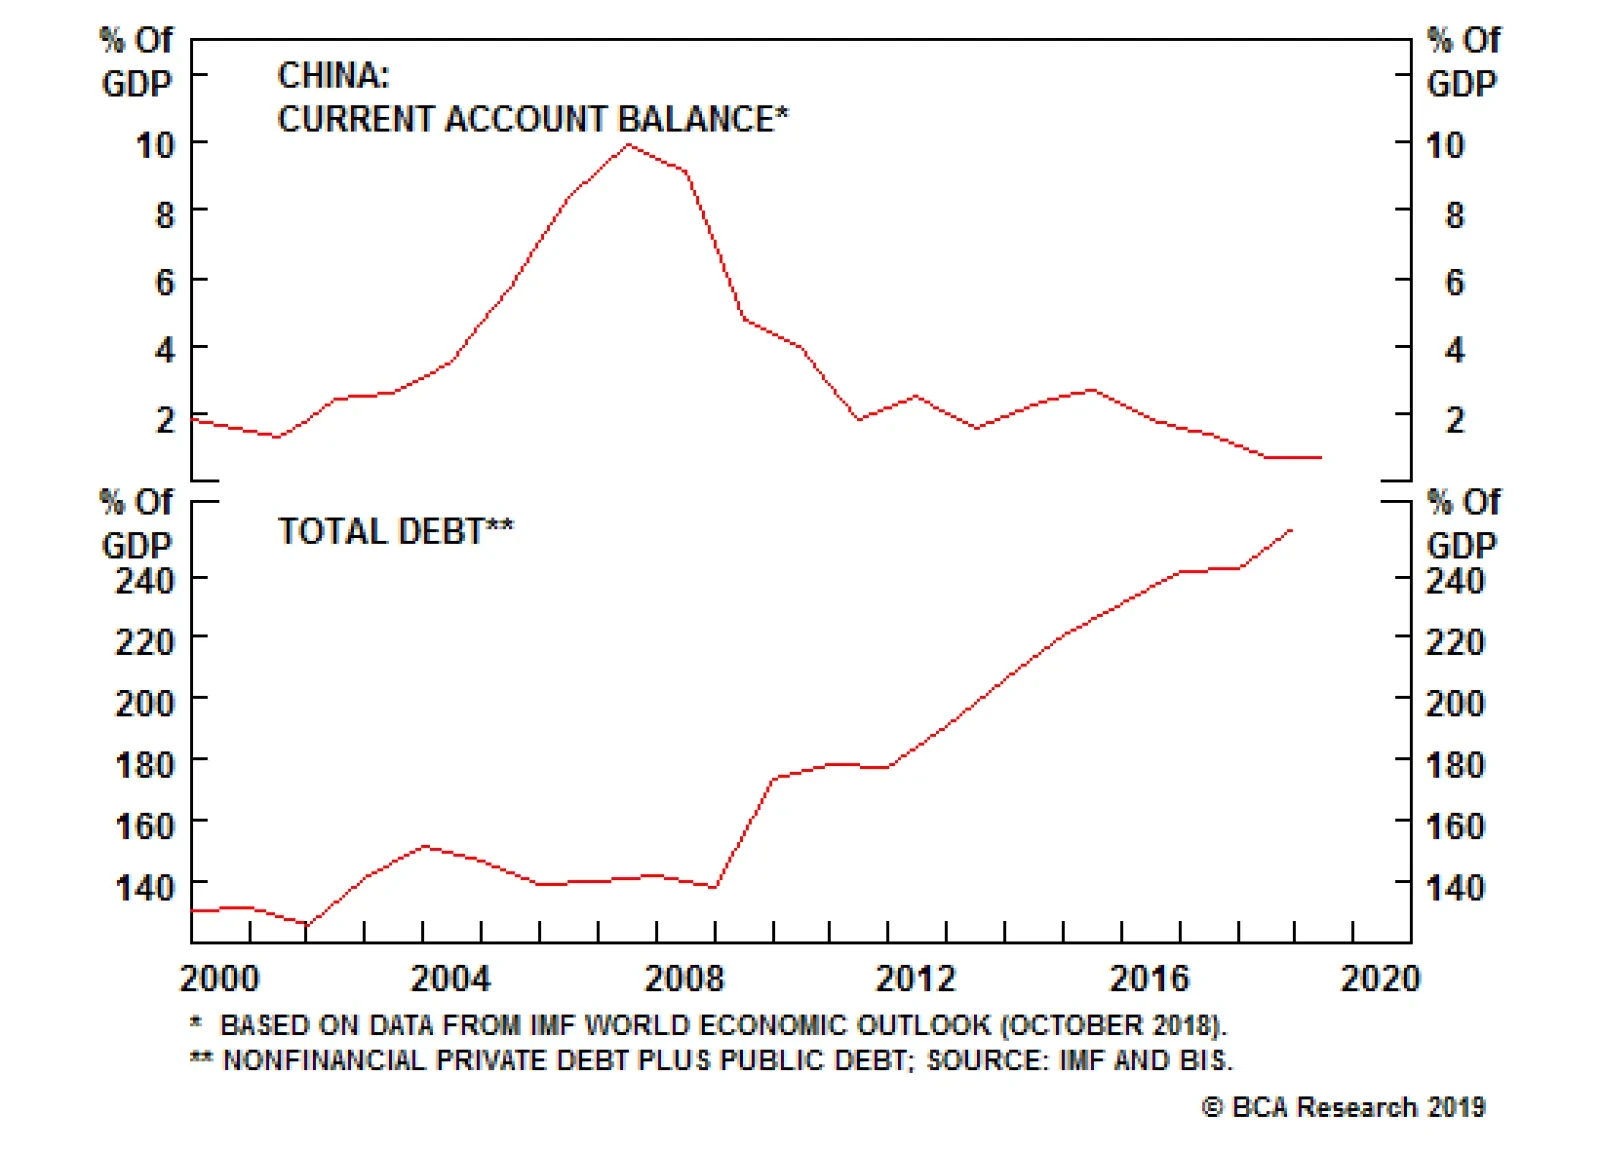
What To Do With Excess Savings? By definition, a country’s savings are either recycled into domestic investment or exported abroad via a current account surplus. The latter strategy served China well in the years leading up to the Great Recession, when the country’s current account surplus reached a whopping 10% of GDP (Chart 6). Just like Germany today, China was able to export its excess production with the help of a highly undervalued currency. Chart 6China: No Longer Exporting Savings Abroad
China: No Longer Exporting Savings Abroad
China: No Longer Exporting Savings Abroad
Unfortunately for China, as its economy has grown in relation to the rest of the world, running massive trade surpluses has become more difficult. This is especially true today, when the country is being singled out by the Trump administration and much of the international community for alleged unfair trade practices. As China’s ability to churn out large current account surpluses declined, the government moved to Plan B: propping up growth by recycling the country’s copious savings into fixed-asset investment (see Box 1). This process saw households park their savings in banks and other financial institutions which, in turn, lent the money out to companies and local governments in order to finance various investment projects. Not surprisingly, debt levels exploded (Chart 7). Chart 7China: From Exporting Savings To Investing Domestically (And Building Up Debt)
China: From Exporting Savings To Investing Domestically (And Building Up Debt)
China: From Exporting Savings To Investing Domestically (And Building Up Debt)
This strategy was feasible when China did not have a lot of debt and needed more factories, housing, and public infrastructure. But those days are long gone. The rate of return on assets among state-owned enterprises has now fallen below their borrowing costs (Chart 8). Our EM team estimates that 15%-to-20% of apartments in China are sitting vacant.3 Chart 8Rate Of Return On Assets Below Borrowing Costs For Chinese SOEs
Rate Of Return On Assets Below Borrowing Costs For Chinese SOEs
Rate Of Return On Assets Below Borrowing Costs For Chinese SOEs
How To Boost Consumption There is only one long-term solution to China’s excess savings problem: Tackle it head-on by taking steps to increase consumption. The good news is that there is some scope to do so. The Chinese income tax structure is fairly regressive. Poor households face an effective income tax rate exceeding 40%. This is well above OECD norms (Chart 9). A more progressive tax system would boost spending among poorer households. It would also curb inequality, which has increased sharply since the 1980s (Chart 10). The saving rate among the richest 10% of Chinese earners is close to 50%. Policies that shift income from the rich to the poor would reduce overall household savings.
Chart 9
Chart 10China: Inequality Has Risen In The Past Two Decades
China: Inequality Has Risen In The Past Two Decades
China: Inequality Has Risen In The Past Two Decades
As a share of GDP, public-sector spending in China on education, health care, and pensions is close to half of the OECD average (Chart 11). If the government were to finance the increase in social spending by running larger budget deficits, this would help reduce overall national savings both by increasing the budget deficit and by discouraging precautionary household savings. Unlike in most countries, the poor in China are net savers, largely because they cannot rely on a publicly-funded social safety net (Chart 12).
Chart 11
Chart 12
Recent tax changes, including an increase in the threshold at which income begins to be taxed and an expansion of deductions for childhood education, medical costs, and home loan interest and rent, are steps in the right direction. More Financial Repression? Over a longer-term horizon, the Chinese authorities are also likely to step up efforts to discourage savings by driving down real interest rates into negative territory. Since nominal interest rates are already low in China, the only way to reduce real rates is to raise inflation. The added benefit of higher inflation is that it would boost nominal GDP growth, thus putting downward pressure on the debt-to-GDP ratio. The catch is that negative real rates could destabilize the currency, fueling capital outflows. Negative real rates could also inflate asset bubbles, especially in the property market. The only way to square the circle is to tighten administrative controls, such as those relating to property speculation and capital flows, in order to preserve the benefits of negative real rates, while attenuating the costs. This suggests that hopes that the RMB will become an international reserve currency anytime soon are likely to be dashed. China Will Continue To Back Off From Its Deleveraging Campaign Realistically, the measures to boost consumption listed above will take time to implement. In the meantime, China’s economy continues to slow. Not only does a weaker economy endanger domestic stability, it also puts the Chinese government in a weaker negotiating position with the Trump administration over trade matters. This suggests that the government will continue to ease off its deleveraging campaign at least until growth recovers. Granted, one could have said the same thing last year. That is correct, but here is the thing: last year, credit growth was running at a much faster pace than today. Total social financing increased by only 11% year-over-year in December, not much higher than trend nominal GDP growth. On all three occasions over the past ten years when credit growth has fallen back towards nominal GDP growth, the government has allowed credit growth to accelerate (Chart 13). Chart 13China: Credit Growth Versus GDP Growth
China: Credit Growth Versus GDP Growth
China: Credit Growth Versus GDP Growth
We do not expect growth to surge this time around. However, if monthly credit growth simply stabilizes at current levels, the credit impulse, which is just the change in credit growth, will turn positive. Chart 14 shows that the 6-month impulse is already moving higher. The 12-month impulse is still trending down, but if credit growth remains constant at its current pace, it will start hooking up this summer (Chart 15). Chart 14Rebound In Chinese 6-Month Credit Impulse Bodes Well For Metals
Rebound In Chinese 6-Month Credit Impulse Bodes Well For Metals
Rebound In Chinese 6-Month Credit Impulse Bodes Well For Metals
Chart 15The 12-Month Credit Impulse Will Turn Up If Monthly Credit Growth Even Merely Stabilizes
The 12-Month Credit Impulse Will Turn Up If Monthly Credit Growth Even Merely Stabilizes
The 12-Month Credit Impulse Will Turn Up If Monthly Credit Growth Even Merely Stabilizes
Importantly, the Li Keqiang index, a broad real-time measure of economic growth in China, is highly correlated with the 12-month credit impulse. As Chinese growth bottoms out this summer, global growth will start to reaccelerate. This will help boost global cyclical stocks as well as EM shares. My colleague, Arthur Budaghyan, BCA’s chief emerging markets strategist, remains bearish on EM equities in both relative and absolute terms. While this publication does not have a strong view on the relative performance of EM versus DM shares, we do expect EM stocks to rise in absolute terms over the remainder of the year. Accordingly, we sold our March-2019 EEM put on January 3rd for a gain of 104%, and are now outright long the ETF as one of our recommended trades. Peter Berezin, Chief Global Strategist Global Investment Strategy peterb@bcaresearch.com BOX 1 Do Banks Create Money Out Of “Thin Air”? Strictly speaking, banks can create deposits by issuing new loans without the need for economic savings (which economists define as the difference between what an economy produces and consumes). In that sense, banks can create money out of “thin air.” However, this does not mean, as is sometimes claimed, that economic savings are irrelevant to credit creation or that there is no effective limit on the volume of loans that banks can originate. Even if one ignores the presence of legal capital requirements, the public must still be willing to hold whatever deposits banks create. Just like the number of apples a society wishes to consume is simultaneously determined by the number of apples farmers wish to produce and the number of apples people wish to eat (with the price of apples equilibrating supply and demand), the answer to the question of whether loans create deposits or deposits create loans is always “both.” The aggregate volume of deposits that people wish to hold depends, among other things, on the level and distribution of net worth across society, as well as the rate of return that bank deposits offer compared to competing financial instruments (including cash, which pays nothing). A country’s net worth tends to be closely correlated with the value of its capital stock. Both are mainly determined by accumulated economic savings. Real interest rates are also largely determined by economic savings, especially at the global level, where rates adjust to ensure that world savings equals investment. The distribution of savings also matters. When some people wish to spend more than they earn, while others wish to do the opposite, debt levels will rise. The same is true for individual sectors of the economy. If there are some sectors that save a lot (such as households in China) and other sectors that borrow a lot (Chinese state-owned companies and local governments), debt levels will go up. Debt levels will also rise when people purchase assets using credit. Fresh economic savings are not necessary to finance the purchase of existing assets, but with the exception of undeveloped land and natural resources, economic savings are needed to create those assets (such as when a home is constructed or a factory is built). In China, a perfect trifecta of sky-high property prices, a high and uneven distribution of savings throughout the economy, and a financial sector that has been willing to intermediate savings without much regard for credit quality, have all contributed to the elevated debt levels we see today. Footnotes 1 Please see Global Investment Strategy Weekly Report, "Patient Jay," dated January 18, 2019. 2 Shang-Jin Wei and Xiao Zhang, "The Competitive Saving Motive: Evidence From Rising Sex Ratios And Savings Rates In China," Journal of Political Economy, Vol. 119, No. 3, 2011. 3 Please see Emerging Markets Strategy Special Report, “China Real Estate: A Never-Bursting Bubble?” dated April 6, 2018. Strategy & Market Trends MacroQuant Model And Current Subjective Scores
Chart 16
Tactical Trades Strategic Recommendations Closed Trades
OPEC 2.0 is building physical optionality, to deal with different possible moves the U.S. can make on Iranian oil export sanctions and waivers. This comes despite an apparent break in the sense of urgency Saudi Arabia and Russia feel re production cuts. The coalition’s market monitoring committee meets in April, followed by a full gathering in May, when U.S. waivers expire. If the U.S. extends waivers, OPEC 2.0 can extend production cuts; if it doesn’t, it can add supply as needed.1 On the demand side, markets appear to be overly concerned about a sharper-than-expected slowdown in China, which, if borne out, would restrain EM growth. We believe these fears are overdone, and expect a slight improvement in EM demand generally this year and next. In our new balances estimates, we see the OECD commercial oil inventory overhang clearing in 1H19, on the back of resilient demand, OPEC 2.0 discipline, and a more moderate level of growth in U.S. shale oil output. This keeps Brent on track to average $80/bbl this year and $85/bbl next year, with WTI trading $74/bbl this year, and $82/bbl next year. Highlights Energy: Overweight. Mandatory cuts of 325k b/d, coupled with additional exports of ~ 190k b/d due to additional train and pipeline capacity out of Canada, will drain the 35mm barrels of excess crude oil inventories targeted by the Alberta government in December by 1H19. The WCS – WTI spread narrowed to -$10/bbl from -$50/bbl on these mandatory cuts. By 2H19, we expect Canadian production cuts to average 95k b/d. Base Metals: Neutral. Aluminum output in China surged 11.3% y/y in December, hitting 3.05mm MT, according to Metal Bulletin. Total output for 2018 was 35.8mm MT, a 7.4% y/y increase. Precious Metals: Neutral. Gold is holding its recent gains, as markets become more comfortable with the Fed pausing on its rates-normalization policy until 2H19. Agriculture: Underweight. Hot and dry weather in Brazil is threatening crop yields there. The unfavorable weather is expected to affect three-quarters of cotton-growing regions, half of sugar areas, a third of first-crop corn acreage, and a quarter of soy regions. Feature The first signs of fraying in the relationship between the putative leaders of OPEC 2.0 – the Kingdom of Saudi Arabia (KSA), which cut production ~ 450k b/d m/m in December, and Russia, which raised output – are emerging, as world leaders meet in Davos. While this casts doubt on the leadership’s carefully cultivated amity, and their shared willingness to abide by the recently agreed output cuts, we do not believe it signals the end of the historic cooperation between these states. Total OPEC output – estimated by production-tracking sources outside the Cartel – stood at 31.6mm b/d in December, a prodigious 751k b/d reduction m/m. We expect continued oil production cuts from core OPEC states and decline-curve losses among non-Gulf OPEC and non-OPEC states within the coalition this year to remove at least 1.2mm b/d from the market, per the quotas agreed by members in December (Chart of the Week, Table 1). On top of this, mandatory Canadian production cuts of 325k b/d in 1H19 and 95k b/d in 2H19 will keep average production cuts at ~ 1.4mm b/d this year. Chart of the WeekOPEC 2.0 Will Resume Production Cuts
OPEC 2.0 Will Resume Production Cuts
OPEC 2.0 Will Resume Production Cuts
Table 1OPEC 2.0 Production Cuts Could Exceed Quotas
OPEC Starts Cutting Oil Output; Demand Fears Are Overdone
OPEC Starts Cutting Oil Output; Demand Fears Are Overdone
OPEC 2.0’s cuts could persist into 2020, depending on how the U.S. deals with Iranian oil-export sanctions and waivers. Even though KSA and Russia apparently do not share the same sense of urgency re production cuts right now, we believe OPEC 2.0 is committed to draining oil inventories, particularly in the OECD.2 To do so, they’re increasing their operational flexibility – creating physical options, in a manner of speaking – to deal with a range of uncertain outcomes when U.S. waivers on Iranian export sanctions expire in May. Sanctions And OPEC 2.0’s Physical Options Despite the waivers granted to its eight top consumers shortly after U.S. sanctions took effect in November, Iranian exports plunged below 0.5mm b/d in December. As of December, China had substituted almost all of its Iranian imports for alternative barrels.3 This coincided with a production surge by OPEC 2.0 at the behest of the U.S. leading up to the November sanctions deadline of November 4, 2018, which swelled OECD inventories and took them above their rolling 5-year average level (Chart 2). India retained 30% of its May import levels from Iran, while Europe complied at 100% with U.S. sanctions (Table 2). Chart 3 shows the decrease in exports in preparation for the sanctions over the course of 2018. Chart 2OECD Inventory Overhang Will Draw As OPEC 2.0 Cuts and Losses Kick In
OECD Inventory Overhang Will Draw As OPEC 2.0 Cuts and Losses Kick In
OECD Inventory Overhang Will Draw As OPEC 2.0 Cuts and Losses Kick In
Table 2Iran Exports By Destination 2018 (‘000 b/d)
OPEC Starts Cutting Oil Output; Demand Fears Are Overdone
OPEC Starts Cutting Oil Output; Demand Fears Are Overdone
Chart 3
Whether or not the waivers are extended is anyone’s guess. It is possible waivers will be extended for 90 or 180 days, as a way to counter OPEC 2.0 production cuts, and to offset the lag between filling new pipeline takeaway capacity in the Permian. We expect importers to queue up for Iranian barrels as the market tightens in 1H19. OPEC 2.0’s market monitoring committee will meet in April, followed by a ministerial meeting in May, just ahead of the expiration of the waivers.4 If the U.S. extends them, OPEC 2.0 can extend production cuts after it meets in May; if waivers are not extended, the Cartel can calibrate an appropriate supply response. Either way, we expect OPEC 2.0 will closely align its production schedule with any U.S. action on the sanctions and waivers. This will, we believe, keep change in the overall market’s supply side relatively constant, except for the month or two required to adjust OPEC 2.0 output. Permian Will Drive OPEC 2.0 Policy The larger issue for OPEC 2.0 comes in 4Q19, when ~ 2mm b/d of new pipeline takeaway capacity comes on line in the Permian Basin in West Texas. With additional takeaway capacity due to come on in 2020, the Cartel will have its work cut out for it next year.5 Our models show a slight decrease then flattening in U.S. rig counts over the coming months, as a result of the 4Q18 sell-off in WTI, with a rebound around mid-year (Chart 4). This is because rig count lags oil prices by ~4 months. Chart 4U.S. Shales Continue to Drive Lower 48 Production Growth (ex GOM)
U.S. Shales Continue to Drive Lower 48 Production Growth (ex GOM)
U.S. Shales Continue to Drive Lower 48 Production Growth (ex GOM)
We are expecting production in the Big 5 shale basins to average 8.4mm b/d in 2019 and 9.0mm b/d next year, a somewhat higher level than projected by the EIA. Growth in the shales accounts for close to 80% of the 2.3mm b/d of growth in the U.S. over 2019 – 2020. Globally, U.S. shales will continue to provide the bulk of y/y crude oil production growth, accounting for 73% of the 2.5mm b/d of growth we will see over the next two years. Given the near-death experience OPEC 2.0 member states had in the price collapse of 2014 – 2016, we remain convinced OPEC 2.0 member states will once again have to embark on a strategy to backwardate the Brent forward curve as they did in 1H18, to moderate the growth of shale-oil production in the U.S. (Chart 5). Reducing production in the short term will force refiners to draw inventories to supply their units and produce products like gasoline, diesel, jet fuel and a wide range of petrochemicals. Chart 5OPEC 2.0 Needs Backwardated Brent Forwards
OPEC 2.0 Needs Backwardated Brent Forwards
OPEC 2.0 Needs Backwardated Brent Forwards
This will backwardate the Brent forward curve – i.e., prompt-delivery barrels will be more expensive than deferred-delivery barrels. A backwardated forward curve means OPEC 2.0 member states with term contracts indexed to spot prices receive higher prices for their oil than shale producers hedging 2 years forward, all else equal. The trick for OPEC 2.0 will be to keep the Brent forwards backwardated when the Permian takeaway capacity starts to fill, and exports from the U.S. rise in the early 2020s, as deep-water harbors are brought on line. If OPEC 2.0 is successful in keeping the Brent forwards in backwardation, this will, over time, moderate the growth of shale production: Hedgers’ revenue is constrained by lower forward prices.6 We would not be surprised if OPEC 2.0 states started announcing final investment decisions on select investments in spare capacity to augment existing resources, so they are able to quickly bring production to market in the event of unplanned outages that could lift the entire forward curve and incentivize hedging at higher prices. Demand Still Looks Good Oil markets continue to fret over a possible hard landing in China – resulting either from an internal policy error or a ratcheting up of tensions in the Sino – U.S. trade war. This is causing markets to extrapolate into the wider EM space, and take oil-demand projections lower on an almost-daily basis. In a word, markets are overwrought. Chinese policymakers are sensitive to the tight financial conditions that prevailed in 2H18, which, along with the trade war with the U.S., slowed growth and fostered uncertainty among households and firms in China. We agree with our Geopolitical Strategy and China Investment Strategy groups that presidents Trump and Xi are pragmatists dealing with restive populations, and want to deliver a deal ahead of U.S. elections and the 100th anniversary of the founding of the Chinese Communist Party in 2021.7 We’ve been expecting the government to deploy a modest amount of stimulus in 1H19, which will begin having an effect on the Chinese economy in the second half of this year. Toward the end of the year and into 2020, we expect the larger stimulus to be deployed in the run-up to put a bid under industrial commodities – oil, base metals and bulks in particular. Overall, we are seeing signs global growth may be reviving over the next few months via an apparent bottoming in our Global LEI Diffusion index (Chart 6). The diffusion index measures the proportion of countries where Leading Economic Indicators (LEIs) are rising relative to those in which LEIs are falling. As is apparent in Chart 6, the diffusion index suggests the downturn in the global LEI has bottomed. The index leads the global LEI by a few months. Chart 6BCA's Global LEI Likely Bottoming
BCA's Global LEI Likely Bottoming
BCA's Global LEI Likely Bottoming
In our latest supply-demand balances, we are expecting Chinese oil demand to average 14.3mm b/d this year, and 14.8mm b/d next year. Along with India – expected to consume 5.0mm b/d this year, and 5.2mm b/d next year – these two states account for 36% of the total 54.3mm b/d of EM demand we expect in 2019 and 2020 (Table 3).8 Table 3BCA Global Oil Supply - Demand Balances (MMb/d, Base Case Balances)
OPEC Starts Cutting Oil Output; Demand Fears Are Overdone
OPEC Starts Cutting Oil Output; Demand Fears Are Overdone
Overall EM demand, the powerhouse of global oil-demand growth led by China and India, is expected to increase 1.1mm b/d this year – slightly more than we estimated last month – and 1.3mm b/d in 2020. DM demand growth, as always, comes in lower, at 390k b/d this year and 280k b/d next year. Oil Supply-Demand Balances Will Tighten We expect global oil production to average 100.9mm b/d this year and 102.9mm b/d in 2020. Consumption is expected to average 101.8mm b/d this year and 103.4mm b/d next year, respectively (Chart 7). This puts OECD inventories back on a downward trajectory, as storage draws resume (Chart 2). Chart 7Global Oil Balances Will Resume Tightening
Global Oil Balances Will Resume Tightening
Global Oil Balances Will Resume Tightening
On the back of these estimates, we expect Brent to average $80/bbl this year and $85/bbl next year, with WTI averaging $74/bbl and $82/bbl, respectively. Given our expectation for higher prices in Brent and WTI, we continue to favor being long crude oil exposure. We are long outright WTI spot futures; long July 2019 Brent vs. short July 2020 Brent; long call spreads along the 2019 forward Brent curve, and long the S&P GSCI. Bottom Line: Markets will continue to tighten as a combination of lower supply growth and rising consumption allows OECD commercial oil inventories to resume their downward trajectory. The apparent lack of a shared sense of urgency by OPEC 2.0’s leaders – KSA and Russia – will be resolved, in our view. OPEC 2.0 will once again focus on backwardating the Brent forward curve, in order to gain some control over the rate at which U.S. shale oil production grows. We continue to favor long exposures to the crude oil futures. Robert P. Ryan, Senior Vice President Commodity & Energy Strategy rryan@bcaresearch.com Hugo Bélanger, Senior Analyst Commodity & Energy Strategy HugoB@bcaresearch.com Pavel Bilyk, Research Analyst Commodity & Energy Strategy PavelB@bcaresearch.com Footnotes 1 In last week’s Commodity & Energy Strategy we noted these upcoming meetings, and OPEC 2.0’s resolve to drain the market. Please see “Fed’s Capitulation Will Boost Oil,” published by BCA Research January 17, 2019. It is available at ces.bcaresearch.com. 2 Bloomberg reported this week KSA’s and Russia’s oil ministers cancelled a planned meeting in Davos, following al-Falih’s criticism of the pace at which Russian oil production is being cut. Please see “Saudi, Russian Energy Ministers Cancel Planned Davos Meeting,” published by bloomberg.com January 22, 2019. KSA cut its crude oil output 450k b/d m/m in December to 10.64mm b/d from 11.09mm b/d in November. Russia increased crude and liquids production to a record 11.65mm b/d in December, an 80k b/d increase m/m, according to OPEC Monthly Oil Market Report published January 17, 2019. OPEC expects Russian oil output to average 11.47mm b/d in 1H19, and 11.49mm b/d in 2019. We are carrying something close to this in our balances (11.51mm b/d) for 2019 and 2020. 3 China imported 10.3mm b/d of crude oil in December after posting a record 10.4mm b/d of imports in November 2018, just as sanctions were kicking in. 4 In our base case estimate, we assume Iran’s crude oil output will average ~ 2.8mm b/d, down ~ 1.0mm b/d from its 3.8mm b/d production level in 1H18, which was prior to the U.S.’s announcement it intended to re-impose export sanctions. One way or another, we expect OPEC 2.0 to adjust production to compensate for whatever production is lost due to sanctions. 5 Please see “Permian tracker: Production growth slowing as pipeline race still on,” published by S&P Global Platts July 2, 2018, for a discussion of the new takeaway capacity planned for the Permian Basin by midstream companies in 2019 and 2020. 6 The Permian basin is closely tied to hedging activity in the WTI futures market. It is the only basin for which WTI commercial short open interest is an explanatory variable for rig counts in our modeling. Commercial short open interest in the WTI futures also Granger causes Permian rig counts. 7 Please see the Special Report entitled “Is China Already Isolated,” published by BCA Research’s Geopolitical Strategy and China Investment Strategy January 23, 2019. It is available at gps.bcaresearch.com and cis.bcaresearch.com. 8 Our EM demand assumptions are driven by the IMF and World Bank EM GDP forecasts. This week the IMF lowered its global growth forecast for 2019 and 2020 by 0.2 and 0.1 percentage points to 3.5% and 3.6%, respectively. This is only slightly down from our lower estimate last month, but still above the World Bank’s expectation. We are using these variables directly in regressions to estimate prices and EM consumption. This replaced our earlier income-elasticity models used to calculate EM oil consumption. We proxy EM demand with non-OECD oil consumption. We discuss this in “Fed’s Capitulation Will Boost Oil,” published by BCA Research January 17, 2019. It is available at ces.bcaresearch.com. Investment Views and Themes Recommendations Strategic Recommendations Tactical Trades Trade Recommendation Performance In 4q18
Image
Commodity Prices and Plays Reference Table Insert table images here Summary Of Trades Closed In 2018
Image
Holding all else constant, a scenario in which tariffs are held at current levels is positive for Chinese growth and China-related assets. We recommend that investors hold an overweight position in Chinese stocks relative to the EM equity index as a tactical…
The most likely basis for a “whatever it takes” policy moment in China is either a sudden and sharp deterioration in the economy despite the various easing measures, or a renewed escalation of the trade war. Our geopolitical strategists maintain that the…
The PBoC is injecting liquidity into the system (net negative sterilization). Injections via the medium-term lending facility are also growing. However, the interbank rate had increased recently, so that recent central bank injections are mostly…
The immediate question for investors in 2019 is whether the downside economic risk has become so pressing that President Xi will shift the policy gear from growth stabilization to total reflation. The evidence suggests that the policy stance has not…
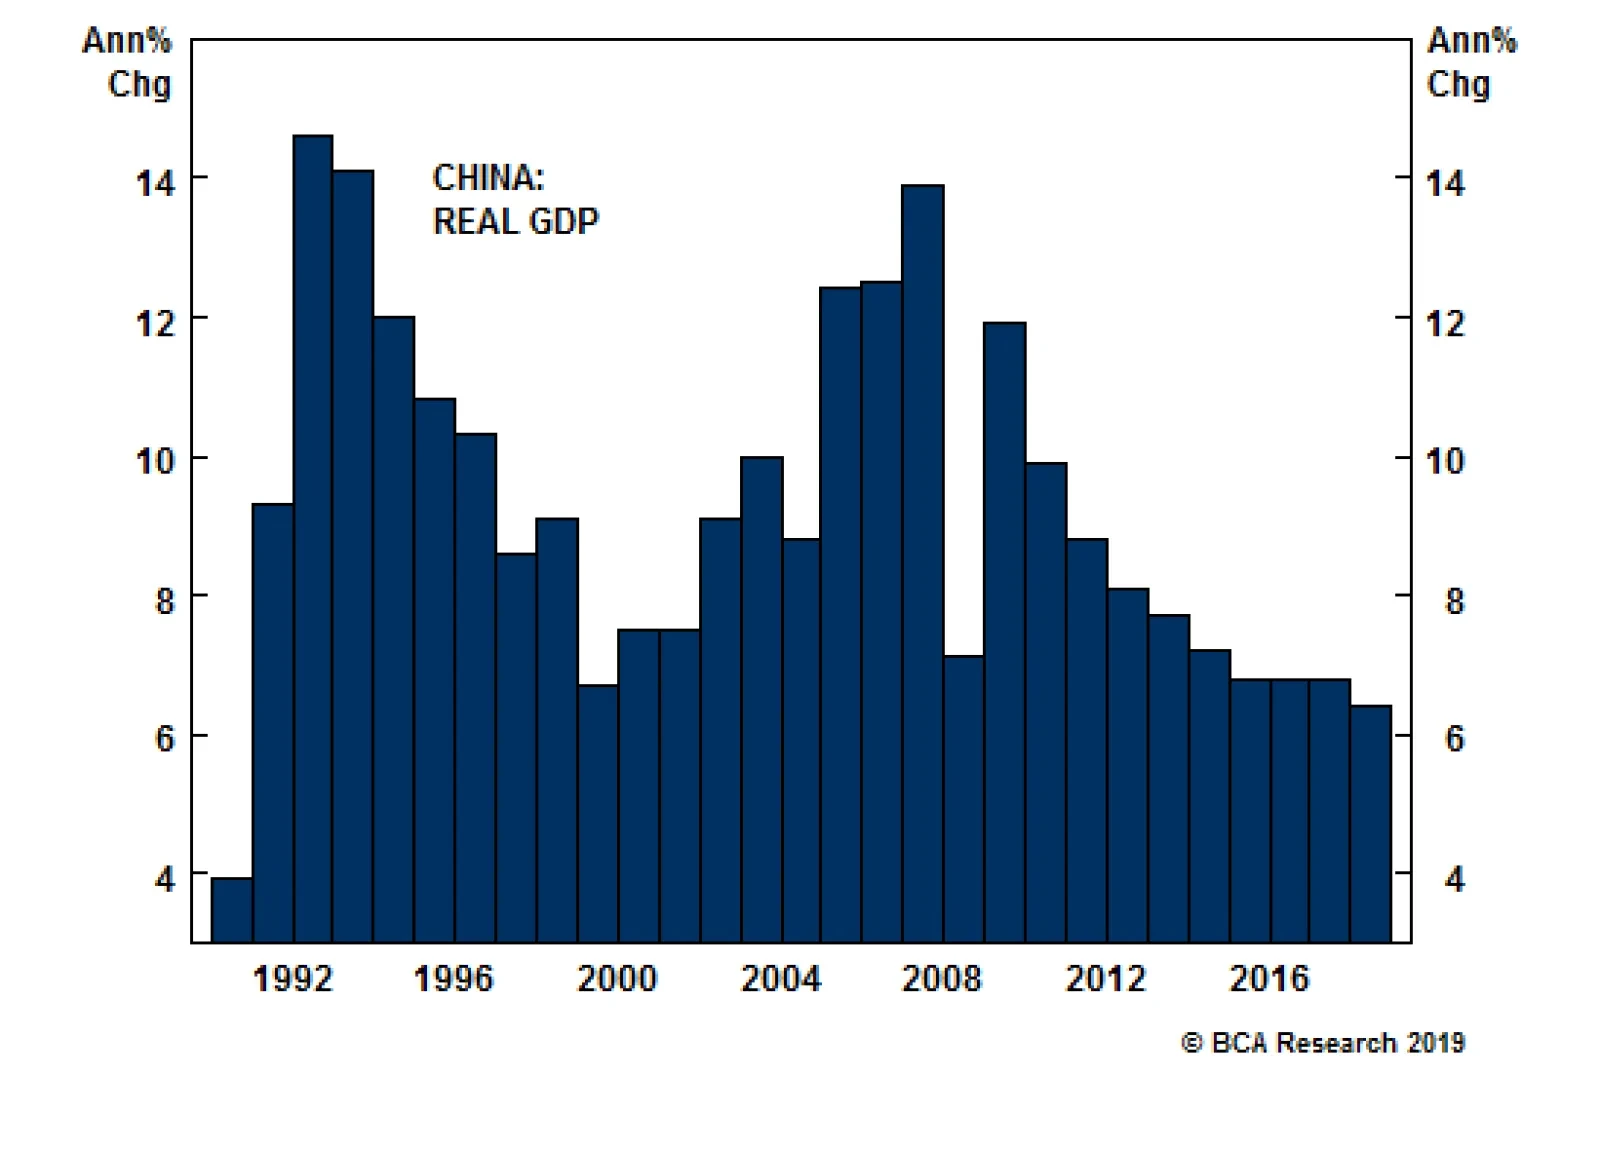
Highlights So What? It is too soon to adopt a cyclical overweight position on Chinese equities. Remain overweight only tactically. Why? China is still maintaining a disciplined approach to economic stimulus. The US-China trade talks are making tentative progress, but there is still a 30% chance of tariff rate hikes this year. The House Democrats show that the US’s tougher approach to China is a bipartisan policy consensus. Feature China released preliminary 2018 GDP data on January 21. The annual real growth rate was recorded at 6.6%, a fall from the 6.9% of 2017, although the latter has now been revised down to 6.8% (Chart 1). The big picture in 2018 is the slowest credit growth on record, the slowest retail sales growth since 2003, the weakest manufacturing output since 2014, and a negative export shock due to trade war (Chart 2). Chart 1China’s Slowdown In Perspective
China's Slowdown In Perspective
China's Slowdown In Perspective
Chart 2A Rocky Road For Beijing
A Rocky Road For Beijing
A Rocky Road For Beijing
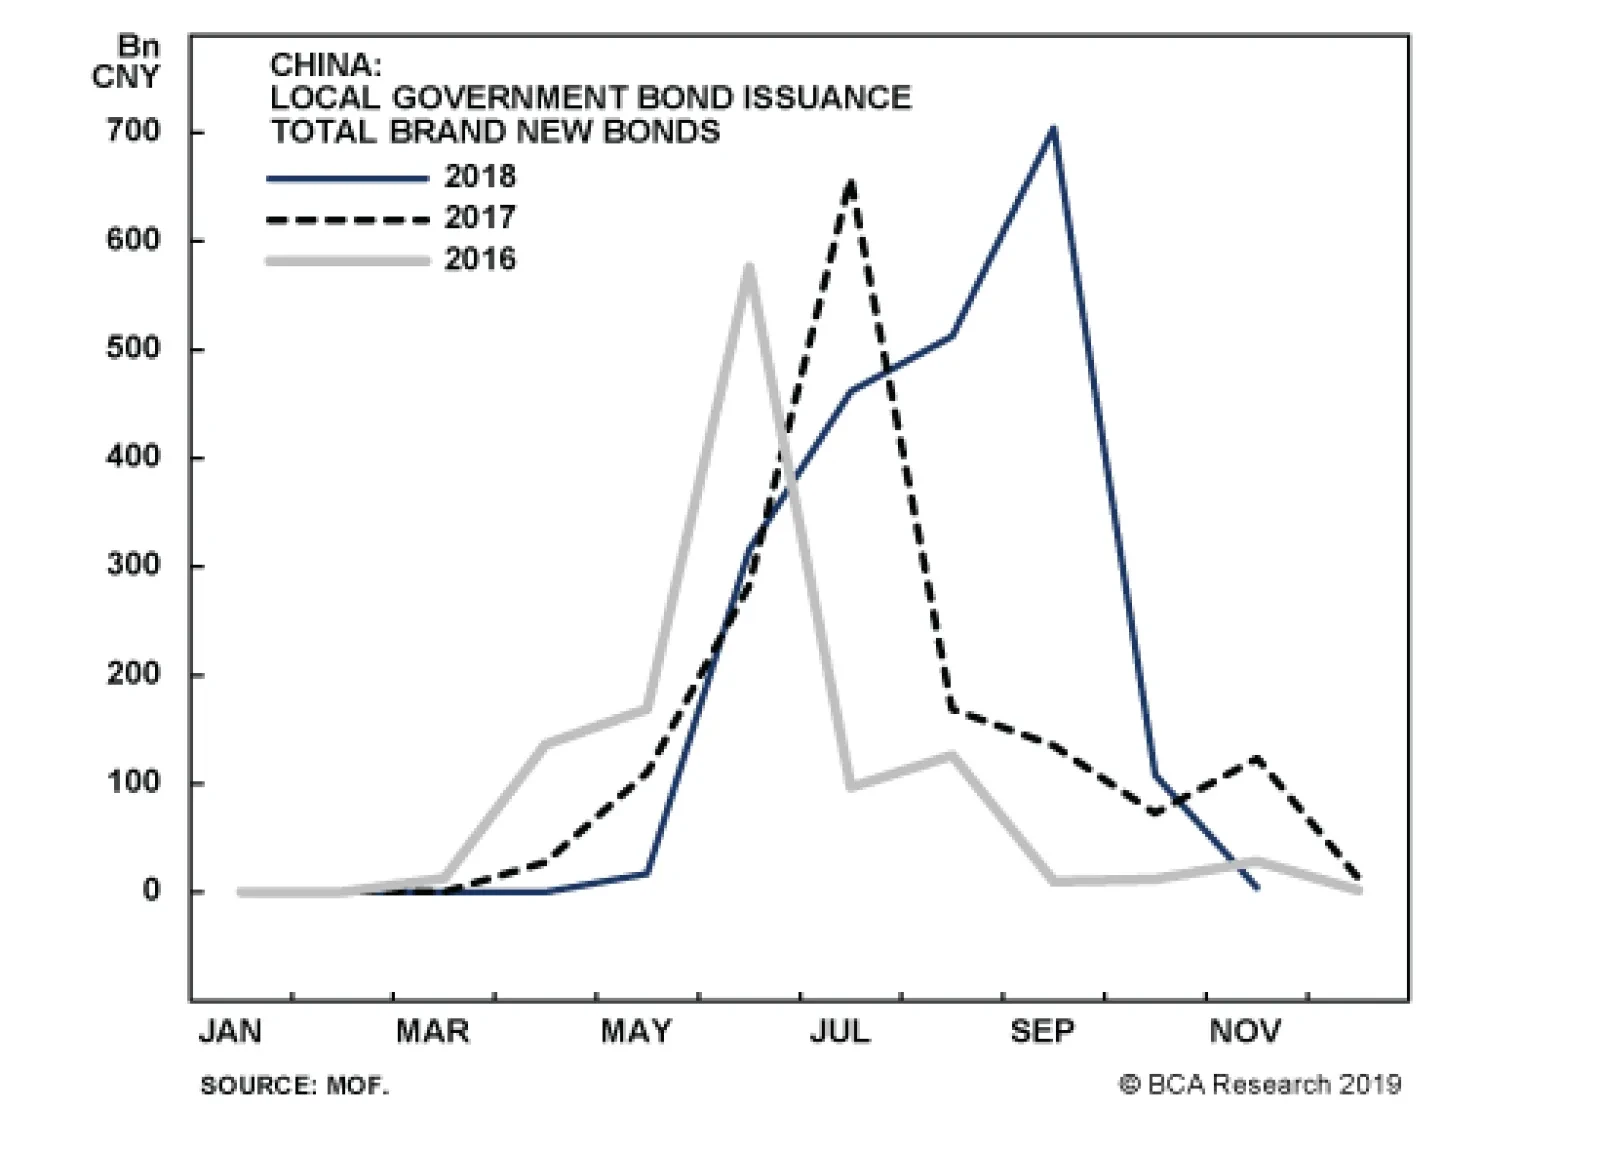
The immediate question for investors in 2019 is whether the downside risk has become so pressing that President Xi will shift the policy gear from growth stabilization to total reflation. So far the evidence suggests that the policy stance has not changed from last July. Official rhetoric continues to eschew opening the stimulus floodgates. This disciplined approach is clear when examining the most recent reflationary actions: Fiscal Easing: Local governments are allowed to start issuing 1.39 trillion RMB in new bonds from the beginning of the year, rather than waiting until April or May like usual (Chart 3). This will create a substantial new fiscal boost in the first half of the year that could help stabilize the economy in the second half.1 This 1.39 trillion RMB is not the full-year quota (last year’s was 2.18 trillion RMB). If the government had wanted to create a “big bang” effect, it would have announced a very large new quota for the full year all at once – something approaching 3.4 trillion RMB. This is what the year’s total would be if new issuance grew at the average 55% growth rate since 2015 (Chart 4). But so far the government is focusing on “frontloading” rather than “expanding” the amount of new bonds allowed to be issued. The full-year quota is important to watch in March. Anything above 2.9 trillion RMB would mean a looser fiscal stance from last year.
Chart 3
Chart 4
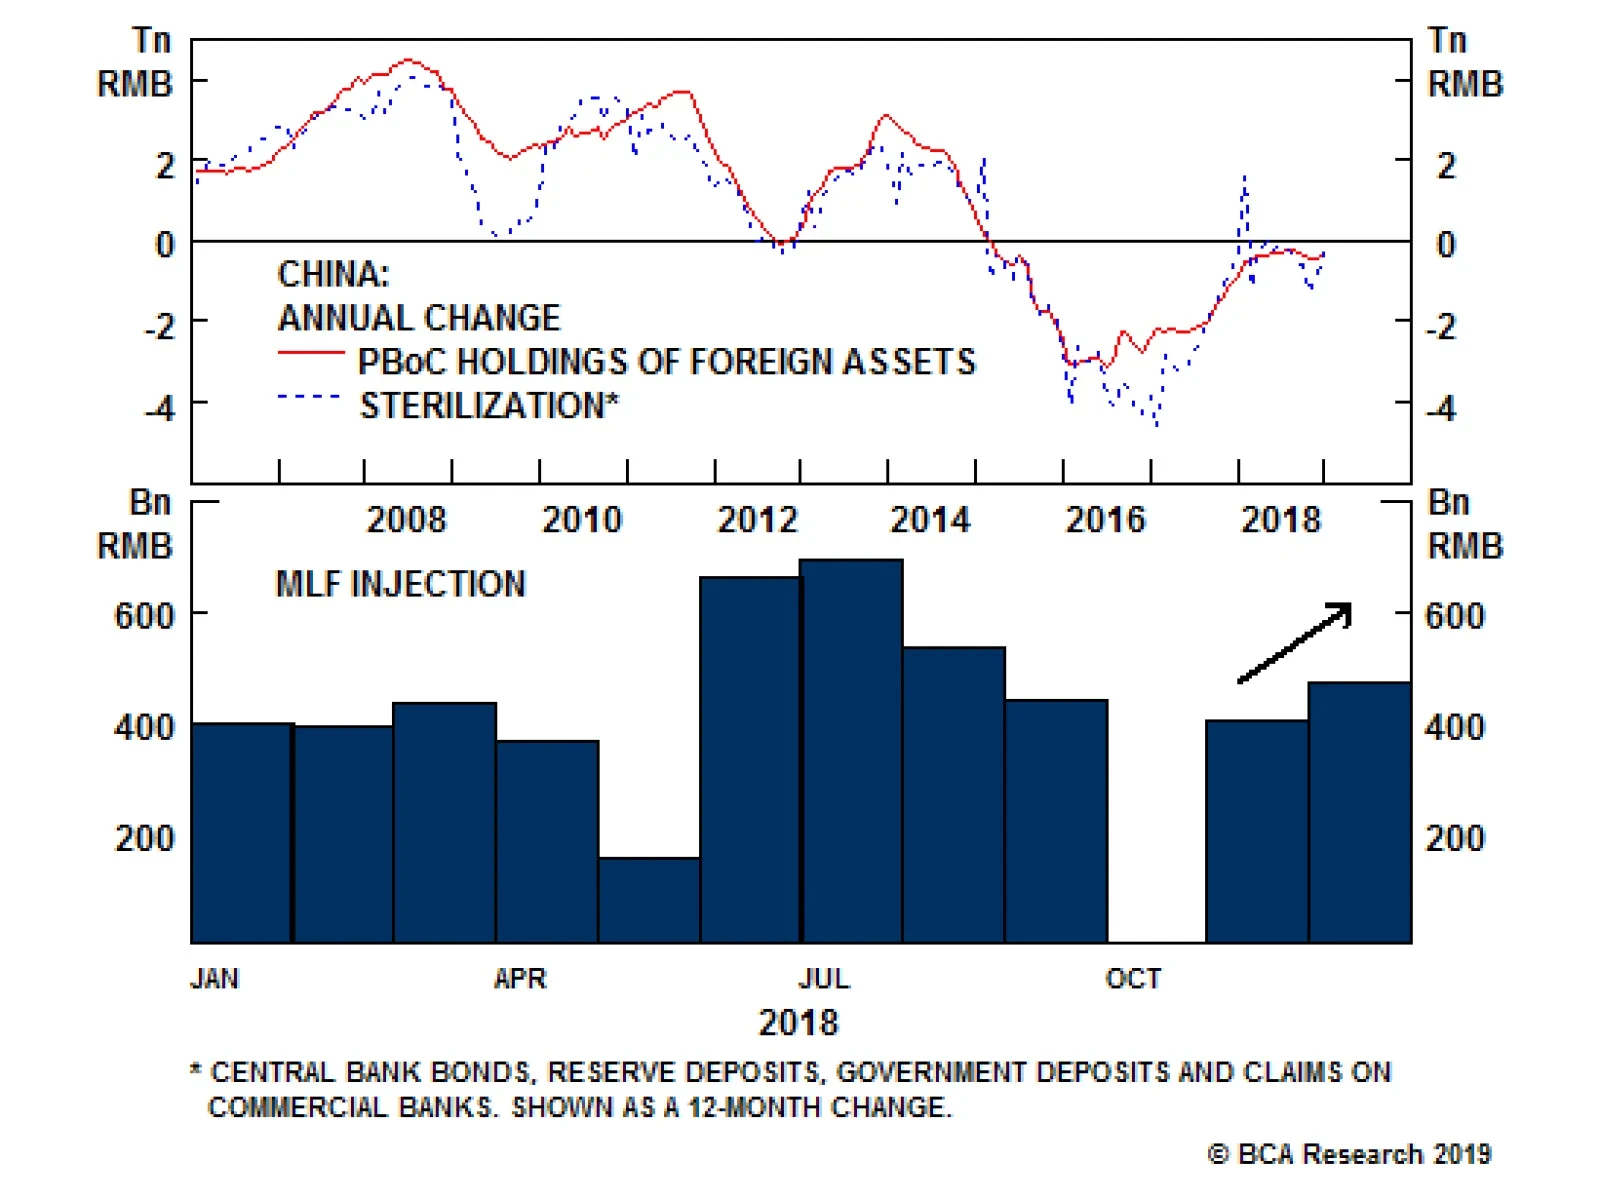
Otherwise, fiscal easing is focusing on tax cuts for households, small businesses, and consumers rather than new loans to SOEs as in the past. The new tax cuts in 2019, for small and medium-sized enterprises (SMEs), amount to about 200 billion RMB, according to government statements. This comes on top of a 1.3 trillion RMB tax cut that took effect at the end of last year. Therefore the minimum tax relief in 2019 is 1.5 trillion RMB or 2% of GDP. The impact is positive for consumer demand but unlikely to produce a rapid V-shaped turnaround in the growth rate, as was once the case with huge bursts of new loans to the corporate sector. Finally, depending on monetary policy, increases to fiscal spending will mostly serve to offset weak credit growth and the resulting drag on economic activity. Monetary Easing: The People’s Bank of China is, on balance, injecting liquidity into the system (net negative sterilization). Injections via the medium-term lending facility are also growing (Chart 5). However, the interbank rate had increased recently, so that recent central bank injections are mostly maintaining the easy conditions of H2 2018 (Chart 6). The extraordinary liquidity injections of January are preemptive attempts to ensure ample liquidity ahead of the Lunar New Year, when funds are tight. Chart 5PBoC Remains Supportive
PBoC Remains Supportive
PBoC Remains Supportive
Chart 6Interbank Rates Pushed Back Down
Interbank Rates Pushed Back Down
Interbank Rates Pushed Back Down
Cuts in banks’ required reserve ratios (RRRs) have not yet triggered a clear revival in credit growth. The twelve-month credit impulse has not yet bottomed, even though broad money impulses are positive or moving into positive territory (Chart 7). Shadow financing remains weak. Regulatory tightening is suppressing non-bank lenders while private business sentiment remains troubled (Chart 8). Chart 7No Clear Bottom In Credit Impulse Yet
bca.gps_sr_2019_01_23_c7
bca.gps_sr_2019_01_23_c7
Chart 8Shadow Financing Still Under Pressure
Shadow Financing Still Under Pressure
Shadow Financing Still Under Pressure
Once the credit impulse bottoms and turns upward, there will likely be a 6-9 month lag before it lifts overall economic activity. In March at the National People’s Congress session, Premier Li Keqiang is expected to set the official GDP growth target at a range of 6%-6.5% for 2019, lower than 2018’s “around 6.5%.” Several of China’s provinces are downgrading their growth targets for this year (Chart 9). The various stimulus measures are apparently seen as limiting downside risks rather than creating a new upside risk.
Chart 9
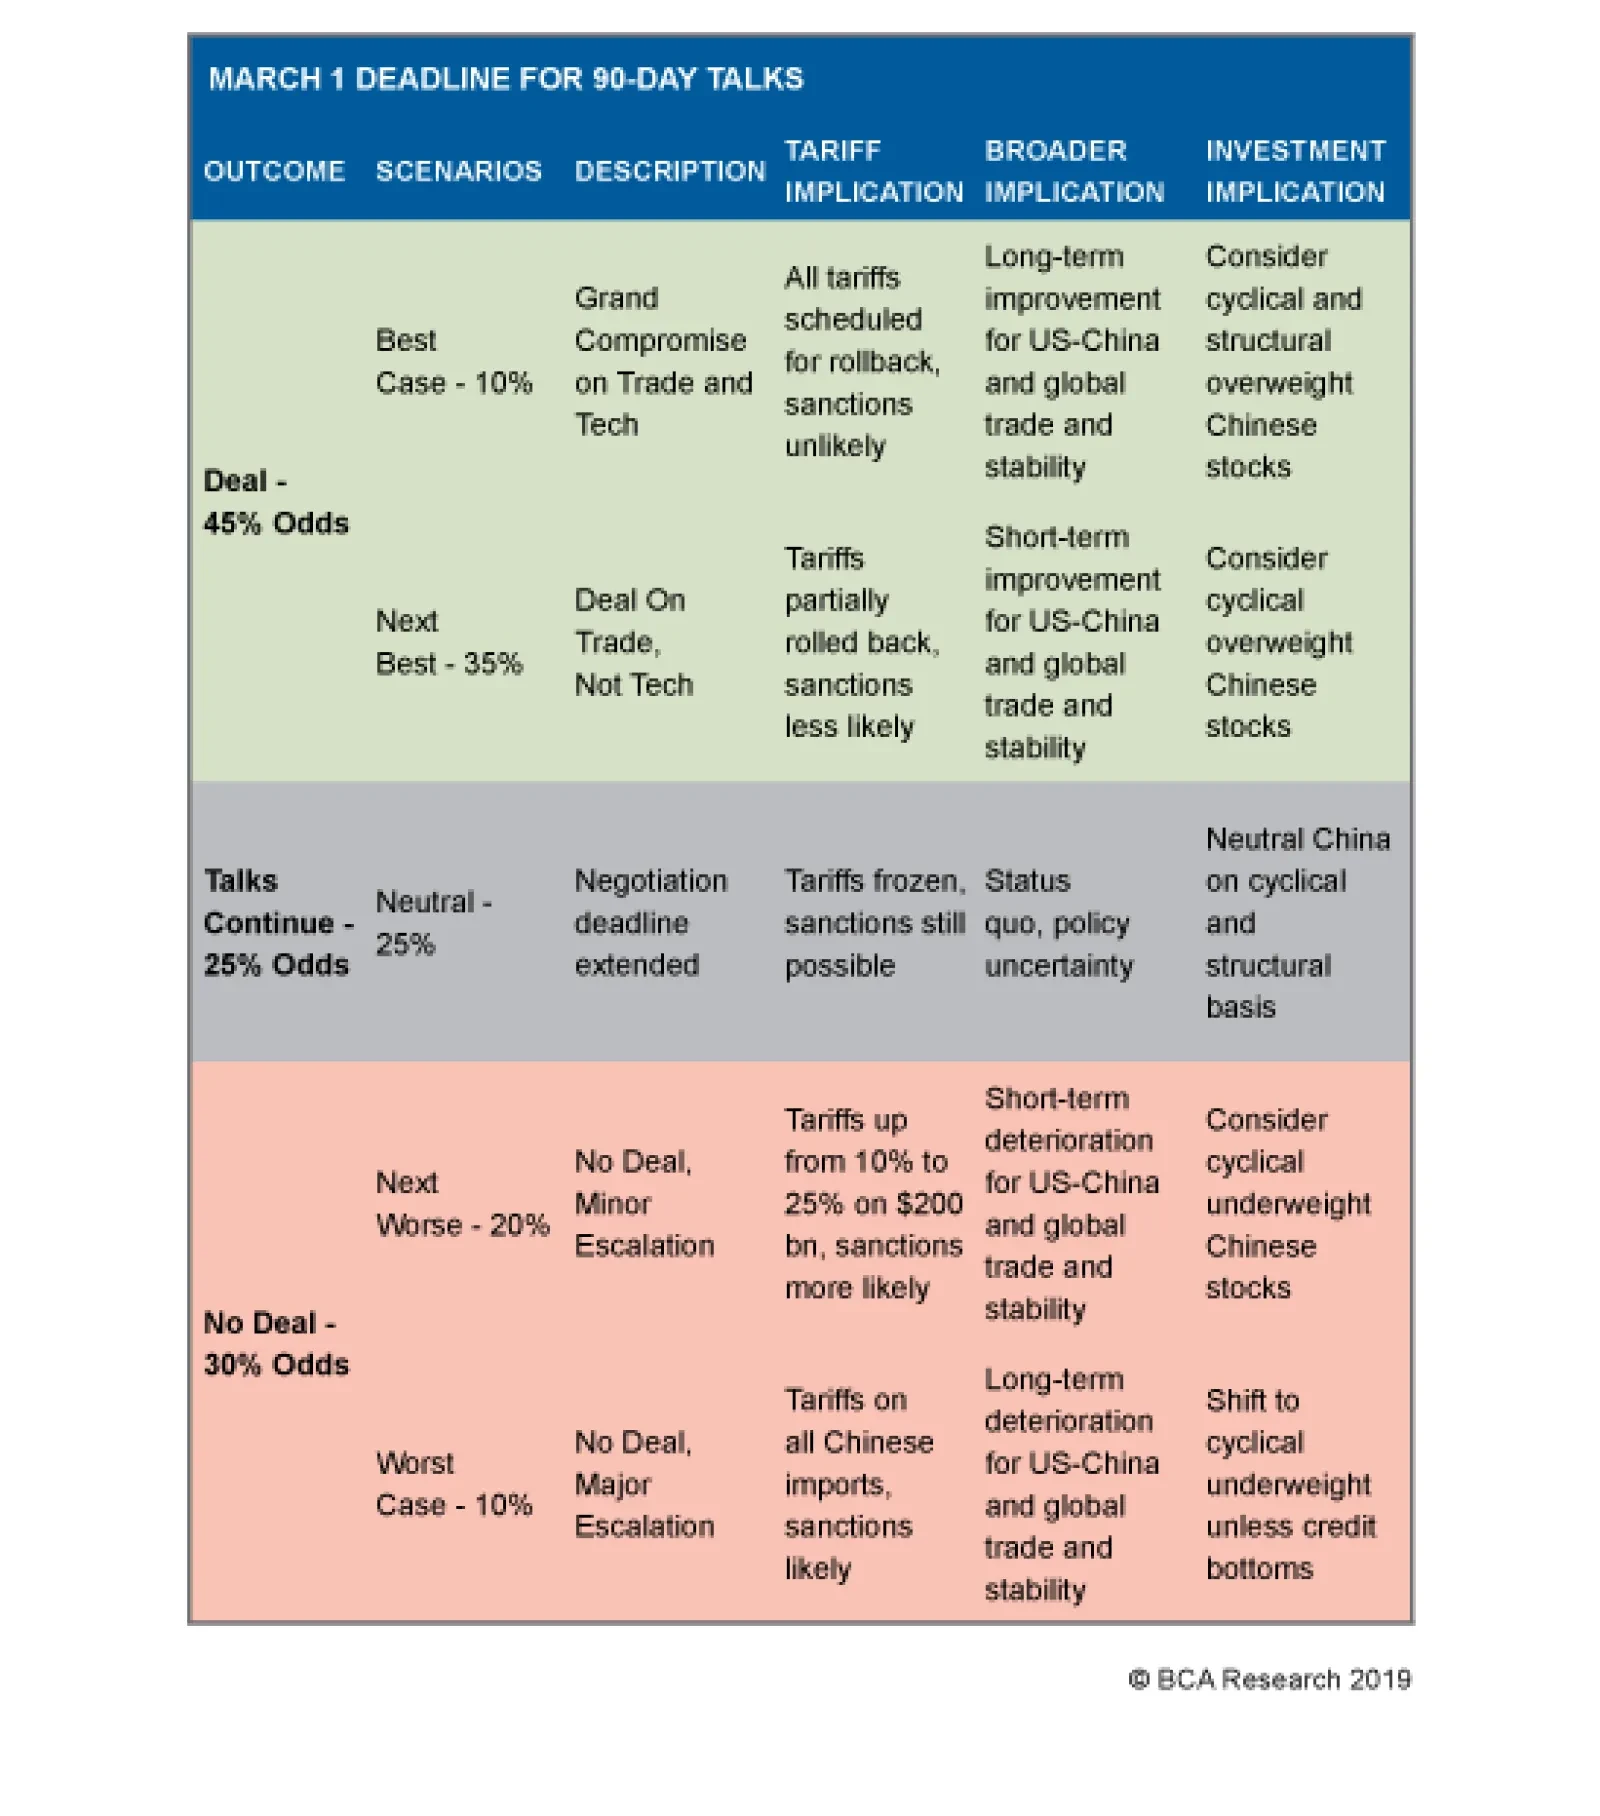
As a result of the policy easing that is taking place, our Global Investment Strategy expects Chinese growth to stabilize and global growth to recover after H1.2 Bottom Line: The clear implication is that the Xi administration remains disciplined in its use of macroeconomic tools to ease fiscal and monetary conditions. We have not yet seen a “whatever it takes” moment. Nevertheless, the accumulation of easing measures suggests that the economy could stabilize by mid-year. A Sign Of Progress In The Trade Talks The most likely basis for a “whatever it takes” moment is either a sudden and sharp deterioration in the economy despite the various easing measures, or a renewed escalation of the trade war. For the moment we will assume that the economy will respond to stimulus measures, albeit with a lag, which would be conducive to a bottoming in mid-2019. In this case, what is the likelihood that the trade war will escalate again, with President Trump increasing the Section 301 tariffs from their current level of 10% on $200 billion worth of imports? We maintain that the odds of the two sides agreeing to a framework trade deal by the March 1 negotiation deadline are about 45%. We upgraded the odds of a deal in December given the tariff ceasefire reached on December 1. Since then the news flow has generally suggested that the two sides are making progress in the 90-day talks: a US delegation in Beijing went into an extra day of talks, and was attended by Vice Premier Liu He, the top economics adviser of President Xi Jinping. However, given the difficulty of the negotiations – the thorny issues like forced tech transfer – we also give 25% odds to an extension of negotiations, prolonging the tariff ceasefire beyond March 1. This adds up to a 70% chance that tariffs will not increase this year. The remaining 30% is the chance that the trade war escalates again (Table 1). Table 1Updated Trade War Probabilities
Is China Already Isolated?
Is China Already Isolated?
The key question going forward: How pragmatic are Donald Trump and Xi Jinping? We have evidence that President Trump is pragmatic. He rapidly shifted his approach to Iran, by issuing the waivers on oil sanctions in November, and to China, by agreeing to the tariff ceasefire. He softened his stance to avoid an oil price shock and equity bear market in Q4 last year. Equity bear markets tend to coincide with recessions (Chart 10). And a recession would dramatically reduce Trump’s chances of reelection in November 2020 (Chart 11). Hence Trump is pushing for a short-term trade deal. He is now reportedly even considering a rollback of some tariffs in return for Chinese concessions.3
Chart 10
Chart 11… And Presidents Lose Reelection Amid Recession
...And Presidents Lose Reelection Amid Recession
...And Presidents Lose Reelection Amid Recession
What about Xi? We have argued that Xi is somewhat pragmatic – at least, more so than the consensus holds. It is undeniable that Xi is a hardliner who has reasserted his personal control, and Communist Party dominance, to a degree not seen in recent memory. He is also aggressive on foreign policy, unlike his predecessors. These trends are deeply concerning both for China’s governance and for relations with the West. They help to support our view that US-China relations are worsening on a secular basis. Nevertheless, as things currently stand, the weak domestic economy and negative sentiment seem to be encouraging Xi to play for time – which is, after all, the traditional Chinese play in trade tensions with the United States. His administration has offered a handful of concessions – on soybeans, auto tariffs, and goods imports – in order to push the negotiations along. The most important potential concession, however, is the new draft law on foreign investment. This is the one concession so far that addresses the US’s structural demands on technology transfer and intellectual property (the grievances that motivate the tariffs). China has one of the most restrictive environments for foreign investment in the world (Chart 12) and this is one of the US’s chief complaints: both because of the inherent denial of market access and because FDI restrictions are used as leverage to extract technology.
Chart 12
The National People’s Congress released a new draft law on December 26, 2018, updating a draft law issued by the Ministry of Commerce in 2015 that was never passed.4 An extraordinary meeting of the Standing Committee occurred in January to speed this draft along. The law would ostensibly: Protect intellectual property rights of foreign firms; Prohibit forced technology transfers – including by replacing earlier laws that required companies to operate as “joint ventures,” often exposing them to forced tech transfer. Grant equal treatment to foreign-invested enterprises within China, compared to state-owned and state-controlled enterprises; Implement a negative investment list so that foreign investors could assume that they are free to invest in areas not explicitly proscribed; Allow foreign firms to raise funds, including through initial public offerings on China’s domestic equity market. This law confirms our view that the 90-day negotiation period is tied to the Trump administration’s emphasis on the implementation of any agreements: in early March, China’s National People’s Congress can enact new laws that will ostensibly address US concerns and thus put its concessions in ink. On paper this law would go some way in assuaging US and other foreign investor concerns. However, without a strong central government commitment to enforce the law, it is doubtful that it would reduce the trade and investment practices in China that offend the United States. After all, China’s methods of tech transfer and IP theft are mostly executive rather than legislative in nature – they stem from positive actions by central and local governments, and state-controlled companies, rather than from gaps or loopholes in the legal framework. Even taking the law at face value, its implementation – which is slated for a period of no fewer than five years – could be a mixed blessing for foreign investors.5 For instance, companies with a small foreign ownership stake will now be qualified as foreign-invested companies, which could bring difficulties if the new law is not implemented fairly or in good faith. Many foreign-invested enterprises would have to restructure their ownership and operations in order to fit into the new foreign investment framework (e.g. variable interest enterprises). While foreign enterprises are supposed to receive equal treatment even in government procurement, it is not clear whether they will in the quasi-government sector. Expropriation of foreign assets may still be justified very broadly. The law could also be used as a substitute for lifting the caps on foreign equity ownership in enterprises and for resolving problems with intellectual property licensing and payment of royalties. Moreover, the law is likely to enshrine a tougher regime for national security risk reviews. The US has tightened scrutiny of Chinese investments through the Foreign Investment Risk Review Modernization Act (FIRRMA) over the past year, and China may wish to toughen its own stance. Ultimately China does not need a law to strike down foreign investments that it believes jeopardize national security, but the law could provide justification for retaliation when the US strikes down Chinese investment on similar grounds. Nevertheless, in general, this law is an example of the kind of concession that is necessary for Trump to save face if he is determined to agree to a short-term framework trade deal to help prevent a bear market. Will the US accept this new law as a substantial concession, worthy of rolling back tariffs? So far the feedback is not encouraging. The chief US negotiator, Trade Representative Robert Lighthizer, has reportedly told Senator Chuck Grassley that China has not made any “structural” concessions yet – which suggests that Lighthizer is not impressed by the mere rubber-stamping of a new law.6 Much will depend on the next round of negotiations, dated January 30-31, when Vice Premier Liu He will come to DC for the first time since his humiliation in May last year. At that time he negotiated a deal and the US and China released a joint statement, only to have Trump renege on it three days later. He would not be going back to the US if there were not a substantial commitment on both sides to seek progress. Ultimately Trump, not Lighthizer, will determine whether to pause or roll back the tariff rates. Trump may decide he needs a deal and therefore accept the new law as a sufficient concession. He would still have the possibility of disputing its implementation (or lack thereof) at a later date – for instance, just before the 2020 election. The durability of any framework deal will be measured in the irreversibility of China’s concessions and the extent to which Trump moderates the tariffs. At least some rollback would seem necessary to reciprocate China’s concessions if a framework deal is to be done. The tariffs were imposed in separate tranches with adjustable rates, so Trump can reduce the tariffs in various ways. Bottom Line: There is room for a short-term, tactical trade deal that allows for some tariff rollback, given that China is tentatively making concessions on core US demands. Talks could also be extended, with tariff rates remaining at their current levels. These two possibilities mean that a hike in tariff rates is not the likeliest scenario for most of 2019. However, the new law on foreign investment only tentatively answers what the US is really demanding. We continue to believe that US-China relations are getting worse on a secular basis and that improvements will be tactical (or at best cyclical) in nature. Democrats Are Not Pro-China One of the main reasons for thinking that Xi may offer short-term concessions to get a deal with Trump is also one of the main reasons for thinking that long-term concessions are out of reach: there is an across-the-board policy consensus taking shape in Washington demanding tougher policy on China. We have emphasized that this policy consensus is apparent not only from Trump’s election – as an avowed protectionist and China-basher within the Republican Party – but also from the hardening position of the US defense establishment, and the disillusionment of the corporate lobby, over the past decade (Chart 13).
Chart 13
It is also a bipartisan consensus in Congress. For instance, last year, the House draft of the aforementioned FIRRMA Act, tightening foreign investment scrutiny on China, passed by a 398-vote margin in June. The final version passed by a large margin in the House (359-54) and Senate (87-10) in the form of the John S. McCain Defense Authorization Act. The Taiwan Travel Act and the Asia Reassurance Initiative Act, which offended Beijing, both passed with unanimous consent in the Senate (and voice vote in the House). Now the new Democrat majority in the House is confirming that tougher rules on China are something that everyone can agree on. For example, the new Chairman of the House Ways and Means Committee, Representative Richard Neal (D, MA), has struck a hawkish tone on the 90-day trade talks. He has warned that the US Trade Representative has “an obligation to look beyond the political pressures of the moment and the easy, one-off transactions, and secure real and lasting change to China’s anti-competitive behavior.”7 Furthermore, Senator Chris Van Hollen (D, MD) and Representative Ruben Gallego (D, AZ) have joined with Republicans Tom Cotton (R, AR) and Mike Gallagher (R, WI) to propose legislation that would give “the death penalty” to Chinese tech companies such as Huawei and ZTE if they violate US sanctions laws or export controls.8 This is an extremely aggressive piece of legislation that President Trump will have to contain if he is to keep a deal with President Xi. This bipartisan effort should come as no surprise. The Democrats were the more skeptical party about both global free trade and China in recent decades. This is because they positioned themselves as the defenders of workers, wages, and manufacturing, notably in the Midwestern Rustbelt States. Democrats have also always criticized China’s human rights record, with President Bill Clinton famously calling China’s leaders “the Butchers of Beijing” during the 1992 presidential campaign (Chart 14).
Chart 14
In the post-Cold War context, this protectionist strain was subdued as the free market consensus prevailed across the political spectrum. It was President Clinton who negotiated for China to enter the World Trade Organization – despite the opposition of many within his party, including current House Speaker Nancy Pelosi – in order to smooth the process of globalization underway. This context began to change after the Great Recession, as the US debt supercycle ended, China emerged as a major competitor, and the Barack Obama administration attempted to develop a Democrat response to new challenges. President Obama supported “Buy America” provisions in the crisis-era stimulus package and engaged in tit-for-tat tariffs with China. The Trans-Pacific Partnership (TPP) multilateral trade deal deliberately excluded China, particularly if it could not embrace the liberal reforms, and trade and cyber-security standards, included in the TPP’s provisions. Finally, President Obama and Secretary of State Hillary Clinton initiated the “Pivot to Asia,” an attempt to reduce US military commitments in the Middle East and reposition for a long-term strategic competition with China in the Asia Pacific. The Trump administration has continued the pivot to Asia in all but the TPP. Trump reportedly even considered naming Jim Webb, a Democratic former navy secretary and China hawk, as his new Secretary of Defense, to replace Secretary James Mattis. But the new policy consensus is best encapsulated by Mattis’s interim replacement, Pat Shanahan, who began his job as acting Defense Secretary this month by telling his staff to focus on “China, China, China.”9 Trump is now considering keeping Shanahan for a “long time.” Now, with Democrats coming back into power in the House, it is becoming even clearer that China faces hawkish trade policies from the Left as well as the Right. This has important implications. In the short term, this process suggests that President Xi may be incentivized to offer some concessions to President Trump, who wants to protect the business cycle and position himself as a successful dealmaker before 2020, rather than stonewalling and fueling the rise of the new anti-China consensus. In the long term, however, this process also suggests that Xi is unlikely to offer deep structural concessions, given that either Trump or a new Democratic administration could ultimately reject the terms of the deal. After all, if the stock market avoids a bear market and the economy strengthens, Trump could turn his back on the deal. In particular, the fired-up US economy is likely to widen the deficit, forcing Trump to give an explanation on the campaign trail (Chart 15).10 But if the economy goes into recession, Trump may have no other policy option to rally voters other than aggressive foreign policy – which could mean aggressive trade policy against China. Chart 15Trump Will Have To Explain This In 2020
Trump Will Have To Explain This In 2020
Trump Will Have To Explain This In 2020
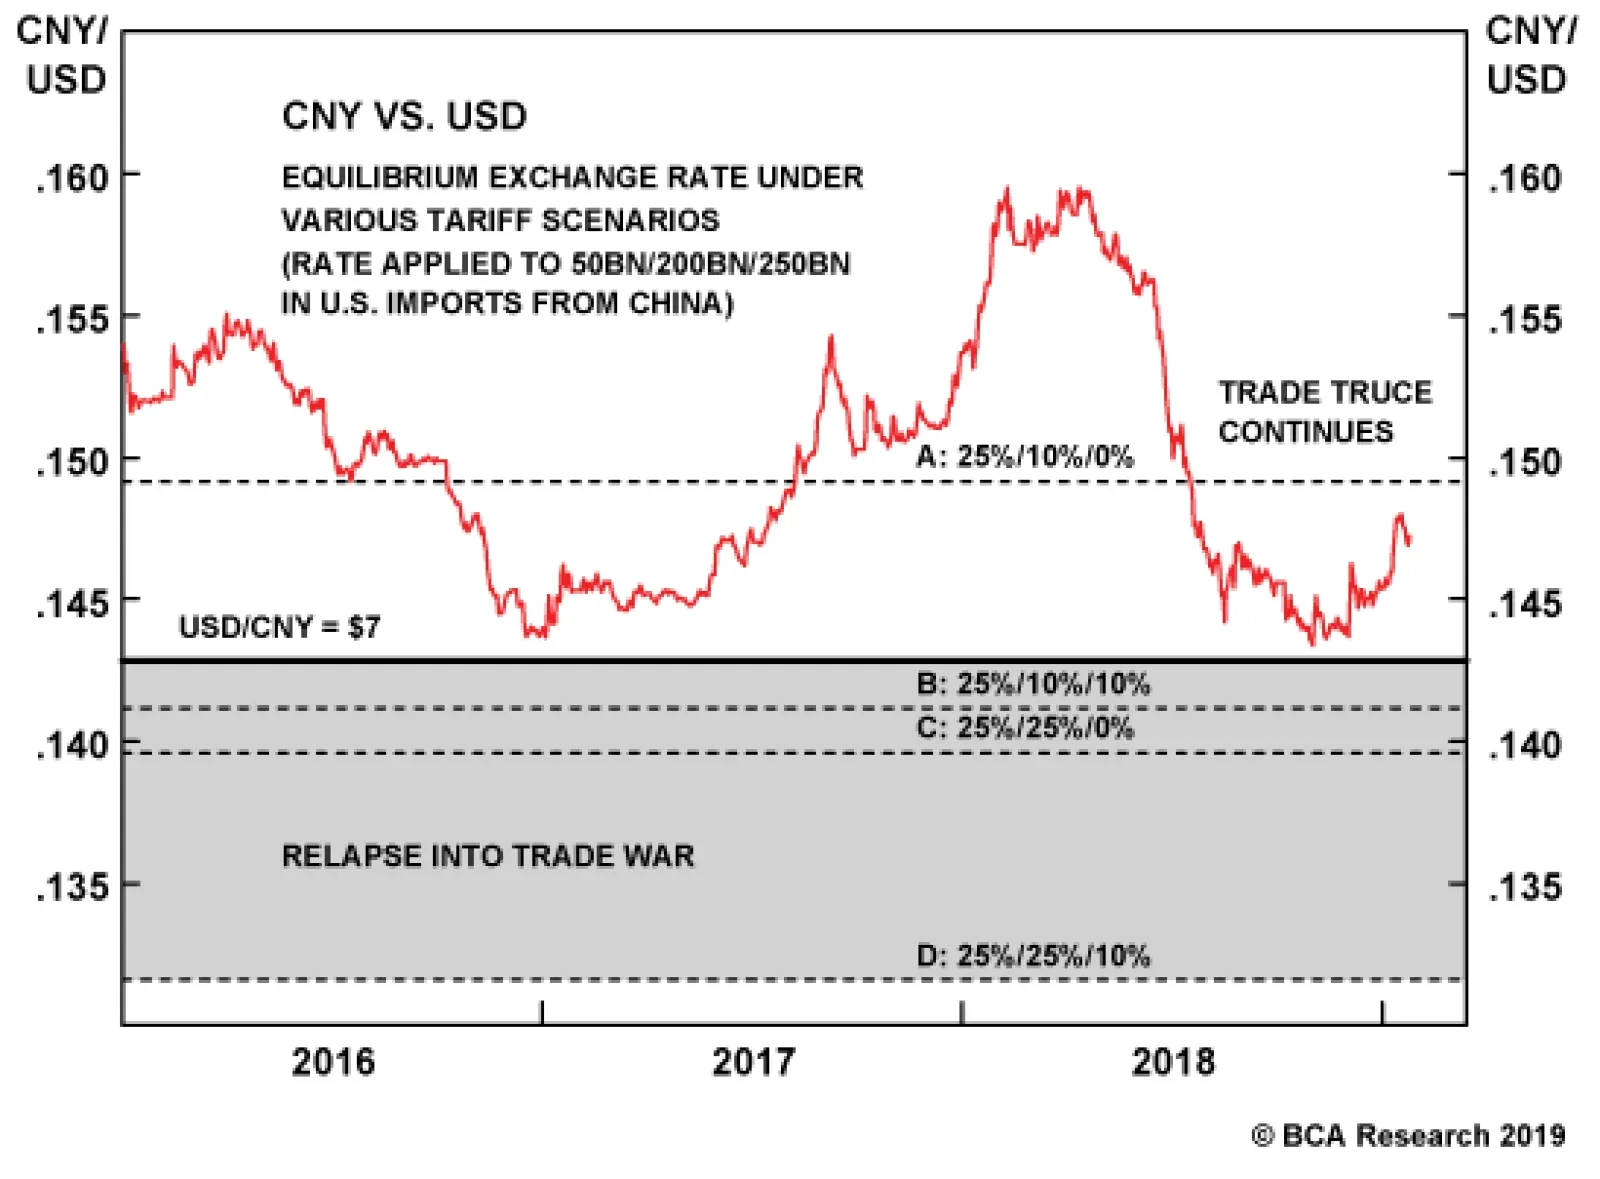
Subsequent to 2020, Trump will either have a renewed election mandate to pursue trade war – in which he is less vulnerable to recession timing – or a new Democratic administration will pick up where President Obama left off, with the Pivot to Asia … including the TPP and other multilateral initiatives. It is also entirely likely that the US and China could adhere to a framework trade deal and yet heighten their strategic standoff in other areas. First, the US is making progress in forming a coalition of nations against Huawei’s participation in 5G networks – China’s relations with Canada are deteriorating rapidly and now Germany, a critical swing player, is even considering a ban on Huawei.11 Second, Taiwan and the South China Sea could see more saber-rattling or incidents even as trade tensions stagnate. (North Korean diplomacy, by contrast, is continuing to progress as long as the US-China trade talks are progressing – Trump and Kim Jong Un are set to hold a second summit in late February.) Bottom Line: The “anti-China” turn in US policy is not limited to Trump. Rather, Trump was the catalyst for a new policy consensus that was already emerging in the Obama years. Democrats will likely take a tough stance on China trade, including pressuring Trump if he strikes a deal with Xi Jinping, in order to woo voters in the Midwest. Any future Democratic White House should be expected to continue pressing China on issues ranging from national security to cyber-security to human rights, while likely pursuing a more multilateral diplomatic approach than the current White House. Investment Implications BCA’s Geopolitical Strategy is tactically overweight Chinese equities ex-tech relative to emerging markets. We are closing our short China-exposed US companies relative to the S&P 500 for a gain of 1.7%. Meanwhile China Investment Strategy is tactically overweight Chinese equities relative to the MSCI World index. Tariffs remaining at their current level now appears to be the most likely scenario for this year. Holding all else constant, this scenario is positive for Chinese growth and China-related assets. But beyond a near-term pop for financial markets, we still need to see hard evidence that the accumulation of China’s easing measures will indeed stabilize its domestic economy. This suggests that it is too soon to give the “all clear” sign from a cyclical perspective. On the other hand, a verified failure of the current, substantive US-China attempt to negotiate a truce would have a deeper negative impact on sentiment and trade than the original outbreak of trade war in 2018, as there will no longer be a basis for optimism. The market will have to price an ultimate 25% tariff on $500 billion worth of goods. This will likely cause the CNY-USD exchange rate to plummet (Chart 16). This would, at least at first, send a deflationary impact across emerging markets and the world, causing another negative hit to global trade and hence a flight to quality. Chart 16A Trade War Escalation Will Send The Yuan Reeling
A Trade War Escalation Will Send The Yuan Reeling
A Trade War Escalation Will Send The Yuan Reeling
The PBoC would most likely have to stage a defense of the currency while the State Council, judging by its actions in July 2018, would likely launch a large stimulus package of the sort that it has thus far avoided for fear of credit excesses. This would come at the cost of a still larger debt burden and misallocation of capital – undoing overnight the work that President Xi has put into mitigating these structural imbalances – but it would prevent a precipitous slowdown for the time being. A trade war-induced stimulus would ostensibly help reaccelerate the Chinese economy and global growth, but in our view financial markets would not respond all that happily to such a huge dose of volatility, trade uncertainty, and policy uncertainty at a time when the cycle will be very late anyway. The risk premium would go up sharply, at least for a time, raising the odds of a very sizeable earnings contraction before the economy begins to recover. Matt Gertken, Vice President Geopolitical Strategy mattg@bcaresearch.com Footnotes 1 Please see BCA Emerging Markets Strategy Weekly Report, “Dissecting China’s Stimulus,” January 17, 2019, available at www.bcaresearch.com. 2 Please see BCA Global Investment Strategy Weekly Report, “Patient Jay,” January 18, 2019, and “Low Odds Of An FCI Doom Loop,” January 4, 2019, available at www.bcaresearch.com. 3 Please see Steve Holland, Tom Brown, and Leslie Adler, “Trump says deal ‘could very well happen’ with China,” Reuters, January 19, 2019, available at af.reuters.com. 4 Please see “Foreign Investment Law of the People’s Republic of China (Draft) for comments,” National People’s Congress of the People’s Republic of China, December 26, 2018, available at www.npc.gov.cn. See also “Public Comments Sought on the Foreign Investment Law of the People’s Republic of China,” Ministry of Commerce, January 19, 2015, available at www.troutman.com. 5 Please see Lester Ross, Kenneth Zhou, and Tingting Liu, “China Rolls Out New Draft Foreign Investment Law,” January 10, 2019, available at www.wilmerhale.com. See also Manuel Torres and Diego D’Alma, “China Publishes New Draft Of Foreign Investment Law,” Garrigues, Commentary: Corporate China, January 17, 2019, available at www.garrigues.com. 6 Please see Humeyra Pamuk, “U.S. trade chief saw no progress on key issues in China talks: Senator,” Reuters, January 15, 2019, available at www.reuters.com. 7 Please see James Politi, “Washington’s China hawks fear Trump will yield in trade war,” Financial Times, January 12, 2019, available at www.ft.com. 8 Please see Diane Bartz and Christian Shepherd, “U.S. legislation steps up pressure on Huawei and ZTE, China calls it ‘hysteria,’” Reuters, January 16, 2019, available at ca.reuters.com. Note that Democrats have also joined proposals “to condemn gross human rights violations of ethnic Turkic Muslims in Xinjiang” and to restore Taiwan’s observer status in the World Health Organization in the first month of the congressional session. 9 Please see Robert Burns, “New Pentagon leader Shanahan says he is focusing on China,” Associated Press, January 2, 2019, available at www.pbs.org. 10 Please see BCA Global Investment Strategy Weekly Report, “The Next U.S. Recession: Waiting For Godot?” dated October 5, 2018, available at www.bcaresearch.com. 11 Please see Elizabeth Schulze, “Huawei could be banned from 5G in Germany,” CNBC, January 18, 2019, available at www.cnbc.com.
In recent days, China has provided investors plenty of data to chew on. This morning’s GDP report only confirmed what we already knew: namely, growth has hit a nadir not seen in decades. However, there were also hopeful signs. December retail sales grew at…
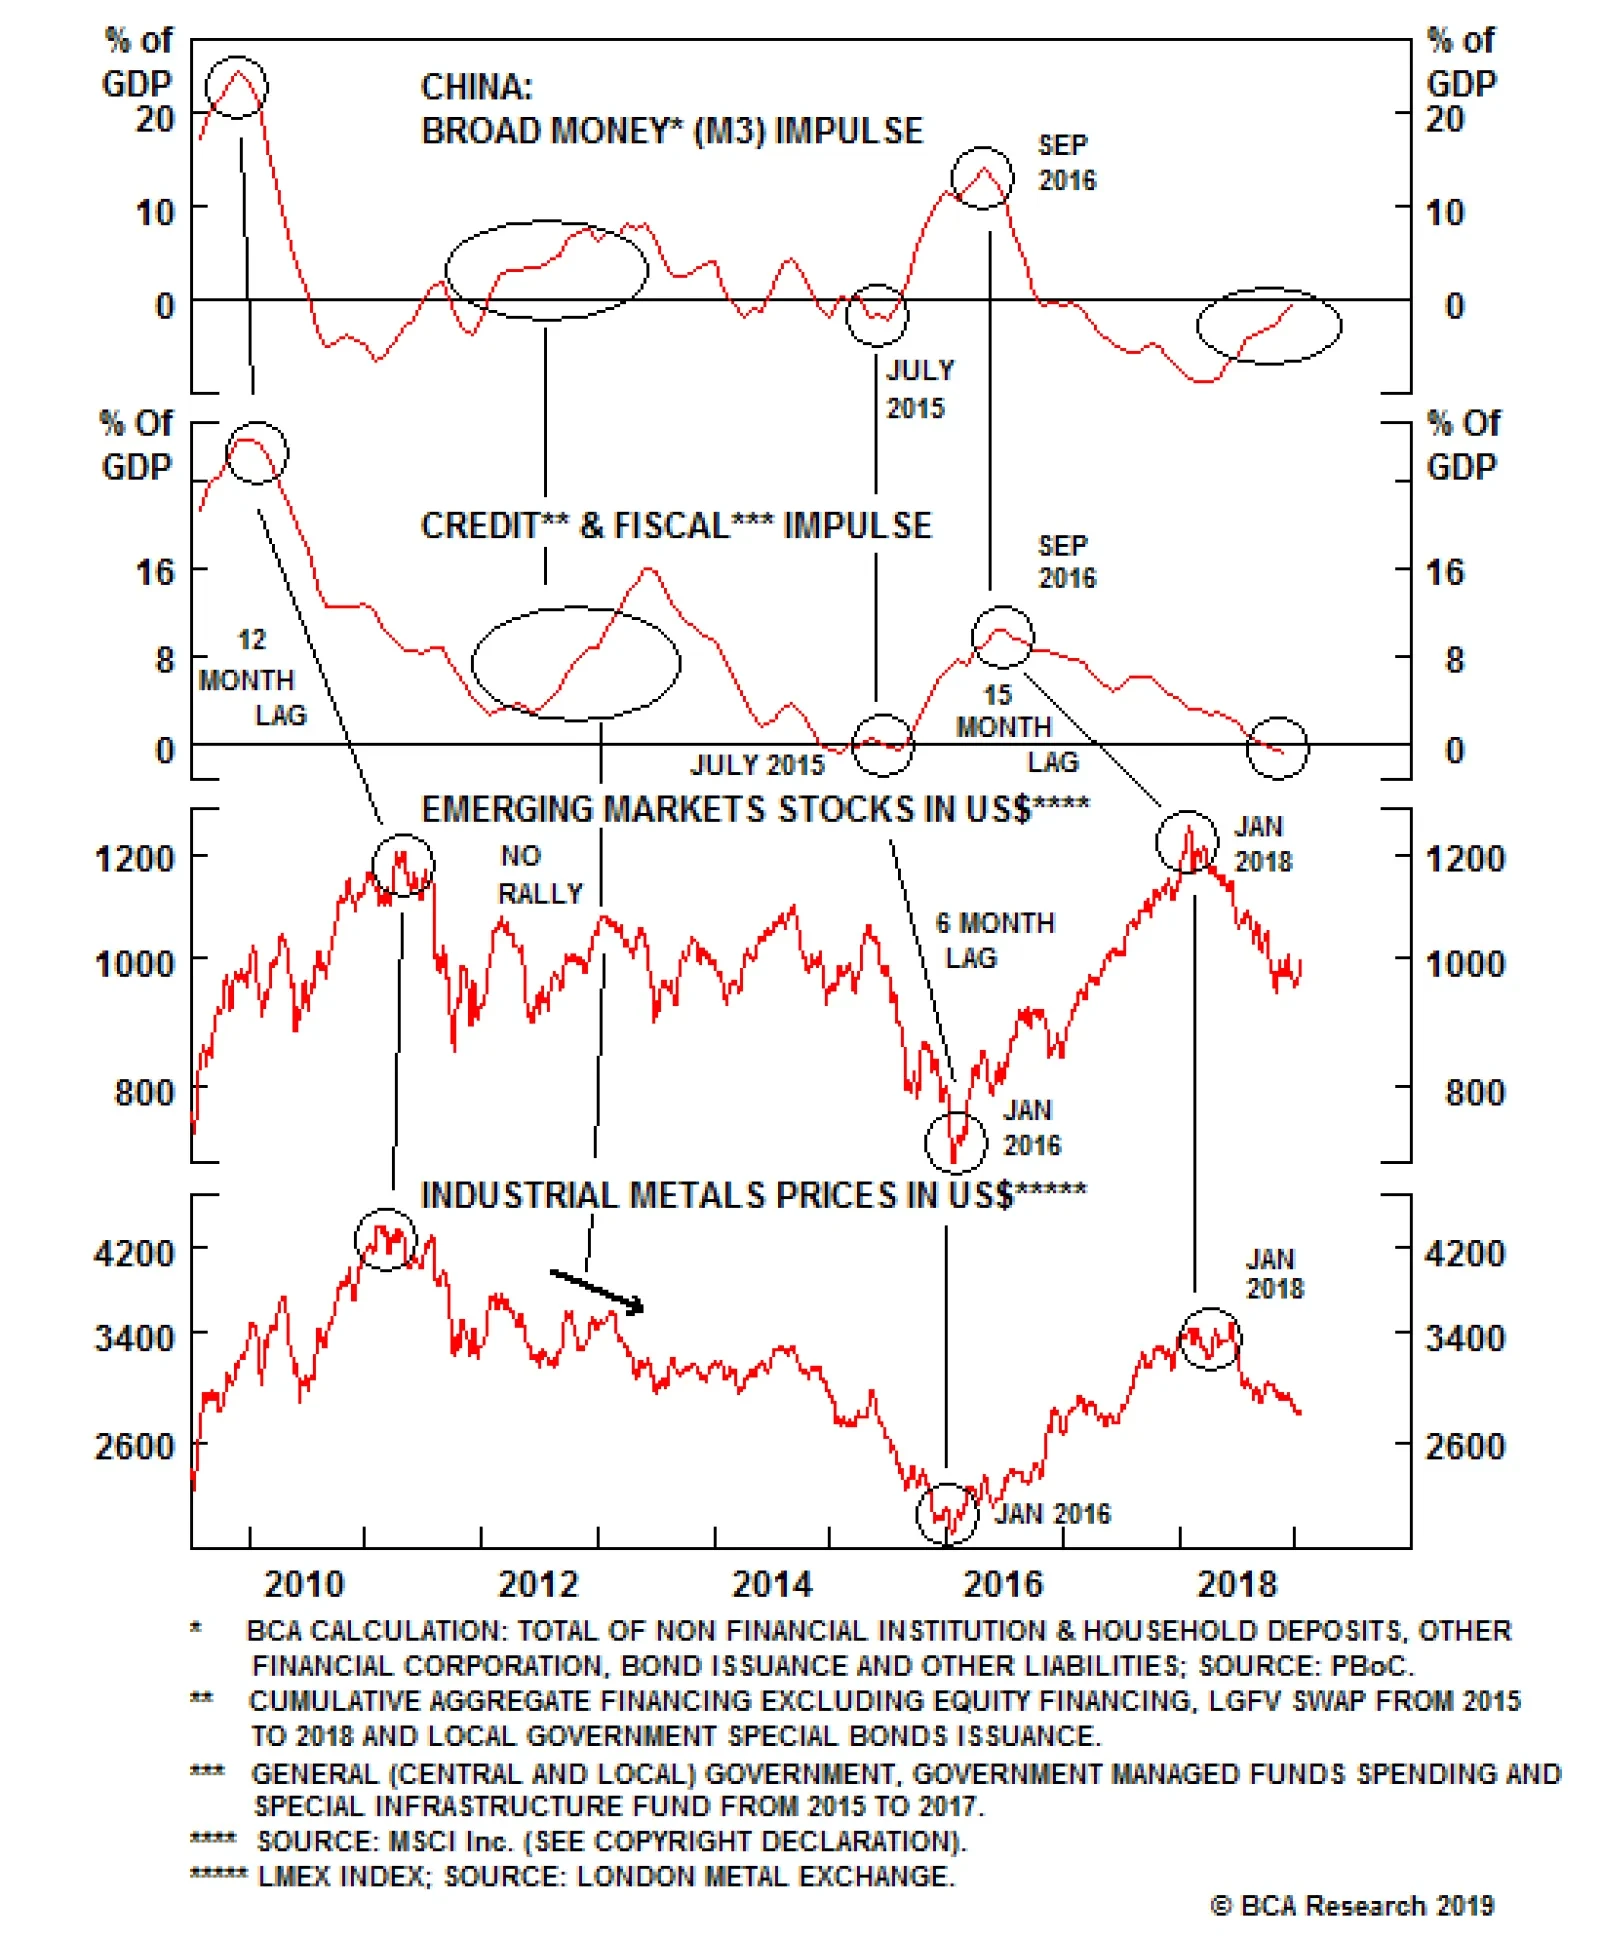
The chart illustrates that the credit and fiscal spending impulse (CFI) has not yet bottomed – i.e., it has not confirmed the upturn in the money impulse. In July 2015, the money impulse as well as the CFI bottomed, preceding the trough in EM and commodity…