China
The central government has so far abstained from stimulating the property market due to already existing speculative excesses there. This is very different from the policy easing that took place in 2008-‘09, 2012 and 2015-’16, when the authorities boosted…

Highlights The U.S. economy is slowing in a completely predictable manner. With inflationary pressures largely dormant, the Fed can afford to stay on hold for the next few FOMC meetings. Growth in the U.S. and the rest of the world should stabilize by mid-year. This will enable the Fed to resume raising rates in June. A bearish stance towards U.S. Treasurys is warranted over a 12-month horizon. As long as the Fed is hiking rates in response to above-trend GDP growth rather than accelerating inflation, risk assets will fare well. Investors should overweight global equities and spread product for now, but monitor inflation trends closely for signs of when to get out. Brexit fears are overdone. Stay long the pound versus the euro. We were stopped out of our short AUD/JPY trade for a gain of 10%. Feature A Predictable Slowdown Investors are misunderstanding the nature of the current slowdown in the United States and much of the world. Completely predictable slowdowns, such as this one, rarely morph into recessions. Real U.S. GDP rose at a blistering 3.8% average annualized pace in Q2 and Q3 of 2018. There is no way that sort of growth rate could have been sustained. Financial conditions also tightened sharply in Q4, which has inevitably weighed on growth. Given the stock market rout, it is actually surprising that the economy has not weakened more than it has. The New York Fed GDP Nowcast points to growth of 2.5% in Q4 of 2018 and 2.1% in Q1 of 2019. This is still above the Fed’s long-term estimate of potential GDP growth of 1.9%. Most of the slowdown has been concentrated in the manufacturing sector, but even there, the bloodletting may be ending. The latest Philadelphia Fed survey — arguably the most important of the regional Fed manufacturing reports — showed an uptick in activity, with the new orders component hitting the highest level since last July. Despite the tightening in financial conditions, bank lending to the business sector has accelerated over the past three months (Chart 1). The Conference Board’s Leading Credit Index remains in expansionary territory (Chart 2). While business capex intention surveys have come off their highs, they still point to robust spending plans over the next few quarters (Chart 3). Chart 1Credit Is Still Flowing To U.S. Businesses
Credit Is Still Flowing To U.S. Businesses
Credit Is Still Flowing To U.S. Businesses
Chart 2Little Sign Of A Looming Credit Crunch
Little Sign Of A Looming Credit Crunch
Little Sign Of A Looming Credit Crunch
Chart 3Capex Plans Still Solid
Capex Plans Still Solid
Capex Plans Still Solid
The labor market remains healthy, as evidenced by ongoing strong payroll growth and low initial unemployment claims. Faster wage growth is boosting consumer spending. Holiday sales rose by 5.1% from a year earlier according to the Mastercard SpendingPulse report, the fastest growth in six years. The Redbook same-store index tells a similar story (Chart 4). Chart 4Same-Store Sales Are Robust
Same-Store Sales Are Robust
Same-Store Sales Are Robust
The housing market struggled for much of 2018, but the recent stabilization in mortgage rates should help matters (Chart 5). Notably, mortgage applications for purchase have surged to their highest levels since 2010 (Chart 6). Homebuilder confidence improved in January, mirroring the rally in homebuilder shares (Chart 7). We are long homebuilders versus the S&P 500, a trade that is up 5.3% since we recommended it on November 1, 2018. Chart 5aThe U.S. Housing Sector Will Stabilize (I)
The U.S. Housing Sector Will Stabilize (I)
The U.S. Housing Sector Will Stabilize (I)
Chart 5BThe U.S. Housing Sector Will Stabilize (II)
The U.S. Housing Sector Will Stabilize (II)
The U.S. Housing Sector Will Stabilize (II)
Chart 6A Positive Signal For U.S. Housing
A Positive Signal For U.S. Housing
A Positive Signal For U.S. Housing
Chart 7U.S. Homebuilder Stocks Have Been Outperforming Recently
U.S. Homebuilder Stocks Have Been Outperforming Recently
U.S. Homebuilder Stocks Have Been Outperforming Recently
U.S. Government Shutdown: A Near-Term Hit To Growth The government shutdown poses a near-term risk to the U.S. economy. If it lasts until the end of March, it will shave about 1.7% off Q1 GDP based on White House estimates. While this represents a potentially significant hit to the economy, the effect is likely to be completely reversed once the shutdown ends. Moreover, the drag to growth from the shutdown pales in comparison to the overall stance of fiscal policy. According to the IMF, the cyclically-adjusted budget deficit is set to reach 5.7% of GDP this year, up from 3.2% of GDP in 2015. There is also a reasonable chance that any deal to end the shutdown will involve a commitment to increase spending beyond currently budgeted levels. This would increase the overall amount of fiscal stimulus the economy is receiving. Taking The Pulse Of Global Growth The slowdown in growth has been deeper and more protracted outside the United States. Nevertheless, rays of sunshine are emerging. Our global Leading Economic Indicator diffusion index, which measures the proportion of countries with rising LEIs compared to those with falling LEIs, has bottomed. The diffusion index leads the global LEI by a few months (Chart 8). Chart 8The Uptick In The LEI Diffusion Index Suggests Global Growth Could Stabilize
The Uptick In The LEI Diffusion Index Suggests Global Growth Could Stabilize
The Uptick In The LEI Diffusion Index Suggests Global Growth Could Stabilize
As is increasingly the case, the fate of the Chinese economy will be critical in determining when global growth begins to reaccelerate. The latest Chinese activity data has been disappointing, with this week’s downright awful export figures being the latest example. That said, credit growth may be starting to stabilize, as evidenced by stronger-than-expected loan growth for December. With credit growth now running only slightly above nominal GDP growth, the need for the authorities to maintain their deleveraging campaign has diminished. In an encouraging sign, the Market-Based China Growth Indicator developed by our China Investment Strategy service has been moving higher (Chart 9). Chart 9Encouraging Sign For The Chinese Economy
Encouraging Sign For The Chinese Economy
Encouraging Sign For The Chinese Economy
A revival in Chinese growth would aid trade-sensitive economies such as Japan and Germany. The former saw a decline in economic momentum in the second half of 2018, exacerbated by typhoons and an earthquake in Hokkaido. With the consumption tax set to increase from 8% to 10% in October, the Bank of Japan will need to maintain its yield curve control regime at least until 2020. This could weigh on the yen. With that in mind, we tightened the stop on our short AUD/JPY trade two weeks ago and subsequently exited the position with a gain of 10%. The German economy has taken it on the chin recently. Real GDP contracted in the third quarter and barely grew in the fourth quarter. The economy should rebound in 2019 as external demand improves. The drag on growth from the decline in automobile assemblies following the introduction of new emission standards should also turn into a modest tailwind as production resumes. In addition, fiscal policy is set to turn more stimulative, while robust wage growth, lower oil prices, and rising home prices should support consumption. Elsewhere in Europe, the Italian economy should recover as bond yields come down from their highs and confidence improves following the resolution of the impasse with the EU over budget targets. The modest easing in Italy’s fiscal policy of about 0.5% of GDP in 2019 should also benefit growth. It is too early to quantify the effect on the French economy from the “yellow vest” protests. France is no stranger to protests of this sort, so our guess is that the impact on the economy will be minimal. President Macron’s pledge to loosen fiscal policy in hopes of placating the protestors should also support demand. Brexit: A “No Deal” Outcome Looks Less Likely The Brexit saga could end in one of three ways: 1) A “no deal” where the U.K. leaves the EU with no alternative in place; 2) A “soft Brexit” involving an agreement to form a permanent customs union or some sort of “Norway plus” arrangement; 3) A decision to reverse the results of the original referendum and stay in the EU. In thinking about which of these three outcomes is most likely, one should keep the following in mind: Any course of action that the U.K. takes must have the support of the British parliament. A no deal outcome does not have parliament’s support. Not even close. Thus, it will not happen. This leaves options 2 and 3. This publication has argued since the day after the Brexit vote that the European establishment, following the example of the Irish and Danish referendums over various EU treaties, will keep insisting on do-overs until it gets the result it wants. If one referendum is good, two is even better – it’s twice as much democracy! The betting markets seem to be coming around to our view. As we go to press, PredictIt shows a one-in-three chance that a new referendum will be called by March 31 (Chart 10). Polling trends suggest that if another referendum were held, the remain side would probably prevail (Chart 11).
Chart 10
Chart 10
Chart 11U.K.: A Change Of Heart?
U.K.: A Change Of Heart?
U.K.: A Change Of Heart?
In some sense though, it does not matter for investors whether the original referendum is reversed or a soft-Brexit deal is reached. Either outcome would be welcomed by markets. We continue to advocate buying GBP/EUR. My colleague Dhaval Joshi, BCA’s Chief European strategist, also recommends that equity investors purchase the FTSE 250 index, which comprises from the 101st to the 350th largest companies listed on the London Stock Exchange. Unlike its large-cap counterpart, the FTSE 100, the FTSE 250 index is more geared to what happens in the U.K. than in the rest of the world. Investment Conclusions Global inflation remains subdued, which gives central banks the luxury of taking a wait-and-see approach to tightening monetary policy. Growth in the U.S. and the rest of the world should stabilize by mid-year. This will enable the Fed to resume raising rates in June. Given that the market is no longer pricing in any Fed hikes, a bearish stance towards U.S. Treasurys is warranted over a 12-month horizon (Chart 12). Outside of Japan, bond yields will also rise in the major developed economies. Chart 12Treasurys Will Underperform If The Fed Hikes Rates By More Than Expected
Treasurys Will Underperform If The Fed Hikes Rates By More Than Expected
Treasurys Will Underperform If The Fed Hikes Rates By More Than Expected
We downgraded global equities in June as our leading indicators began to point to slower growth ahead, but upgraded them back to overweight after stocks plunged following the December FOMC meeting. The rally over the past three weeks has reversed deeply oversold conditions and our tactical MacroQuant model is once again flagging some near-term risk to stocks. Nevertheless, if the global economy avoids a recession this year, as we expect, equities should fare well over a 12-month horizon. The MSCI All-Country World index is trading at a modest 13.6-times forward earnings (Chart 13). Profit estimates have been revised down meaningfully, suggesting that the bar for upward earnings surprises is now quite low. Chart 13A Lot Of Bad News Already Discounted?
A Lot Of Bad News Already Discounted?
A Lot Of Bad News Already Discounted?
Risk assets can tolerate higher rates as long as tighter monetary policy is the result of stronger growth. What risk assets cannot withstand is a stagflationary environment where growth is slowing but the Fed is hiking rates in order to bring down inflation. That is not the situation today, but could be the situation next year. Bottom line: Investors should overweight global equities and spread product for now, but monitor inflation trends closely for signs of when to get out. Peter Berezin, Chief Global Strategist Global Investment Strategy peterb@bcaresearch.com Strategy & Market Trends MacroQuant Model And Current Subjective Scores
Chart 14
Tactical Trades Strategic Recommendations Closed Trades
Highlights Please note that country sections on Mexico and Colombia published below. The policy stimulus in China could produce a growth revival in the second half of 2019, but there are no signs of an imminent bottom in China’s growth over the next several months. The lack of policy support for real estate is the key difference between the current stimulus program and previous ones. Crucially, the property market holds the key to consumer and business sentiment and hence, their willingness to spend. Continue to overweight Mexico within EM currency, fixed-income and equity portfolios. Colombia warrants a neutral weighting. A new trade: bet on yield curve flattening. Feature China has been undertaking both fiscal and monetary stimulus since last summer. A key question among investors is: At what point will the cumulative effects of these efforts become sufficient to revive the mainland’s business cycle and produce a rally in China-related plays akin to 2016-’17? This report helps investors dissect China’s stimulus, and reviews the indicators that will likely help identify the turning point in the mainland’s business cycle, as well as in China-exposed financial markets. Chart I-1 conveys the main message: Our credit and fiscal spending impulse is still falling, indicating that the slump in the Chinese industrial sector will persist for now with negative ramifications for EM corporate profits and other segments of the global economy that are leveraged to China.
Chart I-1
Looking forward, odds are reasonably high that the credit and fiscal spending impulse will bottom sometime in the first half of 2019. Yet, a bottom in China-plays in global financial markets is likely be several months away from now and potential downside could still be substantial. Monetary Stimulus On the monetary policy front, there has been multifaceted easing: Several cuts to banks’ reserve requirement ratios (RRRs) have been implemented; Lower interest rates for SME borrowers and a reduction in funding costs for the banks that originate these loans; The use of preferential liquidity provisions to encourage banks to purchase bonds issued by private companies. Monetary easing in of itself is not a sufficient condition to produce an economic revival. There are two variables standing between easing liquidity/lower borrowing costs, on the one hand, and the performance of the economy on the other: The first one is the money multiplier, which is calculated as a ratio of broad money supply (or banks assets) to excess reserves. It measures the willingness of banks to expand their balance sheets at a given level of excess reserves, assuming there is loan demand. Chart I-2 shows that China’s money multiplier has risen substantially since 2008 but has recently rolled over. A further drop in the money multiplier could offset the positive effect of monetary easing. Chart I-2China: Money Multiplier Is Falling
China: Money Multiplier Is Falling
China: Money Multiplier Is Falling
In other words, the central bank is injecting more liquidity into the banking system and interbank rates are falling, but commercial banks may be unwilling or unable to originate more loans due to financial regulations, lack of loan demand or for other reasons. Notably, the growth rate of bank assets (including policy banks) remains lackluster, while non-bank (shadow) credit is decelerating (Chart I-3). Chart I-3China: Bank Credit And Non-Bank Credit
China: Bank Credit And Non-Bank Credit
China: Bank Credit And Non-Bank Credit
The second variable is the willingness of companies and households to spend. This is captured by our proxies for marginal propensity to spend by companies and consumers. Chart I-4 denotes that both propensity measures are dropping, signifying a diminishing willingness to spend among these two sectors. Chart I-4China: Diminishing Propensity To Spend By Consumers And Companies
China: Diminishing Propensity To Spend By Consumers And Companies
China: Diminishing Propensity To Spend By Consumers And Companies
If economic sentiment among businesses and households remains downbeat – which has been the case in China over the past six to nine months – their reduced expenditures could offset any positive impulse from increased credit origination. Economists think of nominal GDP (aggregate spending) as money supply times the velocity of money (Nominal GDP = Money Supply x Velocity of Money). New lending activity among banks increases money supply, while economic agents’ spending raises the velocity of money. If the velocity of money drops more than the rise in money supply, aggregate expenditure (nominal GDP growth) will decline. Chart I-5 illustrates that the velocity of money rose in 2017, supporting robust growth during this period, despite very lackluster money growth. The opposite phenomenon – a decline in the velocity of money offsetting faster money expansion – could be a risk to the positive view on Chinese growth in 2019. Chart I-5Velocity Of Money: Will It Resume Its Decline?
Velocity Of Money: Will It Resume Its Decline?
Velocity Of Money: Will It Resume Its Decline?
Bottom Line: There is so far no clear evidence that the credit cycle has bottomed. Besides, a bottom in the credit impulse is not in and of itself sufficient to herald an economic recovery. Fiscal Stimulus Unlike in previous easing episodes, policymakers this time around have prioritized fiscal over monetary stimulus because of the already high leverage. In the past six months or so, the government has announced the following fiscal measures: A reduction in the personal income tax rate; Subtraction of certain household expenses from taxable personal income; A reduction in taxes and fees paid by small businesses; A potential VAT cut. These measures will certainly have a positive impact on small businesses and consumer spending. This is why we do not foresee a deepening slump in consumer spending. Nevertheless, the tax reductions and other policies benefiting small businesses and households are unlikely to boost industrial output and construction in China. The latter two are crucial for global investors because many countries are leveraged to China’s industrial and construction activity. For the industrial part of the economy, the most pertinent stimulus measure announced so far has been the issuance of local government special bonds. These bonds are used for infrastructure/public welfare projects. Chart I-6A shows the growth rates of aggregate fiscal spending and its components, which are expenditures by central and local governments as well as by government managed funds (GMFs). GMF spending – a form of quasi-government (off-balance sheet) spending – has surged in recent years and now accounts for 8.5% of GDP, which is more than twice larger than central government spending (Chart I-6B). Chart I-6AChina: Fiscal Spending Annual Growth...
China: Fiscal Spending Annual Growth...
China: Fiscal Spending Annual Growth...
Chart I-6B…And As % Of Nominal GDP
chart 6b
...And As % Of Nominal GDP
...And As % Of Nominal GDP
Although the 2019 budget has not yet been released – it will be announced in March during the National People's Congress – there have been some announcements that we can use to gauge the potential fiscal spending impulse in 2019. On the positive side, Beijing has recently authorized local governments to begin issuing bonds in early 2019 before the overall budget is released in March. Local governments are sanctioned to issue RMB 810 trillion of special bonds, which is 60% of their 2018 quotas. This contrasts with the previous years' practice, when local governments only started to issue bonds in April after obtaining directives from Beijing. The earlier-than-usual quota authorization will allow local governments to issue bonds from the beginning of the year. There is no timeline as to when these bonds will be issued, but it is safe to assume that their issuance will occur in the first half of 2019. This, in turn, should boost infrastructure investments throughout 2019. On the negative side, government managed funds (GMFs) derive 85% of their revenues from land sales. Land sales are tumbling due to previous credit tightening and scarce access to financing among property developers. Chart I-7 demonstrates that land sales lag the credit cycle by nine months. As developers are no longer acquiring land, GMF revenues and spending are set to shrink over the next 12 months. This will, to a certain degree, offset the augmented special bonds issuance. Chart I-7China: Credit Leads Land Sales And Quasi-Fiscal Spending
China: Credit Leads Land Sales And Quasi-Fiscal Spending
China: Credit Leads Land Sales And Quasi-Fiscal Spending
We performed a simulation on what would be the aggregate fiscal impulse in 2019 using the following assumptions: Central and local government spending growth rates are held constant at 2018 levels. Local government special bond issuance is RMB 1.62 trillion. This is twice the recently authorized quota. Hence, our simulation assumes a 20% increase in local government special bond issuance in 2019 over 2018, respectively. GMF land revenues drop by 25% – a comparable drop in land sales occurred in 2015. Table I-1 reveals that using these assumptions, the fiscal spending impulse in 2019 will be 0.1% of GDP down from 4% in 2018 (Chart I-8, bottom panel).
Chart I-
Chart I-8China: Credit And Fiscal Spending Impulse
China: Credit And Fiscal Spending Impulse
China: Credit And Fiscal Spending Impulse
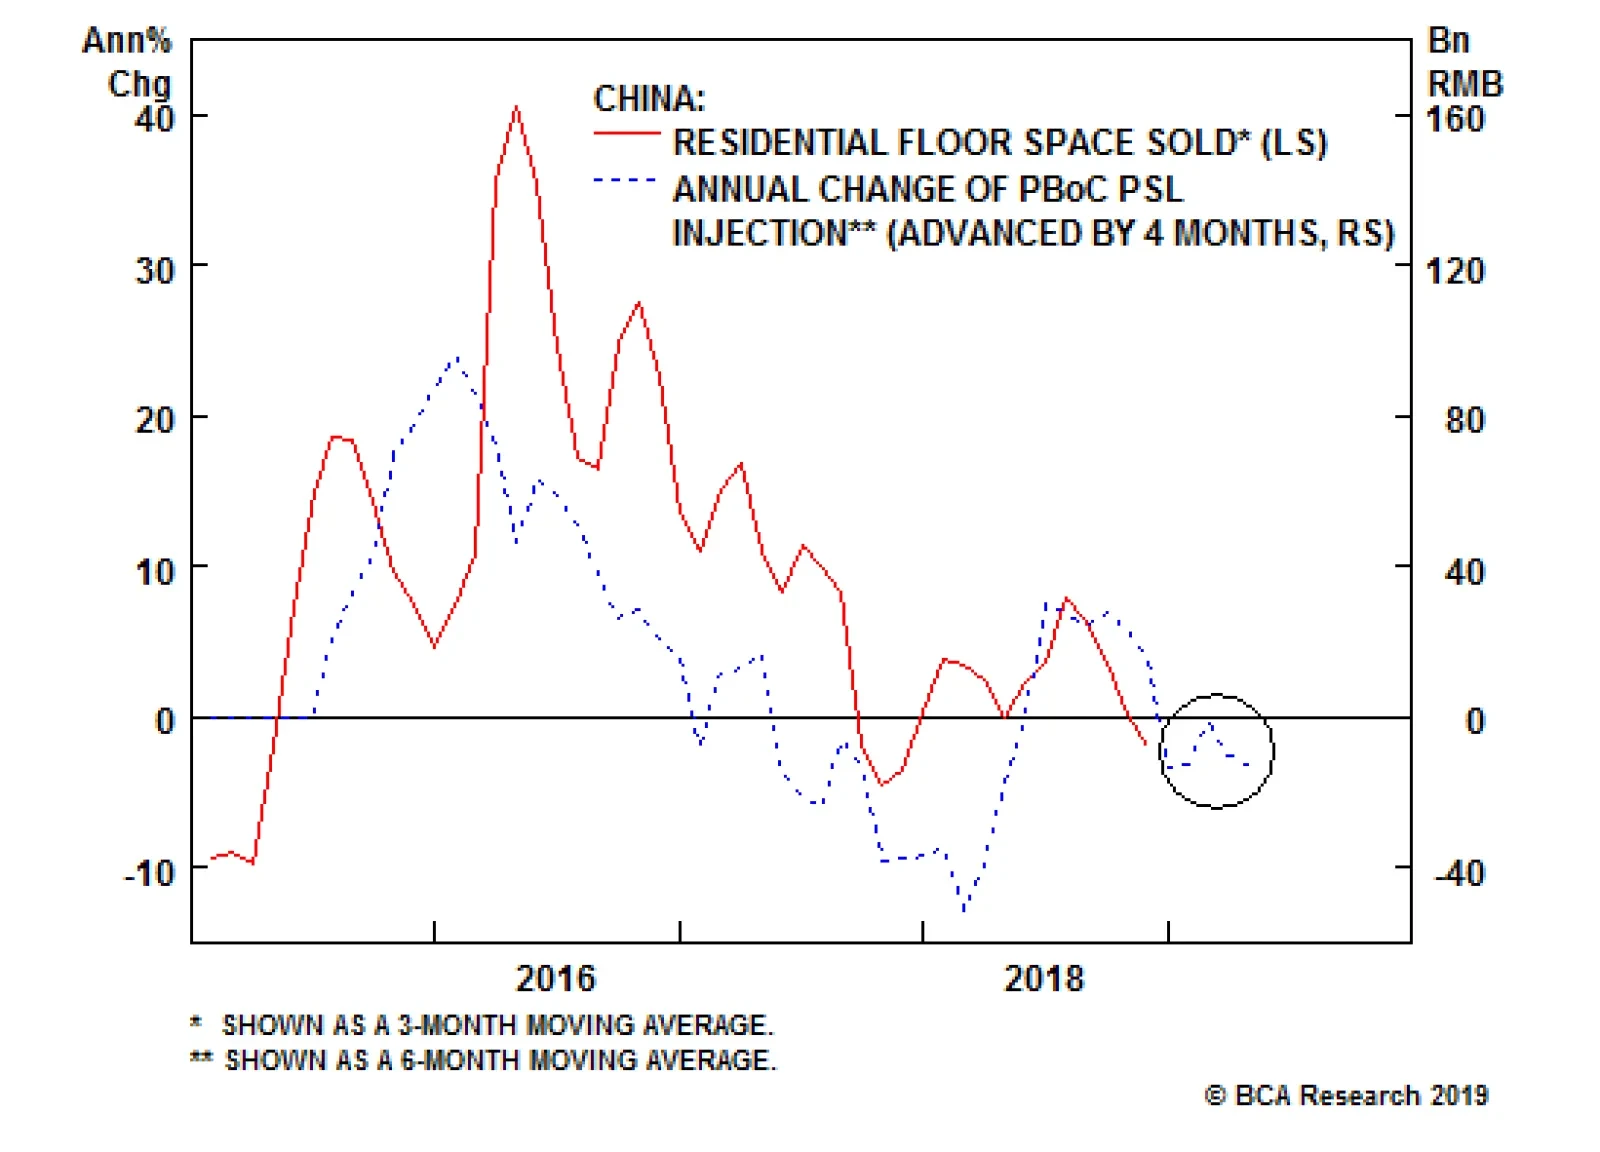
The next step is to combine this with our credit impulse forecast. We assume the 2019 year-end growth rate of credit to companies and households will be 9% in our pessimistic scenario, 10% in our baseline scenario and 11% in our optimistic scenario, compared with the December 2018 recorded rate of 10%. This entails no deleveraging at all. Under these assumptions, our forecasts for aggregate credit and fiscal impulses are 0.2% of GDP (pessimistic), 2.3% (baseline) and 4.4% (optimistic) (Table I-1). Presently, the credit and fiscal impulse is close to zero (Chart I-8). Bottom Line: China’s credit and fiscal spending impulse will bottom in the first half of 2019 (Chart I-8). However, this does not mean that EM/China plays have already bottomed and investors should chase the latest rebound in China-plays worldwide. We discuss the historical correlation between the credit and fiscal impulse and China-related financial markets below. What Is Different From Previous Stimulus Programs? The lack of stimulus targeting the real estate sector is the key difference between the current stimulus programs and those implemented in the past 10 years. The central government has so far abstained from stimulating the property market due to already existing speculative excesses there. This is very different from the policy easing that took place in 2008-‘09, 2012 and 2015-’16, when the authorities boosted property markets along with other sectors of the economy. Chart I-9 reveals that the 2015-‘17 residential property market revival and following boom was facilitated by the Pledged Supplementary Lending (PSL) program conducted by the People’s Bank of China (PBoC) – which was de-facto the outright monetarization of real estate by the central bank.1 The authorities have so far been reluctant to use this PSL program again, and the odds are that housing sales and new construction will continue to decline (Chart I-10). Chart I-9Residential Property Market Is Deteriorating
Residential Property Market Is Deteriorating
Residential Property Market Is Deteriorating
Chart I-10China: Construction Volumes Are Shrinking
China: Construction Volumes Are Shrinking
China: Construction Volumes Are Shrinking
Importantly, the property market holds the key to consumer and business sentiment and, hence, their willingness to spend. The latter is crucial to the growth outlook. Overall, a deepening slump in real estate demand and prices could dent consumer and small business confidence as well as their spending. Meanwhile, shrinking construction volumes will dampen industrial sectors (Chart I-10). Investment Implications: A Replay Of 2016-‘17? How does the credit and fiscal impulse relate to financial markets globally that are leveraged to the Chinese economy? The top two panels of Chart I-11 show our money impulse as well as credit and fiscal spending impulse (CFI), while the bottom two panels contain EM share prices and industrial metals prices. There are a few observations to be made: Chart I-11China: Money And Credit/Fiscal Impulses, EM Stocks And Metals Prices
China: Money And Credit/Fiscal Impulses, EM Stocks And Metals Prices
China: Money And Credit/Fiscal Impulses, EM Stocks And Metals Prices
First, the CFI has not yet bottomed – i.e., it has not confirmed the upturn in the money impulse. Second, as illustrated in this Chart, the bottoms in the money impulse as well as the CFI in July 2015 preceded the bottom in EM and commodities by six months, and their peaks led the top in financial markets - in January 2018 - by about 15 months. Besides, in 2012-‘13, the rise in both the money impulse and CFI did not do much to help EM stocks or industrial commodities prices. Third, the credit and fiscal impulse leads the global manufacturing PMI by several months as illustrated in Chart I-1 on page 1, as well as mainland’s capital goods imports (Chart I-12). Chart I-12China's Impact On Industrial Goods And Commodities
China's Impact On Industrial Goods And Commodities
China's Impact On Industrial Goods And Commodities
On the whole, investors should consider buying China-related plays only after both the money impulse and the CFI bottom together which has not yet occurred. Besides, even if these indicators rise in tandem, the bottom in China-related financial market plays could be a few months later because these impulses have historically led markets. This is why we believe a final down leg in EM and China-related plays still lies ahead. Typically, the last/capitulation phase in bear markets is considerable and being early can be very painful. Bottom Line: We continue to recommend underweighting/playing EM and China-related risk assets on the short side. Arthur Budaghyan, Senior Vice President Emerging Markets Strategy arthurb@bcaresearch.com Lin Xiang, Research Analyst linx@bcaresearch.com Mexico: Reiterating Our Overweight Stance Mexican financial markets have rebounded, outperforming their EM counterparts since mid-December. This outperformance has further upside because the AMLO administration is proving to be less populist and more pragmatic, especially relative to investors’ expectations. We are reiterating our recommendations to overweight Mexican markets, especially the currency, local fixed-income and sovereign credit, within respective EM portfolios due to the following considerations: The 2019 budget is a prime example of sensible rather than populist policies by the AMLO administration. The budget targets a primary surplus of 1% of GDP versus 0.8% of GDP in 2018 (Chart II-1). Notably, the 2019 budget envisages an absolute decline in nominal expenditures in 29 out of 56 categories. Chart II-1Fiscal Tightening In 2019
Fiscal Tightening In 2019
Fiscal Tightening In 2019
Such a restrained budget follows the conservative fiscal policy of the previous administration. In brief, the nation’s fiscal policy and public debt profile remain sound. Public spending will be increased mostly in the areas that are critical to boosting productivity. These include infrastructure spending, vocational training, promoting “financial deepening” and competition, eliminating graft and improving security. These efforts are critical to boosting business confidence, investment and ultimately productivity. On the revenue side, the budget has become much less reliant on oil revenues than before. The share of oil revenues in total government revenues historically hovered around 30%, but in 2018 it declined to 18%. The 2019 budget assumes an average oil price of $55 per barrel, a conservative projection. Investors have also been somewhat alarmed by the 16% hike in minimum wages, but this should be put into historical context. Chart II-2 illustrates that the minimum wage in real terms (deflated by consumer price inflation) dropped by 70% since its peak in 1976, before rising in the recent years. Chart II-2Historical Perspective On Minimum Wage
Historical Perspective On Minimum Wage
Historical Perspective On Minimum Wage
Importantly, Mexico’s competitiveness problem does not stem from high wages but from a lack of productivity gains. Productivity has been stagnant, and wages in real terms have not risen in many years. Hence, the true test for the nation is to raise productivity, not curb wages. Remarkably, the Mexican peso is very cheap, as measured by the real effective exchange rate based on unit labor costs (Chart II-3). Hence, the minimum wage hike can be viewed as payback after decades of dramatic declines in the minimum wage in real terms. Chart II-3The Mexican Peso Is Cheap
The Mexican Peso Is Cheap
The Mexican Peso Is Cheap
The central bank has overdone it with hiking interest rates: interest rates are currently among the highest of the mainstream EM economies, both in nominal and real terms (Chart II-4). Hence, local rates offer great value relative to other EMs (Chart II-4, bottom panel). Chart II-4High Real And Nominal Interest Rates
High Real And Nominal Interest Rates
High Real And Nominal Interest Rates
Tight fiscal and monetary policies will curb domestic demand and promote disinflation. Money and credit growth remain very sluggish (Chart II-5). This is negative for consumer and business spending, but positive for investors in local currency bonds. Chart II-5Monetary Growth Is Weak
Monetary Growth Is Weak
Monetary Growth Is Weak
The basis is that a retrenchment in domestic demand and thereby imports will help stabilize the trade balance amid low oil prices. Hence, this is on the margin a positive for the peso as well as for local currency bonds relative to their EM counterparts. Finally, Mexico will benefit from its ties to the U.S. economy, unlike many other EMs that are more exposed to China. Investment Recommendation We continue to recommend overweighting the peso and local currency bonds within an EM fixed-income portfolio. Currency traders should maintain our long MXN / short ZAR trade (Chart II-6, top two panels). Chart II-6Remain Overweight Mexican Currency And Fixed-Income
Remain Overweight Mexican Currency And Fixed-Income
Remain Overweight Mexican Currency And Fixed-Income
Credit market investors should continue to overweight Mexican sovereign credit within an EM credit portfolio (Chart II-6, bottom panel). Finally, we are also reiterating our long Mexico position within an EM equity portfolio. While domestic demand growth and corporate profits will continue to disappoint, the declining risk premium on Mexican assets due to a re-assessment among investors of AMLO’s policies warrants a mild overweight in large caps and a sizable overweight in small caps relative to their EM peers. Colombia: Headed Into Another Downtrend The Colombian economy is set to undergo another phase of growth retrenchment: The government is planning to reduce the overall fiscal deficit from 4.5% to 2.4% of GDP by the end of 2019 (Chart III-1). Oil-related revenues make up under 10% of total government revenues, and they are shrinking as both oil production and prices have plunged. Chart III-1Fiscal Policy Will Tighten In 2019
Fiscal Policy Will Tighten In 2019
Fiscal Policy Will Tighten In 2019
As a result, the government should undertake major fiscal cutbacks and hike taxes to achieve the overall budget deficit target of 2.4%. Such substantial fiscal tightening will hurt domestic demand. Regarding the exchange rate, the central bank is pursuing a “hands-off” approach, which is likely to continue. Therefore, the currency is set to depreciate due to the large current account deficit and lack of sufficient foreign funding. Notably, the current account deficit excluding oil is -7% of GDP (Chart III-2, top panel), and the plunge in oil prices and weak domestic demand will cause FDI inflows to drop meaningfully (Chart III-2, bottom panel). Together, this points to further currency depreciation. Chart III-2BoP Dynamics Are Deteriorating
BoP Dynamics Are Deteriorating
BoP Dynamics Are Deteriorating
Meanwhile, the central bank is not in a position to ease policy to offset the impact of fiscal tightening, as a weaker exchange rate historically leads to higher inflation (Chart III-3, top panel). In fact, given core inflation is at the upper end of the central bank’s target range (Chart III-3, bottom panel), a considerable currency depreciation could lead to rate hikes. Raising rates amid weakening growth is a recipe for considerable yield curve flattening. Chart III-3Weaker Currency = Higher Inflation
Weaker Currency = Higher Inflation
Weaker Currency = Higher Inflation
Lending rates remain well above nominal GDP growth, and the banking system is still restructuring following years of a credit boom. Credit growth will remain weak, reinforcing weakness in domestic demand stemming from substantial fiscal tightening. Finally, consumer and business confidence seem to be faltering due to the negative attention surrounding Colombian President Iván Duque Márquez’s policies. The negative terms-of-trade shocks and the imminent fiscal tightening will reinforce worsening sentiment among economic agents. Profound cyclical headwinds to growth indicate that the economy is set to return to a growth recession – a very low but slightly positive growth rate. With respect to investment strategy, we recommend the following: First, we are downgrading this bourse from overweight to neutral within an EM equity portfolio. While overweighting Latin American stocks as a whole within an EM equity portfolio, we believe that Brazilian, Chilean and Mexican share prices offer a better risk-reward profile than Colombian ones (Chart III-4). Chart III-4Colombia Is Unlikely To Outperform LATAM
Colombia Is Unlikely To Outperform LATAM
Colombia Is Unlikely To Outperform LATAM
Second, as to sovereign credit investors, we are reiterating an overweight stance because fiscal tightening and monetary policy orthodoxy as well as low government debt levels will help Colombian sovereign credit to outperform. Third, two opposing cross-currents will shape the domestic bond market. On the one hand, weak growth is positive for bonds. On the other hand, currency depreciation is negative. Net-net, investors in local currency government bonds should be slightly overweight or neutral this market within an EM local bond portfolio. For fixed-income investors, we recommend a new trade: position for yield curve flattening (Chart III-5). This is a bet on a considerable growth slowdown amid looming fiscal austerity. Chart III-5Colombia: Bet On Yield Curve Flattening
Colombia: Bet On Yield Curve Flattening
Colombia: Bet On Yield Curve Flattening
Andrija Vesic, Research Analyst andrijav@bcaresearch.com Footnotes 1 Please see Emerging Markets Strategy Special Report "China Real Estate: A Never-Bursting Bubble?" dated April 6, 2018, available on ems.bcaresearch.com Equity Recommendations Fixed-Income, Credit And Currency Recommendations
The Fed’s near-term capitulation on its rates-normalization policy highlighted by our fixed-income desks will provide a tailwind for EM oil demand this year by weakening the USD. This will reduce refined-products’ costs in local-currency terms ex-U.S., as it buoys EM growth prospects.1 If, as we expect, Chinese policymakers also deploy modest stimulus, global oil demand still will remain on track to grow 1.4mm b/d this year, per our forecast. We are mindful of potential upside surprises on the demand side, particularly, if, as we noted in our last balances update, the 100th anniversary of the Chinese Communist Party in 2021 provokes policymakers to deploy large-scale stimulus in 2H19 or 2020.2 The odds of this occurring before 2H19 are low, and we are not yet raising our demand estimates. A partial defusing of the Sino – U.S. trade war is possible, as the 90-day negotiating window agreed at the December G20 meeting starts to close next month. This could trigger a short-term rally in commodities, but, absent durable agreements on the technology front, this potential thawing will be transitory. Highlights Energy: Overweight. China’s crude oil imports surged 30% y/y in December 2018, which helped lift total 2018 imports by 10% vs. 2017 levels. This partly was the result of independent refiners scrambling to use up 2018 import quotas at year-end, so that they could retain those levels this year, according to S&P Global’s Platts.3 Base Metals: Neutral. China’s copper ore and concentrate imports were down 11.5% y/y in December – the largest y/y decline since May 2017 – in line with slowing growth there. Precious Metals: Neutral. We expect gold to continue to rally over the next 3 – 6 months on the back of a weaker USD in 1H19, as the Fed likely pauses on its rate-hiking schedule. Ags/Softs: Underweight. Grains likely will get a short-term price lift as the Fed dials back its rates-normalization policy. Feature For the moment, the Fed’s apparent capitulation on its rates-normalization policy reduces the risk the U.S. central bank will err on the side of being overly aggressive, which would have thrown a spanner into EM growth prospects this year. An easier Fed monetary policy will buoy EM GDP and weaken the USD over the short term, which will, support oil prices via stronger demand (Chart of the Week). Chart of the WeekEM GDP Growth On Track, Keeping Oil Demand Growth On Track
EM GDP Growth On Track, Keeping Oil Demand Growth On Track
EM GDP Growth On Track, Keeping Oil Demand Growth On Track
On the supply side, we remain convinced OPEC 2.0 is resolved to drain the global inventory overhang as quickly as possible. This unintended inventory accumulation resulted from OPEC 2.0’s production surge and the granting of waivers on U.S. export sanctions against Iran by the Trump administration in November (Chart 2). This conviction was strengthened earlier this week, following the announcement of a proposed earlier-than-expected meeting of the coalition’s market monitoring committee in Baku, Azerbaijan, in mid-March to assess global supply and demand conditions. This could be followed by a full OPEC 2.0 meeting in Vienna in mid-April, following up on their December meeting in Vienna, according to S&P Global Platts.4 Chart 2OPEC 2.0 Is Resolved To Drain Inventory Overhang
OPEC 2.0 Is Resolved To Drain Inventory Overhang
OPEC 2.0 Is Resolved To Drain Inventory Overhang
Pieces Of The Price Puzzle Falling Into Place The Fed is signaling it has put its rates normalization policy on hold, given indications global economic growth is slowing in a manner similar to what occurred in 2014 – 15. Then, the U.S. central bank was attempting to escape the zero lower bound of its monetary policy, following the end of its QE program. In the event, the Fed only raised rates once in December 2015, as the slowdown in growth stayed its hand. Our colleagues at BCA’s Global Fixed Income Strategy note, “the downturn in cyclical growth indicators like manufacturing purchasing managers indices (PMI) and the global leading economic indicator (LEI) … reached levels last seen after that 2014/15 episode” as 2019 unfolded (Chart 3).5 The slowdown in global growth could stabilize, as the LEI diffusion index suggests, but the Fed, at least for now, appears to be comfortable waiting for clear evidence this is the case. Chart 3Global Growth Slowdown Provokes Fed Restraint
Global Growth Slowdown Provokes Fed Restraint
Global Growth Slowdown Provokes Fed Restraint
In and of itself, the Fed’s near-term capitulation to the market will not be sufficient to reverse the “darkening prospects” foreseen by the World Bank in its most recent forecast, but it will be supportive of oil prices.6 On the back of our expectation the Fed will take a break from its rate-normalization, we are expecting a weaker USD over the short term, which will support oil demand and EM GDP growth. All else equal, this will create a tailwind for oil prices, given EM is the main driver of demand growth (Chart 4). Chart 4USD Near-Term Trajectory Will Support Oil Prices
USD Near-Term Trajectory Will Support Oil Prices
USD Near-Term Trajectory Will Support Oil Prices
The Chart of the Week introduces a new model we developed to understand the effect of EM GDP growth on oil prices. The level of EM demand is mean reverting to a linear trend, and anchors other variables – oil prices and FX rates, for example – that oscillate randomly with the arrival of new information to the market. Our modeling indicates Brent and WTI prices can be expected to increase (decrease) 94bp and 73bp for every 1 percent increase (decrease) in EM GDP, assuming the broad trade-weighted index (TWIB) for the USD remains unchanged. A 1 percent decrease (increase) in the USD TWIB (holding EM GDP constant) translates into an increase (decrease) in Brent and WTI prices of ~ 4.0% and 3.6%, respectively. We have found EM GDP levels to be as useful an explanatory variable for Brent and WTI prices as non-OECD oil consumption, our proxy for EM demand. Indeed, it is perhaps even cleaner, since using it directly in our models does not require us to estimate an income elasticity of demand for EM economies, in order to forecast prices.7 We are not raising our expectation for demand growth on the back of the Fed’s apparent moderation in its rates policy. We are keeping our 2019 demand growth estimate at 1.4mm b/d, with 1.0mm b/d of that coming from EM and the remainder from DM. Should the Fed signal a further pause in its rates-normalization policy – extending perhaps deep into 2H19 – we would be inclined to raise our demand-growth estimates. Additional Stimulus Coming From China? China is not the be-all and end-all of EM growth. All the same, next to the U.S., it is the second-largest consumer in the world, accounting for ~ 14% of the 103.75mm b/d of global demand we expect this year. Next in line is India, which accounts for ~ 5% of global demand. The news coming out of China at the moment is confusing. While the Xi administration prosecutes its “Three Tough Battles” – i.e., deleveraging, pollution and poverty – it also is pulling policy levers to counter the economic damage inflicted by its trade war with the U.S.8 Government policymakers are signaling fiscal and monetary stimulus will be forthcoming via tax cuts and bond issuance this year, to counter these headwinds.9 However, we do not expect a massive deployment of stimulus. More than likely, the big stimulative measures arrive in 2H19 or next year. The key target dates for policymakers are further in the future, and are focused on the upcoming 100th Anniversary of the Communist Party in 2021. By 2020, the Xi administration is targeting a doubling of real GDP vs. 2010 levels, and a doubling of rural and urban incomes (Chart 5). Chart 5China Keeping Powder Dry For 2021 "Centenary Goal"
China Keeping Powder Dry For 2021 "Centenary Goal"
China Keeping Powder Dry For 2021 "Centenary Goal"
So the real stimulus out of China likely comes later this year or next year. As our Geopolitical Strategy service notes: “If China launches a large-scale stimulus now, peak output will occur in 2020 and the economy will be decelerating into 2021. This would be bad timing for the centenary. It would make more sense for China to save some dry powder for 2019 or 2020 to ensure a positive economic backdrop in 2021.” There is, as we noted in our last balances update, a low-probability chance stimulus could surprise to the upside if growth – particularly employment – falls precipitously. For now, we are comfortable with our House view that the more extensive fiscal and monetary stimulus will be saved for later this year or next in the run-up to the Communist Party’s anniversary.10 Bottom Line: The Fed appears to have capitulated to markets in the short term, and likely will hold off on another rate hike in 1H19. All else equal, this will weaken the USD and buoy EM GDP over the short term. Together, these effects will keep oil demand on track to growth 1.4mm b/d, per our forecast. Markets are reacting to news of fiscal and monetary stimulus coming out of China. We have been expecting modest stimulus to be deployed this year, most likely in 2H19. We continue to expect a larger package of fiscal and monetary stimulus later in the year and next year in the run-up to the Communist Party’s 100th anniversary. Robert P. Ryan, Senior Vice President Commodity & Energy Strategy rryan@bcaresearch.com Hugo Bélanger, Senior Analyst Commodity & Energy Strategy HugoB@bcaresearch.com Footnotes 1 Please see “Enough With the Gloom: Upgrade Global Corporates On A Tactical Basis,” published January 15, 2019, by BCA Research’s Global Fixed Income Strategy. It is available at gfis.bcaresearch.com. See also “Buy Corporate Credit,” published by BCA’s U.S. Bond Strategy January 15, 2019. It is available at usbs.bcaresearch.com. 2 Please see “Oil Volatility Will Persist; 2019 Brent Forecast Lowered to $80/bbl,” published January 3, 2019, by BCA Research’s Commodity & Energy Strategy. It is available at ces.bcaresearch.com. 3 Please see “China’s 2018 crude oil imports rise 10% to 9.28 mil b/d,” published by S&P Global Platts January 14, 2019, online. 4 OPEC 2.0 ministerial meetings usually are held in May/June and again November/December. Please see “OPEC eyes mid-March monitoring committee meeting, mid-April full ministerial,” published by S&P Platts Global January 14, 2019. The cartel also will meet in early February to put the finishing touches on a charter formalizing the coalition. We will be delving deeper into the supply side next week, when we update our balances. 5 Please see footnote 1 above. 6 The World Bank’s most recent forecast can be found in its Global Economic Prospects, published January 8, 2019. The lead article is entitled “Darkening Skies.” 7 We use forecasts of EM GDP and GDP growth published by the World Bank and IMF in our modeling. This is useful for us for a number of reasons, particularly since it is calculated externally by well-regarded global institutions tasked with this function. Like other estimates and projections – e.g., the EIA’s, IEA’s and OPEC’s supply/demand estimates – we can take a view on these data relative to our House view or our own Commodity & Energy Strategy view. NB: Because these are cointegrated systems, regressions in levels is appropriate. 8 This campaign is discussed in depth in “China Sticks To The ‘Three Battles’,” published by BCA Research’s Geopolitical Strategy October 24, 2018. It is available at gps.bcaresearch.com. 9 Please see “China signals more stimulus as economic slowdown deepens,” published by uk.reuters.com January 15, 2019. 10 Please see footnote 2 above. Investment Views and Themes Recommendations Strategic Recommendations Tactical Trades TRADE RECOMMENDATION PERFORMANCE IN 4Q18
Image
Commodity Prices and Plays Reference Table Trades Closed in 2019 Summary of Trades Closed in 2018
Image
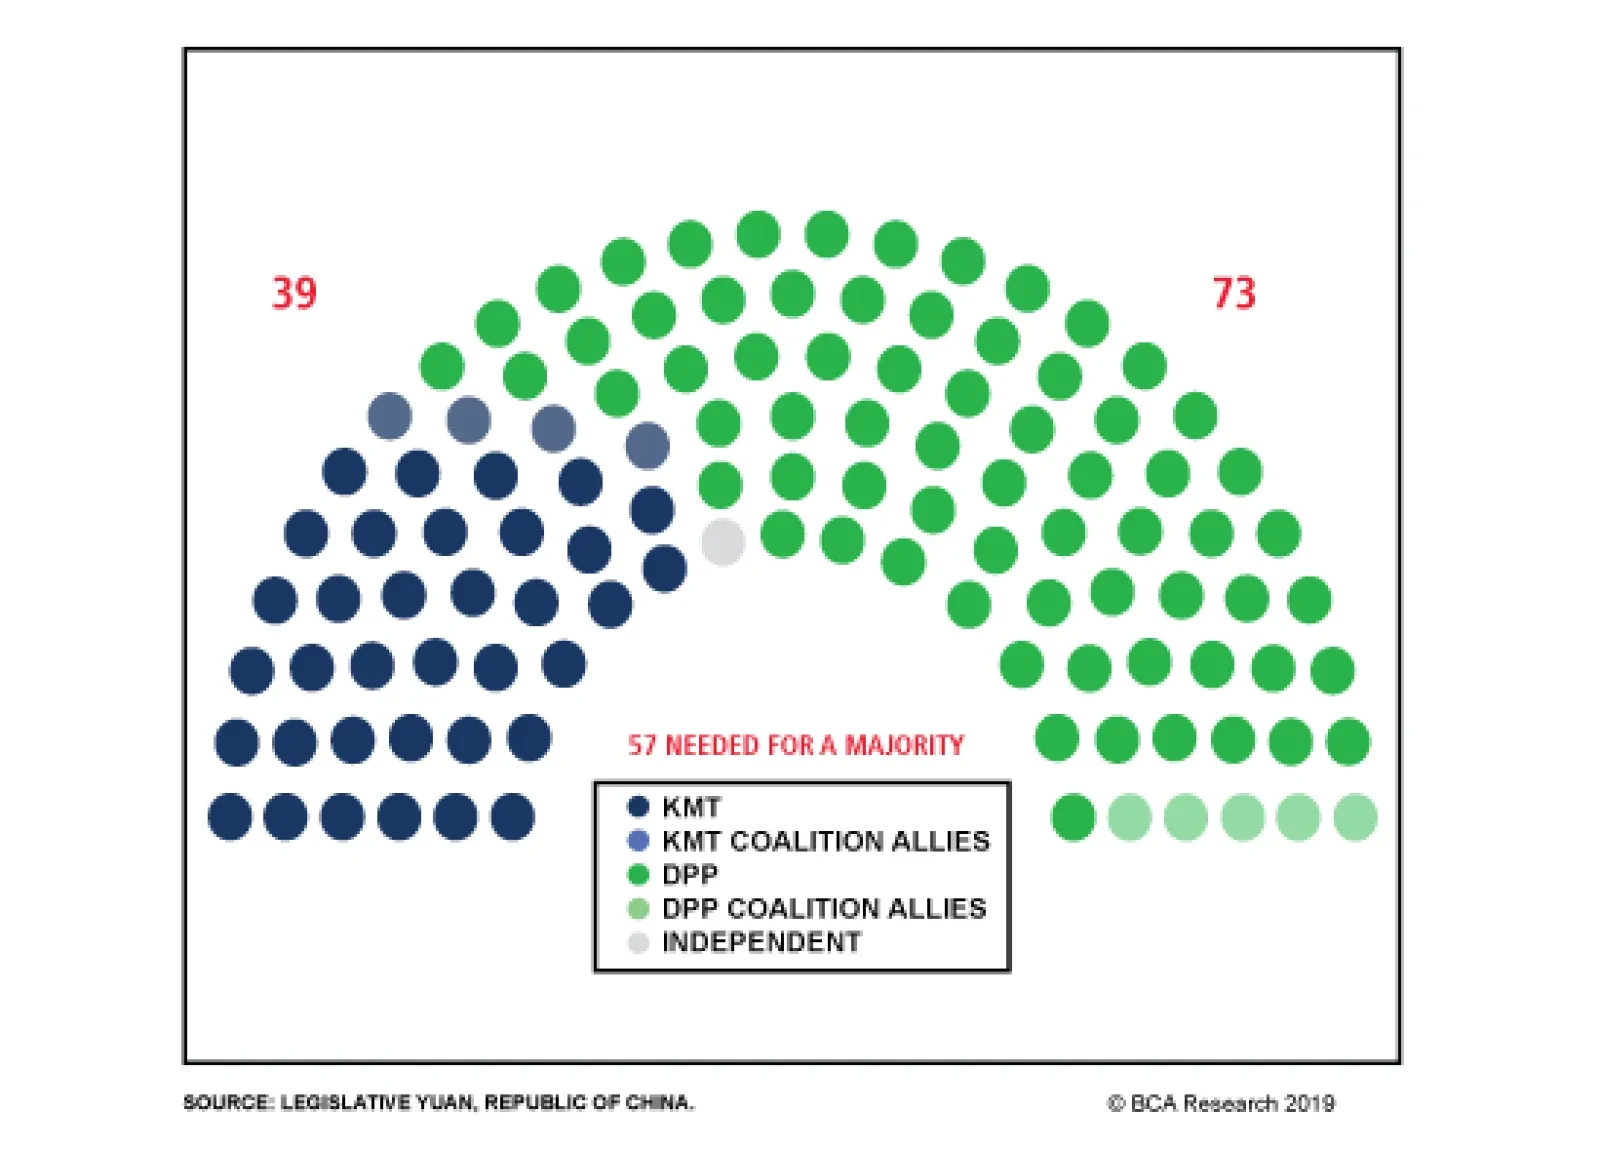
BCA Research has long argued that the primary source of structural geopolitical risk facing global investors resides in Asia, and involves the U.S., China, and other neighbors caught in the mix. As a result, our geopolitical team has examined China-Taiwan…
So if Chinese stocks are cheap (see previous Insight), does our team’s current forecast for China’s macro and policy conditions over the coming months and years justify taking advantage of the valuation discount, or are Chinese equities a bear trap? Our…
In financial markets, investors that can muster the courage to buy risk assets when the macro environment seems ominous and fraught with risk can be rewarded handsomely. Gauging valuation is a critical part of being successful when buying near bottoms. With…
While the dovish shift in Fed rhetoric is certainly welcome by global investors, it is not yet clear that the headwinds facing Chinese stocks will be resolved over the coming year. The first negative weighing on Chinese stocks has been the trade war with…
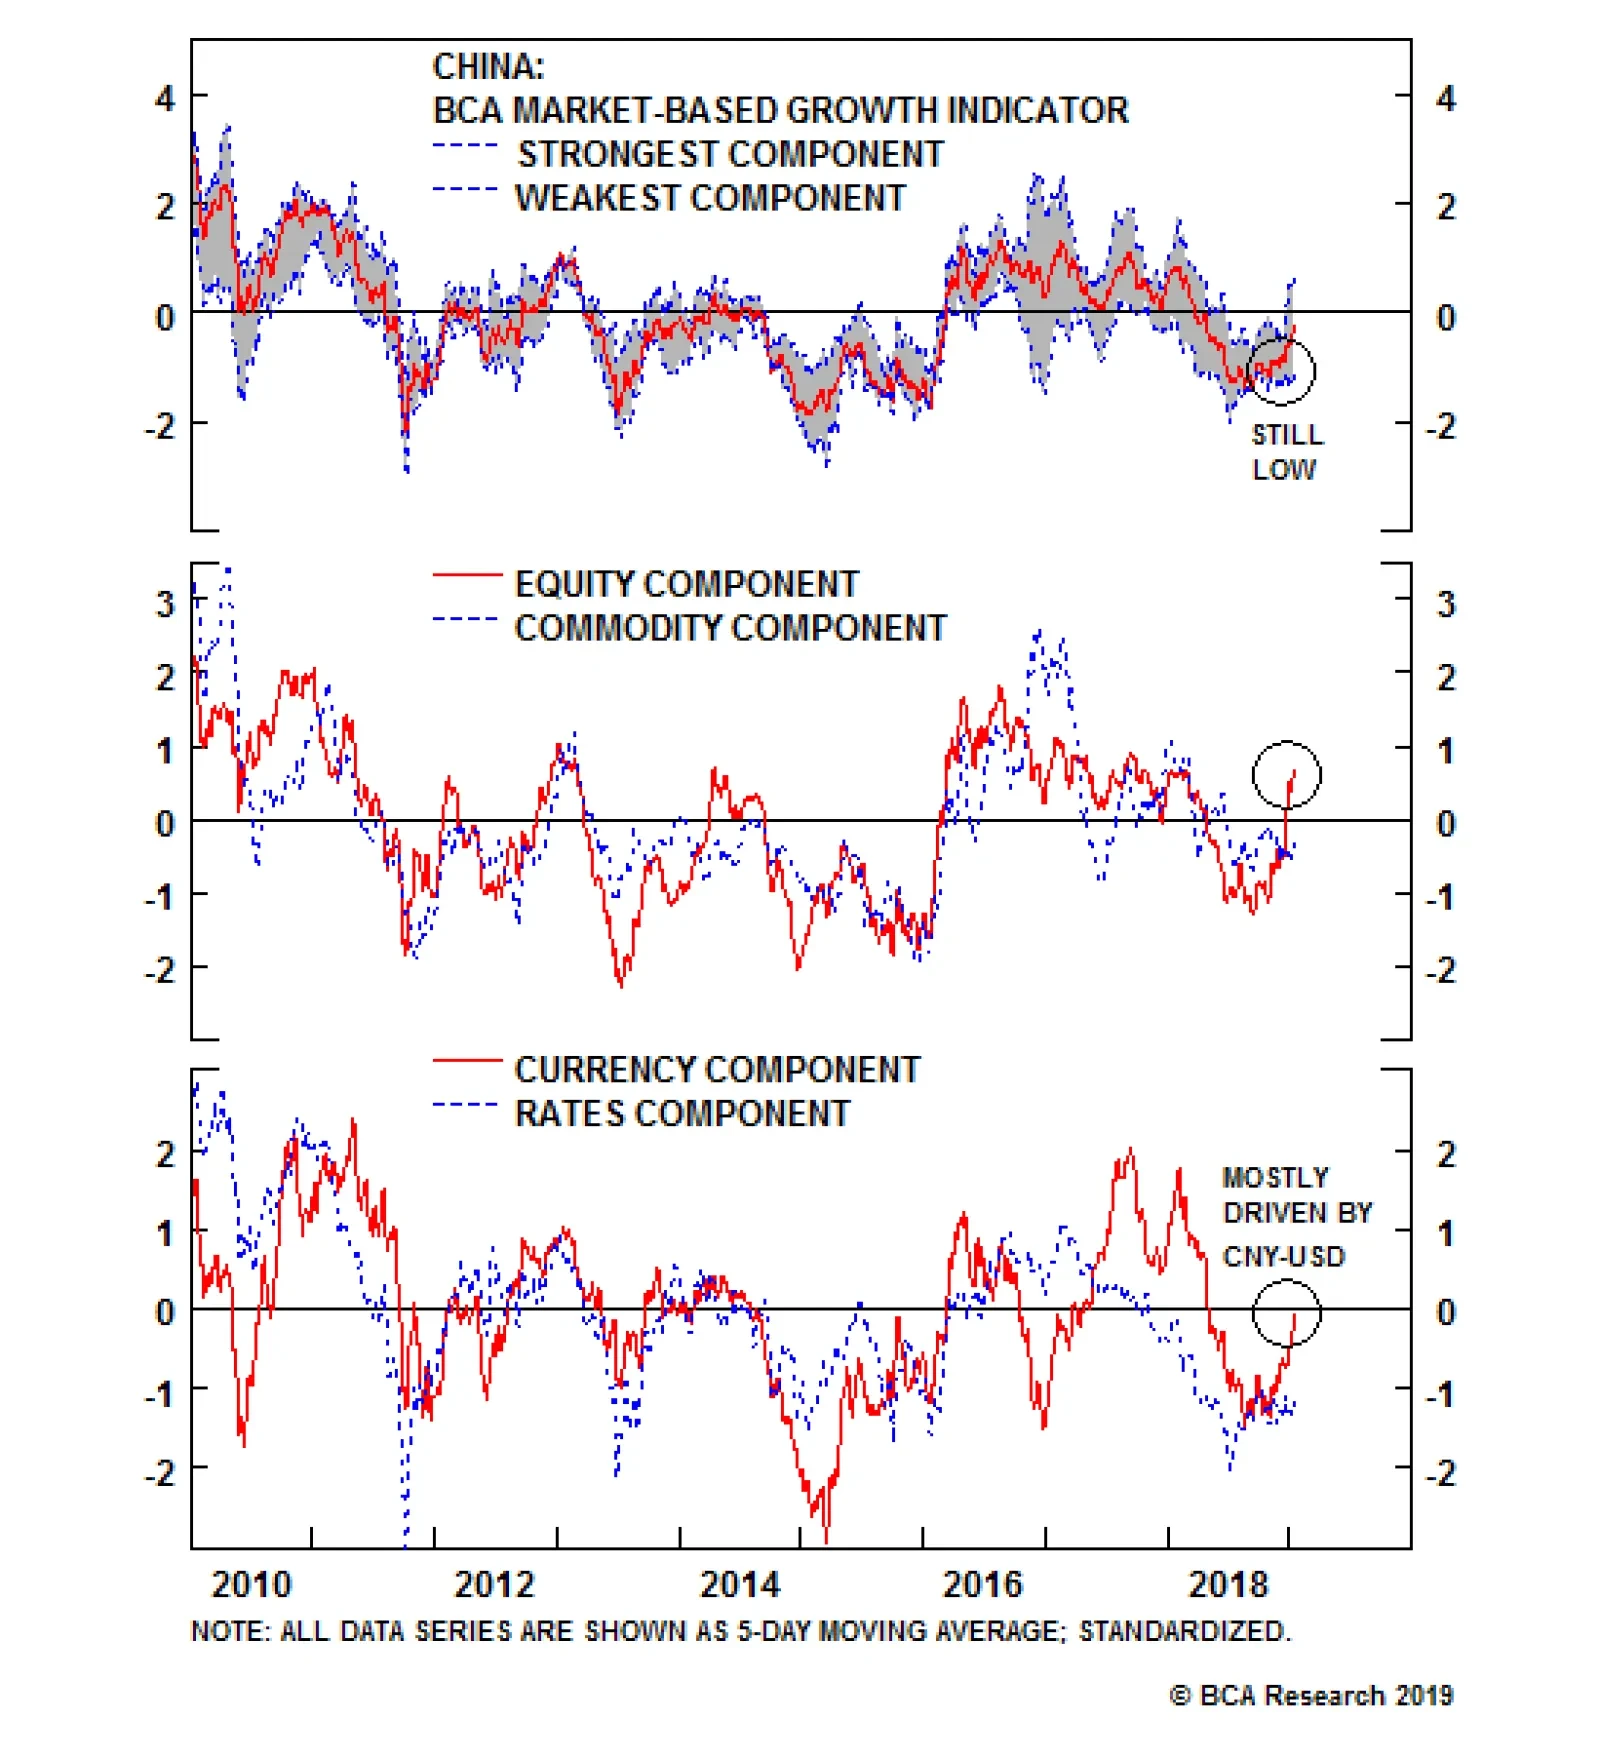
The above chart presents our China Investment Strategy team’s market-based China growth indicator. The bottom two panels of the chart include each of the four asset classes that make up the indicator.1 One observation that comes from looking at the…
Highlights Our market-based China growth indicator has risen meaningfully since mid-December, but mostly due to the equity components. For now, we regard this as a mixed signal, rather than a green light for Chinese stocks. Our research suggests that the odds of a serious earnings contraction for Chinese investable stocks over the coming year are high. Stocks are only likely to bottom near the end of the earnings adjustment process, if the 2014-2015 episode is a guide. Despite reasonable relative valuation, the long-term downtrend in sales-to-GDP suggests that Chinese stocks may be a “value trap” even over a multi-year time horizon. Feature Over the past several months BCA’s China Investment Strategy service has focused heavily on the cyclical condition of China’s economy, and whether any “green shoots” are evident from the key indicators that we track. We noted in last week’s report that our leading indicator for China’s old economy continues to point to slower growth over the coming months,1 a conclusion that is generally supported by the December trade, money, and credit data. In today's special report we address six questions concerning the outlook for Chinese stocks in light of passive outperformance versus the global benchmark over the past 3 months. We highlighted in last week’s report that investors should not view recent outperformance as a positive cyclical sign for Chinese stocks, and our answers to the questions below will hopefully provide readers with a fuller understanding of our neutral stance over a 6- to 12-month time horizon. The bottom line of our analysis is that a cyclical (6-12 month) overweight stance toward Chinese investable stocks versus the global benchmark remains uncompelling until the earnings contraction that is likely to occur this year is well underway. Chinese stocks offer reasonable-to-good valuation relative to global stocks, but may be cheap for a reason even over a multi-year time horizon. We remain tactically overweight Chinese investable stocks in recognition of the fact that investors may bid up the market in the lead-up to a possible trade deal with the U.S., but a legitimate improvement in domestic fundamentals is likely needed before we recommend investors upgrade their medium-term equity allocation to China. Q: Are the market signals from China-related assets bullish or bearish for Chinese stocks? A: Our market-based China growth indicator has risen meaningfully since mid-December, but mostly due to the equity components. For now, we regard this as a mixed signal, rather than a green light for Chinese stocks. Chart 1 presents our market-based China growth indicator, its four asset class subcomponents, and the range between the strongest and weakest components. Table 1 shows the change in the indicator and its 17 individual components since December 10, when the indicator clearly broke out. Chart 1Largely Driven By EM Equity Relative Performance
Largely Driven By EM Equity Relative Performance
Largely Driven By EM Equity Relative Performance
Both the chart and the table make it clear that the recent rise in the indicator is not uniform. While it is true that most of the individual components have improved over the past month, the equity components and two currency measures (the inverse of the dollar and Asian currencies), especially CNY-USD have accounted for most of the gains. Table 1(Anomalous) Equity Relative Performance Has Driven The Recent Improvement In Our MBCGI
Six Questions About Chinese Stocks
Six Questions About Chinese Stocks
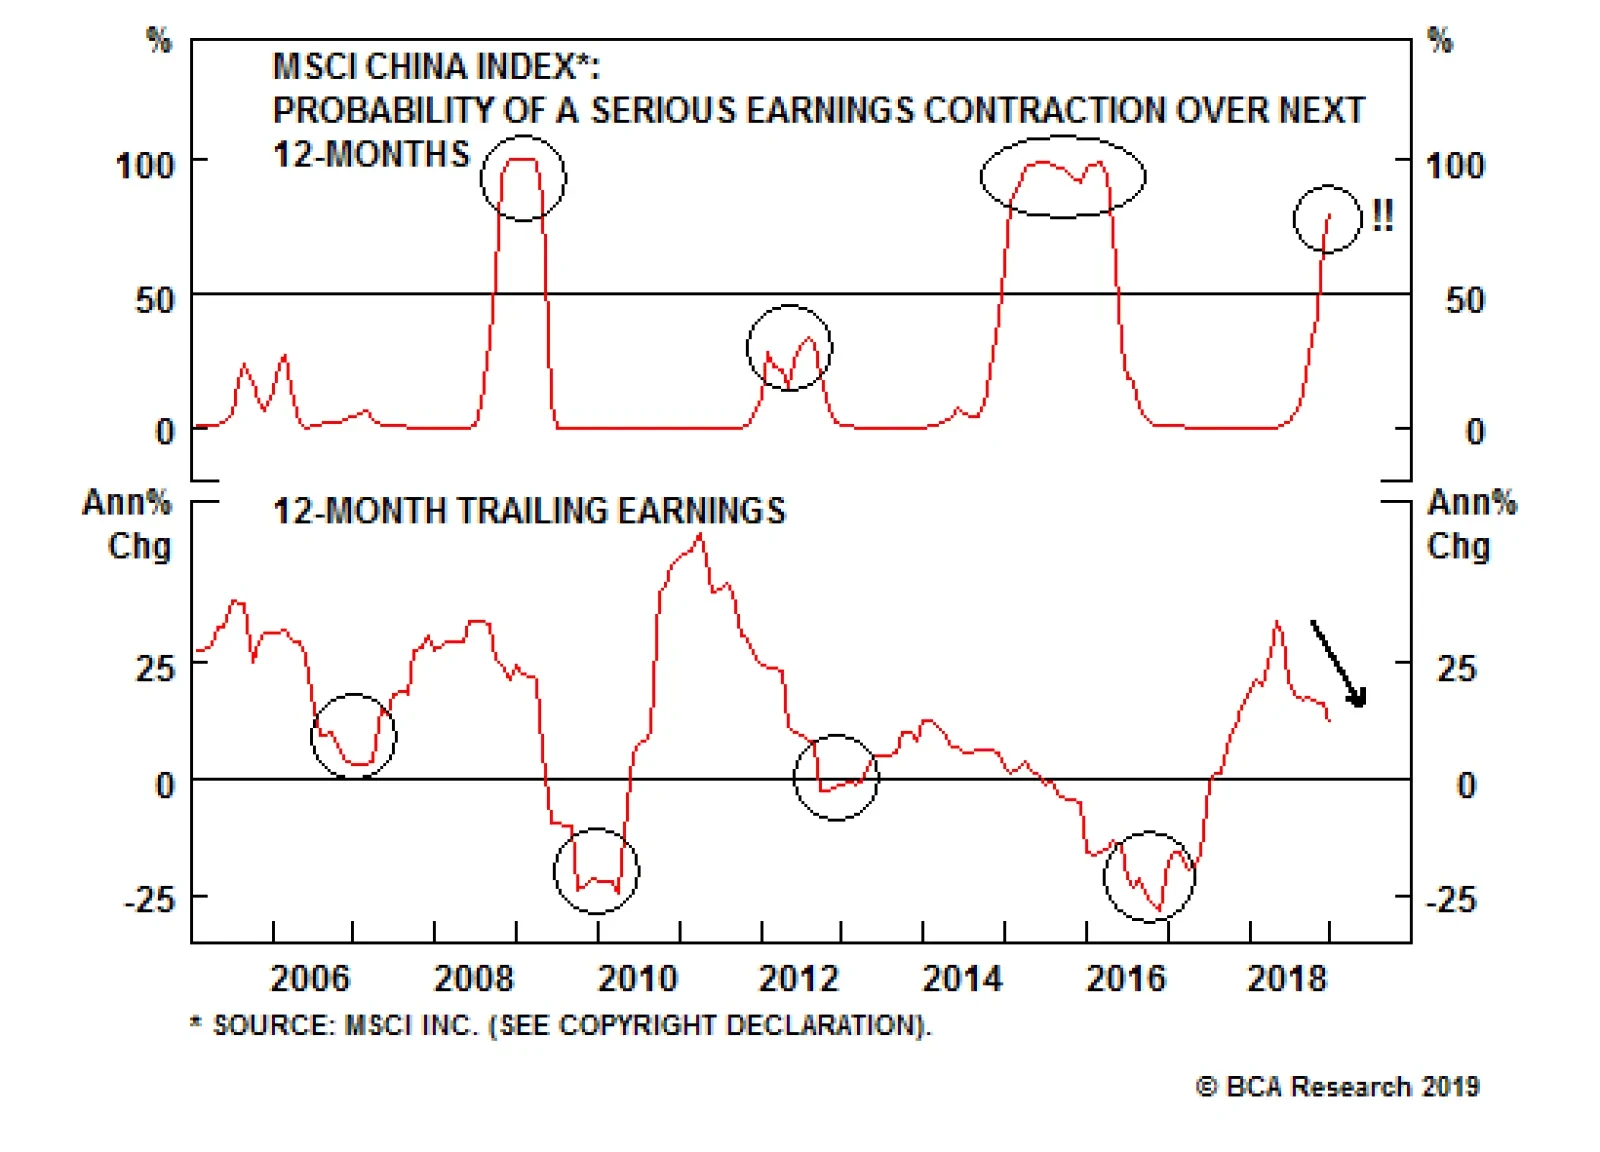
As we noted in last week’s report, the Q4 outperformance of Chinese / emerging market stocks has been passive in nature, meaning that they have outperformed simply because developed market equities have collapsed. This, in combination with the fact that the strongest currency components have been linked to declining interest rate expectations in the U.S., tell us that the aggregate indicator has largely risen due to a 1) generalized selloff in global risk assets, 2) perceptions of easier Fed policy, and 3) a modest improvement in sentiment concerning the U.S.-China trade war. While it would not normally be the case that a global equity selloff would cause the equity component of our indicator to rise, December was atypical because many China-related assets had already declined in advance of the selloff. Are the latter two factors noted above reason enough move to an overweight stance towards Chinese stocks over the coming 6- to 12-months? In our view, the answer is “not yet”. While easier U.S. monetary policy is certainly welcome (particularly given our view that a recession is unlikely), it is not yet clear that either of the negative factors waiting on Chinese stocks in absolute terms will be resolved over the coming year. The first factor is the trade war with the U.S. We agree that the odds of some sort of a deal that avoids further tariff imposition have risen significantly over the past two months, more than we anticipated in the lead-up to the G20 meeting in Argentina. However, given the deep, structural nature of the dispute between the U.S. and China, we think it is dangerous to pre-emptively act on an agreement that may not come or may take much longer to be reached than investors currently hope. This risk is in addition to what is likely to be a deceleration in export growth over the coming few months regardless of the outcome of negotiations, as the export front-running effect that has boosted trade volume over the past several months wanes. But as we address in the next question, the second negative factor impacting Chinese stocks is the upcoming impact of a slowing domestic economy on Chinese earnings, an effect that is not likely to be impacted by the changes in the global economy implied by financial markets since mid-December. Q: What is the outlook for Chinese earnings growth over the coming year? A: Our research suggests that the odds of a serious earnings contraction over the coming year are high. Chart 2 presents an update to a model for Chinese ex-tech (or “old economy”) earnings growth that is part of our analytical toolkit.2 The model paints a rosy outlook for earnings growth, suggesting that it is set to decelerate over the coming year but will continue to grow at a double-digit rate. Chart 2The Li Keqiang Index Suggests Ex-Tech Earnings Growth Will Stay Positive...
The Li Keqiang Index Suggests Ex-Tech Earnings Growth Will Stay Positive...
The Li Keqiang Index Suggests Ex-Tech Earnings Growth Will Stay Positive...
However, one problem with the approach used in Chart 2 is the fact that we have used the Li Keqiang index (LKI) as the independent variable in the model. Historically the LKI has reliably led ex-tech earnings growth, but we have highlighted several times over the past few months that the index is currently being supported by trade front-running activity that is very likely to wane, a view that is strongly consistent with the very negative December trade data that was released earlier this week. Chart 3 presents a different approach, namely the prediction of the odds of a serious investable equity earnings contraction over the coming 12-months (defined as earnings growth falling below -5%). The statistical approach taken in Chart 3 (logistic regression) is similar to that often employed by researchers attempting to predict the odds of a recession, and the chart shows that the model successfully warned of the two major earnings contractions over the past decade. Crucially, the odds of a major contraction did not rise about the 50% mark in 2012, when investable earnings growth decelerated significantly and fell briefly into negative territory. Chart 3...But Other Measures Imply High Odds Of An Outright Contraction
...But Other Measures Imply High Odds Of An Outright Contraction
...But Other Measures Imply High Odds Of An Outright Contraction
The current message from the model is clear: the odds of a significant earnings contraction over the coming 12-months are as high as 70%, implying that the deceleration in 12-onth trailing earnings growth shown in panel 2 of Chart 3 is likely to continue. Q: If earnings are set to contract, when will investors anticipate a recovery? A: Near the end of the earnings adjustment process (for investable stocks), if the 2014-2015 episode is any guide. Chart 4 presents some perspective on the issue of when investors are likely to anticipate an eventual bottom in earnings if a contraction does indeed occur. The chart shows the level of 12-month forward earnings for investable and domestic stocks, and circles at what point stocks in each market bottomed during the massive selloff in the Chinese equity market from 2014-2015. Chart 4The Forward Earnings Adjustment Process Has Yet To Begin
The Forward Earnings Adjustment Process Has Yet To Begin
The Forward Earnings Adjustment Process Has Yet To Begin
The chart shows that the domestic market bottomed roughly halfway through the earnings adjustment process, whereas the investable market bottomed almost at the end of the process. The chart also shows that this adjustment process has barely begun, which (in combination with Chart 3) currently argues against a cyclically overweight stance towards global stocks. Q: In the developed world (particularly the U.S.), elevated profit margins are viewed as a potential risk to earnings over the coming few years. Is profit margin mean-reversion a risk in China? A: Based on the absolute level of profit margins, no. Relative to the history of poor profitability for Chinese stocks, yes. Chart 5 shows the 12-month trailing profit margins for global and investable Chinese stocks. It shows how global margins have now moved past their previous cycle highs, a circumstance that is even more extreme in the case of the U.S. Chart 5Chinese Profit Margins Are Very Low, But Very Elevated Relative To Their History
Chinese Profit Margins Are Very Low, But Very Elevated Relative To Their History
Chinese Profit Margins Are Very Low, But Very Elevated Relative To Their History
Investable Chinese margins are very low, which at first blush implies less risk of a mean-reversion assuming a common mean. However, panel 2 shows that Chinese investable margins are as high relative to their own history as they are for global stocks, and they have followed a similar pattern over the past few years. This suggests that the central tendency for Chinese margins is indeed significantly lower than it is for the global benchmark, and that the risk of mean reversion is similarly elevated in the face of a major economic shock. How is it possible that Chinese investable ROE has been similar or even higher than that of the global benchmark, but that profit margins are substantially lower? The answer, with very high likelihood, is leverage. Panel 1 of Chart 6 shows ROE for both markets, whereas panel 2 shows ROE divided by the profit margins shown in Chart 5. Using the DuPont approach to decomposing ROE, ROE divided by profit margins is equal to sales over equity, or the product of the asset turnover (sales/assets) and leverage (assets/equity) ratios. Panel 2 shows that product of turnover and leverage is more than twice that of global stocks, implying that Chinese companies are either extremely efficient in the use of their assets to generate sales, or they are very highly levered compared with global stocks. Chart 6High Chinese ROE The Result Of High Leverage
High Chinese ROE The Result Of High Leverage
High Chinese ROE The Result Of High Leverage
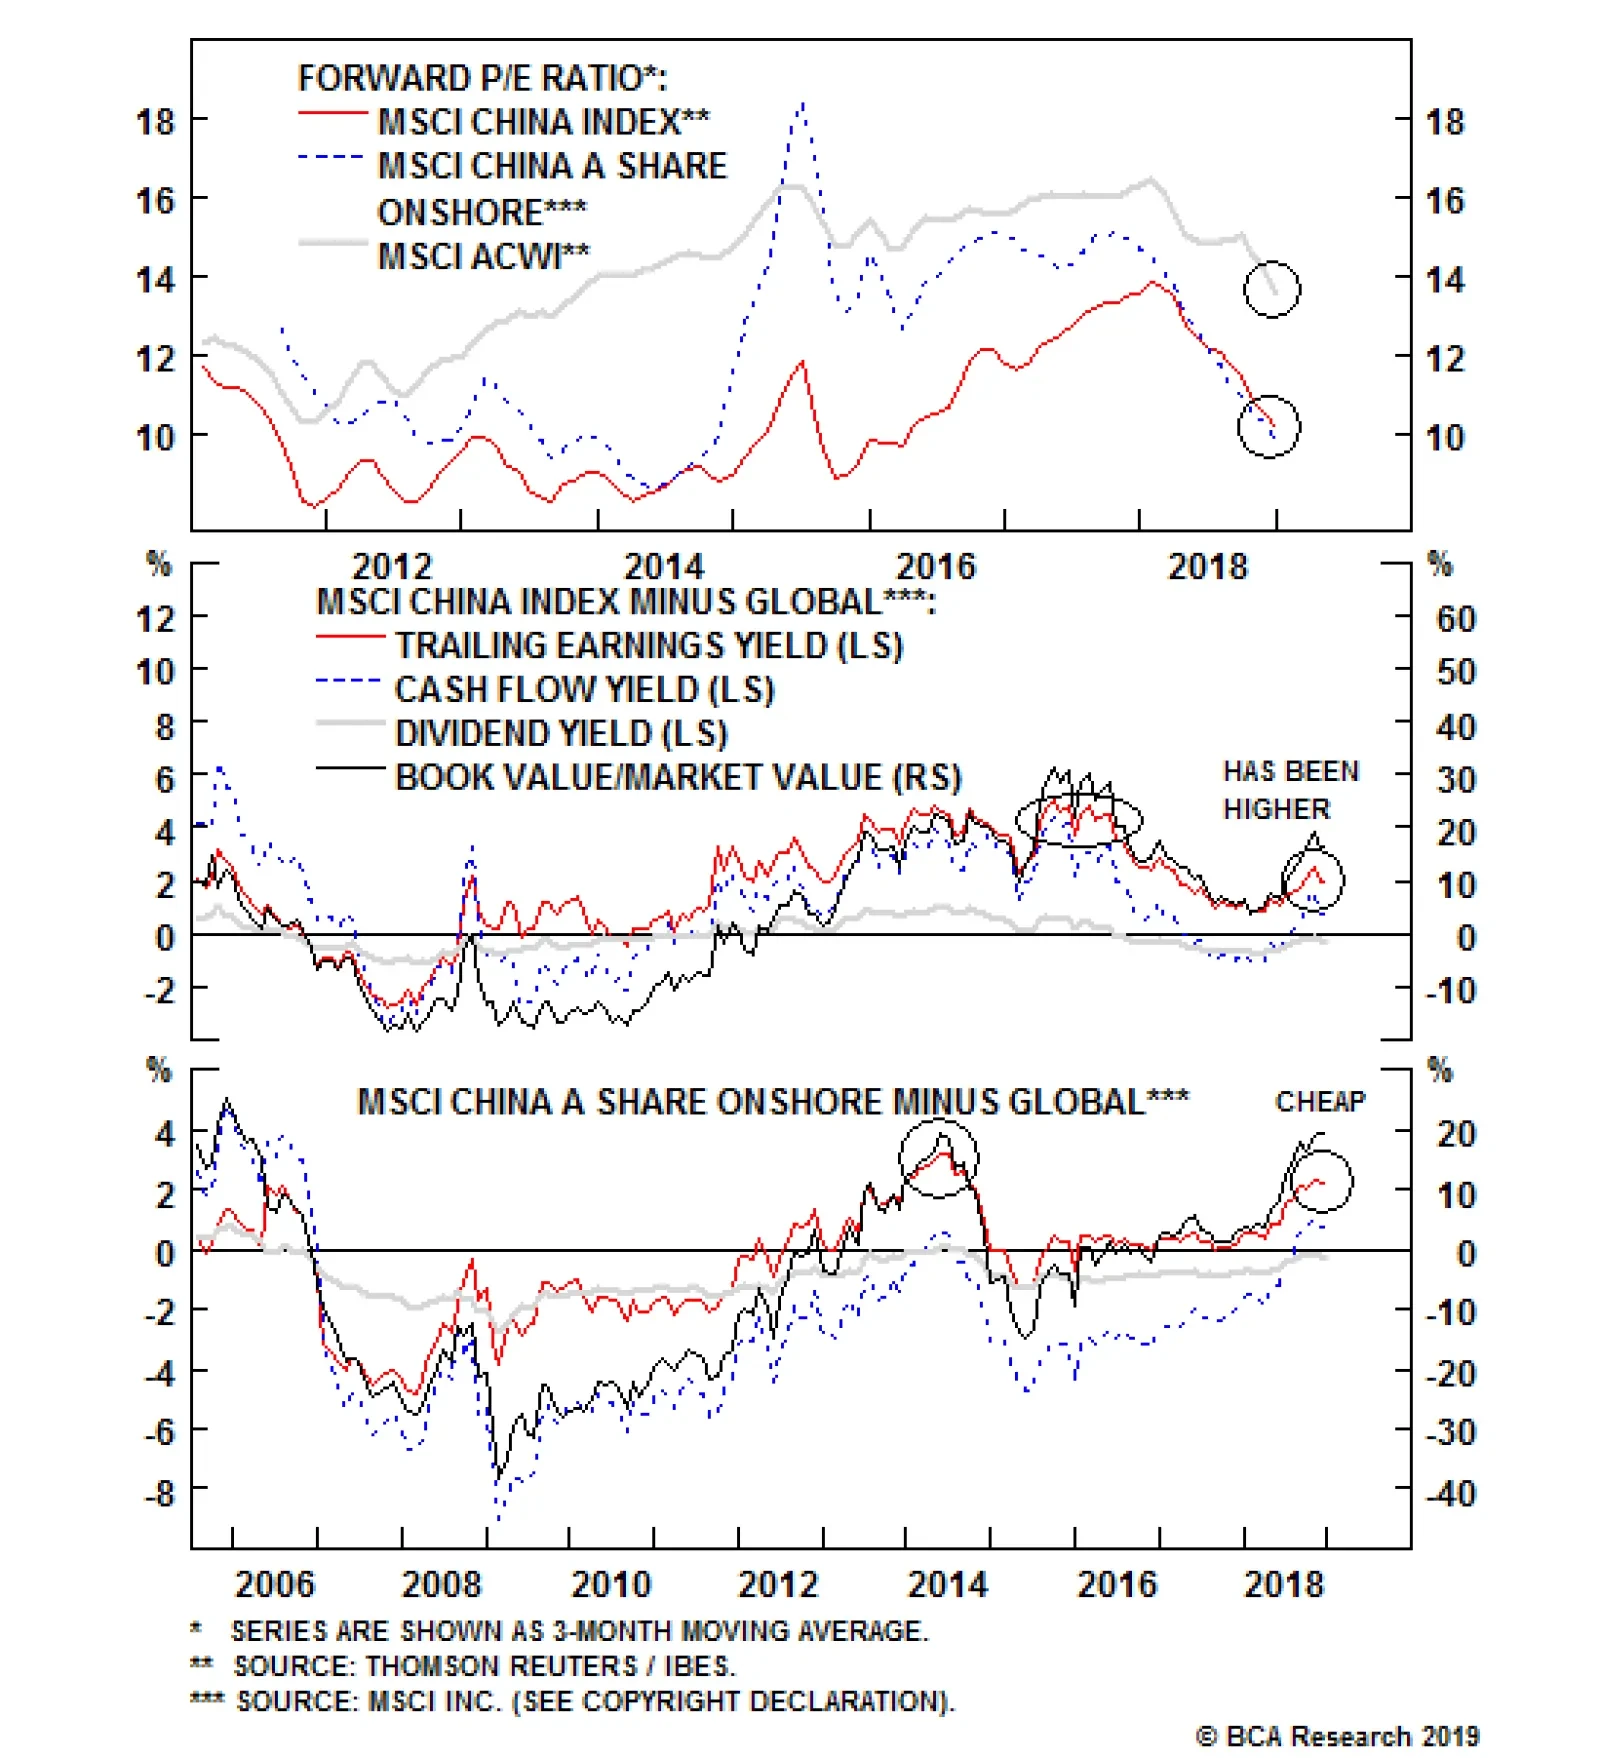
The latter is overwhelmingly more likely. We presented evidence in our August 29 Special Report suggesting that Chinese state-owned enterprises (SOEs) now have a negative net return on borrowed funds,3 a situation that has been caused by persistent leveraging since 2010. Not only does this explain the low profitability of Chinese stocks, it also magnifies the risk of significant mean reversion beyond a 6-12 month time horizon if Chinese policymakers panic and aggressively stimulate credit to stabilize a slowing economy. Q: Are Chinese stocks relatively cheap? A: The domestic equity market, yes. The investable market, somewhat. We presented Charts 7 and 8 in our final report of 2018,4 which showed the following: The forward P/E ratio for both domestic and investable Chinese stocks has improved substantially over the past several months. In relative terms, Chinese stocks are not as cheap as they have ever been but, depending on the measure employed, usually haven’t been cheaper (at least over the past decade). The A-share market particularly stands out, with all four relative valuation measures near, at, or above their 2014 levels. Chart 7Chinese Stocks Have Become Cheaper In Absolute Terms…
Chinese Stocks Have Become Cheaper In Absolute Terms...
Chinese Stocks Have Become Cheaper In Absolute Terms...
Chart 8…And Relative To Global Stocks
...And Relative To Global Stocks
...And Relative To Global Stocks
Since we published our December report, global stocks sold off severely, which has somewhat diminished the relative cheapness of investable Chinese stocks. But the bottom line for investors is that Chinese stocks are not expensive in absolute terms, relative to global stocks, or compared with the history of relative valuation. Q: Given reasonable-to-good valuation, are Chinese stocks a good long-term buy? A: Not necessarily. It is distinctly possible that Chinese investable stocks are an example of a “value trap”. When discussing equity valuations in our last report of the year, we also mused about whether Chinese stocks are a great long-term buy. We noted that valuation is normally a powerful predictor of 10-year future performance, but that deviations from this relationship can exist. Chart 9 shows a vivid example of such a deviation, by presenting the profile of investable and domestic equities versus U.S. and global stocks, all rebased to the start of the U.S. recession in December 2007. The chart shows that for every $100 invested in equities at the end of 2007, local currency prices have fallen to $52 for domestic stocks and $86 for investable stocks. This is in sharp contrast to $128 for global equities, and a whopping $176 for the S&P 500. Chart 9A (Largely) Lost Decade For Chinese Stocks
A (Largely) Lost Decade For Chinese Stocks
A (Largely) Lost Decade For Chinese Stocks
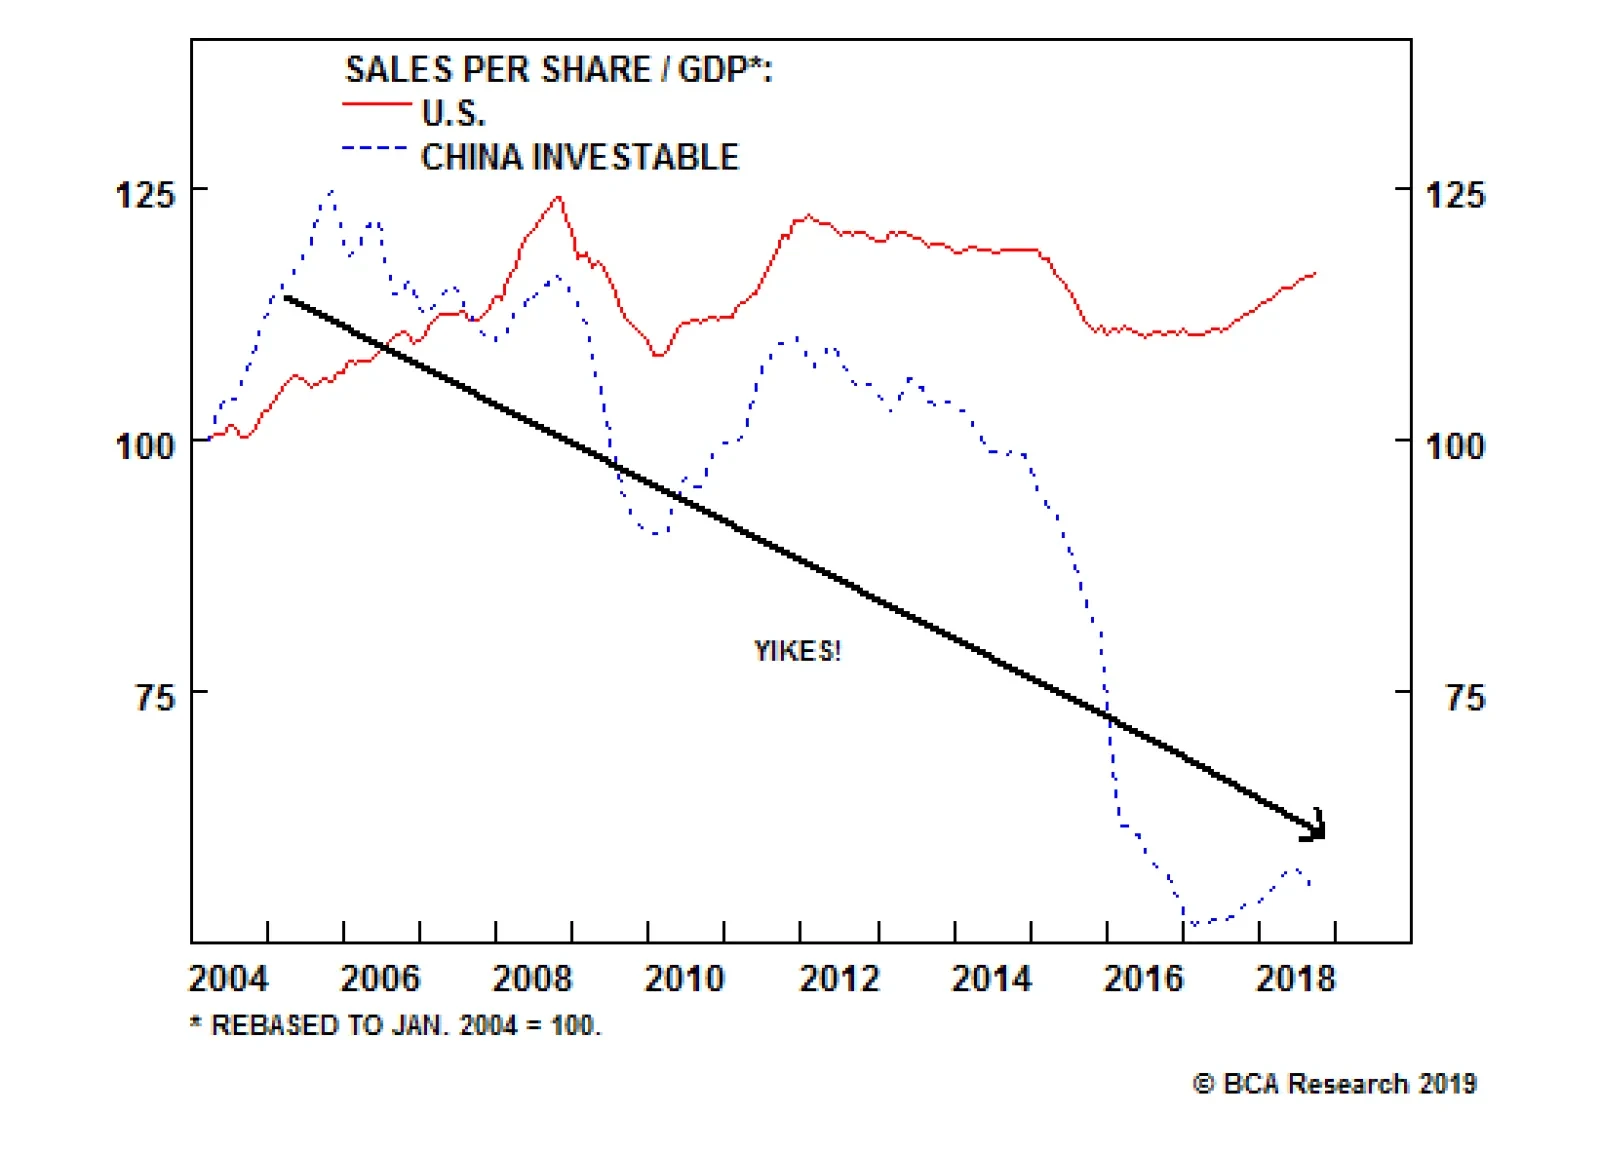
Excessive Chinese stock market valuation at the end of the last economic cycle has certainly contributed to the divergence shown in Chart 9. But Chart 10 shows another, less discussed factor: Chinese fundamental performance has not kept up with GDP growth, in contrast to developed markets. The chart shows the indexed ratio of sales per share to nominal GDP growth for the U.S. and China, and highlights that the latter has not only trended downward over time but has collapsed over the past four years. Chart 10Are Chinese Stocks Really A Play On Higher Chinese Growth?
Are Chinese Stocks Really A Play On Higher Chinese Growth?
Are Chinese Stocks Really A Play On Higher Chinese Growth?
At root, the secularly bullish narrative surrounding Chinese stocks is based on the fact that China’s rate of economic growth is considerably higher than that of the developed world. But if the fundamental performance of China’s listed equities cannot keep pace with the economy, are they such a compelling buy simply because they are not expensive? An alternative view is that Chinese stocks are cheap for a reason, i.e. that they are a value trap. In combination with the sizeable risks facing the Chinese economy from extremely elevated levels of corporate debt, the best answer that we can give investors looking out over a multi-year horizon is that Chinese stocks are a great long-term buy for those who do not share our structural concerns. On a risk-adjusted basis, we do not yet find the value proposition to be compelling, meaning that our recommended multi-year allocation to Chinese stocks is neutral. Jonathan LaBerge, CFA, Vice President Special Reports jonathanl@bcaresearch.com Footnotes 1 Please see China Investment Strategy Weekly Report “Monitoring The (Weak) Pulse Of The Data”, dated January 9, 2019, available at cis.bcaresearch.com. 2 Owing to the recent changes to the global industrial classification system (GICS), the chart shows Chinese earnings growth excluding the information technology and communication services sectors. 3 Please see China Investment Strategy Special Report “Chinese Policymakers: Facing A Trade-Off Between Growth And Leveraging”, dated August 29, 2018, available at cis.bcaresearch.com. 4 Please see China Investment Strategy Weekly Report “Legacies of 2018”, dated December 19, 2018, available at cis.bcaresearch.com. Cyclical Investment Stance Equity Sector Recommendations