China
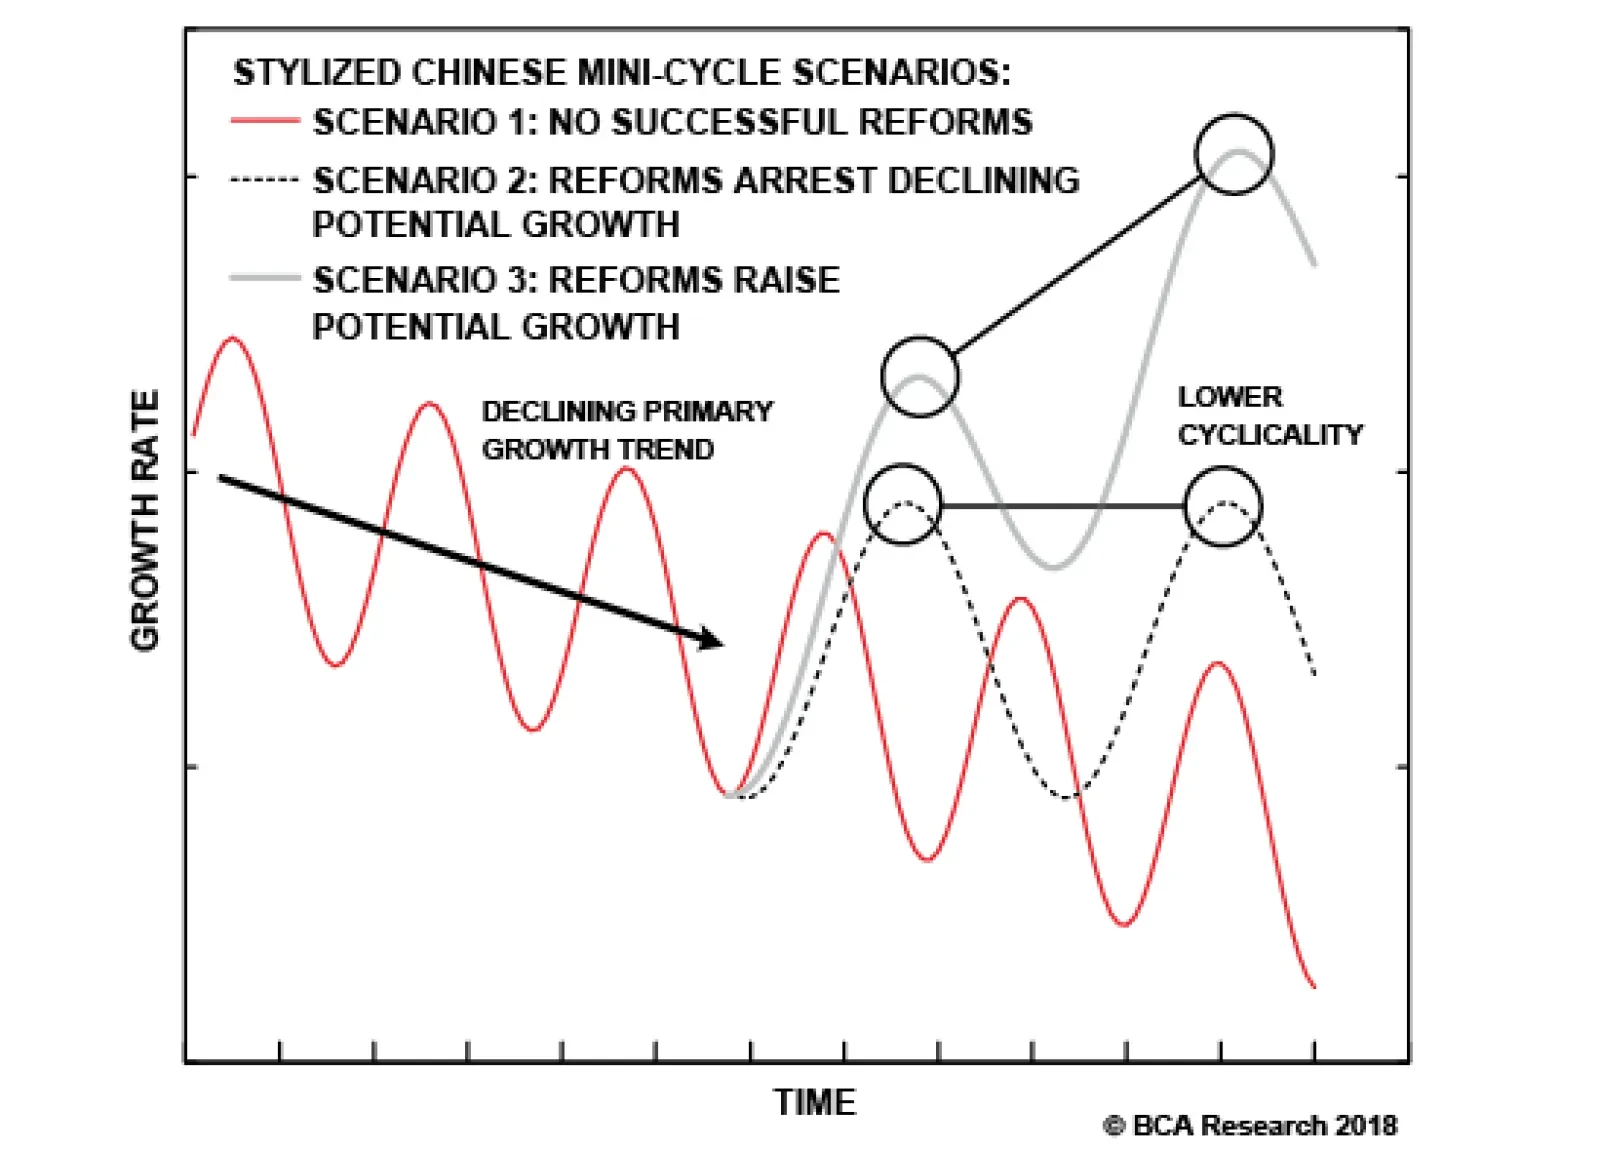
The chart presents three stylized scenarios as a possible multi-year roadmap for investors faced with a “mini-cycle world”. Scenario 1 represents the pessimistic case articulated by Arthur Budaghyan, our chief emerging markets strategist, which involves a set…

Dear Clients, This is the final publication for the year. The Emerging Markets Strategy team wishes you a very happy holiday season and a prosperous New Year! Best regards, Arthur Budaghyan Highlights The recent EM outperformance is a mid-bear market stabilization, and is at its late stage. Market signals and economic data are consistent with a further slowdown in global growth emanating from China/EM. We reiterate that global trade is heading for a period of contraction and investors should position accordingly. EM will sell off even as U.S. bond yields drop further. Feature Global investors have been increasing their absolute exposure to EM equities over the past two months, despite the ongoing drop in DM share prices.1 The common narrative is that a potential pause by the Fed next year, the trade truce between the U.S. and China and the latter’s ongoing stimulus measures are together sufficient to propel EM risk assets higher on a tactical and even cyclical horizon. In contrast, we believe the recent EM outperformance is a mid-bear market stabilization, and is at a late stage. We have written at length that neither the Fed nor the trade wars were the main culprit behind the EM selloff early this year. The key reason behind the EM and commodities selloff was the slowdown in Chinese/EM economies and global trade. China’s policy stimulus has so far been insufficient to reverse the economy’s growth slump. As such, the odds are that China/EM growth and global trade will continue to disappoint, and the EM selloff and underperformance will resume sooner than later. Market Signals EM risk assets are sensitive to China’s growth and global trade. Market signals remains downbeat on both. In particular: Global cyclicals continue to send a bleak message about the global business cycle. Global machinery, chemicals, freight and logistics as well as semiconductor stocks have been underperforming the global equity index in a falling market (Chart I-1). This is consistent with an ongoing slowdown in global growth. Chart I-1AGlobal Cyclicals Are Underperforming In A Falling Market
Global Cyclicals Are Underperforming In A Falling Market
Global Cyclicals Are Underperforming In A Falling Market
Chart I-1BGlobal Cyclicals Are Underperforming In A Falling Market
Global Cyclicals Are Underperforming In A Falling Market
Global Cyclicals Are Underperforming In A Falling Market
EM relative equity performance versus DM has historically been tightly correlated with global materials’ share prices versus the overall global stock benchmark (Chart I-2, top panel). Remarkably, the recent EM outperformance has not been corroborated by outperformance of global materials (Chart I-2, bottom panel). This is additional evidence that suggests investors should fade this EM rebound/outperformance. Chart I-2EM Vs. DM Is Akin To Global Materials Vs. Benchmark Index
EM Vs. DM Is Akin To Global Materials Vs. Benchmark Index
EM Vs. DM Is Akin To Global Materials Vs. Benchmark Index
EM risk assets are very sensitive to both global trade and commodities prices. The majority of forward-looking indicators on global trade remain dismal (please refer to the section below for a more detailed discussion on this topic). Interestingly, the current trajectory of global equities – including the run-up in share prices before January 2018’s peak, the top formation itself, and the subsequent decline – impeccably track the same trajectory that occurred between 1998 and 2000 in terms of both oscillations and magnitude (Chart I-3). Chart I-3Are Global Equities In A Bear Market?
Are Global Equities In A Bear Market?
Are Global Equities In A Bear Market?
The top in 2000 was followed by a devasting, three-year bear market. We are not arguing this global equity selloff will last that long nor be that large. What we are saying is that this turbulence will last another several months, and that there is still considerable potential for further drawdowns. Finally, the silver-gold ratio is breaking below its previous lows, including its early 2016 low (Chart I-4). Such a breakdown could be a precursor of a deflationary shock stemming from the Chinese economy. Chart I-4Beware Of Breakdown In The Silver-Gold Ratio
Beware Of Breakdown In The Silver-Gold Ratio
Beware Of Breakdown In The Silver-Gold Ratio
Global Trade: A Contraction Ahead? This section elaborates on the fundamental rationale behind the selloff – the deepening global business cycle downturn stemming primarily from China/EM economies: There are several indications that the global slowdown is already hurting American manufacturing. In the U.S., the CASS Freight Shipment Index, which measures North American freight volumes and is published by the Saint Louis Federal Reserve is foretelling an impending slump in the manufacturing sector (Chart I-5, top panel). Chart I-5U.S. Growth Is Slowing
U.S. Growth Is Slowing
U.S. Growth Is Slowing
Consistently, the growth rates of both total intermodal carloads and railroad carloads excluding petroleum and coal have rolled over decisively (Chart I-5, middle and bottom panels). As U.S. manufacturing slows, U.S. Treasury yields will drop further. In China, the slowdown is occurring not only in the industrial parts of the economy but also in household spending (Chart I-6). Chart I-6Chinese Consumer Is In A Soft Spot
Chinese Consumer Is In A Soft Spot
Chinese Consumer Is In A Soft Spot
In the case of the industrial segments, falling new and backlog orders are heralding further deterioration in nominal manufacturing output growth (Chart I-7). Accordingly, the construction and installation component of fixed asset investment is already very weak, while equipment and instrument purchases are contracting. Chart I-7Chinese Manufacturing: Deepening Slump
Chinese Manufacturing: Deepening Slump
Chinese Manufacturing: Deepening Slump
The key channel in which China impacts the rest of the world is through its imports. In turn, the latter are driven by the nation’s credit and fiscal spending impulse (Chart I-8, top panel). That explains the linkage between the Chinese credit and fiscal impulse and EM corporate profits (Chart I-8, bottom panel). Chart I-8The Linkages Between Chinese Credit & Fiscal Spending, Imports And EM Profits
The Linkages Between Chinese Credit & Fiscal Spending, Imports And EM Profits
The Linkages Between Chinese Credit & Fiscal Spending, Imports And EM Profits
Crucially, the import sub-component of mainland manufacturing PMI has plunged well below the 50 boom-bust line and signals further downside in EM equities and industrial metals prices (Chart I-9). Chart I-9Chinese Imports Versus EM Stocks And Industrial Metals
Chinese Imports Versus EM Stocks And Industrial Metals
Chinese Imports Versus EM Stocks And Industrial Metals
This is consistent with contracting Chinese imports from various countries (Chart I-10). This is how China’s negative growth shock is promulgating throughout the rest of the world. Chart I-10German And Japanese Shipments To China To Contract
German And Japanese Shipments To China To Contract
German And Japanese Shipments To China To Contract
Finally, the growth rate of Korean, Japanese, Taiwanese and Singaporean aggregate exports is approaching zero, which is typically a bad omen for EM share prices (Chart I-11). Chart I-11Asian Exports And EM Stocks
Asian Exports And EM Stocks
Asian Exports And EM Stocks
What’s more, Taiwanese shipments of electronic products parts are begining to contract, which hearalds a bleak outlook for both the global trade cycle and EM technology sector profits (Chart I-12). Consistently, semiconductor prices have continued to fall precipitously. Chart I-12Prepare For More Weakness in Global Trade
Prepare For More Weakness in Global Trade
Prepare For More Weakness in Global Trade
Bottom Line: We reiterate that global trade is heading for a period of contraction due to the deepening growth slump in China/EM. Chinese Stimulus and U.S. Growth: Lost In Translation? We endeavor to tackle two critical questions: (1) Why has policy stimulus in China failed to stabilize growth? We have written about this extensively in previous reports and will review our key points briefly. First, regulatory tightening on banks and non-bank financial institutions is overwhelming the benefits of lower interbank rates. New regulations are constraining banks’ and financial intermediaries’ ability to expand their balance sheets as aggressively as before. Slowing credit growth has so far offset robust fiscal spending – please refer to Chart I-8. Second, in a system saddled with extreme leverage, non-performing loans and very weak capacity to service debt, the impact of lower interest rates on credit origination is likely to be minimal. This diminishes the efficacy of monetary policy easing on credit growth. China’s credit excesses are enormous, and deleveraging is probably in the very early innings (Chart I-13, top panel). Notably, company and household credit are still expanding at a 10% pace from a year ago (Chart I-13, bottom panel). Chart I-13Has China Started Deleveraging? Not Really
Has China Started Deleveraging? Not Really
Has China Started Deleveraging? Not Really
Third, the authorities are facing a formidable dilemma between opting for lower interest rates and/or maintaining a stable exchange rate. We have been highlighting the tight correlation between the CNY/USD exchange rate and interest rates. The recent stabilization in the CNY/USD may have been due to the latest rise in Chinese interbank rates (Chart I-14). Chart I-14China's Monetary Policy Dilemma
China's Monetary Policy Dilemma
China's Monetary Policy Dilemma
Yet, the real economy in China and its numerous indebted entities require lower (and probably zero) interest rates for a couple of years, as occurred in Japan, the U.S. and the euro area in the years following the peaks in their respective credit bubbles. All in all, it is not clear if the authorities can reduce interest rates without eliciting currency depreciation. For now, the jury is still out. Fourth, net liquidity injections into the banking system by the People’s Bank of China (PBoC) have been minimal in recent years (Chart I-15, top panel). In fact, commercial banks’ excess reserves at the PBoC have been flattish over the past three years (Chart I-15, bottom panel). While the media and many commentators have been focused on the reserve requirement ratio reductions that have infused a lot of excess reserves into the banking system, there have also been many expired lending facilities from the PBoC to banks. The net result has been flattish liquidity trend in the banking system. Chart I-15Chinese Banking System's Excess Reserves Are Flattish
Chinese Banking System's Excess Reserves Are Flattish
Chinese Banking System's Excess Reserves Are Flattish
While there is no limit on a central bank’s ability to provide more excess reserves to the banking system, spare liquidity could push interbank rates lower and possibly trigger currency depreciation. Finally, monetary and fiscal policies work with varying time lags. Critically, the aggregate credit and fiscal impulse remains in a downtrend, pointing to less imports and hence a downbeat outlook for EM corporate earnings (please refer to Chart I-8). (2) Why has global trade decelerated amid robust U.S. demand? U.S. import growth has been very robust, yet global trade has slowed (Chart I-16). Chart I-16Robust U.S. Imports Have Not Precluded Global Manufacturing Slowdown
Robust U.S. Imports Have Not Precluded Global Manufacturing Slowdown
Robust U.S. Imports Have Not Precluded Global Manufacturing Slowdown
The reason behind this is very simple: U.S. and EU annual merchandize goods imports amount to $2.5 trillion and $2.2 trillion, respectively – dwarfed by EM (including China) imports of $6 trillion (Chart I-17). Chart I-17EM Imports Are Larger Than Combined U.S. And EU Imports
EM Imports Are Larger Than Combined U.S. And EU Imports
EM Imports Are Larger Than Combined U.S. And EU Imports
This value of EM imports excludes China’s imports for processing and re-exporting as well as all the imports of Mexico and central Europe, which also include a lot of inputs that are processed and re-exported. In spite of these adjustments, EM imports are still considerably larger than U.S. and EU imports combined. Hence, robust U.S. final demand is in and of itself insufficient to both offset and support global trade growth when EM/China demand falters. This is especially pertinent to commodities and industrial goods, where China/EM are large consumers. Chart Patterns: Reading Market Tea Leaves There is no magical formula that can guarantee making money in financial markets. Economic data are lagging, markets can change direction abruptly, and indicators can break down or give false signals from time to time. Besides, financial markets do not move in straight lines, and differentiating the noise from the signal is not a simple exercise. The odds of making money or outperforming are higher when investors are correct in their big- picture judgements – i.e., when their thematic views on the global economic and investment landscapes are accurate. Markets can be very noisy and volatile in the short term, yet there are several critical chart patterns that we are taking comfort with as they are consistent with our macro themes. The latter are the following: Sagging China/EM growth, a deepening global trade slump, lower commodities prices and a stronger U.S. dollar/weaker EM currencies. Our Risk-On versus Safe-Haven Currency Ratio2 has relapsed since early this year after failing to break above its previous top (Chart I-18). In and of itself, this is already a bearish chart formation. Besides, it seems this market indicator is forming a potential head-and-shoulders pattern. Chart I-18A Bear Market In Risk-On Versus Safe-Haven Currencies Ratio
bca.ems_wr_2018_12_20_s1_c18
bca.ems_wr_2018_12_20_s1_c18
Any relapse from current levels will validate the head-and-shoulders profile. As a result, the odds of a major plunge will rise, which would be consistent with our themes and outlook. EM share prices in dollar terms have also struggled to break above their 2007 highs in the past 10 years, despite the bull market in the S&P 500 during this period (Chart I-19). Remarkably, the EM stock index is presently sitting on several of its long-term moving averages. They make a formidable technical support. Box 1 elaborates why we use these long-term moving averages in our regular reports. Chart I-19EM Equities Are Facing An Air Pocket
EM Equities Are Facing An Air Pocket
EM Equities Are Facing An Air Pocket
If these technical supports give in, EM equities will hit an air pocket – with the next technical support lying 25% below the current level. It is no surprise that an intense battle between bulls and bears is currently being waged. Provided EM corporate profits are set to contract in the first half of 2019, as per our analysis above, we believe these technical supports will be violated and that a major plunge in share prices is very likely. Finally, share prices of global energy and mining companies rolled over early this year at their long-term moving averages (Chart 20, top and middle panels). These long-term moving averages acted as a support in bull markets; now they have become a resistance. Hence, it makes sense to argue that energy and mining stocks remain in a secular bear market, and the 2016-‘17 advance was a bear market rally. If so, further downside in their share prices could be substantial. Meantime, global semiconductor share prices rolled over at their 2000 peak earlier this year (Chart I-20, bottom panel). This is a bad technical sign and might signify that a non-trivial slowdown in global growth may last for quite some time. Chart I-20Global And Mining Stocks Remain In A Secular Bear Market
Global And Mining Stocks Remain In A Secular Bear Market
Global And Mining Stocks Remain In A Secular Bear Market
Typically, in the periods when resources and technology stocks sell off, EM equities and other risk assets perform badly. It appears we are currently in such a phase, and it will not be short-lived. Investment Strategy China/EM growth conditions continue to worsen. Tactically and cyclically, risks to EM stocks, currencies, credit and high-yielding local bonds are skewed to the downside. We continue to recommend playing EM on the short side. Playing a market on the long side when fundamentals are deteriorating and valuations are not cheap is akin to collecting pennies in front of a steamroller. The recent outperformance of EM equities and credit versus DM is unsustainable. Continue to underweight EM. For dedicated EM equity portfolios, our overweights are Brazil, Chile, Mexico, Russia, central Europe, Korea and Thailand, while our underweights are Indonesia, the Philippines, Peru and South Africa. We are considering to upgrade India from underweight to neutral. Our preferred short currency basket versus the U.S. dollar consists of the ZAR, the IDR, the CLP, the COP and the KRW. Box 1 - Our Long-Term Moving Average Framework “All through time, people have basically acted and re-acted the same way in the market as the result of: Greed, Fear, Ignorance & Hope. That is why numeric formations and patterns recur on a constant basis.” - Jesse Livermore, in Reminiscences of a Stock Operator The basis for examining price patterns with their 200-, 400-, 800-, 1600- and 3200-day moving averages (MA) – corresponding to nine months, 18 months, 3-, 6-, 12 and 24-year moving averages – is as follows: The 200-day MA is a very widely known and well-used measure. We have observed that when the 200-day MA breaks in a bull market, the next support could occur at the 400- or 800-day MA levels – i.e., the multiples of the 200-day MA. Following the same logic, we examined even longer-term moving averages such as 6-, 12- and 24-year MAs. Interestingly, we discovered that the 3- and 6-year MAs worked very well during the S&P 500 bull run of the 1950s and 1960s (Chart I-21, top panel). Besides, during the bull market of the 1980s-‘90s, the S&P 500 selloffs also found support at the 3- and 6-year MAs (Chart 21, bottom panel). Chart I-21The S&P 500 And Long-Term Moving Averages
The S&P 500 And Long-Term Moving Averages
The S&P 500 And Long-Term Moving Averages
Meanwhile, the bear market bottoms in 1982 and 2002-‘03 in the U.S. equity market occurred at a very long-term (12-year) MA (Chart I-21, bottom panel). Similarly, in the fixed-income universe, throughout the more than 35-year- strong U.S. bond bull market, the rise in bond yields often topped out when 10-year Treasury yields reached their 6-year MA (Chart I-22). Chart I-22U.S. Bond Yields And Long-Term Moving Averages
U.S. Bond Yields And Long-Term Moving Averages
U.S. Bond Yields And Long-Term Moving Averages
These observations have led us to infer that structural trends cannot be considered completely broken as and when markets cross their 200-day MA. Large selloffs (or cyclical bear markets) within structural bull markets can push prices to their very long-term moving averages such as 3- or 6-year MAs. The opposite holds true for tactical and cyclical rallies within bear markets. Besides, we have also observed that when a financial market in a selloff finds support at a particular long-term MA, it usually resumes its rally and often advances to new highs. On the contrary, when a market rallies but fails to break above its long-term MA (resistance), it often experiences a breakdown. We often apply this long-term moving average framework to analyze trends in various financial markets, and contrast and evaluate these with our fundamental economic themes. As to the question of why these numbers work, the quote above from Reminiscences of a Stock Operator could be the answer. Arthur Budaghyan, Senior Vice President Emerging Markets Strategy arthurb@bcaresearch.com Footnote 1 BoA December survey 2 Average of CAD, AUD, NZD, BRL, CLP & ZAR total return indices relative to average of JPY & CHF total returns (including carry). Equity Recommendations Fixed-Income, Credit And Currency Recommendations
Highlights So What? Our best and worst calls of 2018 cast light on our methodology and 2019 forecasts. Why? Our clients took us to task for violating our own methodology on the Iranian oil sanctions. Sticking to our guns would have paid off with long Russian equities versus EM. We correctly called China’s domestic policy, the U.S.-China trade war, Europe, the U.S. midterms, and relative winners in emerging markets. Feature It has been a tradition for BCA’s Geopolitical Strategy, since our launch in 2012, to highlight our best and worst forecasts of the year.1 This will also be the final publication of the year, provided that there is no global conflagration worthy of a missive between now and January 9, when we return to our regular publication schedule. We wish all of our clients a great Holiday Season. And especially all the very best in 2019: lots of happiness, health, and hefty returns. Good luck and good hunting. The Worst Calls Of 2018 A forecasting mistake is wasted if one learns nothing from the error. This is why we take our mistakes seriously and why we always begin the report card with our zingers. Our overall performance in 2018 was … one of our best. The successes below will testify to this. However, we made three notable errors. A Schizophrenic Russia View Our worst call of the year was to panic and close our long Russian equities relative to emerging markets trade in the face of headline geopolitical risks. In early March, we posited that Russia was a “buy” relative to the broad EM equity index due to a combination of cheap valuations, strong macro fundamentals, orthodox policy, and an end to large-scale geopolitical adventurism. This call ultimately proved to be correct (Chart 1). Chart 1Russian Stocks Outperformed In The End
Russian Stocks Outperformed In The End
Russian Stocks Outperformed In The End
What went wrong? The main risk to our view, that the U.S. Congress would pursue an anti-Russia agenda regardless of any Russian sympathies in the Trump White House, materialized in the wake of the poisoning of former Russian military intelligence officer Sergei Skripal with a Novichok nerve agent in the United Kingdom. As fate would have it, the incident occurred just before our bullish report went to clients! The ensuing international uproar and sanctions caused a selloff. Our bullish thesis did not rest exclusively on geopolitics, but a thaw in West-Russia relations did form the main pillar of the view. Our Russia Geopolitical Risk Index, which had served us well in the past, was pricing as low of a level of geopolitical risk as one could hope for in the post-Crimea environment (Chart 2). Naturally the measure jumped into action following the Skripal incident. Chart 2Geopolitical Risk Was Low Prior To Skripal
Geopolitical Risk Was Low Prior To Skripal
Geopolitical Risk Was Low Prior To Skripal
The timing of our call was therefore off, but we should have stuck with the overall view. The U.S. imposed preliminary sanctions that lacked teeth. While Washington accepted the U.K.’s assessment that Moscow was behind the poisoning, the weakness of the sanctions also signaled that the U.S. did not consider the incident worthy of a tougher position. There are now two parallel sanction processes under way. The first round of sanctions announced in August gave Russia 90 days to comply and adopt “remedial measures” regarding the use of chemical and biological weapons. On November 9, the U.S. State Department noted that Russia had not complied with the deadline. The U.S. is now expected to impose a second round of sanctions that will include at least three of six punitive actions: Opposition to development aid and assistance by international financial institutions (think the IMF and the World Bank); Downgrading diplomatic relations; Additional restrictions on exports to Russia (high-tech exports have already been barred by the first round of sanctions); Restrictions on imports from Russia; A ban on landing rights in the U.S. for Russian state-owned airlines; Prohibiting U.S. banks from purchasing Russian government debt. While the White House was expected to have such sanctions ready to go on the November 9 deadline, it has dragged its feet for almost two months now. This suggests that President Trump continues to hold out for improved relations with President Putin. A visit by President Putin to Washington remains possible in Q1 2019. As such, we would expect the White House to adopt some mix of the first five items on the above list, hardly a crushing response from Moscow’s perspective. The U.S. Congress, however, has a parallel process in the form of the Defending American Security from Kremlin Aggression Act of 2018 (DASKAA). Introduced in August by Senator Lindsey Graham, a Russia hawk, the legislation would put restrictions on Americans buying Russian sovereign debt and curb investments in Russian energy projects. The bill also includes secondary sanctions on investing in the Russian oil sector, which would potentially ensnare European energy companies collaborating with Russia in the energy sector. There was some expectation that Congress would take up the bill ahead of the midterm election, but nothing came of it. Even with the latest incident – the seizing of two Ukrainian naval vessels in the Kerch Strait – we have yet to see action. While we expect the U.S. to do something eventually, the White House approach is likely to be tepid while the congressional approach may be too draconian to pass into law. And with Democrats about to take over the House, and likely demand even tougher sanctions against Russia, the ultimate legislation may be too bold for President Trump to sign into legislation. The point is that Russia has acted antagonistically towards the West in 2018, but in small enough increments that the response has been tepid. Given the paucity of Russian financial and trade links with the U.S., Washington’s sanctions would only bite if they included the dreaded “secondary sanction” implications for third party sovereigns and firms – particularly European, which do have a lot of business in Russia. This is highly unlikely without major Russian aggression. We cannot completely ignore the potential for such aggression in 2019, especially with President Putin’s popularity in the doldrums (Chart 3) and a contentious Ukrainian election due for March 31. However, we outlined the constraints against Russia in 2014, amidst the Ukrainian crisis, and we do not think that these constraints have been reduced (they may have only grown since then). Chart 3Non-Negligible Risk Of Russian Aggression
Non-Negligible Risk Of Russian Aggression
Non-Negligible Risk Of Russian Aggression
Regardless of the big picture for 2019, we could have faded the risks in 2018 and stuck to the fundamentals. Russia is up 17.2% against EM year-to-date. The lesson here, therefore, is to find re-entry points into a well-founded view despite market volatility. Chart 1 shows that Russian equities climbed the proverbial “wall of worry” relative to EM in 2018. Doubting Jair Bolsonaro Our list of mistakes keeps us in the EM universe where we underestimated Jair Bolsonaro’s chances of winning the presidency in Brazil. The answer to the question we posed in the title of our September report – “Brazil: Can The Election Change Anything?” – was a definitive “yes.” Since the publication of that report, BRL/USD is up 2.9% and Brazilian equities are up 18.5% relative to EM (Chart 4). Chart 4Bolsonaro Rally Losing Its Luster Already
Bolsonaro Rally Losing Its Luster Already
Bolsonaro Rally Losing Its Luster Already
To our credit, the question of Bolsonaro’s electoral chances elicited passionate and pointed internal debate. But our clients did not see the internal struggle, just the incorrect external output! A bad call is a bad call, no matter how it is assembled on the intellectual assembly line. That said, we still think that our report is valuable. It sets out the constraints facing Bolsonaro in 2019. He has to convince the left-leaning median voter that meaningful pension reform is needed; bully a fractured Congress into painful structural reforms; and overcome an unforgiving macro context of tepid Chinese stimulus and a strong USD. If the Bolsonaro administration wastes the good will of the investment community over the next six months, we expect the market’s punishment to be swift and painful. In fact, Chart 4 notes that the initial Bolsonaro rally has already lost most of its shine. Brazilian assets are still up since the election, but the gentle slope could become a steep fall if Bolsonaro stumbles. The market is priced for political perfection. To be clear, we are not bearish on Bolsonaro. We believe that, relative to EM, he will be a positive for Brazil. However, the market is currently betting that he will win by two touchdowns, whereas we think he will squeak by with a last-second field goal. The difference between the two forecasts is compelling and we have expressed it by being long MXN/BRL.2 Not Sticking To Our Method In The Case Of Iran Throughout late-2017 and 2018 we pointed out that President Trump’s successful application of “maximum pressure” against North Korea could become a market-relevant risk if he were emboldened to try the same strategy against Iran. For much of the year, this view was prescient. As investors realized the seriousness of President Trump’s strategy, a geopolitical risk premium began to seep into oil prices, as illustrated in Chart 5 by the red bar.
Chart 5
Every time we spoke to clients or published reports on this topic, we highlighted just how dangerous a “maximum pressure” strategy would be in the case of Iran. We stressed that Iran could wreak havoc across Iraq and other parts of the Middle East and even drive up oil prices to the point of causing a “geopolitical recession in 2019.” In other words, we stressed the extraordinary constraints that President Trump would face. To their credit many of our clients called us out on the inconsistency: our market call was über bullish oil prices, while our methodology emphasized constraints over preferences. We were constantly fielding questions such as: Why would President Trump face down such overwhelming constraints? We did not have a very good answer to this question other than that he was ideologically committed to overturning the Iranian nuclear deal. In essence, we doubted President Trump’s own ideological flexibility and realism. That was a mistake and we tip our hat to the White House for recognizing the complex constraints arrayed against it. President Trump realized by October how dangerous those constraints were and began floating the idea of sanction waivers, causing the geopolitical risk premium to drain from the market (Chart 6). To our credit, we highlighted sanction waivers as a key risk to our view and thus took profit on our bullish energy call early. Chart 6Sanction Waivers Caused A Collapse In Oil Prices
Sanction Waivers Caused A Collapse In Oil Prices
Sanction Waivers Caused A Collapse In Oil Prices
That said, our clients have taken the argument further, pointing out that if we were wrong on Trump’s ideological flexibility with Iran, we may be making the same mistake when it comes to China. However, there is a critical difference. Americans are more concerned about conflict with North Korea than with Iran (Chart 7), while China is the major concern about trade (Chart 8).
Chart 7
Chart 8
Second, railing against the Iran deal did not get President Trump elected, whereas his protectionist rhetoric – specifically regarding China – did (Chart 9). Getting anything less than the mother-of-all-deals with Beijing will draw down Trump’s political capital ahead of 2020 and open him to accusations of being “weak” and “surrendering to China.” These are accusations that the country’s other set of protectionists – the Democrats – will wantonly employ against him in the next general election. Chart 9Protectionism, Not Iran, Helped Trump Get Elected
Protectionism, Not Iran, Helped Trump Get Elected
Protectionism, Not Iran, Helped Trump Get Elected
Ultimately, if we have to be wrong, we are at least satisfied that our method stood firm in the face of our own fallibility. We are doubly glad to see our clients using our own method against our views. This is precisely what we wanted to accomplish when we began BCA’s Geopolitical Strategy in March 2012: to revolutionize finance by raising the sophistication with which it approaches geopolitics. That was a lofty goal, but we do not pretend to hold the monopoly on our constraint-based methodology. In the end, our market calls did not suffer due to our error. We closed our long EM energy-producer equities / EM equities for a gain of 4.67% and our long Brent / short S&P 500 for a gain of 6.01%. However, our latter call, shorting the S&P 500 in September, was based on several reasons, including concerns regarding FAANG stocks, overstretched valuations, and an escalation of the trade war. Had we paired our S&P 500 short with a better long, we would have added far more value to our clients. It is that lost opportunity that has kept us up at night throughout this quarter. We essentially timed the S&P 500 correction, but paired it with a wayward long. The Best Calls Of 2018 BCA’s Geopolitical Strategy had a strong year. We are not going to list all of our calls here, but only those most relevant to our clients. Our best 2018 forecast originally appeared in 2017, when in April of that year we predicted that “Political Risks Are Understated In 2018.” Our reasoning was bang on: U.S. fiscal policy would turn strongly stimulative (the tax cuts would pass and Trump would be a big spender) and thus cause the Fed to turn hawkish and the USD to rally, tightening global monetary policy; Trump’s trade war would re-emerge in 2018; China would reboot its structural reform efforts by focusing on containing leverage, thus tightening global “fiscal” policy. In the same report we also predicted that Italian elections in 2018 would reignite Euro Area breakup risks, but that Italian policymakers would ultimately be found to be bluffing, as has been our long-running assertion. Throughout 2018, our team largely maintained and curated the forecasts expressed in that early 2017 report. We start the list of the best calls with the one call that was by far the most important for global assets in 2018: economic policy in China. The Chinese Would Over-Tighten, Then Under-Stimulate Getting Chinese policy right required us, first, to predict that policy would bring negative economic surprises this year, and second, once policy began to ease, to convince clients and colleagues that “this time would be different” and the stimulus would not be very stimulating. In other words, this time, China would not panic and reach for the credit lever of the post-2008 years (Chart 10), but would maintain its relatively tight economic, financial, environmental, and macro-prudential oversight, while easing only on the margin. Chart 10No Massive Credit Stimulus In 2018
No Massive Credit Stimulus In 2018
No Massive Credit Stimulus In 2018
This is precisely what occurred. BCA Foreign Exchange Strategy’s “China Play Index,” which is designed to capture any reflation out of Beijing, collapsed in 2018 and has hardly ticked up since the policy easing announced in July (Chart 11). Chart 11Weak Reflation Signal From China
Weak Reflation Signal From China
Weak Reflation Signal From China
Our view was based on an understanding of Chinese politics that we can confidently say has been unique: From March 2017, we highlighted the importance of the 2017 October Party Congress, arguing that President Xi Jinping would consolidate his power and redouble his attempts to “reform” the economy by reining in dangerous imbalances. We explicitly characterized the containment of leverage as the most market-relevant reform to focus on. We stringently ignored the ideological debate about the nature of reform in China, focusing instead on the major policy changes afoot. We identified very early on how the rising odds of a U.S.-China conflict would embolden Chinese leadership to double-down on painful structural reforms. Will China maintain this disciplined approach in 2019? That is yet to be seen. But we are arming ourselves and clients with critical ways to identify when and whether Beijing’s policy easing transforms into a full-blown “stimulus overshoot”: First, we need to see a clear upturn in shadow financing to believe that the Xi administration has given up on preventing excess debt. Assuming that such a shift occurs, and that overall credit improves, it will enable us to turn bullish on global growth and global risk assets on a cyclical, i.e., not merely tactical, horizon (Chart 12). Chart 12A Shadow Lending Surge Would Mean A Big Policy Shift
A Shadow Lending Surge Would Mean A Big Policy Shift
A Shadow Lending Surge Would Mean A Big Policy Shift
Second, our qualitative checklist will need to see a lot more “checks” in order to change our mind. Short of an extraordinary surge in bank and shadow bank credit, there needs to be a splurge in central and especially local government spending (Table 1). The mid-year spike in local governments’ new bond issuance in 2018 was fleeting and fell far short of the surge that initiated the large-scale stimulus of 2015. Frontloading these bonds in 2019 will depend on timing and magnitude. Table 1A Credit Splurge, Or Government Spending Splurge, Is Necessary For Stimulus To Overshoot
BCA Geopolitical Strategy 2018 Report Card
BCA Geopolitical Strategy 2018 Report Card
Third, we would need to see President Xi Jinping make a shift in rhetoric away from the “Three Battles” of financial risk, pollution, and poverty. Having identified systemic financial risk as the first of the three ills, Xi needs to make a dramatic reversal of this three-year action plan if he is to clear the way for another credit blowout. Trade War Would Reignite In 2018 It paid off to stick with our trade war alarmism in 2018. We correctly forecast that the U.S. and China would collide over trade and that their initial trade agreement – on May 20 – was insubstantial and would not last. In the event it lasted three days. Our one setback on the trade front was to doubt the two sides would agree to a trade truce at the G20. However, by assigning a subjective 40% probability, we correctly noted the fair odds of a truce. We also insisted that any truce would be temporary, which ended up being the case. We may yet be vindicated if the March 1 deadline produces no sustainable deal, as we forecast in last week’s Strategic Outlook. That said, correct geopolitical calls do not butter our bread at BCA. Rather, we are paid to make market calls. To that end, we would point out that we correctly assessed the market-relevance of the trade conflict, fading S&P 500 risks and focusing on the effect on global risk assets. Will this continue into 2019? We think so. We do not see trade conflict as the originator of ongoing market turbulence (Chart 13) and would expect the U.S. to outperform global equities again over the course of 2019 (Chart 14). This view may appear wrong in Q1, as the market digests the Fed backing off from hawkish rhetoric, the ongoing trade negotiations, and the likely seasonal uptick in Chinese credit data in the beginning of the calendar year. Chart 13Yields, Not Trade War, Drove Stocks
Yields, Not Trade War, Drove Stocks
Yields, Not Trade War, Drove Stocks
Chart 14U.S. Stocks Will Resume Outperformance
U.S. Stocks Will Resume Outperformance
U.S. Stocks Will Resume Outperformance
However, any stabilization in equity markets would likely serve to ease financial conditions in the U.S., where economic and inflation conditions remain firmly in tightening territory (Chart 15). As such, the Fed pause is likely to last no more than a quarter, maybe two at best, leading to renewed carnage in global risk assets if our view on Chinese policy stimulus – tepid – remains valid through the course of 2019. Chart 15If Financial Conditions Ease, Tightening Will Be Back On
If Financial Conditions Ease, Tightening Will Be Back On
If Financial Conditions Ease, Tightening Will Be Back On
Europe (All Of It… Again) In 2017, our forecasting track record for Europe was stellar. This continued in 2018, with no major setbacks: Populism in Italy: Our long-held view has been that Europe’s chief remaining risks lay in Italian populists coming to power. We predicted in 2016 that this would eventually happen and that they would then be proven to be bluffing. This is essentially what happened in 2018. Matteo Salvini’s Lega is surging in the polls because its leader has realized that a combination of hard anti-immigrant policy and the softest-of-soft Euroskepticism is a winning combination. We believe that investors can live with this combination. Our only major fault in forecasting European politics and assets this year was to close our bearish Italy call too early: we booked our long Spanish / short Italian 10-year government bond trade for a small loss in August, before the spread between the two Mediterranean countries blew out to record levels. That missed opportunity could have also made it on our “worst calls” list as well.
Chart 16
Pluralism in Europe: To get the call on Italy right, we had to dabble in some theoretical work. In a somewhat academic report, we showed that political concentration was on the decline in the developed world (Chart 16), but especially in Europe (Chart 17). Put simply, lower political concentration suggests that a duopoly between the traditional center-left and center-right parties is breaking down. Contrary to the conventional wisdom, we argued that Europe’s parliamentary systems would enable centrist parties to adopt elements of the populist agenda, particularly on immigration, without compromising the overall stability of European institutions. As such, political pluralism, or low political concentration, is positive for markets.
Chart 17
Immigration crisis is over: For centrist parties to be able to successfully adopt populist immigration policy, they needed a pause in the immigration crisis. This was empirically verifiable in 2018 (Chart 18). Chart 18European Migration Crisis Is Over
European Migration Crisis Is Over
European Migration Crisis Is Over
Merkel’s time has run out: Since early 2017, we had cautioned clients that Angela Merkel’s demise was afoot, but that it would be an opportunity, rather than a risk, when it came. It finally happened in 2018 and it was not a market moving event. The main question for 2019 is whether German policymakers, and Europe as a whole, will use the infusion of fresh blood in Berlin to reaccelerate crucial reforms ahead of the next global recession. Brexit: Since early 2016, we have been right on Brexit. More specifically, we were corrent in cautioning investors that, were Brexit to occur, “the biggest loser would be the Conservative Party, not the EU.” As with the previous two Conservative Party prime ministers, it appears that the question of the U.K.’s relationship with the EU has completely drained any political capital out of Prime Minister Theresa May’s reign. We suspect that the only factor propping up the Tories in the polls is that Jeremy Corbyn is the leader of Her Majesty’s Most Loyal Opposition. We have also argued that soft Brexit would ultimately prove to be “illogical” and that “Bregret” would begin to seep in, as it now most clearly has. We parlayed these rising geopolitical risks and uncertainties by shorting cable in the first half of the year for a 6.21% gain. Malaysia Over Turkey And India Over Brazil Not all was lost for our EM calls this year. We played Malaysia against Turkey in the currency markets for a 17.44% gain, largely thanks to massively divergent governance and structural reform trajectories after Malaysia’s opposition won power for the first time in the country’s history. Second, we initiated a long Indian / short Brazilian equity view in March that returned 27.54% by August. This was a similar play on divergent structural reforms, but it was also a way to hedge our alarmist view on trade. Given India’s isolation from global trade and insular financial markets, we identified India as one of the EM markets that would remain aloof of protectionist risks. We could have closed the trade earlier for greater gain, but did not time the exit properly. Midterm Election: A Major Democratic Victory Our midterm election forecast was correct: Democrats won a substantial victory. Even our initial call on the Senate, that Democrats had a surprisingly large probability of picking up seats, proved to be correct, with Republicans eking out just two gains in a year when Democrats were defending 10 seats in states that Trump carried in 2016. What about our all-important call that the election would have no impact on the markets? That is more difficult to assess, given that the S&P 500 has in fact collapsed in the lead-up to and aftermath of the election. However, we see little connection between the election outcome and the stock market’s performance. Neither do our colleagues or clients, who have largely stopped asking about the Democrats’ policy designs. In 2019, domestic politics may play a role in the markets. Impeachment risk is low, but, if it rears its head, it could prompt President Trump to seek relevance abroad, as his predecessors have done when they lost control of domestic policy. In addition, the Democratic Party’s sweeping House victory may suggest a political pendulum swing to the left in the 2020 presidential election. We will discuss both risks as part of our annual Five Black Swans report in early 2019. U.S. domestic politics was a collection of Red Herrings during much of President Obama’s presidency, and has produced strong tailwinds under President Trump (tax cuts in particular). This may change in 2019, with considerable risk to investors, and asset prices, ahead. Marko Papic, Senior Vice President Chief Geopolitical Strategist marko@bcaresearch.com Matt Gertken, Vice President Geopolitical Strategy mattg@bcaresearch.com Roukaya Ibrahim, Editor/Strategist roukayai@bcaresearch.com Ekaterina Shtrevensky, Research Analyst ekaterinas@bcaresearch.com Footnotes 1 For our 2019 Outlook, please see BCA Geopolitical Strategy Strategic Outlook, “2019 Key Views: Balanced On A Knife’s Edge,” dated December 14, 2018, available at gps.bcaresearch.com. For our past Strategic Outlooks, please visit gps.bcaresearch.com. 2 In part we like this cross because we also think that Mexico’s newly elected president, Andrés Manuel López Obrador, is priced to lose by two touchdowns, whereas he may merely lose by a last-second field goal.
Highlights Dear Clients, This is the final publication for the year, in which we recap some of the key developments in 2018. We will resume our regular publishing schedule on January 2, 2019 with a Special Report on urbanization/industrialization. The China Investment Strategy team wishes you a very happy holiday season and a prosperous New Year! Best regards, Jonathan LaBerge, CFA, Vice President Special Reports The evidence over the past year raises the odds that China’s economy has entered a multi-year period of frequent mini-cycles. A mini-cycle world would be a difficult one for investors to navigate, particularly if the boom and bust phases are asymmetrical in length or magnitude. There is no magic wand to quickly transform China into a services-oriented economy, and it is not clear that the gains in tertiary sector GDP since 2010 are sustainable. A slow transition would raise deep questions about China’s growth model over the coming 2-3 years, and would create a major dilemma for policymakers. Chinese stocks are considerably cheaper than they were a year ago, yet they may be cheap for a reason (even over the very long term). On a risk-adjusted basis, we do not find the value proposition to be compelling, meaning that our recommended multi-year allocation to Chinese stocks is neutral barring even lower prices or tangible evidence of successful structural reforms. Feature Following the publication of our special year end Outlook report for 2019,1 BCA's China Investment Strategy service recently expanded on our global view by outlining our three key themes for China over the coming year.2 As a year-end tradition, we dedicate this week's report to recapping some important developments of the past year and their longer-term implications. Mini-Cycles, And The Policy Trade-Off Between Growth And Leveraging Over the past year we have described the progression of Chinese growth as part of an economic “mini-cycle”, one that actually began in early-2014 (we have focused on the expansion period of the cycle that started in mid-2015). While this is the first clear mini-cycle in China after a prolonged period of slowing activity that followed the enormous stimulus of 2008/2009, many investors and market participants have speculated about whether these types of events will become more prevalent in the future. In a March 2017 BCA Special Report,3 my colleague Arthur Budaghyan speculated about the potential for such cycles within the context of a falling primary growth trend. Arthur’s argument was that cyclical growth could hold up in China over the coming few years only if the government allows credit growth to continue booming, but that this would entail creeping socialism/statism that would cripple the country’s productivity and thus its potential growth. In fact, the experience of the past three years suggests that mini-cycles may occur over the coming few years even if policymakers do try to prevent a falling primary growth trend. Chart 1 shows that the slowdown in domestic demand that investors only began to price in the middle of this year has clearly been caused by a slowing in money & credit growth (as represented by our leading indicator), which in turn strongly appears to have occurred because of monetary tightening that began at the end of 2016 (panel 2). This tightening has been closely linked to the government’s attempt to de-risk the financial sector. Chart 1Tighter Monetary Policy Caused The Recent Mini-Cycle Slowdown
Tighter Monetary Policy Caused The Recent Mini-Cycle Slowdown
Tighter Monetary Policy Caused The Recent Mini-Cycle Slowdown
In addition, we presented evidence in our August 29 Special Report suggesting that Chinese state-owned enterprises (SOEs) now have a negative net return on borrowed funds (Chart 2), underscoring that Chinese authorities now face a policy trade-off between growth and leveraging.4 The inference is that investors can expect more of these episodes so long as policymakers stay committed to reforming the financial sector, a policy that appears to remain a strong priority of the Xi government. Chart 2SOEs Now Have A Negative Net Return On Borrowed Funds
SOEs Now Have A Negative Net Return On Borrowed Funds
SOEs Now Have A Negative Net Return On Borrowed Funds
Chart 3 presents three stylized scenarios as a possible multi-year roadmap for investors faced with a “mini-cycle world”. Scenario 1 represents the pessimistic case articulated by Arthur, a set of frequent cycles occurring against the backdrop of a falling primary (or potential growth) trend. Scenarios 2 and 3 represent possible outcomes emerging from successful structural reform: in scenario 2 the downtrend in potential growth is arrested and the primary growth trend becomes flat, whereas scenario 3 depicts the optimistic case, where reform initiatives unleash productivity gains that result in a net increase in potential growth. In both scenarios 2 and 3, the frequency of economic cycles is reduced to be more akin to that of typical business cycles in the developed world, ending the more rapid mini-cycle phase that preceded the success of the reforms. Chart 3A Potential Roadmap For Investors Living In A "Mini-Cycle World"
A Potential Roadmap For Investors Living In A "Mini-Cycle World"
A Potential Roadmap For Investors Living In A "Mini-Cycle World"
For an investor primarily concerned with cyclical asset allocation, one response to Chart 3 might be that any of the scenarios are acceptable because there is money to be made in each case by shifting one’s investment stance in advance of key inflection points. However, as Arthur alluded to in last year’s report, the cycles depicted in Chart 3 are highly stylized and will not repeat themselves over regular, predictable intervals. In addition, even in scenarios 2 and 3, the higher frequency of oscillations depicted in the chart prior to the positive impact of structural reforms means that a mini-cycle world will be a difficult one for investors to navigate, particularly if the boom and bust phases are asymmetrical in length or magnitude. From a longer-term perspective, Chart 3 clearly outlines two key questions that investors should be asking themselves about China if we truly have entered a multi-year period of frequent mini-cycles: Is there tangible evidence of a falling primary growth trend in China, and can this be detected ex-ante rather than ex-post? What are the markers for successful structural reform, and how can progress be tracked in real-time? These are of course difficult questions to answer, and our thoughts are likely to evolve as more evidence presents itself. However, for now, we note the following: Chart 4 presents some evidence of declining potential growth in China, or more precisely a decline in the natural rate of interest. The chart shows that the rise in the weighted average lending rate since late-2016 was relatively minor compared with levels that have prevailed over the past decade, and yet it is clear that it succeeded in materially slowing the investment-driven sectors of China’s economy. Chart 4There Is Some Evidence That China's Natural Rate Of Interest Has Declined
There Is Some Evidence That China's Natural Rate Of Interest Has Declined
There Is Some Evidence That China's Natural Rate Of Interest Has Declined
We also presented some evidence in our November 21 Weekly Report showing that China’s monetary policy transmission mechanism is impaired.5 Chart 5 shows that the recent decline in interbank repo rates implies that average lending rates are set to decline materially over the coming months; measuring the strength of the reaction in the old economy to this decline will provide investors with another crucial observation about the responsiveness of the economy to interest rates. Chart 5More Information On The Responsiveness Of The Economy To Interest Rates Will Soon Emerge
More Information On The Responsiveness Of The Economy To Interest Rates Will Soon Emerge
More Information On The Responsiveness Of The Economy To Interest Rates Will Soon Emerge
Concerning potential signposts of successful structural reform, signs that the government is about to undertake a big-bang cleanup and reorganization of China’s SOEs, one that involves the large-scale transfer of bad SOE debts to the public sector, would obviously be the primary event for investors to watch for. We assume that this will not occur over the coming few years barring a major crisis. At the firm level, non-trivial deleveraging, privatization/incorporation, material capital injection/withdrawal, material divestment of non-core fixed assets and (to a lesser degree) reduction in the wage bill relative to the industry have all shown themselves to be significantly related to the odds of a “zombie” firm returning to a healthy financial state.6 Even quiet signs that SOEs may be going through this process would be a positive indication of the potential for reform. At the macro level, our signposts of successful structural reform would be indications that SOE return on assets is set to rise back above borrowing costs (because of a material rise in the former, not a significant decline in the latter), tangible evidence of passive deleveraging (debt to nominal GDP falling because of a sustained rise in the latter), and a structural rise in the presence of private firms in China’s economy. Chart 6 shows that, at least in the case of the latter, progress appears elusive. Chart 6The Size Of The Private Sector In China Is Now Moving In The Wrong Direction
The Size Of The Private Sector In China Is Now Moving In The Wrong Direction
The Size Of The Private Sector In China Is Now Moving In The Wrong Direction
Over the shorter-term, global investors are strongly focused on whether we are about to enter another mini-cycle upswing, a view that we have recently argued against. We presented our base case view for 2019 in our December 5 Weekly Report2, which is that growth will modestly firm in the second half of 2019 and will provide a somewhat stronger demand backdrop for commodities and emerging economies that sell goods to China. But we underscore that the character of the improvement is likely to be materially different than what occurred in 2016, implying that investors betting on substantial returns from China-related financial assets next year are likely to be disappointed. Transitioning To A Services-Oriented Economy: There Is No Magic Wand Part of the structural reform agenda articulated by Xi Jinping involves transitioning China's economy towards the tertiary sector (services). Services activity, in general, tends to have higher added value than manufacturing, construction, and raw material extraction, and it is hoped that a more services-oriented economy will increase China’s per capita GDP and help the country escape the middle-income trap. Chinese policymakers have been very clear about their intention to promote this shift and have emphasized their need to do so quickly, but have not been very clear about how they plan to do so. Admittedly, there is some evidence to suggest that this trend has already begun: Chart 7 shows that tertiary industry GDP has risen as a share of overall GDP by about 7.5 percentage points since 2010, tertiary industry electricity consumption as a share of total is rising steadily, and the market capitalization of information and communication technology-related sectors has risen in China’s domestic and investable equity market (sharply in the case of the latter).7 Chart 7Some Signs Of A Move Towards Services...
Some Signs Of A Move Towards Services...
Some Signs Of A Move Towards Services...
However, BCA’s China Investment Strategy service has been and remains quite skeptical about the likely pace of this transition, which raises deep questions about China’s growth model over the coming 2-3 years: Chart 8 breaks down the increase in tertiary industry GDP as a share of total from 2010 – 2017 into individual sectors.8 The chart shows that finance-related sectors (financial intermediation, leasing & business services, and real estate) accounted for nearly half of the increase in services GDP over the period. It seems difficult to expect that this trend will continue in an environment where the government is trying to contain financial sector risk.
Chart 8
Chart 8 shows that tech-related sectors accounted for the second largest increase in tertiary industry GDP over the period, which is not surprising given the data shown in panel 3 of Chart 7. However, there are three problems with assuming that China’s tech sector will expand at a very rapid pace from current levels. First, Chart 9 makes it clear that the incubation period for China’s largest two technology companies by market capitalization was quite long. Alibaba and Tencent were both formed nearly 20 years ago, and only recently gained significant traction. Second, neither of these firms appears to have succeeded because of Chinese industrial policy, underscoring the importance of dynamic, competitive, private markets in driving innovation. Third, other successful examples of “breakthrough” state support for industries show that the process is not a rapid one. In the U.S. between 1978 and 1992, the U.S. Department of Energy invested in the Eastern Gas Shale Program, which contributed somewhat to the development of fracking technology used in shale oil & gas production today. Chart 10 shows how long it took for this program to bear fruit: gas production began to trend higher 12 years after the end of the program, whereas it took nearly two decades for oil production to begin to move higher. And even in this case, the role of private industry in commercializing the technology was overwhelmingly dominant. Chart 9The Incubation Period Of China's Major Tech Success Stories Was Quite Long
The Incubation Period Of China's Major Tech Success Stories Was Quite Long
The Incubation Period Of China's Major Tech Success Stories Was Quite Long
Chart 10The Dividends From State-Assisted R&D Can Take A Long Time To Occur
The Dividends From State-Assisted R&D Can Take A Long Time To Occur
The Dividends From State-Assisted R&D Can Take A Long Time To Occur
It is encouraging to see that education spending in China has increased as a share of GDP over the past several years, as services activity typically requires a highly educated workforce as an input. But China’s post-secondary educational attainment (defined here as the share of 25-34 year olds with tertiary education) appears to be too low to make a meaningful leap over the next 2-3 years (Chart 11). We acknowledge that China’s educational achievement ranks quite highly relative to the world, and this speaks to the high quality of skilled labor in China. However, for now, China’s attainment rate appears to be too low for the country to rapidly shift to services.
Chart 11
Finally, Chart 12 shows that while tertiary industry electricity consumption is rising as a share of total, it remains small compared with secondary industry consumption. This underscores that China’s shift to a truly-services oriented economy is something that will take a considerable amount of time. What does a slow transition from secondary to tertiary industry mean for investors? To us, it either raises the risk that: Chart 12A Long Way To Go
A Long Way To Go
A Long Way To Go
policymakers will have to rely on China’s old growth model for longer than they intend, or that Chinese growth will slow considerably more over the coming few years than investors currently expect. In the first case, policymakers may be on a collision course with the reality of poor financial health among SOEs, which as we noted earlier already have a negative net return from leveraging. In the second case, the threat is clear: China’s contribution to global growth could decline sharply, with potentially severe consequences for China-related financial assets. Cheap(er) Chinese Stocks: A Great Long-Term Buying Opportunity? We have received several questions from clients over the past few months asking whether they have been presented with a great long-term buying opportunity for Chinese stocks, even if cyclical economic conditions are set to weaken from current levels. Chart 13In The U.S., Valuation Predicts Long-Term Returns Quite Successfully
In The U.S., Valuation Predicts Long-Term Returns Quite Successfully
In The U.S., Valuation Predicts Long-Term Returns Quite Successfully
This is a valid line of inquiry. Over a 6-12 month time horizon, valuation rarely drives asset returns, and we recently argued against the view that valuation could act as an overwhelming rally catalyst for Chinese stocks in 2019. However, we agree that valuation should be increasingly considered as one’s time horizon expands. Chart 13 shows that valuation has been a powerful predictor of 10-year future performance for the U.S. equity market, and Chart 14 shows that the forward P/E ratio for both domestic and investable Chinese stocks has certainly improved over the past several months. In relative terms, Chinese stocks are not as cheap as they have ever been, but haven’t usually been cheaper (at least over the past decade). This is particularly true for the A-share market (Chart 15). Chart 14Chinese Stocks Are Now Considerably Cheaper Than A Year Ago...
Chinese Stocks Are Now Considerably Cheaper Than A Year Ago...
Chinese Stocks Are Now Considerably Cheaper Than A Year Ago...
Chart 15...Although They Have Been Cheaper In Relative Terms
...Although They Have Been Cheaper In Relative Terms
...Although They Have Been Cheaper In Relative Terms
We struggle to answer the question, because while valuation usually predicts future returns quite well, deviations from this relationship can exist. Chart 13 shows that material differences between the actual and predicted 10-year returns existed during the 1970s/early-1980s and as well during the late-1990s, and would have as well in 2008/2009 had the valuation extremes of the late-1990s not lined up so well with the timing of the global financial crisis a decade later. In short, cheap stocks can be cheap for a reason, and the structural issues that we noted above certainly highlight the potential for the next 10-years of Chinese equity market performance to be anomalous relative to what would normally be implied by current valuation. For now, the best answer we can provide is that Chinese stocks are a great long-term buy for investors who do not share our structural concerns. On a risk-adjusted basis, we do not find the value proposition to be compelling, meaning that our recommended multi-year allocation to Chinese stocks is neutral. But we will be watching closely over the coming few years for signs of successful structural reform as detailed above, and we are likely to upgrade our structural recommendation on any material progress, particularly if that progress involves a cyclical deterioration in the economy that further cheapens equities. Stay tuned! Jonathan LaBerge, CFA, Vice President Special Reports jonathanl@bcaresearch.com Footnotes 1 Pease see The Bank Credit Analyst “OUTLOOK 2019: Late-Cycle Turbulence”, dated November 27, 2018, available at cis.bcaresearch.com. 2 Pease see China Investment Strategy Weekly Report “2019 Key Views: Four Themes For China In The Coming Year”, dated December 5, 2018, available at cis.bcaresearch.com. 3 Pease see China Investment Strategy Special Report “The Great Debate: Does China Have Too Much Debt Or Too Much Savings? ”, dated March 23, 2017, available at cis.bcaresearch.com. 4 Pease see China Investment Strategy Special Report “Chinese Policymakers: Facing A Trade-Off Between Growth And Leveraging”, dated August 29, 2018, available at cis.bcaresearch.com. 5 Pease see China Investment Strategy Weekly Report “Trade Is Not China’s Only Problem”, dated November 21, 2018, available at cis.bcaresearch.com. 6 IMF Working Paper WP/17/266 “Resolving China’s Zombies: Tackling Debt and Raising Productivity” 7 Note that we have included the consumer discretionary sector in Chart 8 owing to the recent GICS sector changes that have included e-commerce providers such as Alibaba in the discretionary sector. 8 Note that 2016 is the most recent data point for healthcare & social security, education, scientific research & technology services, public management & social organizations, and miscellaneous others. However, their change from 2010 – 2017 reflects almost all of the change in the sum of these categories from 2010 – 2017. Cyclical Investment Stance Equity Sector Recommendations
Highlights So What? Our best and worst calls of 2018 cast light on our methodology and 2019 forecasts. Why? Our clients took us to task for violating our own methodology on the Iranian oil sanctions. Sticking to our guns would have paid off with long Russian equities versus EM. We correctly called China’s domestic policy, the U.S.-China trade war, Europe, the U.S. midterms, and relative winners in emerging markets. Feature It has been a tradition for BCA’s Geopolitical Strategy, since our launch in 2012, to highlight our best and worst forecasts of the year.1 This will also be the final publication of the year, provided that there is no global conflagration worthy of a missive between now and January 9, when we return to our regular publication schedule. We wish all of our clients a great Holiday Season. And especially all the very best in 2019: lots of happiness, health, and hefty returns. Good luck and good hunting. The Worst Calls Of 2018 A forecasting mistake is wasted if one learns nothing from the error. This is why we take our mistakes seriously and why we always begin the report card with our zingers. Our overall performance in 2018 was … one of our best. The successes below will testify to this. However, we made three notable errors. A Schizophrenic Russia View Our worst call of the year was to panic and close our long Russian equities relative to emerging markets trade in the face of headline geopolitical risks. In early March, we posited that Russia was a “buy” relative to the broad EM equity index due to a combination of cheap valuations, strong macro fundamentals, orthodox policy, and an end to large-scale geopolitical adventurism. This call ultimately proved to be correct (Chart 1). Chart 1Russian Stocks Outperformed In The End
Russian Stocks Outperformed In The End
Russian Stocks Outperformed In The End
What went wrong? The main risk to our view, that the U.S. Congress would pursue an anti-Russia agenda regardless of any Russian sympathies in the Trump White House, materialized in the wake of the poisoning of former Russian military intelligence officer Sergei Skripal with a Novichok nerve agent in the United Kingdom. As fate would have it, the incident occurred just before our bullish report went to clients! The ensuing international uproar and sanctions caused a selloff. Our bullish thesis did not rest exclusively on geopolitics, but a thaw in West-Russia relations did form the main pillar of the view. Our Russia Geopolitical Risk Index, which had served us well in the past, was pricing as low of a level of geopolitical risk as one could hope for in the post-Crimea environment (Chart 2). Naturally the measure jumped into action following the Skripal incident. Chart 2Geopolitical Risk Was Low Prior To Skripal
Geopolitical Risk Was Low Prior To Skripal
Geopolitical Risk Was Low Prior To Skripal
The timing of our call was therefore off, but we should have stuck with the overall view. The U.S. imposed preliminary sanctions that lacked teeth. While Washington accepted the U.K.’s assessment that Moscow was behind the poisoning, the weakness of the sanctions also signaled that the U.S. did not consider the incident worthy of a tougher position. There are now two parallel sanction processes under way. The first round of sanctions announced in August gave Russia 90 days to comply and adopt “remedial measures” regarding the use of chemical and biological weapons. On November 9, the U.S. State Department noted that Russia had not complied with the deadline. The U.S. is now expected to impose a second round of sanctions that will include at least three of six punitive actions: Opposition to development aid and assistance by international financial institutions (think the IMF and the World Bank); Downgrading diplomatic relations; Additional restrictions on exports to Russia (high-tech exports have already been barred by the first round of sanctions); Restrictions on imports from Russia; A ban on landing rights in the U.S. for Russian state-owned airlines; Prohibiting U.S. banks from purchasing Russian government debt. While the White House was expected to have such sanctions ready to go on the November 9 deadline, it has dragged its feet for almost two months now. This suggests that President Trump continues to hold out for improved relations with President Putin. A visit by President Putin to Washington remains possible in Q1 2019. As such, we would expect the White House to adopt some mix of the first five items on the above list, hardly a crushing response from Moscow’s perspective. The U.S. Congress, however, has a parallel process in the form of the Defending American Security from Kremlin Aggression Act of 2018 (DASKAA). Introduced in August by Senator Lindsey Graham, a Russia hawk, the legislation would put restrictions on Americans buying Russian sovereign debt and curb investments in Russian energy projects. The bill also includes secondary sanctions on investing in the Russian oil sector, which would potentially ensnare European energy companies collaborating with Russia in the energy sector. There was some expectation that Congress would take up the bill ahead of the midterm election, but nothing came of it. Even with the latest incident – the seizing of two Ukrainian naval vessels in the Kerch Strait – we have yet to see action. While we expect the U.S. to do something eventually, the White House approach is likely to be tepid while the congressional approach may be too draconian to pass into law. And with Democrats about to take over the House, and likely demand even tougher sanctions against Russia, the ultimate legislation may be too bold for President Trump to sign into legislation. The point is that Russia has acted antagonistically towards the West in 2018, but in small enough increments that the response has been tepid. Given the paucity of Russian financial and trade links with the U.S., Washington’s sanctions would only bite if they included the dreaded “secondary sanction” implications for third party sovereigns and firms – particularly European, which do have a lot of business in Russia. This is highly unlikely without major Russian aggression. We cannot completely ignore the potential for such aggression in 2019, especially with President Putin’s popularity in the doldrums (Chart 3) and a contentious Ukrainian election due for March 31. However, we outlined the constraints against Russia in 2014, amidst the Ukrainian crisis, and we do not think that these constraints have been reduced (they may have only grown since then). Chart 3Non-Negligible Risk Of Russian Aggression
Non-Negligible Risk Of Russian Aggression
Non-Negligible Risk Of Russian Aggression
Regardless of the big picture for 2019, we could have faded the risks in 2018 and stuck to the fundamentals. Russia is up 17.2% against EM year-to-date. The lesson here, therefore, is to find re-entry points into a well-founded view despite market volatility. Chart 1 shows that Russian equities climbed the proverbial “wall of worry” relative to EM in 2018. Doubting Jair Bolsonaro Our list of mistakes keeps us in the EM universe where we underestimated Jair Bolsonaro’s chances of winning the presidency in Brazil. The answer to the question we posed in the title of our September report – “Brazil: Can The Election Change Anything?” – was a definitive “yes.” Since the publication of that report, BRL/USD is up 2.9% and Brazilian equities are up 18.5% relative to EM (Chart 4). Chart 4Bolsonaro Rally Losing Its Luster Already
Bolsonaro Rally Losing Its Luster Already
Bolsonaro Rally Losing Its Luster Already
To our credit, the question of Bolsonaro’s electoral chances elicited passionate and pointed internal debate. But our clients did not see the internal struggle, just the incorrect external output! A bad call is a bad call, no matter how it is assembled on the intellectual assembly line. That said, we still think that our report is valuable. It sets out the constraints facing Bolsonaro in 2019. He has to convince the left-leaning median voter that meaningful pension reform is needed; bully a fractured Congress into painful structural reforms; and overcome an unforgiving macro context of tepid Chinese stimulus and a strong USD. If the Bolsonaro administration wastes the good will of the investment community over the next six months, we expect the market’s punishment to be swift and painful. In fact, Chart 4 notes that the initial Bolsonaro rally has already lost most of its shine. Brazilian assets are still up since the election, but the gentle slope could become a steep fall if Bolsonaro stumbles. The market is priced for political perfection. To be clear, we are not bearish on Bolsonaro. We believe that, relative to EM, he will be a positive for Brazil. However, the market is currently betting that he will win by two touchdowns, whereas we think he will squeak by with a last-second field goal. The difference between the two forecasts is compelling and we have expressed it by being long MXN/BRL.2 Not Sticking To Our Method In The Case Of Iran Throughout late-2017 and 2018 we pointed out that President Trump’s successful application of “maximum pressure” against North Korea could become a market-relevant risk if he were emboldened to try the same strategy against Iran. For much of the year, this view was prescient. As investors realized the seriousness of President Trump’s strategy, a geopolitical risk premium began to seep into oil prices, as illustrated in Chart 5 by the red bar.
Chart 5
Every time we spoke to clients or published reports on this topic, we highlighted just how dangerous a “maximum pressure” strategy would be in the case of Iran. We stressed that Iran could wreak havoc across Iraq and other parts of the Middle East and even drive up oil prices to the point of causing a “geopolitical recession in 2019.” In other words, we stressed the extraordinary constraints that President Trump would face. To their credit many of our clients called us out on the inconsistency: our market call was über bullish oil prices, while our methodology emphasized constraints over preferences. We were constantly fielding questions such as: Why would President Trump face down such overwhelming constraints? We did not have a very good answer to this question other than that he was ideologically committed to overturning the Iranian nuclear deal. In essence, we doubted President Trump’s own ideological flexibility and realism. That was a mistake and we tip our hat to the White House for recognizing the complex constraints arrayed against it. President Trump realized by October how dangerous those constraints were and began floating the idea of sanction waivers, causing the geopolitical risk premium to drain from the market (Chart 6). To our credit, we highlighted sanction waivers as a key risk to our view and thus took profit on our bullish energy call early. Chart 6Sanction Waivers Caused A Collapse In Oil Prices
Sanction Waivers Caused A Collapse In Oil Prices
Sanction Waivers Caused A Collapse In Oil Prices
That said, our clients have taken the argument further, pointing out that if we were wrong on Trump’s ideological flexibility with Iran, we may be making the same mistake when it comes to China. However, there is a critical difference. Americans are more concerned about conflict with North Korea than with Iran (Chart 7), while China is the major concern about trade (Chart 8).
Chart 7
Chart 8
Second, railing against the Iran deal did not get President Trump elected, whereas his protectionist rhetoric – specifically regarding China – did (Chart 9). Getting anything less than the mother-of-all-deals with Beijing will draw down Trump’s political capital ahead of 2020 and open him to accusations of being “weak” and “surrendering to China.” These are accusations that the country’s other set of protectionists – the Democrats – will wantonly employ against him in the next general election. Chart 9Protectionism, Not Iran, Helped Trump Get Elected
Protectionism, Not Iran, Helped Trump Get Elected
Protectionism, Not Iran, Helped Trump Get Elected
Ultimately, if we have to be wrong, we are at least satisfied that our method stood firm in the face of our own fallibility. We are doubly glad to see our clients using our own method against our views. This is precisely what we wanted to accomplish when we began BCA’s Geopolitical Strategy in March 2012: to revolutionize finance by raising the sophistication with which it approaches geopolitics. That was a lofty goal, but we do not pretend to hold the monopoly on our constraint-based methodology. In the end, our market calls did not suffer due to our error. We closed our long EM energy-producer equities / EM equities for a gain of 4.67% and our long Brent / short S&P 500 for a gain of 6.01%. However, our latter call, shorting the S&P 500 in September, was based on several reasons, including concerns regarding FAANG stocks, overstretched valuations, and an escalation of the trade war. Had we paired our S&P 500 short with a better long, we would have added far more value to our clients. It is that lost opportunity that has kept us up at night throughout this quarter. We essentially timed the S&P 500 correction, but paired it with a wayward long. The Best Calls Of 2018 BCA’s Geopolitical Strategy had a strong year. We are not going to list all of our calls here, but only those most relevant to our clients. Our best 2018 forecast originally appeared in 2017, when in April of that year we predicted that “Political Risks Are Understated In 2018.” Our reasoning was bang on: U.S. fiscal policy would turn strongly stimulative (the tax cuts would pass and Trump would be a big spender) and thus cause the Fed to turn hawkish and the USD to rally, tightening global monetary policy; Trump’s trade war would re-emerge in 2018; China would reboot its structural reform efforts by focusing on containing leverage, thus tightening global “fiscal” policy. In the same report we also predicted that Italian elections in 2018 would reignite Euro Area breakup risks, but that Italian policymakers would ultimately be found to be bluffing, as has been our long-running assertion. Throughout 2018, our team largely maintained and curated the forecasts expressed in that early 2017 report. We start the list of the best calls with the one call that was by far the most important for global assets in 2018: economic policy in China. The Chinese Would Over-Tighten, Then Under-Stimulate Getting Chinese policy right required us, first, to predict that policy would bring negative economic surprises this year, and second, once policy began to ease, to convince clients and colleagues that “this time would be different” and the stimulus would not be very stimulating. In other words, this time, China would not panic and reach for the credit lever of the post-2008 years (Chart 10), but would maintain its relatively tight economic, financial, environmental, and macro-prudential oversight, while easing only on the margin. Chart 10No Massive Credit Stimulus In 2018
No Massive Credit Stimulus In 2018
No Massive Credit Stimulus In 2018
This is precisely what occurred. BCA Foreign Exchange Strategy’s “China Play Index,” which is designed to capture any reflation out of Beijing, collapsed in 2018 and has hardly ticked up since the policy easing announced in July (Chart 11). Chart 11Weak Reflation Signal From China
Weak Reflation Signal From China
Weak Reflation Signal From China
Our view was based on an understanding of Chinese politics that we can confidently say has been unique: From March 2017, we highlighted the importance of the 2017 October Party Congress, arguing that President Xi Jinping would consolidate his power and redouble his attempts to “reform” the economy by reining in dangerous imbalances. We explicitly characterized the containment of leverage as the most market-relevant reform to focus on. We stringently ignored the ideological debate about the nature of reform in China, focusing instead on the major policy changes afoot. We identified very early on how the rising odds of a U.S.-China conflict would embolden Chinese leadership to double-down on painful structural reforms. Will China maintain this disciplined approach in 2019? That is yet to be seen. But we are arming ourselves and clients with critical ways to identify when and whether Beijing’s policy easing transforms into a full-blown “stimulus overshoot”: First, we need to see a clear upturn in shadow financing to believe that the Xi administration has given up on preventing excess debt. Assuming that such a shift occurs, and that overall credit improves, it will enable us to turn bullish on global growth and global risk assets on a cyclical, i.e., not merely tactical, horizon (Chart 12). Chart 12A Shadow Lending Surge Would Mean A Big Policy Shift
A Shadow Lending Surge Would Mean A Big Policy Shift
A Shadow Lending Surge Would Mean A Big Policy Shift
Second, our qualitative checklist will need to see a lot more “checks” in order to change our mind. Short of an extraordinary surge in bank and shadow bank credit, there needs to be a splurge in central and especially local government spending (Table 1). The mid-year spike in local governments’ new bond issuance in 2018 was fleeting and fell far short of the surge that initiated the large-scale stimulus of 2015. Frontloading these bonds in 2019 will depend on timing and magnitude. Table 1A Credit Splurge, Or Government Spending Splurge, Is Necessary For Stimulus To Overshoot
BCA Geopolitical Strategy 2018 Report Card
BCA Geopolitical Strategy 2018 Report Card
Third, we would need to see President Xi Jinping make a shift in rhetoric away from the “Three Battles” of financial risk, pollution, and poverty. Having identified systemic financial risk as the first of the three ills, Xi needs to make a dramatic reversal of this three-year action plan if he is to clear the way for another credit blowout. Trade War Would Reignite In 2018 It paid off to stick with our trade war alarmism in 2018. We correctly forecast that the U.S. and China would collide over trade and that their initial trade agreement – on May 20 – was insubstantial and would not last. In the event it lasted three days. Our one setback on the trade front was to doubt the two sides would agree to a trade truce at the G20. However, by assigning a subjective 40% probability, we correctly noted the fair odds of a truce. We also insisted that any truce would be temporary, which ended up being the case. We may yet be vindicated if the March 1 deadline produces no sustainable deal, as we forecast in last week’s Strategic Outlook. That said, correct geopolitical calls do not butter our bread at BCA. Rather, we are paid to make market calls. To that end, we would point out that we correctly assessed the market-relevance of the trade conflict, fading S&P 500 risks and focusing on the effect on global risk assets. Will this continue into 2019? We think so. We do not see trade conflict as the originator of ongoing market turbulence (Chart 13) and would expect the U.S. to outperform global equities again over the course of 2019 (Chart 14). This view may appear wrong in Q1, as the market digests the Fed backing off from hawkish rhetoric, the ongoing trade negotiations, and the likely seasonal uptick in Chinese credit data in the beginning of the calendar year. Chart 13Yields, Not Trade War, Drove Stocks
Yields, Not Trade War, Drove Stocks
Yields, Not Trade War, Drove Stocks
Chart 14U.S. Stocks Will Resume Outperformance
U.S. Stocks Will Resume Outperformance
U.S. Stocks Will Resume Outperformance
However, any stabilization in equity markets would likely serve to ease financial conditions in the U.S., where economic and inflation conditions remain firmly in tightening territory (Chart 15). As such, the Fed pause is likely to last no more than a quarter, maybe two at best, leading to renewed carnage in global risk assets if our view on Chinese policy stimulus – tepid – remains valid through the course of 2019. Chart 15If Financial Conditions Ease, Tightening Will Be Back On
If Financial Conditions Ease, Tightening Will Be Back On
If Financial Conditions Ease, Tightening Will Be Back On
Europe (All Of It… Again) In 2017, our forecasting track record for Europe was stellar. This continued in 2018, with no major setbacks: Populism in Italy: Our long-held view has been that Europe’s chief remaining risks lay in Italian populists coming to power. We predicted in 2016 that this would eventually happen and that they would then be proven to be bluffing. This is essentially what happened in 2018. Matteo Salvini’s Lega is surging in the polls because its leader has realized that a combination of hard anti-immigrant policy and the softest-of-soft Euroskepticism is a winning combination. We believe that investors can live with this combination. Our only major fault in forecasting European politics and assets this year was to close our bearish Italy call too early: we booked our long Spanish / short Italian 10-year government bond trade for a small loss in August, before the spread between the two Mediterranean countries blew out to record levels. That missed opportunity could have also made it on our “worst calls” list as well.
Chart 16
Pluralism in Europe: To get the call on Italy right, we had to dabble in some theoretical work. In a somewhat academic report, we showed that political concentration was on the decline in the developed world (Chart 16), but especially in Europe (Chart 17). Put simply, lower political concentration suggests that a duopoly between the traditional center-left and center-right parties is breaking down. Contrary to the conventional wisdom, we argued that Europe’s parliamentary systems would enable centrist parties to adopt elements of the populist agenda, particularly on immigration, without compromising the overall stability of European institutions. As such, political pluralism, or low political concentration, is positive for markets.
Chart 17
Immigration crisis is over: For centrist parties to be able to successfully adopt populist immigration policy, they needed a pause in the immigration crisis. This was empirically verifiable in 2018 (Chart 18). Chart 18European Migration Crisis Is Over
European Migration Crisis Is Over
European Migration Crisis Is Over
Merkel’s time has run out: Since early 2017, we had cautioned clients that Angela Merkel’s demise was afoot, but that it would be an opportunity, rather than a risk, when it came. It finally happened in 2018 and it was not a market moving event. The main question for 2019 is whether German policymakers, and Europe as a whole, will use the infusion of fresh blood in Berlin to reaccelerate crucial reforms ahead of the next global recession. Brexit: Since early 2016, we have been right on Brexit. More specifically, we were corrent in cautioning investors that, were Brexit to occur, “the biggest loser would be the Conservative Party, not the EU.” As with the previous two Conservative Party prime ministers, it appears that the question of the U.K.’s relationship with the EU has completely drained any political capital out of Prime Minister Theresa May’s reign. We suspect that the only factor propping up the Tories in the polls is that Jeremy Corbyn is the leader of Her Majesty’s Most Loyal Opposition. We have also argued that soft Brexit would ultimately prove to be “illogical” and that “Bregret” would begin to seep in, as it now most clearly has. We parlayed these rising geopolitical risks and uncertainties by shorting cable in the first half of the year for a 6.21% gain. Malaysia Over Turkey And India Over Brazil Not all was lost for our EM calls this year. We played Malaysia against Turkey in the currency markets for a 17.44% gain, largely thanks to massively divergent governance and structural reform trajectories after Malaysia’s opposition won power for the first time in the country’s history. Second, we initiated a long Indian / short Brazilian equity view in March that returned 27.54% by August. This was a similar play on divergent structural reforms, but it was also a way to hedge our alarmist view on trade. Given India’s isolation from global trade and insular financial markets, we identified India as one of the EM markets that would remain aloof of protectionist risks. We could have closed the trade earlier for greater gain, but did not time the exit properly. Midterm Election: A Major Democratic Victory Our midterm election forecast was correct: Democrats won a substantial victory. Even our initial call on the Senate, that Democrats had a surprisingly large probability of picking up seats, proved to be correct, with Republicans eking out just two gains in a year when Democrats were defending 10 seats in states that Trump carried in 2016. What about our all-important call that the election would have no impact on the markets? That is more difficult to assess, given that the S&P 500 has in fact collapsed in the lead-up to and aftermath of the election. However, we see little connection between the election outcome and the stock market’s performance. Neither do our colleagues or clients, who have largely stopped asking about the Democrats’ policy designs. In 2019, domestic politics may play a role in the markets. Impeachment risk is low, but, if it rears its head, it could prompt President Trump to seek relevance abroad, as his predecessors have done when they lost control of domestic policy. In addition, the Democratic Party’s sweeping House victory may suggest a political pendulum swing to the left in the 2020 presidential election. We will discuss both risks as part of our annual Five Black Swans report in early 2019. U.S. domestic politics was a collection of Red Herrings during much of President Obama’s presidency, and has produced strong tailwinds under President Trump (tax cuts in particular). This may change in 2019, with considerable risk to investors, and asset prices, ahead. Marko Papic, Senior Vice President Chief Geopolitical Strategist marko@bcaresearch.com Matt Gertken, Vice President Geopolitical Strategy mattg@bcaresearch.com Roukaya Ibrahim, Editor/Strategist roukayai@bcaresearch.com Ekaterina Shtrevensky, Research Analyst ekaterinas@bcaresearch.com Footnotes 1 For our 2019 Outlook, please see BCA Geopolitical Strategy Strategic Outlook, “2019 Key Views: Balanced On A Knife’s Edge,” dated December 14, 2018, available at gps.bcaresearch.com. For our past Strategic Outlooks, please visit gps.bcaresearch.com. 2 In part we like this cross because we also think that Mexico’s newly elected president, Andrés Manuel López Obrador, is priced to lose by two touchdowns, whereas he may merely lose by a last-second field goal.
The just-concluded midterm election saw no opposition to President Trump on trade. The Democratic Party candidates campaigned against the president on a range of issues, but not on his aggressive China policy. Polling from the summer also shows that a…
M2 is in positive territory. However, the effort can best be characterized as tepid, given the late-year collapse in bond issuance and a still-negative total social financing (TSF) impulse. TSF is the broadest measure of Chinese private credit. We expect a…
Highlights A progressing Sino-U.S. trade truce, rallying commodities and EM FX as well as improving Swedish economic activity point to a respite in the global growth slowdown. This should support commodity currencies and cause a correction in the dollar – moves we would fade. Ultimately, tightening U.S. policy and a rising Chinese marginal propensity to save point to both slower growth and a stronger dollar over the coming six to nine months. The European Central Bank is extremely data dependent, and in our view, our outlook on global growth will compromise the ECB’s ability to lift rates in September 2019. A tactical trade: Sell EUR/GBP. Feature Glimmers of hope are emerging for dollar bears and EM bulls. The Sino-U.S. trade truce seems to be progressing: Meng Wanzhou, the CFO of Huawei, was released on bail this week, and U.S. President Donald Trump suggested he would lean in her favor; China dropped its tariffs on U.S. auto imports to 15%; and the communication channels between China and the U.S. are clearly open. Green shoots for global growth have also emerged, with commodity prices staging a bit of a rebound, and data in some small, open economies very levered to global growth showing improvement. These developments can easily help risk assets temporarily rebound, lifting EM currencies and G-10 commodity currencies in the process while hurting the greenback for a month or two. However, we remain doubtful that these glimmers of hope for global growth will morph into a sustained rebound in global industrial activity. Consequently, we are inclined to use any weakness in the greenback to buy the dollar, and any rebound in EM and commodity currencies to sell them in anticipation of deeper lows. A Set Up For Some Dollar Weakness… The continued warming up in Sino-U.S. relations is encouraging, but as we argued last week, a more important consideration is whether global growth is finding a floor.1 In recent weeks, a few market signals have offered some hope. The growth-sensitive CRB Raw Industrials index has been firming, and the Baltic Dry index has recouped 40% of its loss from August to November (Chart I-1). Chart I-1Green Shoots In The Commodity Space...
Green Shoots In The Commodity Space...
Green Shoots In The Commodity Space...
EM FX has also staged a bit of a rebound, led by the Turkish lira. The most positive development on this front has been the recent gains in the yuan. Its rebound keeps at bay a large deflationary shock for the global economy, and the stability in EM FX means that EM financial conditions are not deteriorating further (Chart I-2). Chart I-2...Green Shoots In EM FX...
...Green Shoots In EM FX...
...Green Shoots In EM FX...
In our view, the greatest source of optimism comes from the Swedish economy. Sweden is a small, open economy where industrial and intermediate goods account for 25% of exports, or 11% of GDP. Its manufacturing PMI have been rebounding – a phenomenon repeated across multiple data sets. In fact, our diffusion index of 15 Swedish economic variables has been recovering. Based on history, the current recovery in the Swedish economic advance/decline line points to an upcoming rebound in EM exports growth, and to a temporary stabilization in the Global Leading Economic Indicator (Chart I-3). Chart I-3...And Green Shoots In Sweden As Well!
...And Green Shoots In Sweden As Well!
...And Green Shoots In Sweden As Well!
Any sign of stabilization in global economic activity will generate a period of weakness in the dollar, a traditionally countercyclical currency, which has now been made more vulnerable to good global growth by extended long speculative positioning. However, before bailing on the greenback, we need to see if this period of respite for the world will prove durable. Bottom Line: Indications that the Sino-U.S. trade truce has staying power for now, coupled with signs from both financial market prices and from Sweden – one of the G-10’s most growth sensitive economies – are likely to prompt a dollar correction over the next month or two. Short-term traders are likely to be able to take advantage of this move. ...But Not For A Cyclical Top… Even the most ferocious dollar bull markets can be punctuated by periods of weakness. This was the case throughout the first half of the 1980s and the second half of the 1990s. There is no reason why this rally will prove different. Thus, a period of stabilization in global growth prompting a dollar correction should not come as a surprise. However, at this juncture, the global policy set up still favors remaining long the dollar and using any correction to build up bigger long-dollar bets. Today, our BCA central bank monitor continues to point to the need of tightening U.S. monetary policy. However, the same cannot be said about the rest of the G-10 in aggregate. We estimated the performance of G-10 currency pairs versus the dollar when, like today, the BCA central bank monitors showed a greater need for policy tightening in the U.S. than in the rest of the world. What we found was during the past 26 years, this kind of environment is associated with depreciations versus the U.S. dollar in the euro, the yen, the Australian dollar, the Canadian dollar, the Swiss franc and the Scandinavian currencies (Chart I-4). Interestingly, the GBP and the NZD seem to buck this trend. Chart I-4The Current Currency Setup Is Dollar Bullish
Fade The Green Shoots
Fade The Green Shoots
The EUR/USD pair is of particular interest, as it accounts for 58% of the DXY dollar index and is often the preferred vehicle for investors to bet on the dollar’s trend. Right now, in sharp contrast with the U.S., the euro area central bank monitor points to a need for easing policy in Europe (Chart I-5). Chart I-5Economic Conditions Warrant More Hikes In The U.S., But Not In Europe...
Economic Conditions Warrant More Hikes In The U.S., But Not In Europe...
Economic Conditions Warrant More Hikes In The U.S., But Not In Europe...
We expect our monitors to continue to point toward the need for tighter U.S. than European monetary policy. Today, European growth has decelerated, and the slowdown in euro area M1 money supply indicates that continental growth will slow further before finding a bottom (Chart I-6, top panel). The European Central Bank is not immune to growth risks. Chart I-6...And This Is Not About To Change
...And This Is Not About To Change
...And This Is Not About To Change
Meanwhile, the Federal Reserve is fixated on inflationary developments, especially those emanating from the labor market. While U.S. core PCE has disappointed, U.S. wages, as measured by average hourly earnings and the Atlanta Fed Wage Tracker, are all trending higher (Chart I-6, middle panel). Moreover, while there has been a concerning slowdown in the U.S. housing sector, mortgage applications are beginning to regain some vigor (Chart I-6, bottom panel). The Fed may thus pause in March, but we do not think it is done hiking for the remainder of 2019, as markets currently expect. As a result, we anticipate one-year-ahead policy differentials between the U.S. and the DXY-weighted G-10 central banks to widen, lifting the dollar in the process (Chart I-7). Therefore, any dollar correction should be short-lived. Investors with longer investment horizons than three months should ride the volatility and remain long the dollar. Chart I-7More Dollar Upside
More Dollar Upside
More Dollar Upside
Bottom Line: BCA’s Fed monitor is pointing to the need for further U.S. rate hikes. Meanwhile, outside the U.S., G-10 policy should remain easy. Historically, this set-up is associated with dollar strength. The dichotomy between slowing European growth and growing U.S. wages suggests expected policy differentials will remain negative for EUR/USD. Stay long the dollar. ...Especially As China Remains Challenged China is now such an important diver of the global industrial cycle that it could nullify any of the conclusions noted above. However, at this point, Chinese economic dynamics seem to reinforce the dollar-bullish outcome, not weaken it. Chinese policy rates have collapsed, and the People’s Bank of China has cut the Reserve Requirement Ratio to 14.5%, injecting RMB 750 billion into the interbank market. This apparent easing in policy lifted hopes that we would see a significant rebound in the credit number in November. However, as Chart I-8 illustrates, total social financing excluding equity issuance has not picked up and continues to crawl along at a 16-year low. Moreover, the shadow-banking sector remains weak. Chart I-8Despite Stimulus, Chinese Credit Is Still Slowing
Despite Stimulus, Chinese Credit Is Still Slowing
Despite Stimulus, Chinese Credit Is Still Slowing
Why is the Chinese economy not responding to what seems like an easing in liquidity conditions? First, it is far from clear that Beijing has abandoned its desire to limit the growth of indebtedness in China. As a result, bankers remain reluctant to open the lending taps aggressively. Second, Chinese borrowers themselves have curtailed their appetite for credit. After binging on easy credit, state-owned enterprises have misallocated vast amounts of capital and are now unable to generate sufficient returns on assets to cover their costs of borrowing (Chart I-9). Meanwhile, the private sector is also reluctant to borrow aggressively amid uncertainty regarding the Chinese growth outlook. Chart I-9Too Much Debt Leads To Misallocated Capital
Too Much Debt Leads To Misallocated Capital
Too Much Debt Leads To Misallocated Capital
The result is a sharp rise in the Chinese marginal propensity to save (MPS). We can approximate China’s MPS by looking at the growth of M2 money supply relative to M1. The difference between the two monetary aggregates are savings deposits. If M2 grows faster than M1, Chinese economic agents are parking their funds in savings deposits faster than they are adding to their checking accounts, despite low interest rates. This suggests a greater desire to save. This means it will take much more stimulus than what has so far been injected into the Chinese economy to put a floor under growth. Indeed, this proxy for China’s MPS has historically been a reliable leading indicator of Chinese economic activity, announcing turning points in the Li Keqiang index (Chart I-10, top panel). The rising MPS is currently signaling a further deceleration in Chinese import volumes growth (Chart I-10, second panel), which is reflected in a call for greater downside to global export growth (Chart I-10, third panel). Finally, China’s MPS also forewarns that global industrial activity, as measured by our nowcast, will slow more (Chart I-10, bottom panel). In aggregate, China’s rising marginal propensity to save clearly points toward further global growth weakness. Chart I-10China's Rising Marginal Propensity To Save Hurts Global Growth
China's Rising Marginal Propensity To Save Hurts Global Growth
China's Rising Marginal Propensity To Save Hurts Global Growth
As we have shown many times, slowing global growth is good for the dollar, as it has a more negative impact on economic activity outside the U.S. than inside.2 Additionally, when global growth decelerates in response to slowing Chinese economic activity, Chinese interest rates also normally fall relative to U.S. ones, as China is forced to ease policy vis-a-vis the U.S. This interest rate differential has already narrowed considerably. If the correlation of the past 12 years is any guide, this means the recent rebound in the CNY is to be faded, and that USD/CNY has significant upside in the upcoming six to nine months (Chart I-11). This is deflationary for the global economy. Chart I-11Chinese Rates Will Further Lag U.S. Ones, The Yuan Will Follow
Chinese Rates Will Further Lag U.S. Ones, The Yuan Will Follow
Chinese Rates Will Further Lag U.S. Ones, The Yuan Will Follow
The impact of falling Chinese interest rates relative to the U.S. is not limited to the USD/CNY. As Chart I-12 shows, when U.S. one-year rates rise relative to China, the DXY also strengthens. This is again because U.S. rates overtake Chinese rates in an environment where global growth is slowing. Today, U.S. 12-month rates are higher than Chinese rates, and the differential will widen as Chinese policymakers are forced to continue stimulating. Hence, any correction in the USD should prove transitory. Chart I-12When U.S. Rates Rise Relative To China, The DXY Appreciates
When U.S. Rates Rise Relative To China, The DXY Appreciates
When U.S. Rates Rise Relative To China, The DXY Appreciates
The impact of these dynamics is most evident in the currencies of the economies most exposed to the Chinese business cycle. As Chart I-13 shows, when Chinese 12-month interest rates fall relative to U.S. 12-month rates, EM FX and G-10 commodity currencies depreciate significantly. A further drop in the Sino-U.S. spread, a consequence of a high and rising MPS hurting Chinese growth, will lead to further weakness in EM FX, the AUD, the NZD, the CAD, and the NOK against the dollar. Thus, it seems any respite these currencies may currently enjoy will prove temporary. Chart I-13Falling Sino-U.S. Spreads Will Hurt EM FX And Commodity Currencies
Falling Sino-U.S. Spreads Will Hurt EM FX And Commodity Currencies
Falling Sino-U.S. Spreads Will Hurt EM FX And Commodity Currencies
Bottom Line: Despite injections of stimulus, China’s credit growth is not rising because the Chinese marginal propensity to save has risen significantly. It will take much more stimulus before credit growth rises anew. Thus, Chinese and global growth will not find a durable bottom for at least two more quarters. This implies that rate differentials between China and the U.S. will fall further, and hence USD/CNY and the DXY have more upside on a six- to nine-month basis, even if they weaken in the coming weeks. Meanwhile, EM FX and commodity currencies have a lot more downside in their future. ECB: The End Of An Era Yesterday, the ECB announced the well-anticipated end of its asset purchase program, but couched its discussion in rather hedged terms. The ECB focused on the importance of forward guidance and is open to adding to the TLTRO program if need be. The first rate hike being through the summer of 2019 is clearly conditional on economic circumstances. In this regard, the ECB downgraded its growth forecast for 2018 and 2019 to 1.9% from 2% and to 1.7% from 1.8%, respectively. The inflation forecast was revised up to 1.8% from 1.7% in 2018 and was revised down to 1.6% from 1.7% in 2019. Additionally, ECB President Mario Draghi highlighted that risks to the forecasts are balanced, but downside risk is growing. Not only do we agree that downside risk is growing, we also agree on the source of this risk: foreign growth and global protectionism. However, on this front, we are more pessimist than the ECB as we expect a greater deterioration in EM conditions and global trade. As a result, we think that risks are very significant that the ECB will find it difficult to implement a first rate hike in September 2019, yet markets are currently pricing in a 10 basis-point move that month. Hence, we expect that if our view on global growth is correct, the ECB will guide markets to price in the first hike later than September 2019, a process that will weigh on the euro, especially as investors already take a dim view on the capacity of the Fed to lift rates next year. Bottom Line: The ECB is ending its asset purchase program, but it remains committed to supporting growth in the euro area. The ECB is now heavily leaning on forward guidance, and any policy tightening is conditional on economic circumstances. BCA’s view on global growth suggests that it will be hard for the ECB to lift rates in September 2019. Short-Term Trade: Sell EUR/GBP This week’s political survival of Prime Minister Theresa May means that for another year, the hard Brexiters cannot challenge her for leadership of the Conservative Party. While it does not mean that the Brexit saga is over, it does mean that the probability of a Hard, No-Deal Brexit has fallen even further. As such, this implies that the politically driven rally in EUR/GBP since mid November is likely to reverse (Chart I-14). Chart I-14Tactical Trade: Sell EUR/GBP
Tactical Trade: Sell EUR/GBP
Tactical Trade: Sell EUR/GBP
Additionally, the outperformance of British wages relative to the euro area should also support the pound in the short term (Chart I-15). A lower risk of a crash Brexit together with an ECB displaying a somewhat dovish side should cause an upgrade by investors in the expected path of monetary policy in the U.K. relative to the euro area. Moreover, while the euro area current account surplus has rolled over, the U.K.’s is steadily improving, making the pound progressively less dependent on international flows. Chart I-15Relative Wages Favor BoE Hikes Versus ECB Hikes
Relative Wages Favor BoE Hikes Versus ECB Hikes
Relative Wages Favor BoE Hikes Versus ECB Hikes
As such, we are opening a tactical trade: selling EUR/GBP with a tight stop at 0.9100 and a target at 0.8700. Mathieu Savary, Vice President Foreign Exchange Strategy mathieu@bcaresearch.com Footnotes 1 Please see Foreign Exchange Strategy Weekly Report, titled “Waiting For A Real Deal”, dated December 7, 2018, available at fes.bcaresearch.com 2 Please see Foreign Exchange Strategy Weekly Report, titled “Appetite For Destruction? FX Investing For Slowing Global Growth And Inflation”, dated November 23, 2018, as well as the Foreign Exchange Strategy Weekly Report, titled “The Dollar And Risk Assets Are Beholden To China’s Stimulus”, dated August 3, 2018. Both are available at fes.bcaresearch.com Currencies U.S. Dollar Chart II-1USD Technicals 1
USD Technicals 1
USD Technicals 1
Chart II-2USD Technicals 2
USD Technicals 2
USD Technicals 2
Recent data in the U.S. has been mixed: Core inflation came in line with expectations at 2.2%. This measure also increased from last month’s reading. Meanwhile, the JOLTS job openings outperformed expectations, coming in at 7.079 million However, while nonfarm payrolls underperformed expectations, coming in at 155 thousand, U.S. average hourly earnings remains solid DXY has risen by 0.5% this past week. We continue to be bullish on the U.S. dollar. The current environment of falling global growth and inflation has historically been very positive for this currency. Moreover, the market has already priced out any Fed hikes beyond December. This means that the risk for U.S. rates vis-à-vis the rest of the world remains to the upside. Report Links: Waiting For A Real Deal - December 7, 2018 2019 Key Views: The Xs And The Currency Market - December 7, 2018 Six Questions From The Road - November 16, 2018 The Euro Chart II-3EUR Technicals 1
EUR Technicals 1
EUR Technicals 1
Chart II-4EUR Technicals 2
EUR Technicals 2
EUR Technicals 2
Recent data in the euro area has been mixed: Industrial production yearly growth surprised to the upside, coming in at 1.2%. However, the Sentix Investor Confidence index surprised negatively, coming in at -0.3. Finally, Gross domestic product yearly growth underperformed expectations coming in at 1.6%. EUR/USD has been flat this week. Yesterday, the ECB downgraded its 2018 and 2019 growth forecasts. Moreover ECB president Mario Draghi hinted at increasing caution, as he remarked that downside risks where growing. We believe that EUR/USD has further downside, towards the 1.08-1.05 range, as the ECB will be unable to tighten monetary policy in the current environment of slowing global growth. Report Links: 2019 Key Views: The Xs And The Currency Market - December 7, 2018 Six Questions From The Road - November 16, 2018 Evaluating The ECB’s Options In December - November 6, 2018 The Yen Chart II-5JPY Technicals 1
JPY Technicals 1
JPY Technicals 1
Chart II-6JPY Technicals 2
JPY Technicals 2
JPY Technicals 2
Recent data in Japan has been negative: Machinery orders yearly growth underperformed expectations, coming in at 4.5%. Moreover, the final revisions to GDP annualized growth also surprised downside, coming in at -2.5%. Finally, the leading economic index also surprised negatively, coming in at 100.5. USD/JPY has risen by 0.8% this week. We are positive on the yen for the first quarter of 2019, especially on its crosses. The current risk off environment should be positive for safe havens like the yen. We are particularly negative on EUR/JPY, as this cross is very well correlated with bond yields, which have possess short-term downside. Report Links: 2019 Key Views: The Xs And The Currency Market - December 7, 2018 Updating Our Intermediate Timing Models - November 2, 2018 Will Rising Wages Cause An Imminent Change In Policy Direction In Europe And Japan? - October 5, 2018 British Pound Chart II-7GBP Technicals 1
GBP Technicals 1
GBP Technicals 1
Chart II-8GBP Technicals 2
GBP Technicals 2
GBP Technicals 2
Recent data in the U.K. has been mixed: Industrial production yearly growth underperformed expectations, coming in at -0.8%. Moreover, the claimant count change also surprised negatively, coming in at 21.9 thousand. However, average hourly earnings excluding and including bonus both outperformed expectations, coming in at 3.3%. GBP/USD has fallen by 1.2% this week on political risks. However, on Wednesday PM Theresa May survived a vote of no confidence that would have removed her from the leadership of the tory party. With this win, Prime Minister May is now protected from intra-party challenges for at least a year, strengthening her ability to fend-off demands by hard-brexiters. This event has created a tactical opportunity to sell EUR/GBP. Report Links: Six Questions From The Road - November 16, 2018 Updating Our Intermediate Timing Models - November 2, 2018 Clashing Forces: The Fed And EM Financial Conditions - October 19, 2018 Australian Dollar Chart II-9AUD Technicals 1
AUD Technicals 1
AUD Technicals 1
Chart II-10AUD Technicals 2
AUD Technicals 2
AUD Technicals 2
Recent data in Australia has been positive: The house price index yearly growth came in line with expectations, declining by -1.5%. Moreover, home loans growth outperformed expectations, coming in at 2.2%. AUD/USD has been flat this week. We believe that the AUD is the currency with the most potential downside in the G10. After all, Australia is the G-10 economy most leveraged to the Chinese industrial cycle, due to Australia’s high reliance on industrial metal and coal exports. This means that the continued tightening by Chinese authorities should be most toxic for this currency. Report Links: Waiting For A Real Deal - December 7, 2018 Updating Our Intermediate Timing Models - November 2, 2018 Policy Divergences Are Still The Name Of The Game - August 14, 2018 New Zealand Dollar Chart II-11NZD Technicals 1
NZD Technicals 1
NZD Technicals 1
Chart II-12NZD Technicals 2
NZD Technicals 2
NZD Technicals 2
NZD/USD has fallen by 0.5% this week. After being bullish in the NZD for a couple of months, we have recently turned bearish, as this currency is very likely to suffer in the current environment of declining inflation and global growth. said that being said, we remain bullish on the NZD relative to the AUD, given that the kiwi economy is less exposed to the Chinese industrial cycle than Australia’s. Report Links: Updating Our Intermediate Timing Models - November 2, 2018 Clashing Forces: The Fed And EM Financial Conditions - October 19, 2018 In Fall, Leaves Turn Red, The Dollar Turns Green - October 12, 2018 Canadian Dollar Chart II-13CAD Technicals 1
CAD Technicals 1
CAD Technicals 1
Chart II-14CAD Technicals 2
CAD Technicals 2
CAD Technicals 2
Recent data in Canada has been positive: Net change in employment surprised positively, coming in at 94.1 thousand. Moreover, the unemployment rate also surprised positively, coming in at 5.6%. Finally, housing starts growth also surprised to the upside, coming in at 216 thousand. After falling by nearly 1%, USD/CAD finished the week flat. While we are bearish on the Canadian dollar relative to the U.S. dollar, we are more positive on the CAD against the AUD. Renewed tightening in oil supply should serve as a support for global oil producers. Meanwhile, Chinese deleveraging will continue, hurting base metals in the process. This will cause oil to outperform base metals, which means that the CAD should have upside against currencies like the AUD. Finally, domestic economic conditions favor BoC hikes versus RBA hike, even after the recent pause flagged by the BoC. Report Links: Updating Our Intermediate Timing Models - November 2, 2018 Clashing Forces: The Fed And EM Financial Conditions - October 19, 2018 Updating Our Long-Term FX Fair Value Models - June 22, 2018 Swiss Franc Chart II-15CHF Technicals 1
CHF Technicals 1
CHF Technicals 1
Chart II-16CHF Technicals 2
CHF Technicals 2
CHF Technicals 2
EUR/CHF has been flat this week. Our bullish view on EUR/CHF is a high conviction view for the first part of 2019. This is because the recent strength in the franc is choking out any inflationary pressures in the Swiss economy. Thus, we are reaching the threshold at which the SNB is very likely to intervene in the currency market to prevent the franc’s strength from derailing the path toward the inflation target. In fact, the SNB even acknowledged this reality this week by downgrading its inflation outlook. Report Links: Waiting For A Real Deal - December 7, 2018 Updating Our Intermediate Timing Models - November 2, 2018 Updating Our Long-Term FX Fair Value Models - June 22, 2018 Norwegian Krone Chart II-17NOK Technicals 1
NOK Technicals 1
NOK Technicals 1
Chart II-18NOK Technicals 2
NOK Technicals 2
NOK Technicals 2
USD/NOK has risen by 0.7% this week. While we maintain a bearish stance toward the krone versus the U.S. dollar, we are short AUD/NOK, as a way to take advantage of stabilizing oil prices and a continued growth slowdown in China. Moreover, AUD/NOK is expensive in PPP terms, and is technically overbought. Finally, this currency is one of the most mean-reverting within the G10, which means that the recent surge in this cross is likely to reverse. Report Links: Waiting For A Real Deal - December 7, 2018 Updating Our Intermediate Timing Models - November 2, 2018 Clashing Forces: The Fed And EM Financial Conditions - October 19, 2018 Swedish Krona Chart II-19SEK Technicals 1
SEK Technicals 1
SEK Technicals 1
Chart II-20SEK Technicals 2
SEK Technicals 2
SEK Technicals 2
USD/SEK has risen by 0.9% this week. On a short-term basis, we are negative on the krona, given that this currency is very sensitive to global growth dynamics, which means that the continued tightening by both Chinese authorities and the Fed will create a headwind for any SEK rally. That being said, on a longer-term basis we are more positive on the krona, as the Riksbank has a lot of room to lift rates as the Swedish economy is increasingly displaying large internal imbalances that need to be addressed. Report Links: Updating Our Intermediate Timing Models - November 2, 2018 Updating Our Long-Term FX Fair Value Models - June 22, 2018 Updating Our Intermediate Timing Models - May 18, 2018 Trades & Forecasts Forecast Summary Core Portfolio Tactical Trades Closed Trades
Highlights So What? Global divergence will persist beyond the near term. Why? China’s stimulus will be disappointing unless things get much worse. U.S.-China trade war will reignite and strategic tensions will continue. European risks are limited short-term, but will surge without reform. U.S. assets will outperform; oil and the yen will rise; the pound is a long-term play; EM pain will continue. Feature The year 2019 will be one of considerable geopolitical uncertainty. Three issues dominate our Outlook, with low-conviction views on all three questions: Question 1: How much will China stimulate? Question 2: Will the trade war abate? Question 3: Is Europe a Black Swan or a Red Herring?
U.S. Outperformance Should Be Bullish USD
U.S. Outperformance Should Be Bullish USD
The main story in 2018 was policy divergence. American policymakers ramped up stimulus – both through the profligate tax cuts and fiscal spending – at the same time that Chinese policymakers stuck to their guns on de-levering the economy. The consequence of this policy mix was that the synchronized global recovery of late 2016 and 2017 evolved into a massive outperformance by the U.S. economy (Chart 1). The Fed responded to the bullish domestic conditions with little regard for the global economy, causing the DXY to rally from a 2018 low of 88.59 in February to 97.04 today.
Fiscal Conservatism Melts Away
Fiscal Conservatism Melts Away
Republicans Change Their Minds When In Power
Republicans Change Their Minds When In Power
While the policy divergence narrative appears to be macroeconomic in nature, it is purely political. There is nothing cyclical about the ‘U.S.’ economic outperformance in 2018. President Donald Trump campaigned on an economic populist agenda and then proceeded to deliver on it throughout 2017 and 2018. He faced little opposition from fiscal conservatives, mainly because fiscal conservativism melts away from the public discourse when budget deficits are low (Chart 2) and when the president is a Republican (Chart 3). Meanwhile, Chinese policymakers have decided to tolerate greater economic pain in an effort to escape the Middle Income Trap (Chart 4). They believe this trap will envelop them if they cannot grow the economy without expanding the already-massive build-up of leverage (Chart 5).
2019 Key Views: Balanced On A Knife’s Edge
2019 Key Views: Balanced On A Knife’s Edge
Debt Still Rising
Debt Still Rising
Geopolitics is not just about “things blowing up somewhere in the desert.” In today’s world, emblematized by paradigm shifts, politicians are more than ever in the driver’s seat. While technocrats respond to macroeconomic factors, politicians respond to political and geopolitical constraints. Few investment narratives last much longer than a year and policy divergence is coming to a close. Will the Fed pause given the turn in global growth? Will China respond with effective stimulus in 2019? If the answer to both questions is yes, global risk assets could light up in the next quarter and potentially beyond. Already EM has outperformed DM assets for a month and some canaries in the coal mine for global growth – like the performance of Swedish economic indicators – signal that the outperformance is real.
Global Economic Divergence Will Continue
Global Economic Divergence Will Continue
2019 Key Views: Balanced On A Knife’s Edge
2019 Key Views: Balanced On A Knife’s Edge
We are skeptical that the move is sustainable beyond a quarter or two (Chart 6). As our colleague Peter Berezin has highlighted, the market is pricing less than one hike in 2019 (Chart 7). Regardless, the impact on the U.S. dollar, remains muted, with the DXY at 97.04. This suggests that the backing off that the Fed may or may not have already done is still not enough from the perspective of weakening global growth (Chart 8). Global risk assets need more from the Fed than what the market is already pricing. And with U.S. inflationary pressures building (Chart 9), the BCA House View expects to see multiple Fed hikes in 2019, disappointing investors bullish on EM and global risk assets.
Global Growth Leading Indicators
Global Growth Leading Indicators
Does The Fed Like It Hot?
Does The Fed Like It Hot?
With our Fed view set by the House View, we therefore turn to where we can add value. To this end, the most important question of 2018 largely remains the same in 2019: How much will China stimulate? Question 1: How Much Will China Stimulate In 2019?
bca.gps_sr_2018_12_14_c10
bca.gps_sr_2018_12_14_c10
China is undoubtedly already stimulating, with a surge in local government bond issuance earlier this year and a bottoming in the broad money impulse (Chart 10). M2 is in positive territory. However, the effort can best be characterized as tepid, with a late-year collapse in bond issuance (Chart 11) and a still-negative total social financing (TSF) impulse (Chart 12). TSF is the broadest measure of private credit in China’s economy.
2019 Key Views: Balanced On A Knife’s Edge
2019 Key Views: Balanced On A Knife’s Edge
China's Total Credit Is Weak
China's Total Credit Is Weak
We expect a surge in TSF in Q1, but this is a normal seasonal effect. A typical Q1 credit surge will not be enough to set global risk assets alight for very long, particularly if the market has already priced in as much of a “pause” from the Fed as we are going to get. Investors should specifically focus on new local government bond issuance and whether the “shadow financing” component of TSF gets a bid, since the primary reason for the weakness in TSF over the past year is the government’s crackdown on shadow lending. As Chart 13A & B shows, it was new local government bonds that led the way for stimulus efforts in 2015, followed by a surge in both bank lending and shadow lending in 2016.
Don't Focus Just On TSF...
Don't Focus Just On TSF...
...But Shadow Financing In Particular
...But Shadow Financing In Particular
We would also expect further monetary policy easing, with extra RRR cuts or even a benchmark policy rate cut. However, monetary policy has been easy all year and yet the impact on credit growth has remained muted. This begs two important questions: Is the credit channel impaired? A slew of macroprudential reforms – which we have dubbed China’s “Preemptive Dodd-Frank” – may have impaired the flow of credit in the system. The official policy of “opening the front door, closing the back door” has seen bank loans pick up modestly but shadow lending has been curtailed (Chart 14A & B). This way of controlling the rise of leverage has its costs. For private enterprises – with poor access to the official banking sector – the shadow financial system was an important source of funding over the past several years.
Opening The Front Door...
Opening The Front Door...
...Closing The Back Door
...Closing The Back Door
Is policy pushing on a string? An even more dire scenario would be if China’s credit channel is not technically, but rather psychologically, impaired. Multiple reasons may be to blame: a negative net return on the assets of state-owned enterprises (Chart 15); widespread trade war worries; mixed signals from policymakers; or a general lack of confidence in the political direction of the country. The rising M2/M1 ratio suggests that the overall economy’s “propensity to save” is rising (Chart 16).
Old China Is A Zombie China
Old China Is A Zombie China
Propensity To Save
Propensity To Save
Why would Chinese policymakers keep their cool despite a slow pickup in credit growth? Are they not concerned about unemployment, social unrest, and instability? Of course, they are. But Chinese policymakers are not myopic. They also want to improve potential GDP over the long run. Table 1China: The Trend In Domestic Demand, And The Outlook For Trade, Is Negative
2019 Key Views: Balanced On A Knife’s Edge
2019 Key Views: Balanced On A Knife’s Edge
So far, the economy has weathered the storm relatively well. First, eight out of ten of our China Investment Strategy’s housing price indicators (Table 1) are flat-to-up – although it is true that the October deterioration in floor space started and especially floor space sold (Chart 17) is cause for concern. If and when the housing market weakens further, stimulus will be used to offset it, despite the fact that the government is attempting to prevent a sharp increase in prices at the same time. With so much of China’s middle-class savings invested in the housing market, the key pillar of socio-economic stability is therefore real estate.
A Possible Clue For China Stimulusr
A Possible Clue For China Stimulusr
Second, credit has fueled China’s “old economy,” but policymakers want to buoy “new China” (Chart 18). This means that measures to boost consumption and the service sector economy will be emphasized in new rounds of stimulus, as has occurred thus far (tax cuts, tariff cuts, deregulation, etc). This kind of stimulus is not great news for global risk assets leveraged to “old China,” such as EM and industrial metals.
Rebalancing Of The Chinese Economy
Rebalancing Of The Chinese Economy
Third, policymakers are not exclusively focused on day-to-day stability but are also focused on the decades-long perseverance of China’s political model. And that means moving away from leverage and credit as the sole fuel for the economy. This is not just about the Middle Income Trap, it is also about national security and ultimately sovereignty. Relying on corporate re-levering for stimulus simply doubles-down on the current economic model, which is still export-oriented given that most investment is geared toward the export sector. But this also means that China will be held hostage to foreign demand and thus geopolitical pressures, a fact that has been revealed this year through the protectionism of the White House. As such, moving away from the investment-led growth model and towards a more endogenous, consumer-led model is not just good macro policy, it makes sense geopolitically as well. Will the trade war – or the current period of trade truce – change Chinese policymakers’ decision-making? We do not see why it would. First, if the trade truce evolves into a trade deal, the expected export shock will not happen (Chart 19) and thus major stimulative measures would be less necessary. Second, if we understand correctly why policymakers have cited leverage as an “ill” in the first place, then we would assume that they would use the trade war as an excuse for the pain that they themselves have instigated. In other words, the trade war with the U.S. gives President Xi Jinping the perfect excuse for the slowdown, one that draws attention from the real culprit: domestic rebalancing.
Trump's Initial Tariffs Soon To Be Felt
Trump's Initial Tariffs Soon To Be Felt
Bottom Line: Since mid-2018, we have been asking clients to focus on our “Stimulus Overshoot” checklist (Table 2). We give the first item – “broad money and/or total credit growth spike” – a premier spot on the list. If a surge in total credit occurs, we will know that policymakers are throwing in the towel and stimulating in a major way. It will be time to turn super-positive on global risk assets, beyond a mere tactical trade, as a cyclical view at that point. Note that if one had gone long EM in early February 2016, when January data revealed a truly epic TSF splurge, one would not have been late to the rally. Table 2Will China’s Stimulus Overshoot In 2019?
2019 Key Views: Balanced On A Knife’s Edge
2019 Key Views: Balanced On A Knife’s Edge
Our low-conviction view, at the moment, is that the increase in credit growth that we will see in Q1 will be seasonal – the usual frontloading of lending at the beginning of the year – rather than an extraordinary surge that would signal a policy change. A modest increase in credit growth will not be enough to spark a sustainable – year-long – rally in global risk assets. The Fed has already backed off as far as the market is concerned. As such, a pickup in Chinese credit could temporarily excite investors. But global stabilization may only embolden the Fed to refocus on tightening after a Q1 pause. Question 2: Will The Trade War Abate? The first question for investors when it comes to the trade war is “Why should we care?” Sure, trade policy uncertainty appears to have correlated with the underperformance of global equity indices relative to the U.S. (Chart 20). However, such market action was as much caused by our policy divergence story – being as it is deeply negative for EM assets – as by a trade war whose impact on the real economy has not yet been felt.
U.S. Is 'Winning' The Trade War
U.S. Is 'Winning' The Trade War
Nonetheless, we do believe that getting the trade war “right” is a big call for 2019. First, while the impact of the U.S.-China trade war has been minimal thus far, it is only because China front-loaded its exports ahead of the expected tariffs, cut interbank rates and RRRs, accelerated local government spending, and allowed CNY/USD to depreciate by 10%. A restart of trade tensions that leads to further tariffs will make frontloading untenable over time, whereas further currency depreciation would be severely debilitating for EMs. We doubt the sustainability of the trade truce for three reasons: U.S. domestic politics: The just-concluded midterm election saw no opposition to President Trump on trade. The Democratic Party candidates campaigned against the president on a range of issues, but not on his aggressive China policy. Polling from the summer also shows that a majority of American voters consider trade with China unfair (Chart 21). In addition, President Trump will walk into the 2020 election with a wider trade deficit, due to his own stimulative economic policy (Chart 22). He will need to explain why he is “losing” on the one measure of national power that he campaigned on in 2016. Structural trade tensions: Ahead of the G20 truce, the U.S. Trade Representative Robert Lighthizer issued a hawkish report that concluded that China has not substantively changed any of the trade practices that initiated U.S. tariffs. Lighthizer has been put in charge of the current trade negotiations, which is a step-up in intensity from Treasury Secretary Steven Mnuchin, who was in charge of the failed May 2018 round. Geopolitical tensions: The G20 truce did not contain any substantive resolution to the ongoing strategic tensions between the U.S. and China, such as in the South China Sea. Beyond traditional geopolitics, tensions are increasingly involving high-tech trade and investment between the two countries and American allegations of cyber theft and spying by China. The recent arrest of Huawei’s CFO in Canada, on an American warrant, will likely deepen this high-tech conflict in the short term.
2019 Key Views: Balanced On A Knife’s Edge
2019 Key Views: Balanced On A Knife’s Edge
Trade Deficit To Rise Despite Tariffs
Trade Deficit To Rise Despite Tariffs
Since the G20 truce with Xi, President Trump has seen no significant pickup in approval ratings (Chart 23). Given that the median American voter has embraced protectionism – against China at least – we would not expect any. Meanwhile, U.S. equities have sold off, contrary to what President Trump, or his pro-trade advisors, likely expected in making the G20 decision to delay tariffs.
Appeasing China Doesn't Pay
Appeasing China Doesn't Pay
At some point, President Trump will realize that he risks considerable political capital on a trade deal with China that very few voters actually want or that the U.S. intelligence and defense community supports. Democrats did not oppose his aggressive China policy in the midterm election because they know that the median voter does not want it. As such, it is guaranteed that Trump’s 2020 Democratic Party opponent will accuse him of “surrender,” or at least “weakness.” If, over the next quarter, the economic and market returns on his gambit are paltry, we would expect President Trump to end the truce. Furthermore, we believe that a substantive, and long-lasting, trade deal is unlikely given the mounting tensions between China and the U.S. These tensions are not a product of President Trump, but are rather a long-run, structural feature of the twenty-first century that we have been tracking since 2012.1 Tensions are likely to rise in parallel to the trade talks on the technology front. We expect 2019 to be the year when investors price in what we have called Bifurcated Capitalism: the segmentation of capital, labor, and trade flows into geopolitically adversarial – and yet capitalist in nature – economic blocs. Entire countries and sectors may become off-limits to Western investors and vice-versa for their Chinese counterparts. Countries will fall into either the Tencent and Huawei bloc or the Apple and Ericsson bloc. This development is different from the Cold War. Note our emphasis on capitalism in the term Bifurcated Capitalism. The Soviet Union was obviously not capitalist, and clients of BCA did not have interests in its assets in the 1970s and 1980s. Trade between Cold War economic blocs was also limited, particularly outside of commodities. The closest comparison to the world we now inhabit is that of the nineteenth century. Almost all global powers were quite capitalist at the time, but they engaged in imperialism in order to expand their economic spheres of influence and thus economies of scale. In the twenty-first century, Africa and Asia – the targets of nineteenth century imperialism – may be replaced with market share wars in novel technologies and the Internet. This will put a ceiling on how much expansion tech and telecommunication companies can expect in the competing parts of Bifurcated Capitalism. The investment consequences of this concept are still unclear. But what is clear is that American policymakers are already planning for some version of the world we are describing. The orchestrated effort by the U.S. intelligence community to encourage its geopolitical allies to ban the use of Huawei equipment in their 5G mobile networks suggests that there are limits to the current truce ever becoming a sustainable deal. So does the repeated use of economic sanctions originally designed for Iran and Russia against Chinese companies. President Trump sets short- and medium-term policies given that he is the president. However, the intelligence and defense communities have “pivoted to Asia” gradually since 2012. This shift has occurred because the U.S. increasingly sees China as a peer competitor, for the time being confined in East Asia but with intentions of projecting power globally. To what extent could President Trump produce a trade deal with Xi that also encompasses a change in the U.S. perception of China as an adversary? We assign a low probability to it. As such, President Xi has little reason to give in to U.S. pressure on trade, as he knows that the geopolitical and technology pressure will continue. In fact, President Xi may have all the reason to double-down on his transformative reforms, which would mean more pain for high-beta global plays. Bottom Line: What may have appeared as merely a trade conflict has evolved into a broad geopolitical confrontation. President Trump has little reason to conclude a deal with China by March. Domestic political pressures are not pushing in the direction of the deal, while America’s “Deep State” is eager for a confrontation with China. Furthermore, with President Trump “blinking” on Iranian sanctions, his administration has implicitly acknowledged the constraints discouraging a deeper involvement in the Middle East. This puts the geopolitical focus squarely on China. Question 3: Is Europe a Black Swan or a Red Herring? The last two years have been a dud in Europe. Since the Brexit referendum in mid-2016, European politics have not been a catalyst for global markets, save for an Italy-induced sell-off or two. This could substantively change in 2019. And, as with the first two questions, the results could be binary. On one hand, there is the positive scenario where the stalled and scaled-back reforms on the banking union and Euro Area budget get a shot in the arm in the middle of the year. On the other hand, the negative scenario would see European-wide reforms stall, leaving the continent particularly vulnerable as the next global recession inevitably nears. At the heart of the binary distribution is the broader question of whether populism in Europe is trending higher. Most commentators and our clients would say yes, especially after the protests and rioting in Paris over the course of November. But the answer is more complicated than that. While populists have found considerable success in the ballot box (Chart 24), they have not managed to turn sentiment in Europe against the currency union (Chart 25). Even in Italy, which has a populist coalition government in power, the support for currency union is at 61%, the highest since 2012. This number has apparently risen since populists took over.
Anti-Establishment Parties Are Rising...
Anti-Establishment Parties Are Rising...
...But Euroskepticism Is A Failed Strategy
...But Euroskepticism Is A Failed Strategy
What explains this divergence? Effectively, Europe’s establishment parties are being blamed for a lot of alleged ills, liberal immigration policy first amongst them. However, European integration remains favored across the ideological spectrum. Few parties that solely focus on Euroskepticism have any chance of winning power, something that both Lega and Five Star Movement found out in Italy. Italy’s Deputy Prime Minister Matteo Salvini confirmed his conversion away from Euroskepticism by stating that he wants to “reform the EU from the inside” and that it was time to give the “Rome-Berlin axis” another go.2 Salvini is making a bet – correct in our view – that by moderating Lega’s populism on Europe, he can capture the center ground and win the majority in the next Italian election, which could happen as soon as 2019. As such, we don’t think that the “rise of populism” in Europe is either dramatic or market-relevant. In fact, mainstream parties are quickly adopting parts of the anti-establishment agenda, particularly on immigration, in a bid to recoup lost voters. A much bigger risk for Europe than populism is stagnation on the reform front, a perpetual Eurosclerosis that leaves the bloc vulnerable in the next recession. What Europe needs is the completion of a backstop to prevent contagion. Such a backstop necessitates greatly enhancing the just-passed banking union reforms. The watered-down reforms did not include a common backstop to the EU’s single resolution fund nor a deposit union. A working group will report on both by June 2019, with a potential legislative act set for some time in 2024. What could be a sign that the EU is close to a grand package of reforms in 2019? We see three main avenues. First, a political shift in Germany. Investors almost had one, with conservative Friedrich Merz coming close to defeating Merkel’s hand-picked successor Annegret Kramp-Karrenbauer (also known as AKK) for the leadership of the ruling Christian Democratic Union (CDU). Merz combined a right-leaning anti-immigrant stance with staunch pro-European integration outlook. It is unclear whether AKK will be willing to make the same type of “grand bargain” with the more conservative factions of the CDU electorate. However, AKK may not have a choice, with both Alternative for Germany (AfD) and the Green Party nibbling at the heels of the right-of-center CDU and left-of-center Social-Democratic Party (SPD) (Chart 26). The rise of the Green party is particularly extraordinary, suggesting that a larger portion of the German electorate is radically Europhile rather than Euroskeptic. AKK may have to adopt Merz’s platform and then push for EU reforms.
Challengers To The Established Parties
Challengers To The Established Parties
Second, French President Emmanuel Macron may have to look abroad for relevance. With his reform agenda stalled and political capital drained, it would make sense for Macron to spend 2019 and beyond on European reforms. Third, a resolution of the Brexit debacle. The longer the saga with the U.K. drags on, the less focus there will be in Europe on integration of the Euro Area. If the U.K. decides to extend the current negotiating period, it may even have to hold elections for the European Parliament. As such, we are not focusing on the budget crisis in Italy – our view that Rome is “bluffing” is coming to fruition –or a potential early election in Spain. And we are definitely not focusing on the EU Parliamentary election in May. These will largely be red herrings. The real question is whether European policymakers will finally have a window of opportunity for strategic reforms. And that will require Merkel, AKK, and Macron to expend whatever little political capital they have left and invest it in restructuring European institutions. Finally, a word on Europe’s role in the global trade war. While Europe is a natural ally for the U.S. against China – given its institutional connections, existing alliance, and trade surplus with the latter and deficit with the former (Chart 27) – we believe that the odds are rising of a unilateral tariff action by the U.S. on car imports.
EU Surplus With U.S. Pays For Deficit With China
EU Surplus With U.S. Pays For Deficit With China
This is because the just-concluded NAFTA deal likely raised the cost of vehicle production in the trade bloc, necessitating import tariffs in order for the deal to make sense from President Trump’s set of political priorities. The Trump administration may not have the stomach for a long-term trade war with Europe, but it can shake up the markets with actions in that direction. Bottom Line: In the near term, there are no existential political risks in Europe in 2019. As such, investors who are bullish on European assets should not let geopolitics stand in the way of executing on their sentiment. We remain cautious for macroeconomic reasons, namely that Europe is a high-beta DM play that needs global growth to outperform in order to catch a bid. However, 2019 is a make-or-break year on key structural reforms in Europe. Without more work on the banking union – and without greater burden sharing, broadly defined – the Euro Area will remain woefully unprepared for the next global recession. Question 4: Will Brexit Happen? Given the volume of market-relevant geopolitical issues, we have decided to pose (and attempt to answer) five additional questions for 2019. We start with Brexit. Prime Minister Theresa May has asked for a delay to the vote in the House of Commons on the Withdrawal Treaty, which she would have inevitably lost. The defeat of the subsequent leadership challenge is not confidence-inspiring as the vote was close and a third of Tory MPs voted against her. May likely has until sometime in January to pass the EU Withdrawal Agreement setting out the terms of Brexit, given that all other EU member states have to get it through their parliaments before the Brexit date on March 29. The real question is whether any deal can get through Westminster. The numbers are there for the softest of soft Brexits, the so-called Norway+ option where the U.K. effectively gets the same deal as Norway, if May convinces the Labour Party to break ranks. Such a deal would entail Common Market access, but at the cost of having to pay essentially for full EU membership with no ability to influence the regulatory policies that London would have to abide by. The alternative is to call for a new election – which may usher the even less pro-Brexit Labour Party into power – or to delay Brexit for a more substantive period of time, or simply to buckle under the pressure and call for a second referendum. We disagree that the delay signals that the “no deal Brexit,” or the “Brexit cliff,” is nigh. Such an outcome is in nobody’s interest and both May and the EU can offer delays to ensure that it does not happen. Whatever happens, one thing is clear: the median voter is turning forcefully towards Bremain (Chart 28). It will soon become untenable to delay the second referendum. And even if the House of Commons passes the softest of Soft Brexit deals, we expect that the Norway+ option will prove to be unacceptable when Westminster has to vote on it again in two or three year’s time.
Bremain Surging Structurally
Bremain Surging Structurally
Is it time to buy the pound, particularly cable, which is cheap on a long-term basis (Chart 29)? It is a tough call. On one hand, our confidence that the U.K. ultimately has to remain in the EU is rising. However, to get there, the U.K. may need one last major dose of volatility, either in the form of a slow-burn crisis caused by Tory indecision or in the form of a far-left Labour government that tries its own hand at Brexit while pursuing a 1970s style left-wing economic agenda. Can any investor withstand this kind of volatility in the short and potentially long-ish term? Only the longest of the long-term investors can.
Start Buying The Pound
Start Buying The Pound
Question 5: Will Oil Prices Rally Substantively In 2019? Several risks to oil supply remain for 2019. First, there is little basis for stabilization in Venezuelan oil production, and further deterioration is likely (Chart 30). Second, sectarian tensions in Iraq remain unresolved. Third, supply risks in other geopolitical hot spots – like Nigeria and Libya – could surprise in 2019.
Venezuela: On A Downward Spiral
Venezuela: On A Downward Spiral
The most pressing geopolitical issue, however, is a decision on the Iranian sanction waivers. President Trump induced considerable market-volatility in 2019 by signaling that he would use “maximum pressure” against Iran. As a result, the risk premium contribution to the oil price – illustrated in Chart 31 by the red bar – rose throughout 2018, only to collapse as the White House offered six-month sanction waivers. Not only did the risk premium dissipate, but Saudi Arabia then scrambled to reverse the production surge it had instituted to offset the Iran sanctions.
2019 Key Views: Balanced On A Knife’s Edge
2019 Key Views: Balanced On A Knife’s Edge
We agree with BCA’s Commodity & Energy Strategy that oil market fundamentals are tight and numerous supply risks loom. We also struggle to see why President Trump will seek to pick a fight with Iran in the summer of 2019. Our suspicion is that if President Trump was afraid of a gasoline-price spike right after the midterm election, why would he not “blink” at the end of the spring? Not only will the U.S. summer driving season be in full swing – a time of peak U.S. gasoline demand – but the 2020 election primaries will only be six months away. Furthermore, it is highly unlikely that OPEC and Russia will do the U.S. president’s bidding by turning on the taps to offset any unforeseen supply losses in 2019. They did not do so even when President Trump asked, very nicely, ahead of the just-concluded Vienna meeting. Once Trump prioritized domestic politics over Saudi geopolitical interests – by backing away from his maximum pressure tactic against Iran – he illustrated to Riyadh that his administration is about as reliable of an ally as the Obama White House. Meanwhile, his ardent defense of Riyadh in the Khashoggi affair, at a cost of domestic political capital, means that he lost the very leverage that he could have used to pressure Saudi Arabia. We therefore remain cautiously bullish on oil prices in 2019, but with the caveat that a big-bang surge in prices due to a U.S.-Iran confrontation – our main risk for 2019 just a few months ago – is now less likely. Question 6: Will Impeachment Become A Risk In 2019? While we have no way to forecast the Mueller investigation, it is undoubtedly clear that risks are rising on the U.S. domestic front. President Trump’s popularity among GOP voters is elevated and far from levels needed to convince enough senators to remove him from power (Chart 32). However, a substantive finding by Mueller may leave the moderate Democrats in the House with no choice but to pursue impeachment.
2019 Key Views: Balanced On A Knife’s Edge
2019 Key Views: Balanced On A Knife’s Edge
This may rattle the market for both headline and fundamental reasons. The headline reasons are obvious. The fundamental reasons have to do with the looming stimulus cliff in 2020. A pitched battle between the House Democrats and the White House would make cooperation on another substantive stimulus effort less likely and thus a recession in 2020 more likely. The market may start pricing in such an outcome at some point in 2019. Furthermore, sentiment could be significantly impacted by a protracted domestic battle that impairs Trump’s domestic agenda. President Bill Clinton sought relevance abroad amidst his impeachment proceedings by initiating an air war against Yugoslavia. President Trump may do something similar. There is also an unclear relationship between domestic tensions and trade war. On one hand, President Trump may want a clear win and so hasten a deal. On the other hand, he may want to extend the trade war to encourage citizens to “rally around the flag” and show his geopolitical mettle amidst a distracting “witch hunt.” While we have faded these domestic risks in 2017 and 2018, we think that it may be difficult to do so in 2019. We stick by our view that previous impeachment bouts in the U.S. have had a temporary effect on the markets. But if market sentiment is already weakened by global growth and end of cycle concerns, a political crisis may become a bearish catalyst. Question 7: What About Japan? Japan faces higher policy uncertainty in 2019, after a period of calm following the 2015-16 global turmoil. We expect to see “peak Shinzo Abe” – in the sense that after this year, his political capital will be spent and all that will remain will be for him to preside over the 2020 Tokyo Olympics. The primary challenge for Abe is getting his proposed constitutional revisions passed despite economic headwinds. Assuming he goes forward, he must get a two-thirds vote in both houses of parliament plus a majority vote in a popular referendum. The referendum is unscheduled but could coincide with the July upper house elections. This will be a knife’s edge vote according to polling. If he holds the referendum and it passes, he will have achieved the historic goal of making Japan a more “normal” country, i.e. capable of revising its own constitution and maintaining armed forces. He will never outdo this. If he fails, he will become a lame duck – if he does not retire immediately like David Cameron or Matteo Renzi. And if he delays the revisions, he could miss his window of opportunity. This uncertain domestic political context will combine with China/EM and trade issues that entail significant risks for Japan and upward pressure on the yen. Hence government policy will resume its decidedly reflationary tilt in 2019. It makes little sense for Abe, looking to his legacy, to abandon his constitutional dream while agreeing to raise the consumption tax from 8% to 10% as expected in October. We would take the opposite side of the bet: he is more likely to delay the tax hike than he is to abandon constitutional revision. If Abe becomes a lame duck, whether through a failed referendum, a disappointing election, or a consumption tax hike amid a slowdown, it is important for investors to remember that “Abenomics” will smell just as sweet by any other name. Japan experienced a paradigm shift after a series of “earthquakes” from 2008-12. No leader is likely to raise taxes or cut spending aggressively, and monetary policy will remain ultra-easy for quite some time. The global backdrop is negative for Japan but its policy framework will act as a salve. Question 8: Are There Any Winners In EM? We think that EM and global risk assets could have a window of outperformance in early 2019. However, given the persistence of the policy divergence narrative, it will be difficult to see EM substantively outperforming DM over the course of 2019. Mexico Over Brazil That said, we do like a few EM plays in 2019. In particular, we believe that investors are overly bullish on Brazil and overly bearish on Mexico. In both countries, we think that voters turned to anti-establishment candidates due to concerns over violence and corruption. However, Brazilian President-elect Jair Bolsonaro has a high hurdle to clear. He must convince a traditionally fractured Congress to pass a complex and painful pension reform. In other words, Bolsonaro must show that he can do something in order to justify a rally that has already happened in Brazilian assets. In Mexico, on the other hand, Mexican President Andrés Manuel López Obrador (AMLO) remains constrained by the constitution (which he will be unable to change), the National Supreme Court of Justice, and political convention that Mexico is right-of-center on economic policy (an outwardly left-wing president has not won an election since 1924). In other words, AMLO has to show that he can get out of his constraints in order to justify a selloff that has already happened. To be clear, we are not saying that AMLO is a positive, in the absolute, for Mexico. The decision to scrap the Mexico City airport plans, to sideline the finance ministry from key economic decisions, and to threaten a return to an old-school PRI-era statism is deeply concerning. At the same time, we are not of the view that Bolsonaro is, in the absolute, a negative for Brazil. Rather, we are pointing out that the relative investor sentiment is overly bullish Bolsonaro versus AMLO. Especially given that both presidents remain constrained by domestic political intricacies and largely campaigned on the same set of issues that have little to do with their perceived economic preferences. They also face respective median voters that are diametrically opposed to their economic agendas – Bolsonaro, we think, is facing a left-leaning median voter, whereas the Mexican median voter is center-right. The macroeconomic perspective also supports our relative call. If our view on China and the Fed is correct, high-beta plays like Brazil will suffer, while an economy that is tied-to-the-hip of the U.S., like Mexico, ought to outperform EM peers.
Mexico Finally Has Some Positive Carry
Mexico Finally Has Some Positive Carry
As such, we are putting a long MXN/BRL trade on, to capture this sentiment gap between the two EM markets. Investors will be receiving positive carry on Mexico relative to Brazil for the first time in a long time (Chart 33). The relative change in the current account balance also favors Mexico (Chart 34). Finally, the technicals of the trade look good as well (Chart 35).
Mexico Looks Good On Current Account
Mexico Looks Good On Current Account
Technicals Look Good Too
Technicals Look Good Too
South Korea Over Taiwan Diplomacy remains on track on the Korean peninsula, despite U.S.-China tensions in other areas. Ultimately China believes that peace on the peninsula will remove the raison d’être of American troops stationed there. Moreover, Beijing has witnessed the U.S.’s resolve in deterring North Korean nuclear and missile tests and belligerent rhetoric. It will want to trade North Korean cooperation for a trade truce. By contrast, if Trump’s signature foreign policy effort fails, he may well lash out. We view deeply discounted South Korean equities as a long-term buy relative to other EMs. Taiwan, by contrast, is a similar EM economy but faces even greater short-term risks than South Korea. In the next 13-month period, the Tsai Ing-wen administration, along with the Trump administration, could try to seize a rare chance to upgrade diplomatic and military relations. This could heighten cross-strait tensions and lead to a geopolitical incident or crisis. More broadly, U.S.-China trade and tech tensions create a negative investment outlook for Taiwan. Thailand Over India Five state elections this fall have turned out very badly for Prime Minister Narendra Modi and his National Democratic Alliance (NDA). These local elections have a negative impact, albeit a limited one, on Modi’s and the NDA’s reelection chances in the federal election due in April (or May). Nevertheless, it is entirely possible to lose Chhattisgarh, Madhya Pradesh, and Rajasthan while still winning a majority in the Lok Sabha – this is what happened to the Indian National Congress in 2004 and 2009. So far federal election opinion polling suggests anything from a hung parliament to a smaller, but still substantial, BJP majority. Modi was never likely to maintain control of 20 out of 29 states for very long, nor to repeat his party’s sweeping 2014 victory. He was also never likely to continue his reform push uninhibited in the lead up to the general election. Nevertheless, the resignation of Reserve Bank of India Governor Urjit Patel on December 10 is a very worrisome sign. Given that Indian stocks are richly valued, and that we expect oil prices to drift upwards, we remain negative on India until the opportunity emerges to upgrade in accordance with our long-term bullish outlook. By contrast, we see the return to civilian rule in Thailand as a market-positive event in the context of favorable macro fundamentals. Thai elections always favor the rural populist “red” movement of the Shinawatra family, but presumably the military junta would not hold elections if it thought it had not sufficiently adjusted the electoral system in favor of itself and its political proxies. Either way, the cycle of polarization and social unrest will only reemerge gradually, so next year Thailand will largely maintain policy continuity and its risk assets will hold up better than most other EMs. Marko Papic, Senior Vice President Chief Geopolitical Strategist marko@bcaresearch.com Matt Gertken, Vice President Geopolitical Strategy mattg@bcaresearch.com Roukaya Ibrahim, Editor Strategist roukayai@bcaresearch.com Ekaterina Shtrevensky, Research Analyst ekaterinas@bcaresearch.com Footnotes 1 Please see Geopolitical Strategy Special Report, “Power And Politics In East Asia: Cold War 2.0?” dated September 25, 2012, Global Investment Strategy Special Report, “Searing Sun: Japan-China Conflict Heating Up,” dated January 25, 2013, “Sino-American Conflict: More Likely Than You Think, Part II,” dated November 6, 2015, and “The South China Sea: Smooth Sailing?” dated March 28, 2017, available at gps.bcaresearch.com. 2 Yes. He literally said that. Geopolitical Calendar
Highlights So What? Global divergence will persist beyond the near term. Why? China’s stimulus will be disappointing unless things get much worse. U.S.-China trade war will reignite and strategic tensions will continue. European risks are limited short-term, but will surge without reform. U.S. assets will outperform; oil and the yen will rise; the pound is a long-term play; EM pain will continue. Feature The year 2019 will be one of considerable geopolitical uncertainty. Three issues dominate our Outlook, with low-conviction views on all three questions: Question 1: How much will China stimulate? Question 2: Will the trade war abate? Question 3: Is Europe a Black Swan or a Red Herring? Chart 1U.S. Outperformance Should Be Bullish USD
U.S. Outperformance Should Be Bullish USD
U.S. Outperformance Should Be Bullish USD
The main story in 2018 was policy divergence. American policymakers ramped up stimulus – both through the profligate tax cuts and fiscal spending – at the same time that Chinese policymakers stuck to their guns on de-levering the economy. The consequence of this policy mix was that the synchronized global recovery of late 2016 and 2017 evolved into a massive outperformance by the U.S. economy (Chart 1). The Fed responded to the bullish domestic conditions with little regard for the global economy, causing the DXY to rally from a 2018 low of 88.59 in February to 97.04 today. Chart 2Fiscal Conservatism Melts Away
Fiscal Conservatism Melts Away
Fiscal Conservatism Melts Away
Chart 3Republicans Change Their Minds When In Power
Republicans Change Their Minds When In Power
Republicans Change Their Minds When In Power
While the policy divergence narrative appears to be macroeconomic in nature, it is purely political. There is nothing cyclical about the ‘U.S.’ economic outperformance in 2018. President Donald Trump campaigned on an economic populist agenda and then proceeded to deliver on it throughout 2017 and 2018. He faced little opposition from fiscal conservatives, mainly because fiscal conservativism melts away from the public discourse when budget deficits are low (Chart 2) and when the president is a Republican (Chart 3). Meanwhile, Chinese policymakers have decided to tolerate greater economic pain in an effort to escape the Middle Income Trap (Chart 4). They believe this trap will envelop them if they cannot grow the economy without expanding the already-massive build-up of leverage (Chart 5). Chart 4Policymakers Fear The Middle Income Trap
2019 Key Views: Balanced On A Knife’s Edge
2019 Key Views: Balanced On A Knife’s Edge
Chart 5Debt Still Rising
Debt Still Rising
Debt Still Rising
Geopolitics is not just about “things blowing up somewhere in the desert.” In today’s world, emblematized by paradigm shifts, politicians are more than ever in the driver’s seat. While technocrats respond to macroeconomic factors, politicians respond to political and geopolitical constraints. Few investment narratives last much longer than a year and policy divergence is coming to a close. Will the Fed pause given the turn in global growth? Will China respond with effective stimulus in 2019? If the answer to both questions is yes, global risk assets could light up in the next quarter and potentially beyond. Already EM has outperformed DM assets for a month and some canaries in the coal mine for global growth – like the performance of Swedish economic indicators – signal that the outperformance is real. Chart 6Global Economic Divergence Will Continue
Global Economic Divergence Will Continue
Global Economic Divergence Will Continue
Chart 7The Market Has Already Priced-In A Fed Pause
2019 Key Views: Balanced On A Knife’s Edge
2019 Key Views: Balanced On A Knife’s Edge
We are skeptical that the move is sustainable beyond a quarter or two (Chart 6). As our colleague Peter Berezin has highlighted, the market is pricing less than one hike in 2019 (Chart 7). Regardless, the impact on the U.S. dollar, remains muted, with the DXY at 97.04. This suggests that the backing off that the Fed may or may not have already done is still not enough from the perspective of weakening global growth (Chart 8). Global risk assets need more from the Fed than what the market is already pricing. And with U.S. inflationary pressures building (Chart 9), the BCA House View expects to see multiple Fed hikes in 2019, disappointing investors bullish on EM and global risk assets. Chart 8Global Growth Leading Indicators
Global Growth Leading Indicators
Global Growth Leading Indicators
Chart 9Does The Fed Like It Hot?
Does The Fed Like It Hot?
Does The Fed Like It Hot?
With our Fed view set by the House View, we therefore turn to where we can add value. To this end, the most important question of 2018 largely remains the same in 2019: How much will China stimulate? Question 1: How Much Will China Stimulate In 2019? Chart 10A Ray Of Hope From Broad Money
bca.gps_sr_2018_12_14_c10
bca.gps_sr_2018_12_14_c10
China is undoubtedly already stimulating, with a surge in local government bond issuance earlier this year and a bottoming in the broad money impulse (Chart 10). M2 is in positive territory. However, the effort can best be characterized as tepid, with a late-year collapse in bond issuance (Chart 11) and a still-negative total social financing (TSF) impulse (Chart 12). TSF is the broadest measure of private credit in China’s economy. Chart 11Fiscal Policy Becomes More Proactive?
2019 Key Views: Balanced On A Knife’s Edge
2019 Key Views: Balanced On A Knife’s Edge
Chart 12China's Total Credit Is Weak
China's Total Credit Is Weak
China's Total Credit Is Weak
We expect a surge in TSF in Q1, but this is a normal seasonal effect. A typical Q1 credit surge will not be enough to set global risk assets alight for very long, particularly if the market has already priced in as much of a “pause” from the Fed as we are going to get. Investors should specifically focus on new local government bond issuance and whether the “shadow financing” component of TSF gets a bid, since the primary reason for the weakness in TSF over the past year is the government’s crackdown on shadow lending. As Chart 13A & B shows, it was new local government bonds that led the way for stimulus efforts in 2015, followed by a surge in both bank lending and shadow lending in 2016. Chart 13ADon't Focus Just On TSF...
Don't Focus Just On TSF...
Don't Focus Just On TSF...
Chart 13B...But Shadow Financing In Particular
...But Shadow Financing In Particular
...But Shadow Financing In Particular
We would also expect further monetary policy easing, with extra RRR cuts or even a benchmark policy rate cut. However, monetary policy has been easy all year and yet the impact on credit growth has remained muted. This begs two important questions: Is the credit channel impaired? A slew of macroprudential reforms – which we have dubbed China’s “Preemptive Dodd-Frank” – may have impaired the flow of credit in the system. The official policy of “opening the front door, closing the back door” has seen bank loans pick up modestly but shadow lending has been curtailed (Chart 14A & B). This way of controlling the rise of leverage has its costs. For private enterprises – with poor access to the official banking sector – the shadow financial system was an important source of funding over the past several years. Chart 14AOpening The Front Door...
Opening The Front Door...
Opening The Front Door...
Chart 14B...Closing The Back Door
...Closing The Back Door
...Closing The Back Door
Is policy pushing on a string? An even more dire scenario would be if China’s credit channel is not technically, but rather psychologically, impaired. Multiple reasons may be to blame: a negative net return on the assets of state-owned enterprises (Chart 15); widespread trade war worries; mixed signals from policymakers; or a general lack of confidence in the political direction of the country. The rising M2/M1 ratio suggests that the overall economy’s “propensity to save” is rising (Chart 16). Chart 15Old China Is A Zombie China
Old China Is A Zombie China
Old China Is A Zombie China
Chart 16Propensity To Save
Propensity To Save
Propensity To Save
Why would Chinese policymakers keep their cool despite a slow pickup in credit growth? Are they not concerned about unemployment, social unrest, and instability? Of course, they are. But Chinese policymakers are not myopic. They also want to improve potential GDP over the long run. Table 1China: The Trend In Domestic Demand, And The Outlook For Trade, Is Negative
2019 Key Views: Balanced On A Knife’s Edge
2019 Key Views: Balanced On A Knife’s Edge
So far, the economy has weathered the storm relatively well. First, eight out of ten of our China Investment Strategy’s housing price indicators (Table 1) are flat-to-up – although it is true that the October deterioration in floor space started and especially floor space sold (Chart 17) is cause for concern. If and when the housing market weakens further, stimulus will be used to offset it, despite the fact that the government is attempting to prevent a sharp increase in prices at the same time. With so much of China’s middle-class savings invested in the housing market, the key pillar of socio-economic stability is therefore real estate. Chart 17A Possible Clue For China Stimulusr
A Possible Clue For China Stimulusr
A Possible Clue For China Stimulusr
Second, credit has fueled China’s “old economy,” but policymakers want to buoy “new China” (Chart 18). This means that measures to boost consumption and the service sector economy will be emphasized in new rounds of stimulus, as has occurred thus far (tax cuts, tariff cuts, deregulation, etc). This kind of stimulus is not great news for global risk assets leveraged to “old China,” such as EM and industrial metals. Chart 18Rebalancing Of The Chinese Economy
Rebalancing Of The Chinese Economy
Rebalancing Of The Chinese Economy
Third, policymakers are not exclusively focused on day-to-day stability but are also focused on the decades-long perseverance of China’s political model. And that means moving away from leverage and credit as the sole fuel for the economy. This is not just about the Middle Income Trap, it is also about national security and ultimately sovereignty. Relying on corporate re-levering for stimulus simply doubles-down on the current economic model, which is still export-oriented given that most investment is geared toward the export sector. But this also means that China will be held hostage to foreign demand and thus geopolitical pressures, a fact that has been revealed this year through the protectionism of the White House. As such, moving away from the investment-led growth model and towards a more endogenous, consumer-led model is not just good macro policy, it makes sense geopolitically as well. Will the trade war – or the current period of trade truce – change Chinese policymakers’ decision-making? We do not see why it would. First, if the trade truce evolves into a trade deal, the expected export shock will not happen (Chart 19) and thus major stimulative measures would be less necessary. Second, if we understand correctly why policymakers have cited leverage as an “ill” in the first place, then we would assume that they would use the trade war as an excuse for the pain that they themselves have instigated. In other words, the trade war with the U.S. gives President Xi Jinping the perfect excuse for the slowdown, one that draws attention from the real culprit: domestic rebalancing. Chart 19Trump's Initial Tariffs Soon To Be Felt
Trump's Initial Tariffs Soon To Be Felt
Trump's Initial Tariffs Soon To Be Felt
Bottom Line: Since mid-2018, we have been asking clients to focus on our “Stimulus Overshoot” checklist (Table 2). We give the first item – “broad money and/or total credit growth spike” – a premier spot on the list. If a surge in total credit occurs, we will know that policymakers are throwing in the towel and stimulating in a major way. It will be time to turn super-positive on global risk assets, beyond a mere tactical trade, as a cyclical view at that point. Note that if one had gone long EM in early February 2016, when January data revealed a truly epic TSF splurge, one would not have been late to the rally. Table 2Will China’s Stimulus Overshoot In 2019?
2019 Key Views: Balanced On A Knife’s Edge
2019 Key Views: Balanced On A Knife’s Edge
Our low-conviction view, at the moment, is that the increase in credit growth that we will see in Q1 will be seasonal – the usual frontloading of lending at the beginning of the year – rather than an extraordinary surge that would signal a policy change. A modest increase in credit growth will not be enough to spark a sustainable – year-long – rally in global risk assets. The Fed has already backed off as far as the market is concerned. As such, a pickup in Chinese credit could temporarily excite investors. But global stabilization may only embolden the Fed to refocus on tightening after a Q1 pause. Question 2: Will The Trade War Abate? The first question for investors when it comes to the trade war is “Why should we care?” Sure, trade policy uncertainty appears to have correlated with the underperformance of global equity indices relative to the U.S. (Chart 20). However, such market action was as much caused by our policy divergence story – being as it is deeply negative for EM assets – as by a trade war whose impact on the real economy has not yet been felt. Chart 20U.S. Is 'Winning' The Trade War
U.S. Is 'Winning' The Trade War
U.S. Is 'Winning' The Trade War
Nonetheless, we do believe that getting the trade war “right” is a big call for 2019. First, while the impact of the U.S.-China trade war has been minimal thus far, it is only because China front-loaded its exports ahead of the expected tariffs, cut interbank rates and RRRs, accelerated local government spending, and allowed CNY/USD to depreciate by 10%. A restart of trade tensions that leads to further tariffs will make frontloading untenable over time, whereas further currency depreciation would be severely debilitating for EMs. We doubt the sustainability of the trade truce for three reasons: U.S. domestic politics: The just-concluded midterm election saw no opposition to President Trump on trade. The Democratic Party candidates campaigned against the president on a range of issues, but not on his aggressive China policy. Polling from the summer also shows that a majority of American voters consider trade with China unfair (Chart 21). In addition, President Trump will walk into the 2020 election with a wider trade deficit, due to his own stimulative economic policy (Chart 22). He will need to explain why he is “losing” on the one measure of national power that he campaigned on in 2016. Structural trade tensions: Ahead of the G20 truce, the U.S. Trade Representative Robert Lighthizer issued a hawkish report that concluded that China has not substantively changed any of the trade practices that initiated U.S. tariffs. Lighthizer has been put in charge of the current trade negotiations, which is a step-up in intensity from Treasury Secretary Steven Mnuchin, who was in charge of the failed May 2018 round. Geopolitical tensions: The G20 truce did not contain any substantive resolution to the ongoing strategic tensions between the U.S. and China, such as in the South China Sea. Beyond traditional geopolitics, tensions are increasingly involving high-tech trade and investment between the two countries and American allegations of cyber theft and spying by China. The recent arrest of Huawei’s CFO in Canada, on an American warrant, will likely deepen this high-tech conflict in the short term. Chart 21Americans Are Focused On China As Unfair
2019 Key Views: Balanced On A Knife’s Edge
2019 Key Views: Balanced On A Knife’s Edge
Chart 22Trade Deficit To Rise Despite Tariffs
Trade Deficit To Rise Despite Tariffs
Trade Deficit To Rise Despite Tariffs
Since the G20 truce with Xi, President Trump has seen no significant pickup in approval ratings (Chart 23). Given that the median American voter has embraced protectionism – against China at least – we would not expect any. Meanwhile, U.S. equities have sold off, contrary to what President Trump, or his pro-trade advisors, likely expected in making the G20 decision to delay tariffs. Chart 23Appeasing China Doesn't Pay
Appeasing China Doesn't Pay
Appeasing China Doesn't Pay
At some point, President Trump will realize that he risks considerable political capital on a trade deal with China that very few voters actually want or that the U.S. intelligence and defense community supports. Democrats did not oppose his aggressive China policy in the midterm election because they know that the median voter does not want it. As such, it is guaranteed that Trump’s 2020 Democratic Party opponent will accuse him of “surrender,” or at least “weakness.” If, over the next quarter, the economic and market returns on his gambit are paltry, we would expect President Trump to end the truce. Furthermore, we believe that a substantive, and long-lasting, trade deal is unlikely given the mounting tensions between China and the U.S. These tensions are not a product of President Trump, but are rather a long-run, structural feature of the twenty-first century that we have been tracking since 2012.1 Tensions are likely to rise in parallel to the trade talks on the technology front. We expect 2019 to be the year when investors price in what we have called Bifurcated Capitalism: the segmentation of capital, labor, and trade flows into geopolitically adversarial – and yet capitalist in nature – economic blocs. Entire countries and sectors may become off-limits to Western investors and vice-versa for their Chinese counterparts. Countries will fall into either the Tencent and Huawei bloc or the Apple and Ericsson bloc. This development is different from the Cold War. Note our emphasis on capitalism in the term Bifurcated Capitalism. The Soviet Union was obviously not capitalist, and clients of BCA did not have interests in its assets in the 1970s and 1980s. Trade between Cold War economic blocs was also limited, particularly outside of commodities. The closest comparison to the world we now inhabit is that of the nineteenth century. Almost all global powers were quite capitalist at the time, but they engaged in imperialism in order to expand their economic spheres of influence and thus economies of scale. In the twenty-first century, Africa and Asia – the targets of nineteenth century imperialism – may be replaced with market share wars in novel technologies and the Internet. This will put a ceiling on how much expansion tech and telecommunication companies can expect in the competing parts of Bifurcated Capitalism. The investment consequences of this concept are still unclear. But what is clear is that American policymakers are already planning for some version of the world we are describing. The orchestrated effort by the U.S. intelligence community to encourage its geopolitical allies to ban the use of Huawei equipment in their 5G mobile networks suggests that there are limits to the current truce ever becoming a sustainable deal. So does the repeated use of economic sanctions originally designed for Iran and Russia against Chinese companies. President Trump sets short- and medium-term policies given that he is the president. However, the intelligence and defense communities have “pivoted to Asia” gradually since 2012. This shift has occurred because the U.S. increasingly sees China as a peer competitor, for the time being confined in East Asia but with intentions of projecting power globally. To what extent could President Trump produce a trade deal with Xi that also encompasses a change in the U.S. perception of China as an adversary? We assign a low probability to it. As such, President Xi has little reason to give in to U.S. pressure on trade, as he knows that the geopolitical and technology pressure will continue. In fact, President Xi may have all the reason to double-down on his transformative reforms, which would mean more pain for high-beta global plays. Bottom Line: What may have appeared as merely a trade conflict has evolved into a broad geopolitical confrontation. President Trump has little reason to conclude a deal with China by March. Domestic political pressures are not pushing in the direction of the deal, while America’s “Deep State” is eager for a confrontation with China. Furthermore, with President Trump “blinking” on Iranian sanctions, his administration has implicitly acknowledged the constraints discouraging a deeper involvement in the Middle East. This puts the geopolitical focus squarely on China. Question 3: Is Europe a Black Swan or a Red Herring? The last two years have been a dud in Europe. Since the Brexit referendum in mid-2016, European politics have not been a catalyst for global markets, save for an Italy-induced sell-off or two. This could substantively change in 2019. And, as with the first two questions, the results could be binary. On one hand, there is the positive scenario where the stalled and scaled-back reforms on the banking union and Euro Area budget get a shot in the arm in the middle of the year. On the other hand, the negative scenario would see European-wide reforms stall, leaving the continent particularly vulnerable as the next global recession inevitably nears. At the heart of the binary distribution is the broader question of whether populism in Europe is trending higher. Most commentators and our clients would say yes, especially after the protests and rioting in Paris over the course of November. But the answer is more complicated than that. While populists have found considerable success in the ballot box (Chart 24), they have not managed to turn sentiment in Europe against the currency union (Chart 25). Even in Italy, which has a populist coalition government in power, the support for currency union is at 61%, the highest since 2012. This number has apparently risen since populists took over. Chart 24Anti-Establishment Parties Are Rising...
Anti-Establishment Parties Are Rising...
Anti-Establishment Parties Are Rising...
Chart 25...But Euroskepticism Is A Failed Strategy
...But Euroskepticism Is A Failed Strategy
...But Euroskepticism Is A Failed Strategy
What explains this divergence? Effectively, Europe’s establishment parties are being blamed for a lot of alleged ills, liberal immigration policy first amongst them. However, European integration remains favored across the ideological spectrum. Few parties that solely focus on Euroskepticism have any chance of winning power, something that both Lega and Five Star Movement found out in Italy. Italy’s Deputy Prime Minister Matteo Salvini confirmed his conversion away from Euroskepticism by stating that he wants to “reform the EU from the inside” and that it was time to give the “Rome-Berlin axis” another go.2 Salvini is making a bet – correct in our view – that by moderating Lega’s populism on Europe, he can capture the center ground and win the majority in the next Italian election, which could happen as soon as 2019. As such, we don’t think that the “rise of populism” in Europe is either dramatic or market-relevant. In fact, mainstream parties are quickly adopting parts of the anti-establishment agenda, particularly on immigration, in a bid to recoup lost voters. A much bigger risk for Europe than populism is stagnation on the reform front, a perpetual Eurosclerosis that leaves the bloc vulnerable in the next recession. What Europe needs is the completion of a backstop to prevent contagion. Such a backstop necessitates greatly enhancing the just-passed banking union reforms. The watered-down reforms did not include a common backstop to the EU’s single resolution fund nor a deposit union. A working group will report on both by June 2019, with a potential legislative act set for some time in 2024. What could be a sign that the EU is close to a grand package of reforms in 2019? We see three main avenues. First, a political shift in Germany. Investors almost had one, with conservative Friedrich Merz coming close to defeating Merkel’s hand-picked successor Annegret Kramp-Karrenbauer (also known as AKK) for the leadership of the ruling Christian Democratic Union (CDU). Merz combined a right-leaning anti-immigrant stance with staunch pro-European integration outlook. It is unclear whether AKK will be willing to make the same type of “grand bargain” with the more conservative factions of the CDU electorate. However, AKK may not have a choice, with both Alternative for Germany (AfD) and the Green Party nibbling at the heels of the right-of-center CDU and left-of-center Social-Democratic Party (SPD) (Chart 26). The rise of the Green party is particularly extraordinary, suggesting that a larger portion of the German electorate is radically Europhile rather than Euroskeptic. AKK may have to adopt Merz’s platform and then push for EU reforms. Chart 26Challengers To The Established Parties
Challengers To The Established Parties
Challengers To The Established Parties
Second, French President Emmanuel Macron may have to look abroad for relevance. With his reform agenda stalled and political capital drained, it would make sense for Macron to spend 2019 and beyond on European reforms. Third, a resolution of the Brexit debacle. The longer the saga with the U.K. drags on, the less focus there will be in Europe on integration of the Euro Area. If the U.K. decides to extend the current negotiating period, it may even have to hold elections for the European Parliament. As such, we are not focusing on the budget crisis in Italy – our view that Rome is “bluffing” is coming to fruition –or a potential early election in Spain. And we are definitely not focusing on the EU Parliamentary election in May. These will largely be red herrings. The real question is whether European policymakers will finally have a window of opportunity for strategic reforms. And that will require Merkel, AKK, and Macron to expend whatever little political capital they have left and invest it in restructuring European institutions. Finally, a word on Europe’s role in the global trade war. While Europe is a natural ally for the U.S. against China – given its institutional connections, existing alliance, and trade surplus with the latter and deficit with the former (Chart 27) – we believe that the odds are rising of a unilateral tariff action by the U.S. on car imports. Chart 27EU Surplus With U.S. Pays For Deficit With China
EU Surplus With U.S. Pays For Deficit With China
EU Surplus With U.S. Pays For Deficit With China
This is because the just-concluded NAFTA deal likely raised the cost of vehicle production in the trade bloc, necessitating import tariffs in order for the deal to make sense from President Trump’s set of political priorities. The Trump administration may not have the stomach for a long-term trade war with Europe, but it can shake up the markets with actions in that direction. Bottom Line: In the near term, there are no existential political risks in Europe in 2019. As such, investors who are bullish on European assets should not let geopolitics stand in the way of executing on their sentiment. We remain cautious for macroeconomic reasons, namely that Europe is a high-beta DM play that needs global growth to outperform in order to catch a bid. However, 2019 is a make-or-break year on key structural reforms in Europe. Without more work on the banking union – and without greater burden sharing, broadly defined – the Euro Area will remain woefully unprepared for the next global recession. Question 4: Will Brexit Happen? Given the volume of market-relevant geopolitical issues, we have decided to pose (and attempt to answer) five additional questions for 2019. We start with Brexit. Prime Minister Theresa May has asked for a delay to the vote in the House of Commons on the Withdrawal Treaty, which she would have inevitably lost. The defeat of the subsequent leadership challenge is not confidence-inspiring as the vote was close and a third of Tory MPs voted against her. May likely has until sometime in January to pass the EU Withdrawal Agreement setting out the terms of Brexit, given that all other EU member states have to get it through their parliaments before the Brexit date on March 29. The real question is whether any deal can get through Westminster. The numbers are there for the softest of soft Brexits, the so-called Norway+ option where the U.K. effectively gets the same deal as Norway, if May convinces the Labour Party to break ranks. Such a deal would entail Common Market access, but at the cost of having to pay essentially for full EU membership with no ability to influence the regulatory policies that London would have to abide by. The alternative is to call for a new election – which may usher the even less pro-Brexit Labour Party into power – or to delay Brexit for a more substantive period of time, or simply to buckle under the pressure and call for a second referendum. We disagree that the delay signals that the “no deal Brexit,” or the “Brexit cliff,” is nigh. Such an outcome is in nobody’s interest and both May and the EU can offer delays to ensure that it does not happen. Whatever happens, one thing is clear: the median voter is turning forcefully towards Bremain (Chart 28). It will soon become untenable to delay the second referendum. And even if the House of Commons passes the softest of Soft Brexit deals, we expect that the Norway+ option will prove to be unacceptable when Westminster has to vote on it again in two or three year’s time. Chart 28Bremain Surging Structurally
Bremain Surging Structurally
Bremain Surging Structurally
Is it time to buy the pound, particularly cable, which is cheap on a long-term basis (Chart 29)? It is a tough call. On one hand, our confidence that the U.K. ultimately has to remain in the EU is rising. However, to get there, the U.K. may need one last major dose of volatility, either in the form of a slow-burn crisis caused by Tory indecision or in the form of a far-left Labour government that tries its own hand at Brexit while pursuing a 1970s style left-wing economic agenda. Can any investor withstand this kind of volatility in the short and potentially long-ish term? Only the longest of the long-term investors can. Chart 29Start Buying The Pound
Start Buying The Pound
Start Buying The Pound
Question 5: Will Oil Prices Rally Substantively In 2019? Several risks to oil supply remain for 2019. First, there is little basis for stabilization in Venezuelan oil production, and further deterioration is likely (Chart 30). Second, sectarian tensions in Iraq remain unresolved. Third, supply risks in other geopolitical hot spots – like Nigeria and Libya – could surprise in 2019. Chart 30Venezuela: On A Downward Spiral
Venezuela: On A Downward Spiral
Venezuela: On A Downward Spiral
The most pressing geopolitical issue, however, is a decision on the Iranian sanction waivers. President Trump induced considerable market-volatility in 2019 by signaling that he would use “maximum pressure” against Iran. As a result, the risk premium contribution to the oil price – illustrated in Chart 31 by the red bar – rose throughout 2018, only to collapse as the White House offered six-month sanction waivers. Not only did the risk premium dissipate, but Saudi Arabia then scrambled to reverse the production surge it had instituted to offset the Iran sanctions. Chart 31Trump Sanctions Boosted Risk Premium
2019 Key Views: Balanced On A Knife’s Edge
2019 Key Views: Balanced On A Knife’s Edge
We agree with BCA’s Commodity & Energy Strategy that oil market fundamentals are tight and numerous supply risks loom. We also struggle to see why President Trump will seek to pick a fight with Iran in the summer of 2019. Our suspicion is that if President Trump was afraid of a gasoline-price spike right after the midterm election, why would he not “blink” at the end of the spring? Not only will the U.S. summer driving season be in full swing – a time of peak U.S. gasoline demand – but the 2020 election primaries will only be six months away. Furthermore, it is highly unlikely that OPEC and Russia will do the U.S. president’s bidding by turning on the taps to offset any unforeseen supply losses in 2019. They did not do so even when President Trump asked, very nicely, ahead of the just-concluded Vienna meeting. Once Trump prioritized domestic politics over Saudi geopolitical interests – by backing away from his maximum pressure tactic against Iran – he illustrated to Riyadh that his administration is about as reliable of an ally as the Obama White House. Meanwhile, his ardent defense of Riyadh in the Khashoggi affair, at a cost of domestic political capital, means that he lost the very leverage that he could have used to pressure Saudi Arabia. We therefore remain cautiously bullish on oil prices in 2019, but with the caveat that a big-bang surge in prices due to a U.S.-Iran confrontation – our main risk for 2019 just a few months ago – is now less likely. Question 6: Will Impeachment Become A Risk In 2019? While we have no way to forecast the Mueller investigation, it is undoubtedly clear that risks are rising on the U.S. domestic front. President Trump’s popularity among GOP voters is elevated and far from levels needed to convince enough senators to remove him from power (Chart 32). However, a substantive finding by Mueller may leave the moderate Democrats in the House with no choice but to pursue impeachment. Chart 32Barometer Of Trump’s Survival
2019 Key Views: Balanced On A Knife’s Edge
2019 Key Views: Balanced On A Knife’s Edge
This may rattle the market for both headline and fundamental reasons. The headline reasons are obvious. The fundamental reasons have to do with the looming stimulus cliff in 2020. A pitched battle between the House Democrats and the White House would make cooperation on another substantive stimulus effort less likely and thus a recession in 2020 more likely. The market may start pricing in such an outcome at some point in 2019. Furthermore, sentiment could be significantly impacted by a protracted domestic battle that impairs Trump’s domestic agenda. President Bill Clinton sought relevance abroad amidst his impeachment proceedings by initiating an air war against Yugoslavia. President Trump may do something similar. There is also an unclear relationship between domestic tensions and trade war. On one hand, President Trump may want a clear win and so hasten a deal. On the other hand, he may want to extend the trade war to encourage citizens to “rally around the flag” and show his geopolitical mettle amidst a distracting “witch hunt.” While we have faded these domestic risks in 2017 and 2018, we think that it may be difficult to do so in 2019. We stick by our view that previous impeachment bouts in the U.S. have had a temporary effect on the markets. But if market sentiment is already weakened by global growth and end of cycle concerns, a political crisis may become a bearish catalyst. Question 7: What About Japan? Japan faces higher policy uncertainty in 2019, after a period of calm following the 2015-16 global turmoil. We expect to see “peak Shinzo Abe” – in the sense that after this year, his political capital will be spent and all that will remain will be for him to preside over the 2020 Tokyo Olympics. The primary challenge for Abe is getting his proposed constitutional revisions passed despite economic headwinds. Assuming he goes forward, he must get a two-thirds vote in both houses of parliament plus a majority vote in a popular referendum. The referendum is unscheduled but could coincide with the July upper house elections. This will be a knife’s edge vote according to polling. If he holds the referendum and it passes, he will have achieved the historic goal of making Japan a more “normal” country, i.e. capable of revising its own constitution and maintaining armed forces. He will never outdo this. If he fails, he will become a lame duck – if he does not retire immediately like David Cameron or Matteo Renzi. And if he delays the revisions, he could miss his window of opportunity. This uncertain domestic political context will combine with China/EM and trade issues that entail significant risks for Japan and upward pressure on the yen. Hence government policy will resume its decidedly reflationary tilt in 2019. It makes little sense for Abe, looking to his legacy, to abandon his constitutional dream while agreeing to raise the consumption tax from 8% to 10% as expected in October. We would take the opposite side of the bet: he is more likely to delay the tax hike than he is to abandon constitutional revision. If Abe becomes a lame duck, whether through a failed referendum, a disappointing election, or a consumption tax hike amid a slowdown, it is important for investors to remember that “Abenomics” will smell just as sweet by any other name. Japan experienced a paradigm shift after a series of “earthquakes” from 2008-12. No leader is likely to raise taxes or cut spending aggressively, and monetary policy will remain ultra-easy for quite some time. The global backdrop is negative for Japan but its policy framework will act as a salve. Question 8: Are There Any Winners In EM? We think that EM and global risk assets could have a window of outperformance in early 2019. However, given the persistence of the policy divergence narrative, it will be difficult to see EM substantively outperforming DM over the course of 2019. Mexico Over Brazil That said, we do like a few EM plays in 2019. In particular, we believe that investors are overly bullish on Brazil and overly bearish on Mexico. In both countries, we think that voters turned to anti-establishment candidates due to concerns over violence and corruption. However, Brazilian President-elect Jair Bolsonaro has a high hurdle to clear. He must convince a traditionally fractured Congress to pass a complex and painful pension reform. In other words, Bolsonaro must show that he can do something in order to justify a rally that has already happened in Brazilian assets. In Mexico, on the other hand, Mexican President Andrés Manuel López Obrador (AMLO) remains constrained by the constitution (which he will be unable to change), the National Supreme Court of Justice, and political convention that Mexico is right-of-center on economic policy (an outwardly left-wing president has not won an election since 1924). In other words, AMLO has to show that he can get out of his constraints in order to justify a selloff that has already happened. To be clear, we are not saying that AMLO is a positive, in the absolute, for Mexico. The decision to scrap the Mexico City airport plans, to sideline the finance ministry from key economic decisions, and to threaten a return to an old-school PRI-era statism is deeply concerning. At the same time, we are not of the view that Bolsonaro is, in the absolute, a negative for Brazil. Rather, we are pointing out that the relative investor sentiment is overly bullish Bolsonaro versus AMLO. Especially given that both presidents remain constrained by domestic political intricacies and largely campaigned on the same set of issues that have little to do with their perceived economic preferences. They also face respective median voters that are diametrically opposed to their economic agendas – Bolsonaro, we think, is facing a left-leaning median voter, whereas the Mexican median voter is center-right. The macroeconomic perspective also supports our relative call. If our view on China and the Fed is correct, high-beta plays like Brazil will suffer, while an economy that is tied-to-the-hip of the U.S., like Mexico, ought to outperform EM peers. Chart 33Mexico Finally Has Some Positive Carry
Mexico Finally Has Some Positive Carry
Mexico Finally Has Some Positive Carry
As such, we are putting a long MXN/BRL trade on, to capture this sentiment gap between the two EM markets. Investors will be receiving positive carry on Mexico relative to Brazil for the first time in a long time (Chart 33). The relative change in the current account balance also favors Mexico (Chart 34). Finally, the technicals of the trade look good as well (Chart 35). Chart 34Mexico Looks Good On Current Account
Mexico Looks Good On Current Account
Mexico Looks Good On Current Account
Chart 35Technicals Look Good Too
Technicals Look Good Too
Technicals Look Good Too
South Korea Over Taiwan Diplomacy remains on track on the Korean peninsula, despite U.S.-China tensions in other areas. Ultimately China believes that peace on the peninsula will remove the raison d’être of American troops stationed there. Moreover, Beijing has witnessed the U.S.’s resolve in deterring North Korean nuclear and missile tests and belligerent rhetoric. It will want to trade North Korean cooperation for a trade truce. By contrast, if Trump’s signature foreign policy effort fails, he may well lash out. We view deeply discounted South Korean equities as a long-term buy relative to other EMs. Taiwan, by contrast, is a similar EM economy but faces even greater short-term risks than South Korea. In the next 13-month period, the Tsai Ing-wen administration, along with the Trump administration, could try to seize a rare chance to upgrade diplomatic and military relations. This could heighten cross-strait tensions and lead to a geopolitical incident or crisis. More broadly, U.S.-China trade and tech tensions create a negative investment outlook for Taiwan. Thailand Over India Five state elections this fall have turned out very badly for Prime Minister Narendra Modi and his National Democratic Alliance (NDA). These local elections have a negative impact, albeit a limited one, on Modi’s and the NDA’s reelection chances in the federal election due in April (or May). Nevertheless, it is entirely possible to lose Chhattisgarh, Madhya Pradesh, and Rajasthan while still winning a majority in the Lok Sabha – this is what happened to the Indian National Congress in 2004 and 2009. So far federal election opinion polling suggests anything from a hung parliament to a smaller, but still substantial, BJP majority. Modi was never likely to maintain control of 20 out of 29 states for very long, nor to repeat his party’s sweeping 2014 victory. He was also never likely to continue his reform push uninhibited in the lead up to the general election. Nevertheless, the resignation of Reserve Bank of India Governor Urjit Patel on December 10 is a very worrisome sign. Given that Indian stocks are richly valued, and that we expect oil prices to drift upwards, we remain negative on India until the opportunity emerges to upgrade in accordance with our long-term bullish outlook. By contrast, we see the return to civilian rule in Thailand as a market-positive event in the context of favorable macro fundamentals. Thai elections always favor the rural populist “red” movement of the Shinawatra family, but presumably the military junta would not hold elections if it thought it had not sufficiently adjusted the electoral system in favor of itself and its political proxies. Either way, the cycle of polarization and social unrest will only reemerge gradually, so next year Thailand will largely maintain policy continuity and its risk assets will hold up better than most other EMs. Marko Papic, Senior Vice President Chief Geopolitical Strategist marko@bcaresearch.com Matt Gertken, Vice President Geopolitical Strategy mattg@bcaresearch.com Roukaya Ibrahim, Editor Strategist roukayai@bcaresearch.com Ekaterina Shtrevensky, Research Analyst ekaterinas@bcaresearch.com Footnotes 1 Please see Geopolitical Strategy Special Report, “Power And Politics In East Asia: Cold War 2.0?” dated September 25, 2012, Global Investment Strategy Special Report, “Searing Sun: Japan-China Conflict Heating Up,” dated January 25, 2013, “Sino-American Conflict: More Likely Than You Think, Part II,” dated November 6, 2015, and “The South China Sea: Smooth Sailing?” dated March 28, 2017, available at gps.bcaresearch.com. 2 Yes. He literally said that. Geopolitical Calendar