China
Like in 2018, risk asset returns next year will be influenced by how much further the Chinese economy will slow and when it will ultimately bottom. Also like in 2018, the answers to these questions are subject to the battle between reform and stimulus. …
Earlier this year our EM, China, and geopolitical strategists highlighted that 2018 would be a year of weaker Chinese growth. This view has broadly panned out (see chart), although the trade war with the United States has ironically boosted economic activity…

Highlights China’s old economy is set to decelerate in the first half of 2019, regardless of the recent tariff ceasefire. Our base case view is that growth will modestly firm in the second half of 2019, but timing the trough will depend on the dynamics of a battle between debt-focused policymakers and a credit-driven economy. Renewed weakness in China's currency has the potential to rekindle (and reinforce) the now-dormant concern of widespread capital flight. Investors should be alert to its re-emergence, as it would likely have implications for a broad range of financial assets (not just the exchange rate). A tactical overweight stance towards Chinese stocks (either the domestic or investable market) within a global equity portfolio is probably warranted over the coming three months. The conditions for a cyclical overweight stance (6-12 months) are not yet present but may emerge sometime in 2019, particularly if money & credit growth begin to pick up. Defaults in China’s onshore corporate bond market will rise next year, but will likely positively surprise investors. We continue to recommend a diversified position in this asset class for domestic investors and qualified global investors in hedged currency terms. Feature BCA recently published its special year end Outlook report for 2019,1 which described the macro themes that are likely to drive global financial markets over the coming year. In this week’s China Investment Strategy report we expand on the Outlook, by reviewing our four key themes for China in the year ahead. Key Theme # 1: The Battle Between Reluctant Policymakers And A Weakening Economy We presented a stylized view of China’s recent mini-cycle late last year (Chart 1), and argued that while an economic slowdown was underway it would most likely be a benign and controlled deceleration. Chart 1China’s Growth Profile Has Largely Been In Line With What We Forecasted Last Year…
2019 Key Views: Four Themes For China In The Coming Year
2019 Key Views: Four Themes For China In The Coming Year
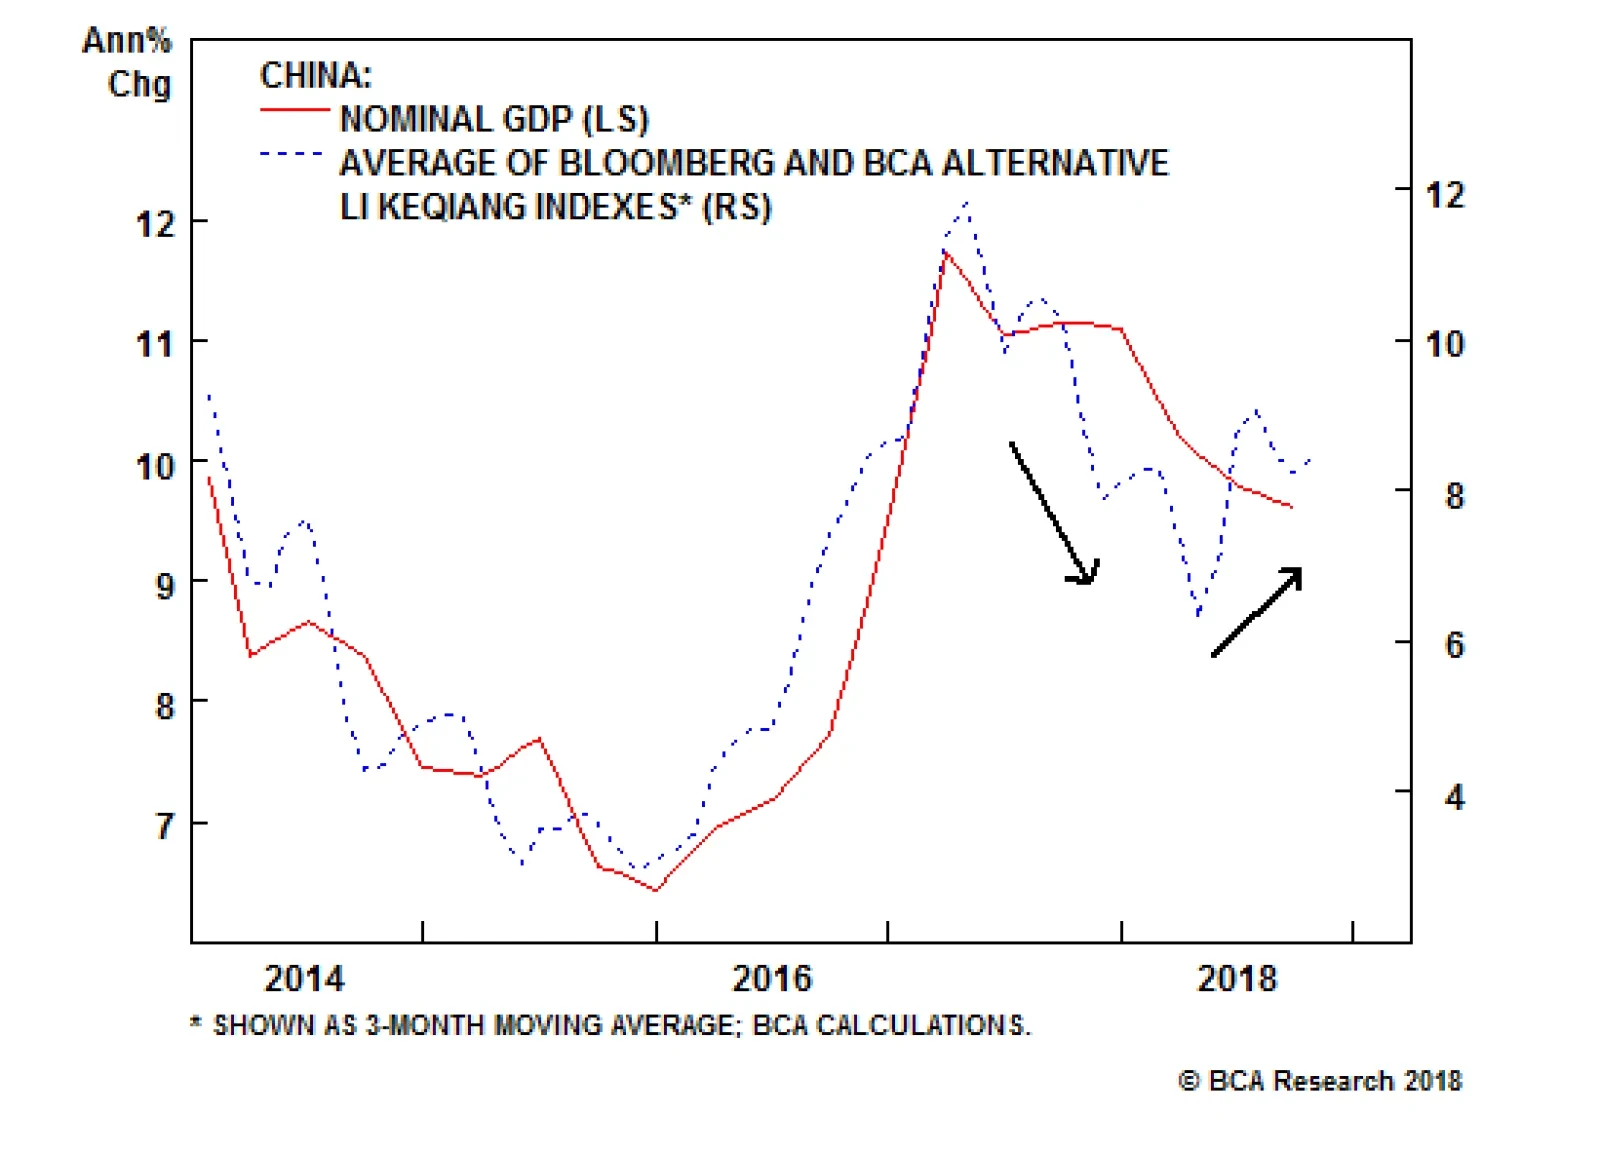
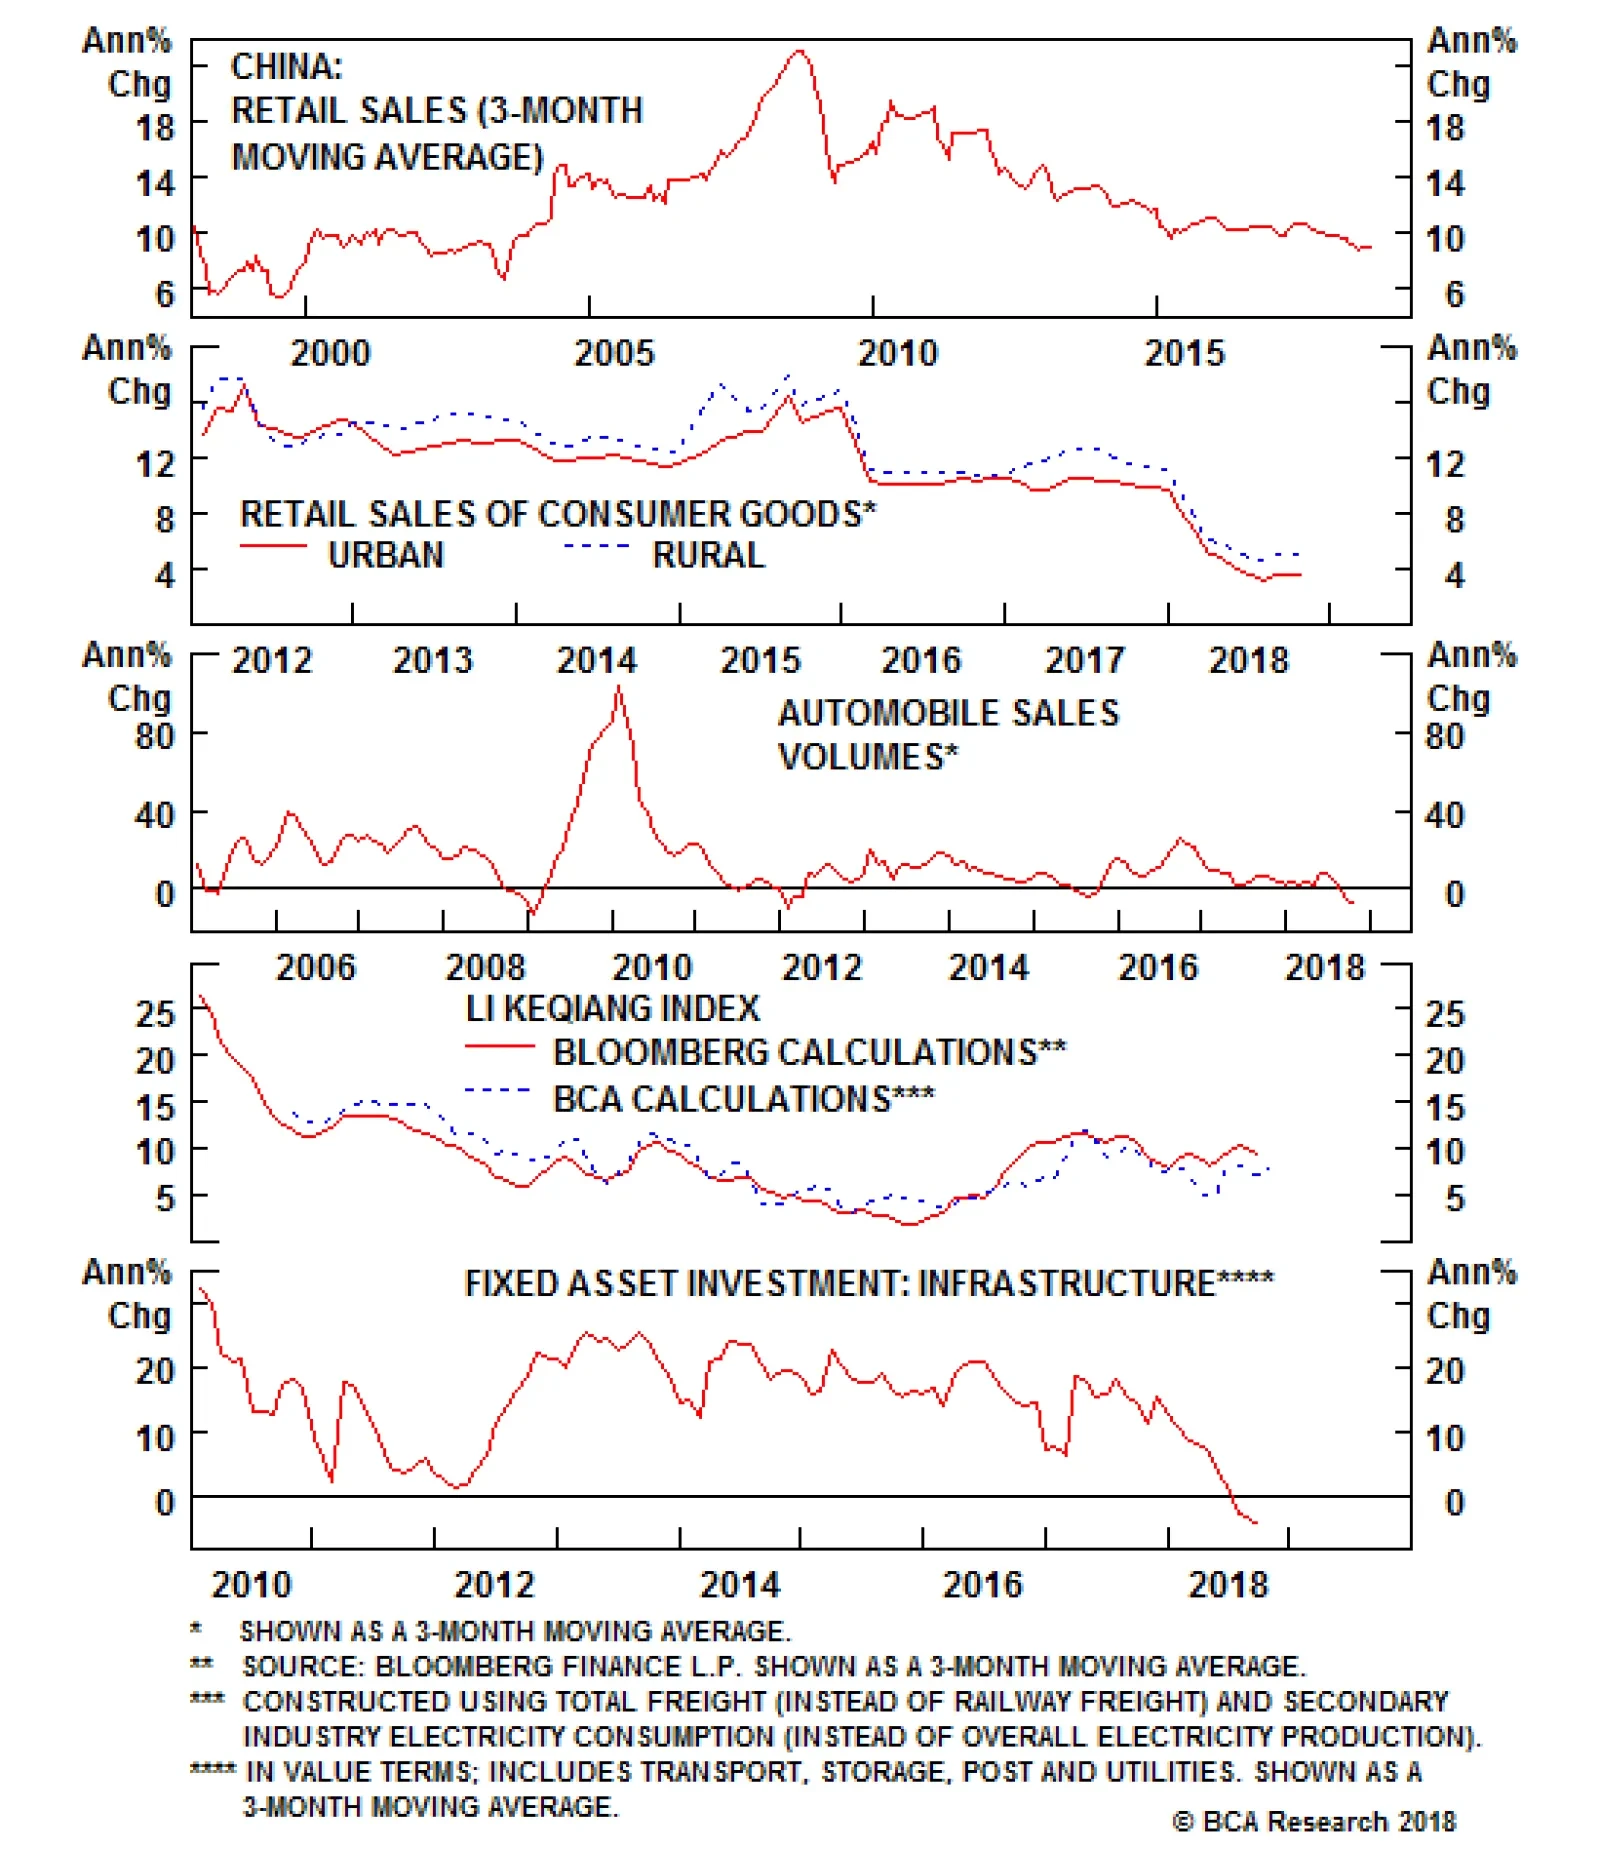
Chart 2 highlights that this view has broadly panned out, although the trade war with the United States has ironically (and only temporarily) boosted economic activity over the past several months. When measured by nominal GDP growth, the chart shows that the Chinese economy has retraced roughly 40% of the acceleration that occurred from late-2015 to early-2017, which is entirely consistent with the benign slowdown scenario that we presented a year ago. However, when measured by the Li Keqiang index, the chart shows that growth momentum stumbled quite significantly earlier this year, only to somewhat recover over the past two quarters. Chart 2...But Growth Stumbled In The First Half Of 2018
...But Growth Stumbled In The First Half Of 2018
...But Growth Stumbled In The First Half Of 2018
Chart 3 suggests that this recent recovery in the coincident data has been strongly driven by trade front-running. The chart shows an average of nominal Chinese import and export growth alongside growth in freight volume and manufacturing fixed-asset investment, and makes it clear that the recent pickup in activity has been due to persistently strong trade growth that is unlikely to continue. Chart 3Trade Front-Running Has Clearly Boosted Economic Activity
Trade Front-Running Has Clearly Boosted Economic Activity
Trade Front-Running Has Clearly Boosted Economic Activity
This weekend’s short-term tariff ceasefire between the U.S. and China means that the trade shock will be of considerably reduced intensity than originally feared during the negotiation period. Nonetheless, the front-running effect is set to wane regardless of the existence of negotiations, implying that China’s old economy is set to recouple with our BCA Li Keqiang leading indicator in the first half of 2019. While the indicator has recently ticked up, this is almost entirely due to the recent depreciation in the RMB, as money and credit growth remain flat. For now, investors should focus on the level of the indicator, which is predicting a slowdown in economic activity over the coming several months (Chart 4). Chart 4A Slowdown In China's Old Economy Is Coming
A Slowdown In China's Old Economy Is Coming
A Slowdown In China's Old Economy Is Coming
Our judgement is that a true deal between the U.S. and China next year that durably ends the trade war remains unlikely, although the odds have certainly increased as a result of this weekend’s announcement. But Chinese domestic demand had been slowing prior to the onset of the trade war, a fact that the market ignored until the middle of this year when it moved to price in both the underlying slowdown and the trade situation (Chart 5). This raises two questions: how much of a deceleration in growth will ultimately occur, and at what point will the economy bottom? Chart 5Investors Ignored A Slowing Economy Until The Trade War Emerged
Investors Ignored A Slowing Economy Until The Trade War Emerged
Investors Ignored A Slowing Economy Until The Trade War Emerged
The answers to these questions are subject to the outcome of a battle between policymakers who are reluctant to push for sizeable releveraging, and an economy that appears to be strongly linked to money and credit growth. We have highlighted in several previous reports why Chinese policymakers want to avoid another sharp increase in the private-sector debt-to-GDP ratio,2 reasons that have solid grounding in both political and economic fundamentals and that become more pertinent if a trade deal between the U.S. and China is in fact negotiated. Still, Chinese policymakers, like those in any other country, will forcefully act to stabilize their economy (using whatever policy tools are required) if they conclude that conditions are about to deteriorate past the “point of no return”. Forecasting exactly when or whether this will occur is difficult, but both policymakers and investors will know more once the front-running effect on coincident activity wanes, and the true outlook for the external sector comes into view. For now, our base case view is that growth will modestly firm in the second half of 2019, which would provide a somewhat stronger demand backdrop for commodities and emerging economies that sell goods to China. We will be closely monitoring the incoming macro data in the first quarter of the year to judge whether it is consistent with our outlook. Key Theme # 2: Renewed Investor Scrutiny Of China’s Capital Controls Prior to the G20 summit, our expectation was that a break above the psychologically-important threshold of 7 for USD-CNY was imminent, likely in response to the escalation of the second round tariff rate to 25% on January 1. This catalyst has now clearly been deferred for the next three months, at least. However, Chart 6 shows that a resumption in the trade war is not the only source of potential weakness in the RMB. The chart illustrates the tight link between USD-CNY and the short-term interest rate differential between China and the U.S., and that the latter fell sharply in advance of the collapse in the former. Chart 6Interest Rate Differentials And USD-CNY: A Tight Link
Interest Rate Differentials And USD-CNY: A Tight Link
Interest Rate Differentials And USD-CNY: A Tight Link
The true nature of the relationship between the two variables shown in Chart 6 remains a source of debate within BCA, as classic, open-economy interest rate arbitrage (the dynamic that enables currency carry trades) does not apply to countries that have officially closed capital accounts. But to the extent that the relationship holds over the coming year, Fed rate hikes alone have the potential for USD-CNY to rise above 7, as it would imply that the 1-year swap rate spread between the two countries will fall to zero (assuming no change in Chinese monetary policy). Regardless of the catalyst, renewed weakness in China's currency has the potential to rekindle (and reinforce) the narrative of capital flight that was last present following the August 2015 devaluation of the RMB. Global investor scrutiny of China's capital controls is likely to intensify significantly in such a scenario, and could contribute to negative investor sentiment towards China. As we noted in a September Weekly Report,3 several measures suggest that the capital flow crackdown that China initiated following the severe outflow pressures in 2015 and early-2016 has been successful. However, some other proxies of capital flight show persistent outflow since 2015 (Chart 7), with at least one measure having deteriorated rather significantly over the past few months. Chart 7Some Proxies Of Capital Flight Suggest Persistent Outflow Since 2015
Some Proxies Of Capital Flight Suggest Persistent Outflow Since 2015
Some Proxies Of Capital Flight Suggest Persistent Outflow Since 2015
Compiling an exhaustive inventory of different capital flow metrics (and their reliability) is part of our ongoing research efforts, and we hope to publish a Special Report on the topic early in 2019. For now, investors should be alert to any signs suggesting that a capital outflow narrative is becoming more prominent, as it is likely to have broader implications for financial markets than just the bilateral exchange rate. Key Theme # 3: Timing When (And Whether) To Go Long Chinese Stocks On A Cyclical Basis Many global investors are strongly focused on the question of when to go outright long Chinese stocks (either the domestic or investable market), on the basis of a substantial improvement in valuation, deeply oversold technical conditions, expectations of further action from policymakers, and a belief that the trade war with the U.S. will soon be resolved. This weekend’s agreement between the U.S. and China still does not make a trade deal probable,4 but we acknowledge that the odds have increased. This, coupled with the fact that Chinese stocks are still roughly 25% below their January high (Chart 8), suggests that a near-term sentiment-driven rally is possible. Over a 3-month time horizon, a tactical overweight stance towards Chinese stocks (either the domestic or investable market) within a global equity portfolio is probably warranted. Chart 8A Sentiment-Driven Rally Over The Next 3 Months Is Possible
A Sentiment-Driven Rally Over The Next 3 Months Is Possible
A Sentiment-Driven Rally Over The Next 3 Months Is Possible
However, several points suggest that a long cyclical position (i.e. over a 6-12 month period) is currently pre-mature: We noted above that the Chinese economy is set to decelerate further over the coming several months, suggesting that earnings uncertainty is likely to rise. This, in combination with reactive policymakers, already-slowing earnings momentum, and the fact that 12-month forward earnings have only just started to be adjusted downward (Chart 9), suggests that investors have not yet observed the true point of maximum bearishness for Chinese stock prices. Chart 9The Earnings-Adjustment Process Is Only Beginning
The Earnings-Adjustment Process Is Only Beginning
The Earnings-Adjustment Process Is Only Beginning
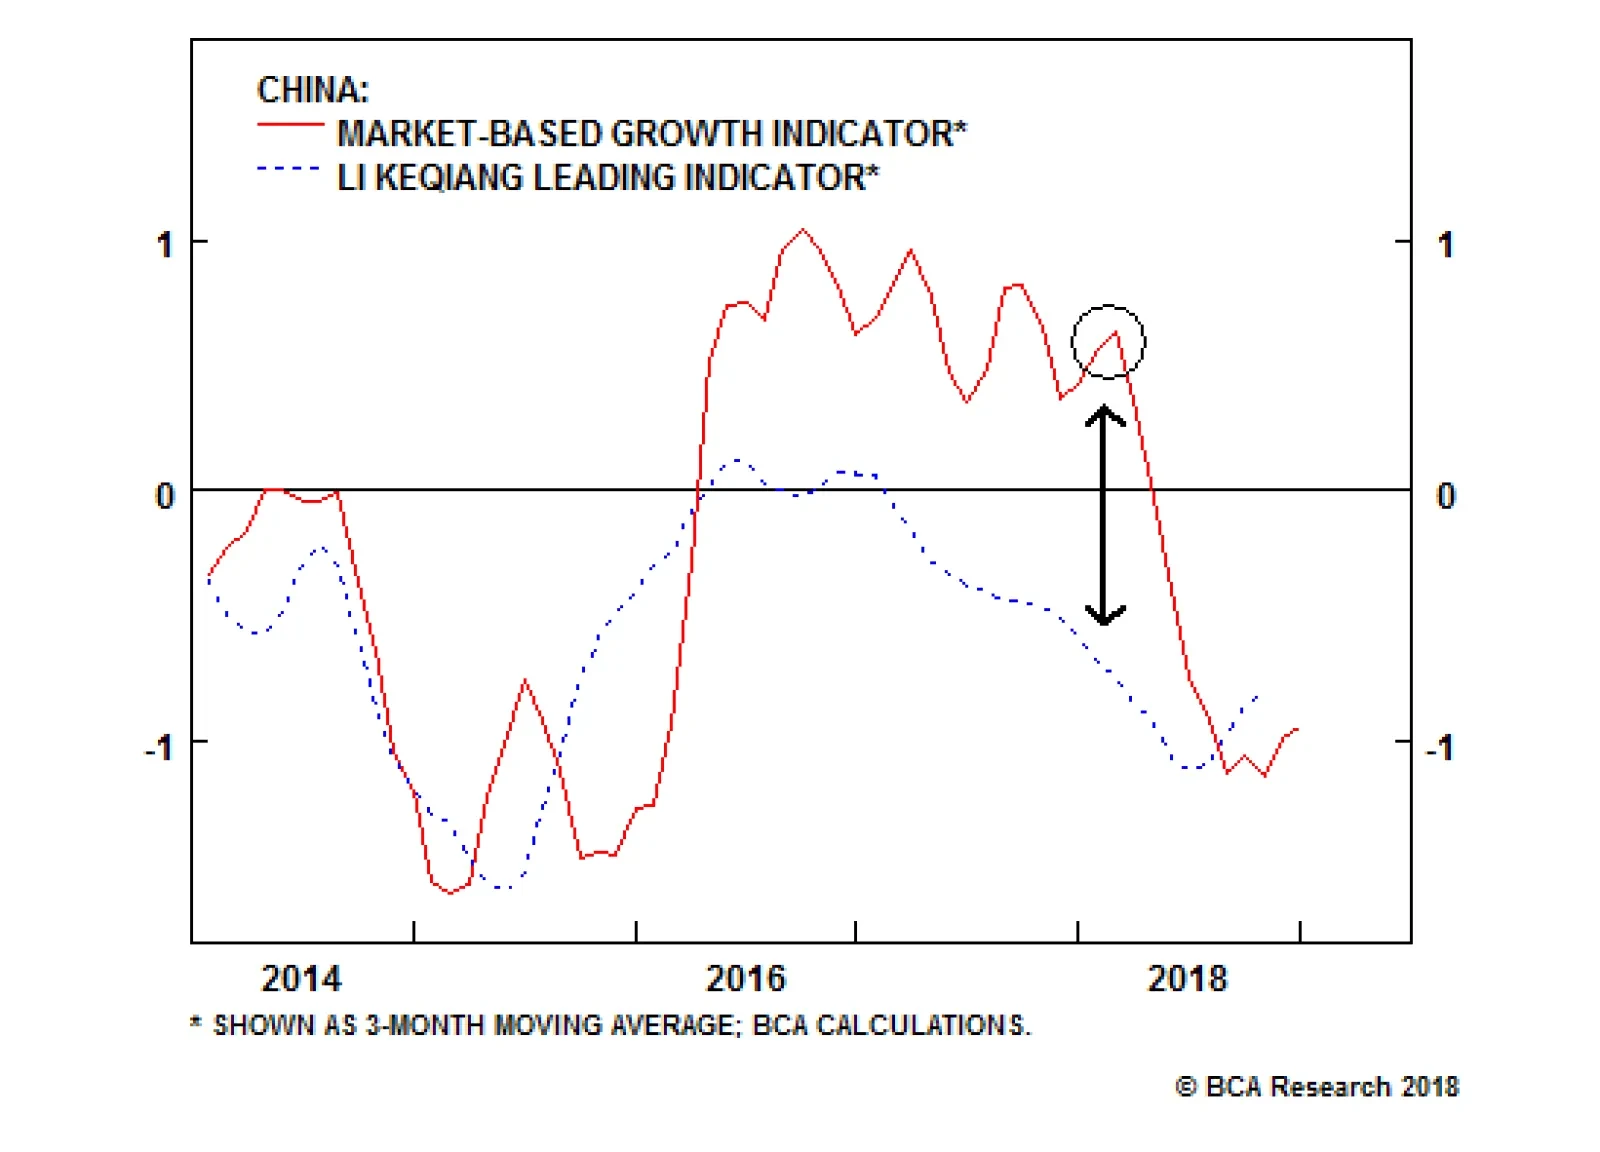
The 2014-2016 episode shows that China-related financial assets rallied prematurely in advance of a durable and broad-based improvement in the Chinese macro data, and the belief on the part of investors that a short-term rebound in Chinese stock prices over the coming 3 months is the beginning of a sustained upleg could be a repeat of this mistake. Chart 10 shows our BCA Market-Based China Growth Indicator compared with our Li Keqiang Leading Indicator, and shows that Chinese-related financial assets clearly jumped the gun in the first-half of 2015, and then lagged the improvement in the leading indicator. In the case of 2015, it was the August devaluation in the RMB that caused a severe deterioration in investor sentiment towards China; in the first-half of 2019, a failed attempt at a trade deal coupled with a further slowdown in domestic activity may do the same. Chart 10A Near-Term Rally Will Likely Fizzle, Like In 2015
A Near-Term Rally Will Likely Fizzle, Like In 2015
A Near-Term Rally Will Likely Fizzle, Like In 2015
While a near-term rally in CNY-USD may occur, the currency may come under renewed pressure if the interest rate differential effect shown in Chart 6 becomes the dominant driver of the exchange rate. For global investors managing their equity portfolios in unhedged terms, further declines in the RMB will negatively impact U.S. dollar performance. Finally, Chart 11 shows that, based on a trailing earnings and cash flow basis, the investable market is not as cheap relative to the global benchmark as it was in early-2016, casting some doubt on valuation as a rally catalyst. Undoubtedly, part of this discrepancy reflects the substantial rise in the BAT stocks (Baidu, Alibaba, Tencent) as a share of investable market capitalization, which are priced at a premium but also viewed by many investors as largely immune to a slowdown in China’s old economy. But the fact that the trade war largely reflects the decision of the Trump administration to crack down on Chinese technology transfer and intellectual property theft suggests that the market share of these companies could be negatively impacted by any successful trade deal, implying that a higher risk premium for the tech sector is warranted today than in the past. Chart 11Investable Stocks Aren't Massively Cheap
Investable Stocks Aren't Massively Cheap
Investable Stocks Aren't Massively Cheap
We do not rule out the possibility that conditions will justify shifting to an overweight cyclical stance (6-12 month time horizon) for Chinese stocks sometime in 2019, particularly if money & credit growth begin to pick up. But for now, this is something that remains on our watch list for next year, rather than a recommendation to act on today. Key Theme # 4: Onshore Corporate Bonds – Position For Positive Default Surprises Our fourth theme for 2019 is a highly contrarian view that is, to some, at odds with our pessimistic view of the Chinese economy. BCA’s China Investment Strategy service has maintained a long China onshore corporate bond trade since June 2017, and we continue to recommend a diversified portfolio of these bonds for domestic investors and qualified global investors in hedged currency terms. The fear of sharply rising defaults stemming from refocused efforts to reform China’s financial system is the basis for the predominantly bearish outlook for onshore corporate bonds. The value of defaulted bonds reportedly rose to 100 Bn RMB in 2018, a sharp increase (of approximately 70 Bn RMB) from 2017,5 and many market participants have argued that defaults will be even higher next year. We do not dispute that China’s onshore corporate bond default rate is rising, and it is certainly possible that the rate will be even higher in 2019. To us, the problem with the bearish corporate bond narrative is that 100 Bn RMB amounts to a default rate of approximately 0.4%, whereas investors are pricing the onshore market for a 4-5% default rate over the coming year (Chart 12). In other words, domestic investors appear to be expecting over a tenfold increase in corporate defaults over the coming 12 months from what occurred this year, a scenario that we believe is extremely unlikely. Chart 12Allowing Market-Implied Default Rates To Occur Would Be A Huge Policy Error
Allowing Market-Implied Default Rates To Occur Would Be A Huge Policy Error
Allowing Market-Implied Default Rates To Occur Would Be A Huge Policy Error
In our judgement, there is simply no way that policymakers can allow default rates on the order of what is being priced in to occur, as it would constitute an enormous policy mistake that would risk destabilizing the financial system at a time when officials are attempting to counter a domestic economic slowdown. In fact, we doubt that China’s typical policy of gradualism when liberalizing its economy and financial markets would allow default rates to rise from 0% to 4-5% over a year in any economic environment, particularly the current one. We therefore do not see a long recommendation favoring Chinese corporate bonds as being at odds with a slowing economy, because spreads are more than pricing in what is likely to be a modest worsening in corporate defaults. In short, defaults will rise, but will likely positively surprise investors. As a final point, our positive view towards the onshore corporate bond market should not be taken as a positive sign for the offshore US$ market. BCA’s Emerging Market Strategy service has recently reiterated its recommendation to position defensively within EM US$ sovereign and corporate bonds,6 and China accounts for roughly 1/3rd of the latter. Chart 13 highlights the difference in spread between the onshore and offshore market, the latter proxied by the Bloomberg Barclays China Corporate & Quasi-Sovereign index. The chart shows that the onshore market substantially led the offshore market in terms of pricing in a deterioration in credit fundamentals, with the latter only now starting to catch up to the former. As such, we have a clear preference for the onshore market, and would not argue against a bearish offshore corporate bond view. Chart 13Onshore Corporate Bonds Offer More Compelling Value Than Those Offshore
Onshore Corporate Bonds Offer More Compelling Value Than Those Offshore
Onshore Corporate Bonds Offer More Compelling Value Than Those Offshore
Jonathan LaBerge, CFA, Vice President Special Reports jonathanl@bcaresearch.com Footnotes 1 Pease see BCA Special Report "Outlook 2019 Late-Cycle Turbulence," published on November 27, 2018. Available at cis.bcaresearch.com. 2 Pease see Geopolitical Strategy/China Investment Strategy Special Report “China: How Stimulating Is The Stimulus?,” published August 15, 2018; Geopolitical Strategy/China Investment Strategy Special Report “China: How Stimulating Is The Stimulus? Part Two," published August 15, 2018; and China Investment Strategy Special Report “Chinese Policymakers: Facing A Trade-Off Between Growth And Leveraging,” published August 29, 2018. All available at cis.bcaresearch.com. 3 Pease see China Investment Strategy Weekly Report “Moderate Releveraging And Currency Stability: An Impossible Dream?," published on September 5, 2018, available at cis.bcaresearch.com. 4 Pease see Geopolitical Strategy Weekly Report “Trade Truce: Narrative Vs. Structural Shift?,” published December 3, 2018, available at gps.bcaresearch.com. 5 Please see “China Bond Defaults Surpass 100 Billion Yuan For 1st Time”, Bloomberg News, November 29, 2018. 6 Pease see Emerging Markets Strategy/Global Fixed Income Strategy Special Report “EM Corporate Health And Credit Spreads,” published November 22, 2018, available at gfis.bcaresearch.com. Cyclical Investment Stance Equity Sector Recommendations
There are five reasons our geopolitical strategists doubt the sustainability of the truce: Trade imbalance: It is highly unlikely that the trade imbalance between China and the U.S. can be substantively altered over the course of 90 days. The U.S. economy…
President Donald Trump and President Xi Jinping have agreed to freeze additional new tariffs on Chinese exports to the U.S. for three months. This means that as of January 1, 2019, U.S. tariffs on Chinese exports will remain at 10%, and will not jump to 25%.…
In 2014, the Fed was gearing up to raise rates while other central banks were still in full-out easing mode. The divergence in monetary policies between the U.S. and the rest of the world caused the U.S. dollar to surge. The broad trade-weighted dollar…
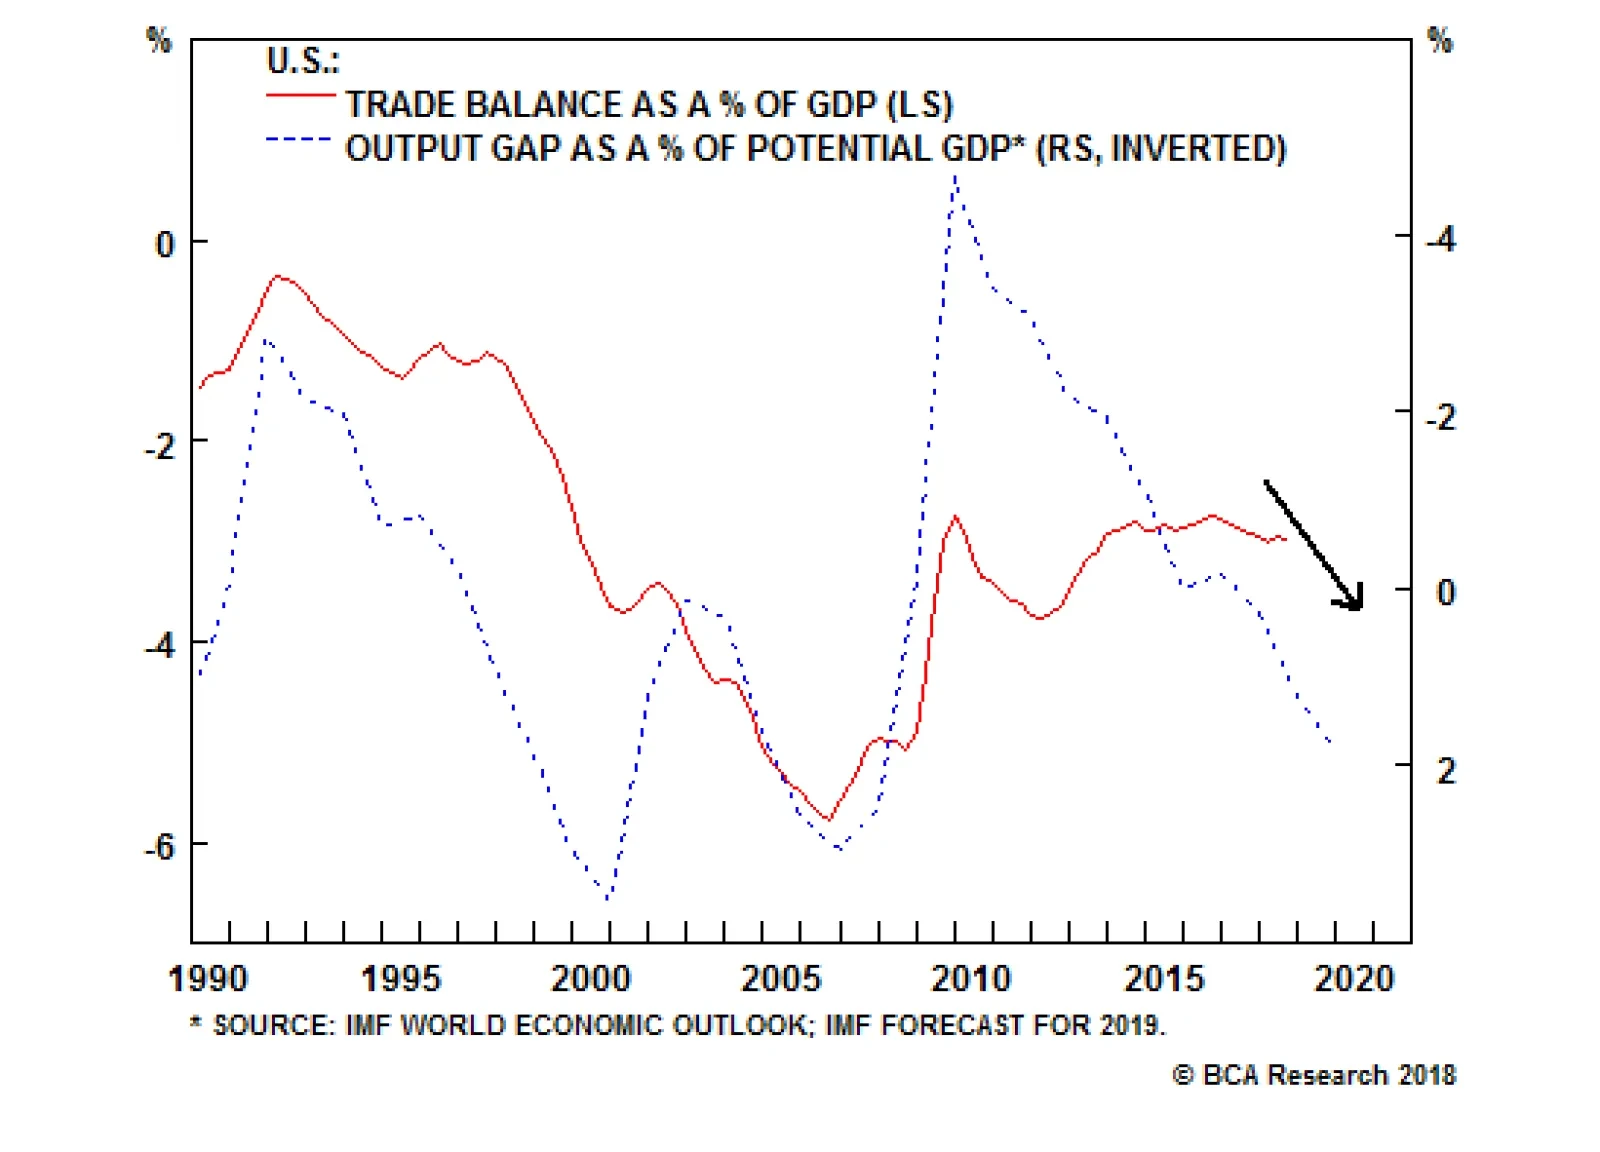
Highlights So What? The U.S.-China tariff ceasefire is a net positive, but a final deal is by no means assured. Why? In the near term there may be a play on global risk assets, but beyond that we remain cautious. Global divergence remains the key theme, and China now has less reason to stimulate. What to watch for a final deal: Trump’s approval rating, China’s structural concessions, and geopolitical tensions. We recommend booking gains on our long DM / short EM trades. Go long EM oil producers on OPEC 2.0 cuts. Feature U.S. President Donald Trump and Chinese President Xi Jinping have agreed to a trade truce at the G20 summit in Buenos Aires. The deal includes: Tariff Ceasefire: A 90-day ceasefire – until March 1 – on hiking the second-round tariffs from 10% to 25% on $200bn of Chinese imports. Substantive Talks: The talks will center on structural changes to the Chinese economy, including forced tech transfer, IP theft, hacking, and non-tariff barriers. Vice-Premier Liu He, Xi Jinping’s key economics and trade advisor, may visit Washington in mid-December. Imports: China has agreed to import more goods to lower the U.S. trade deficit, including agricultural and capital goods. This harkens back to the failed May 20 “beef and Boeings” deal. As with the previous deal, there are no deadlines or quantities promised. Not included in the two-and-a-half-hour dinner between Trump and Xi was a substantive discussion on geopolitical tensions. While Chinese statements following the summit did reaffirm Chinese commitment to the U.S.-North Korean diplomacy, there was no broader agreement on tensions, particularly in the South China Sea. The U.S. has recently demanded that China demilitarize the area. Should investors “play” the summit? Tactically, there is an opportunity to play global risk assets in the near term. Cyclically and structurally, however, both economic fundamentals and the underlying trajectory of U.S.-China relations call for caution over the course of 2019. Will The Truce Hold? There are five reasons to doubt the sustainability of the truce: Trade imbalance: It is highly unlikely that the trade imbalance between China and the U.S. can be substantively altered over the course of 90 days. The U.S. economy is in “rude health,” the USD is strong, unemployment is low and pushing up wages, and the output gap is closed. These are the macroeconomic conditions normally associated with an elevated trade imbalance (Chart 1). Chart 1Trade Deficit To Rise Despite Tariffs
Trade Deficit To Rise Despite Tariffs
Trade Deficit To Rise Despite Tariffs
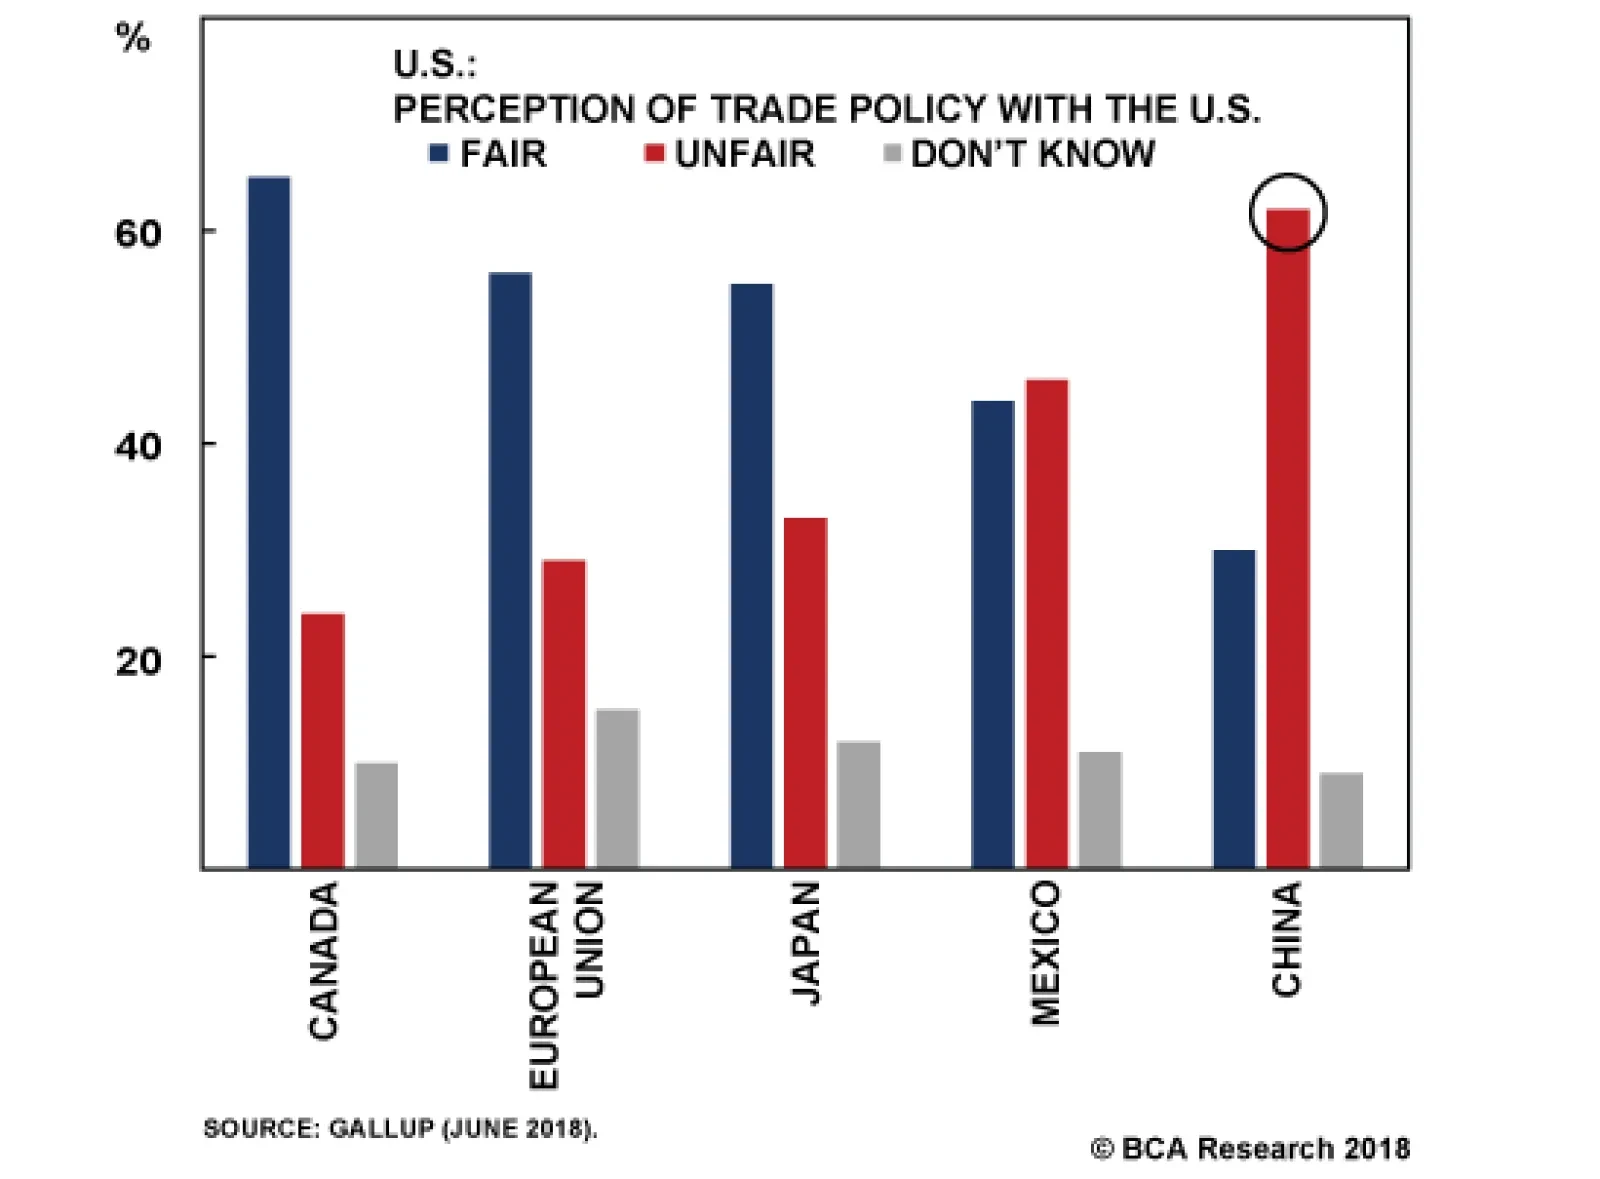
Domestic politics: The just-concluded midterm election saw no opposition to President Trump on trade. The Democratic Party candidates campaigned against the president on a range of issues throughout the election season, but not on the issue of his aggressive China policy. Polling from the summer also shows that a majority of American voters consider trade with China unfair, unlike trade with other countries (Chart 2). As such, President Trump will have to produce a convincing deal in order to ensure that his base, and many Democrats, support the deal. Chart 2Americans Are Focused On China As Unfair
Trade Truce: Narrative Vs. Structural Shift?
Trade Truce: Narrative Vs. Structural Shift?
Structural tensions: U.S. Trade Representative Robert Lighthizer issued a hawkish report ahead of the G20 summit concluding that China has not substantively changed any of the trade practices that initiated U.S. tariffs.1 The report was an update to the original investigation that launched the Section 301 tariffs against China. Lighthizer’s report therefore provides a road-map for what the U.S. will want to see over the course of 90 days. High-tech transfers: The Department of Commerce announced on November 19 a “Review of Controls for Certain Emerging Technologies.” This review will conclude on December 19 when the public comment period ends. In the report, the federal government lists biotech, AI, genetic computation, microprocessors, data analytics, quantum computing, logistics, 3D printing, robotics, hypersonic propulsion, advanced materials, and advanced surveillance as technologies with potential “dual-use” that may be critical to U.S. national security and thus might merit consideration for export control.2 As such, the U.S. may decide to impose export controls on technologies that China deems critical to accomplishing its “Made in China 2025” goals within the period of the 90 day talks. If those export controls were to include critical items – such as semiconductors, which are critical to China’s export-oriented manufacturing (Chart 3) – negotiations may become more complicated. Geopolitics: The trade truce did not contain any substantive resolution to ongoing strategic tensions between the U.S. and China. These tensions precede President Trump: we have detailed them in these pages since 2012.3 As such, the U.S. defense and intelligence community will have to be on board with any trade deal and that may suggest that Beijing will be asked to make geopolitical concessions over the course of the next 90 days. Chart 3China Accounts For 60% Of Global Semiconductor Demand
Trade Truce: Narrative Vs. Structural Shift?
Trade Truce: Narrative Vs. Structural Shift?
Despite the above, the trade truce is a meaningful and substantive move away from an open trade war. Yes, the U.S. will retain tariffs on $250bn Chinese imports, with China maintaining tariffs on $66bn of U.S. imports (Chart 4). No, the U.S. did not rule out a third round of tariffs covering the remaining $267 billion of Chinese imports, if things go awry. Nevertheless, the 90-day truce implies that the U.S. will not ratchet up the tensions for now. Chart 4U.S.-China Trade Hit By Tariffs
Trade Truce: Narrative Vs. Structural Shift?
Trade Truce: Narrative Vs. Structural Shift?
The truce also allows China to make substantive changes to its domestic economic policies that may satisfy some of the structural concerns cited in the above U.S. Trade Representative report. The soundest basis for a durable deal lies in China recommitting to structural reforms: this would both be positive for China’s productivity and would assuage some of Washington’s underlying anxieties about China’s state-backed industrial policies. Significantly, China’s Ministry of Foreign Affairs now says that it will “gradually resolve the legitimate concerns of the U.S. in the process of advancing a new round of reform and opening up in China.” When would this new round of reform occur? The upcoming Central Economic Work Conference, and the 40th anniversary of Deng Xiaoping’s reforms, should be watched closely for new initiatives. Also, the new March 1 tariff deadline lines up with the calendar for China’s National People’s Congress (NPC). The NPC meets every year and is the occasion when any major new domestic reforms would need to be laid out. Thus, any Chinese compromises on structural issues could be rolled out as part of a more general reform agenda in March. This is important because the U.S. administration is determined to focus on implementation and not to let China delay resolution of differences through endless rounds of dialogue. As such, investors should watch the following issues over the course of the next three months in order to gauge the likelihood of a substantive deal that not only rules out new tariffs but also rolls back the existing ones: Polls: President Trump is focused on his 2020 reelection. As such, he will want to see political gains from the easing of pressure on China, both in the general populace and amongst his GOP base (Chart 5). A slump in the polls, or a threatening turn in the Mueller investigation, may justify a shift in the narrative come March-April and thus end the truce. Chart 5Trump’s Approval Will Affect Trade Talks
Trade Truce: Narrative Vs. Structural Shift?
Trade Truce: Narrative Vs. Structural Shift?
Big ticket announcements: China is going to have to make big-ticket item purchases. A huge order of Boeing airplanes, a massive ramp-up in the purchase of agricultural products, a raft of direct investments in manufacturing in the heartland … these are the type of announcements that President Trump could use to sell a substantive deal to his base. Structural changes to the Chinese economy: China will have to prove that it is addressing the concerns outlined in the U.S. Trade Representative report. We suspect that Lighthizer issued the report ahead of the G20 summit so as to set the benchmark for what the U.S. wants to see from Beijing. It is a high benchmark as it includes: An end to cyber theft, hacking, and corporate espionage; Substantive, rather than merely “incremental,” improvements to U.S. market access, including increased ownership of ventures; Serious changes to state-subsidized industrial programs that utilize stolen technology, particularly the so-called “Strategic Emerging Industries” program and “Made in China 2025”; An end to China’s state-backed investment campaign in Silicon Valley. No new U.S. embargoes: The public comment period for the newly proposed U.S. export controls ends on December 19. That suggests that high-tech restrictions could emerge over the course of the first quarter of 2019. These could exacerbate tensions. No new geopolitical tensions: Geopolitical tensions, such as over human rights in Xinjiang or the militarization of the South China Sea, would obviously make a deal less likely. Bottom Line: The trade truce could lead to a substantive trade deal between China and the U.S. However, many impediments remain. Investors have to answer three key questions: is the deal politically useful for President Trump ahead of the 2020 election? Does the deal resolve the concerns laid out in the U.S. Trade Representative’s Section 301 report? And will geopolitical and national security tensions ease? Since 2012, we have had a structurally bearish view of the Sino-American relationship. This view is based on long-term structural factors that we do not think can be resolved over the course of 90 days. That said, every structural view can have cyclical deviations. The question we now turn to is how to play such a cyclical deviation in terms of the markets. What Does The Truce Mean For The Markets? In our view, the trade war has been of secondary importance to global markets. Far more relevant to the BCA House View that DM assets will outperform EM has been our conclusion that U.S. and Chinese economies would experience policy divergence. The U.S. economy has been buoyed by pro-cyclical stimulus, whereas Chinese policymakers have created a macro-prudential framework that has impaired the country’s credit channel. This divergence has led to the outperformance of the U.S. economy over the rest of the world, leading to a substantive USD rally (Chart 6). Chart 6U.S. Outperformance Should Be Bullish USD
U.S. Outperformance Should Be Bullish USD
U.S. Outperformance Should Be Bullish USD
While this view has worked out well in 2018, it appears to be fraying as the year comes to the end: Chart 7U.S. Growth Weakening?
U.S. Growth Weakening?
U.S. Growth Weakening?
Fed dovishness: Our recent travels to Asia, the Middle East, Europe, and the Midwest have revealed unease among investors regarding the health of the U.S. economy. Some recent data, such as the woeful core durable goods orders (Chart 7) and weak housing, have prompted calls for a more dovish Fed. On cue, Fed Chair Jay Powell delivered what was perceived as a dovish speech. BCA’s Chief Global Strategist, Peter Berezin, makes a strong case for why investors should fade the enthusiasm.4 Specifically, Peter thinks that investors are focusing too much on the unknown – the neutral rate – and not enough on the known – the budding inflationary pressures (Chart 8). Nonetheless, in the near-term, the narrative of a “Fed pause” may overwhelm the data. Chart 8Does The Fed Like It Hot?
Does The Fed Like It Hot?
Does The Fed Like It Hot?
Chart 9Fiscal Policy Becomes More Proactive
Trade Truce: Narrative Vs. Structural Shift?
Trade Truce: Narrative Vs. Structural Shift?
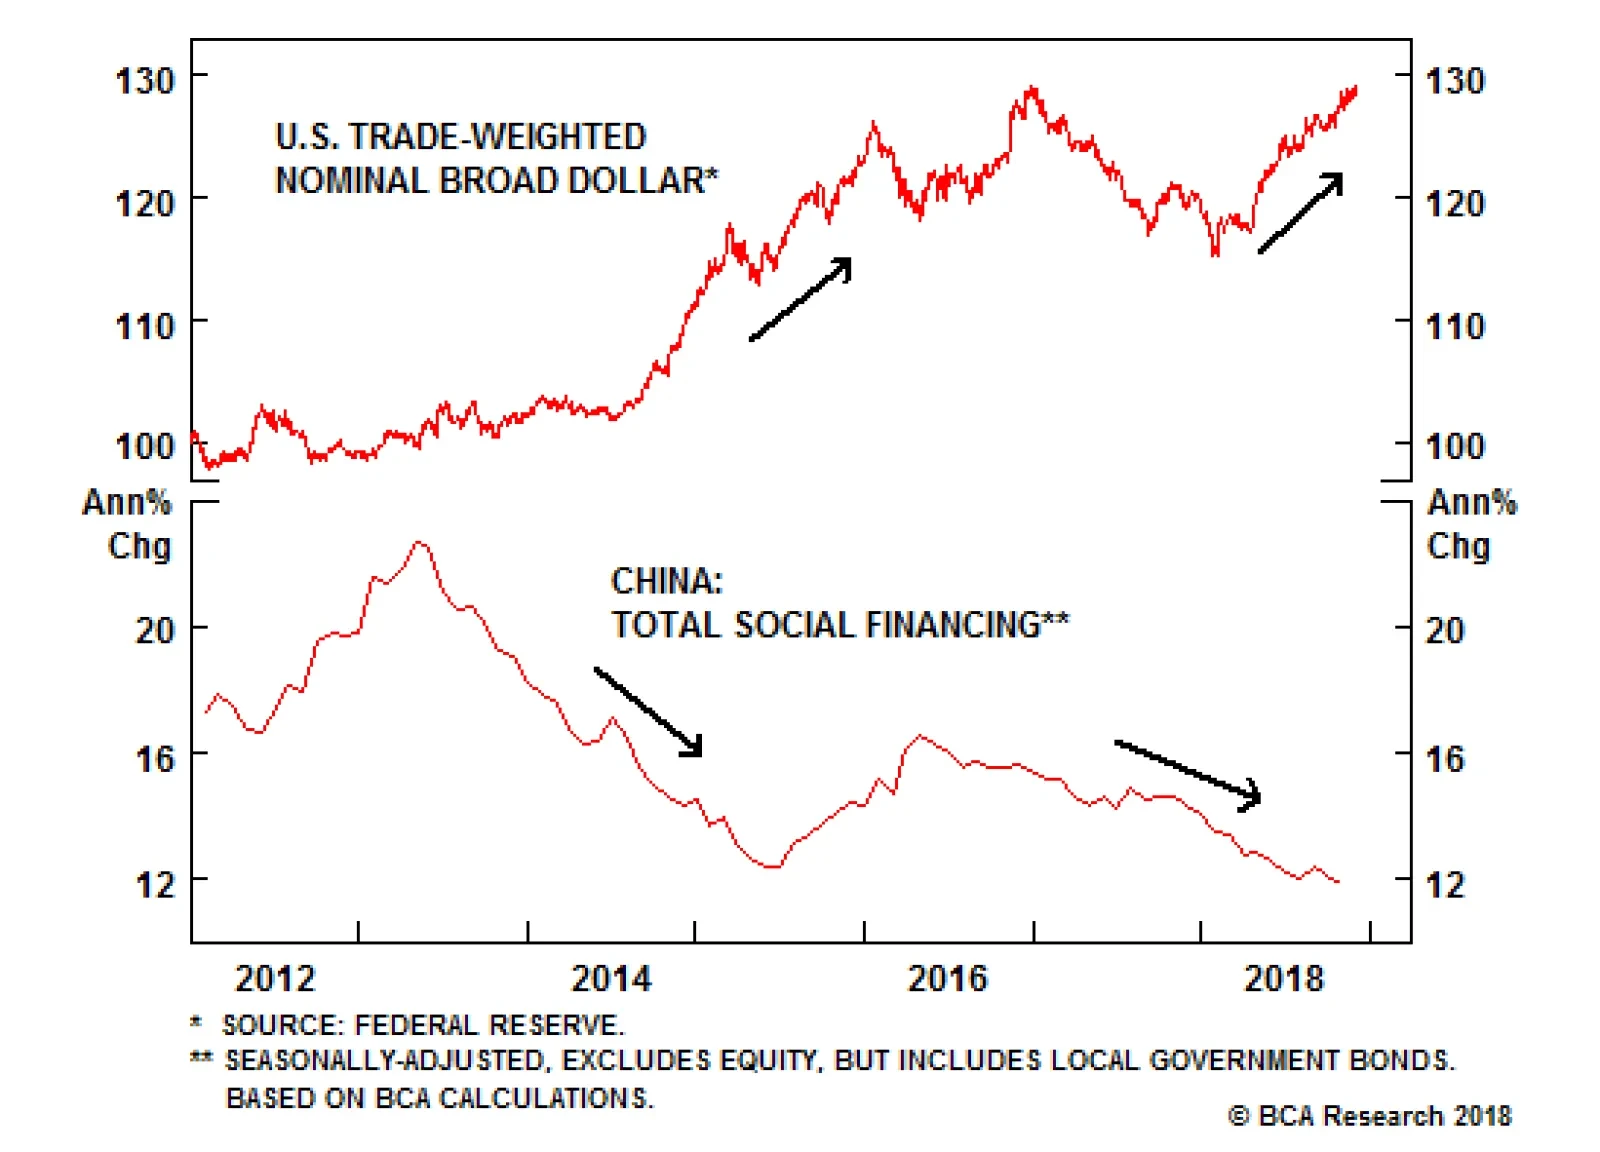
Chinese stimulus: Evidence of a broad-based, irrigation-style, credit stimulus is scant in China’s data. Nonetheless, many investors we have met on the road are latching on to higher local government bond issuance (Chart 9) and a positive M2 credit impulse (Chart 10). Moreover, Q1 almost always brings a boost in new lending in China. Our colleague Dhaval Joshi, BCA’s Chief European Strategist, has recently pointed out that the global credit impulse has hooked up, suggesting that EM underperformance is over (Chart 11).5 We do not think that China can turn the corner on a slumping economy without a substantive increase in its total social financing, which remains subdued both in growth terms and as a second derivative (Chart 12). However, we concede that the narrative may have shifted sufficiently in the near term to warrant some tactical caution on our cyclical House View. Chart 10China's M2 Turned Positive
China's M2 Turned Positive
China's M2 Turned Positive
Chart 11An Up-Oscillation In Global Credit Growth Technically Favours EM
An Up-Oscillation In Global Credit Growth Technically Favours EM
An Up-Oscillation In Global Credit Growth Technically Favours EM
Trade truce: Trade concerns have had a clear impact on the outperformance of U.S. equities relative to the rest of the world (Chart 13). As such, a trade truce may alter the narrative sufficiently in the near term to change the direction. In this report, we cite why we are cautious regarding the truce leading to a substantive deal. However, we are biased by our structural perspective that Sino-American tensions are unavoidable. The vast majority of our clients and global investors does not share this view. In fact, the trade war has caught the investment community by surprise. As such, we would argue that investors are biased towards a “win-win” scenario. Therefore, investors may not be cautious, but may in fact project a much higher probability of a final deal into their market decisions. Chart 12China's Total Credit Is Weak
China's Total Credit Is Weak
China's Total Credit Is Weak
Chart 13U.S. Is Winning The Trade War
U.S. Is Winning The Trade War
U.S. Is Winning The Trade War
Over the course of 2019, we do not think the global risk asset bullishness is sustainable. In fact, a reprieve rally now is going to make global growth resynchronization less likely and continued policy divergence more likely. Why? First, Chinese policymakers will have less of a reason to deploy an irrigation-style credit stimulus if fears of an accelerated trade war abate. Second, the Fed will have less of a reason to back off from its hiking trajectory if both the DXY rally and equity market volatility ease. That said, we are going to close our long DM / short EM trades for the time being. This includes: Our long DM equities / short EM equities, for a gain of 15.70%; Our long U.S. Dollar (DXY) index for a gain of 0.56%; Our long USD / Short EM currency basket for a loss of 0.76%; Our long JPY/GBP call, for a gain of 0.32%. Our hedge of being long China play index ought to outperform on a tactical horizon, so we are leaving it open despite its paltry return so far of 0.32%. Also, we are keeping our long Chinese equities ex. Tech / short EM equities trade, as Chinese assets should rally on the back of the truce. Note that, as outlined above, China’s tech sector is not out of the woods yet. Our decision to close these recommendations is to preserve profits, not change our investment stance. On a cyclical horizon, we remain skeptical that global risk assets will outperform DM, and U.S. assets in particular, over the course of 2019. In the end, we do not believe that a mere narrative shift will be sustainable, especially given the robustness of the U.S. labor market (Chart 14) and the tepidness of Chinese stimulus (Chart 15). Chart 14A Tight Labor Market
A Tight Labor Market
A Tight Labor Market
Chart 15Compare Any Stimulus To Previous Efforts
Compare Any Stimulus To Previous Efforts
Compare Any Stimulus To Previous Efforts
Finally, a word on oil prices. The G20 was crucial for the oil call, as well as the trade war, given that Saudi Arabia and Russia suggested that their OPEC 2.0 union would produce supply cuts at the upcoming Vienna meeting on December 6. This proves that fundamentals were more important than the narrative that Saudi leadership “owed” a favor to President Trump. In particular, the Saudis have fiscal constraints given their budget breakeven oil price is around $80-$85 per barrel. As such, we are reinitiating our long EM energy producers (ex-Russia) / short broad EM (ex-China) equity call. We are excluding Russia from the “long” due to lingering geopolitical concerns – sanctions and Ukraine – and China from the “short,” as we are now tactically bullish on China. Marko Papic, Senior Vice President Chief Geopolitical Strategist marko@bcaresearch.com Matt Gertken, Vice President Geopolitical Strategy mattg@bcaresearch.com Footnotes 1 Please see Office of the United States Trade Representative, “Update Concerning China’s Acts, Policies, And Practices Related To Technology Transfer, Intellectual Property, And Innovation,” dated November 20, 2018, available at www.ustr.gov. 2 Please see The Federal Register, “Review of Controls for Certain Emerging Technologies,” dated November 19, 2018, available at www.federalregister.gov. 3 Please see Geopolitical Strategy Special Report, “Power And Politics In East Asia: Cold War 2.0?,” dated September 25, 2012, Global Investment Strategy Special Report, “Searing Sun: Japan-China Conflict Heating Up,” dated January 25, 2013, “Sino-American Conflict: More Likely Than You Think, Part II,” dated November 6, 2015, and “The South China Sea: Smooth Sailing?,” dated March 28, 2017, available at gps.bcaresearch.com. 4 Please see Global Investment Strategy Weekly Report, “Shades Of 2015,” dated November 30, 2018, available at gis.bcaresearch.com. 5 Please see European Investment Strategy Weekly Report, “DM Versus EM, And Two European Psychodramas,” dated November 22, 2018, available at eis.bcaresearch.com.
Dear Client, In addition to today’s report, we sent you our 2019 Outlook earlier this week, featuring a discussion between BCA editors and Mr. and Ms. X. Best regards, Peter Berezin, Chief Global Strategist Highlights Today’s macroeconomic backdrop of slowing global growth, plunging oil prices, falling equity prices, widening credit spreads, and a strong dollar is reminiscent of what transpired in 2015. We do not expect global capital spending to contract as much as it did back then, partly because Saudi output cuts should preclude the need for shale producers to slash capex plans. Nevertheless, global growth is likely to slow further into the first half of next year, suggesting that equities and other risk assets could face renewed near-term pressures. The sell-off in the dollar following Powell’s speech is unwarranted. We expect the DXY to reach 100 by early next year. Global bond yields will rise by more than currently discounted over a 12-to-18 month horizon, but are likely to fall somewhat over the next few months. Feature Echoes From The Past Today’s macroeconomic backdrop is starting to look increasingly similar to 2015, a year when the global economy slowed sharply and commodity prices took it on the chin. In 2014, the Fed was gearing up to raise rates while other central banks were still in full-out easing mode. The divergence in monetary policies between the U.S. and the rest of the world caused the U.S. dollar to surge. The broad trade-weighted dollar strengthened by 16% between July 2014 and March 2015 (Chart 1). Chart 1Current Dollar Strength: Replay Of 2015?
Current Dollar Strength: Replay Of 2015?
Current Dollar Strength: Replay Of 2015?
The effects of the stronger dollar rippled across the global economy. Notably, since China had a de facto currency peg to the dollar at the time, the resurgent greenback made Chinese companies less competitive in global markets. The appreciation of the yuan came at a time when the Chinese government was tightening both monetary and fiscal policy. The year-over-year change in total social financing (TSF) reached as high as 23% in April 2013 but fell to 12% in May 2015 (Chart 2). Chart 2Just Like Today, China Was Tightening Monetary And Fiscal Policy Going Into 2015
Just Like Today, China Was Tightening Monetary And Fiscal Policy Going Into 2015
Just Like Today, China Was Tightening Monetary And Fiscal Policy Going Into 2015
Eager to give its export sector a competitive boost, China allowed the currency to weaken by about 4% in August 2015 (Chart 3). The “mini-devaluation” backfired. Rather than instilling confidence in the economy, it caused investors to bet on further currency declines. Capital outflows intensified as the yuan came under further pressure. Between June 2014 and January 2016, China lost almost US$1 trillion in foreign exchange reserves. Chart 3China's Mini-Devaluation Backfired
China's Mini-Devaluation Backfired
China's Mini-Devaluation Backfired
The combination of a stronger dollar and sagging Chinese growth led to a steep decline in commodity prices. The London Metals Exchange index fell by nearly 40% between July 2014 and January 2016. Brent crude oil prices plunged from $110/bbl to as low as $26/bbl during this period (Chart 4). Capital spending in the commodity sector collapsed. Fears over the financial health of commodity producers and related firms caused credit spreads to widen (Chart 5). Chart 4Stronger Dollar And Soggy Chinese Growth Were A Bad Combination For Commodity Prices
Stronger Dollar And Soggy Chinese Growth Were A Bad Combination For Commodity Prices
Stronger Dollar And Soggy Chinese Growth Were A Bad Combination For Commodity Prices
Chart 5Weakness In The Commodity Complex Weighed On High-Yield Bonds In 2015
Weakness In The Commodity Complex Weighed On High-Yield Bonds In 2015
Weakness In The Commodity Complex Weighed On High-Yield Bonds In 2015
Throughout the course of 2015, the Fed refused to back off from its plans to start raising rates. It hiked rates in December of that year and signaled four more hikes for 2016. However, as markets continued to swoon, the FOMC quickly backed off. The Fed would not raise rates again for a full 12 months. The Federal Reserve’s decision to temper its hawkish rhetoric, along with China’s decision to ramp up stimulus in early 2016, put a floor under risk assets. Fast forward to the present and investors are again wondering if the Fed is about to blink and whether the Chinese authorities are set to deliver a massive dose of global reflationary stimulus. We would not exclude either option. However, we think that a lot more pain is required before either occurs. China’s Begrudging Stimulus Program The Chinese government’s reform agenda remains focused on curbing credit growth and reducing excess capacity. China has historically stimulated its economy with ever-more debt and investment spending (Chart 6). There is an obvious tension here – one that is likely to make the authorities reluctant to turn on the credit spigot unless the economy slows further. Chart 6China: Debt And Capital Accumulation Have Gone Hand In Hand
China: Debt And Capital Accumulation Have Gone Hand In Hand
China: Debt And Capital Accumulation Have Gone Hand In Hand
Of course, China can try to stimulate its economy without relying on more debt-financed investment spending. In particular, it can try to boost consumption or net exports. The problem is that neither of these two options would be welcome news for other nations. Capital goods and raw materials account for more than 80% of Chinese imports. The rest of the world relies on Chinese investment, not Chinese consumption. Similarly, while stricter capital controls have given the authorities greater scope to weaken the yuan than they had in 2015, such a move would only hurt China’s competitors and curb Chinese imports. The Fed Will Keep Hiking Stocks rallied and the dollar sold off on Wednesday after Chairman Powell seemingly suggested that the fed funds rate was already close to neutral. This appeared to be a sharp recanting of his statement in early October that the Fed was a “long way” from neutral. We think the financial media and many pundits overreacted to Powell’s remarks. What he actually said was that “interest rates are still low by historical standards, and they remain just below the broad range of estimates of the level that would be neutral for the economy.”1 The “broad range” of estimates that Powell was referring to is drawn from September’s Summary of Economic Projections, which showed that FOMC members saw the appropriate “longer run” level of the fed funds rate as ranging between 2.5% and 3.5%. Given that the current target for the fed funds rate is 2%-to-2.25%, Powell was merely stating a fact about the current position of the Fed dots, not offering new forward guidance. In any case, investors are focusing too much on what Powell may or may not be thinking. The Fed does not know where the neutral rate is. True to its “data-dependent” approach, it will keep raising rates until the economy slows by enough that it needs to stop. Our base-case scenario envisions only a modest slowdown in U.S. growth, driven in part by increasing capacity constraints (the latter should make the Fed more, not less, eager to raise rates). So far, the data are consistent with this benign slowdown scenario. Holiday sales have been stronger than expected, based on data from Johnson-Redbook and Adobe Digital Insights. According to the Atlanta Fed’s GDPNow model, real GDP is on track to increase by 2.6% in the fourth quarter. Net exports and inventory destocking are expected to shave about half a percentage point off growth. This means that real final domestic demand is still growing at a healthy 3% pace. GDP growth could slow to about 2.5% next year as the fiscal impulse declines and the lagged effects from the recent tightening in financial conditions make their way through the economy. Nevertheless, given that most estimates peg potential growth at around 1.7%-to-1.8%, this should still be enough to push the unemployment rate towards 3% by the end of 2019, bringing it to the lowest level since the Korean War. This should keep price and wage inflation on an upward trajectory (Chart 7). Chart 7Does The Fed Like It Hot?
Does The Fed Like It Hot?
Does The Fed Like It Hot?
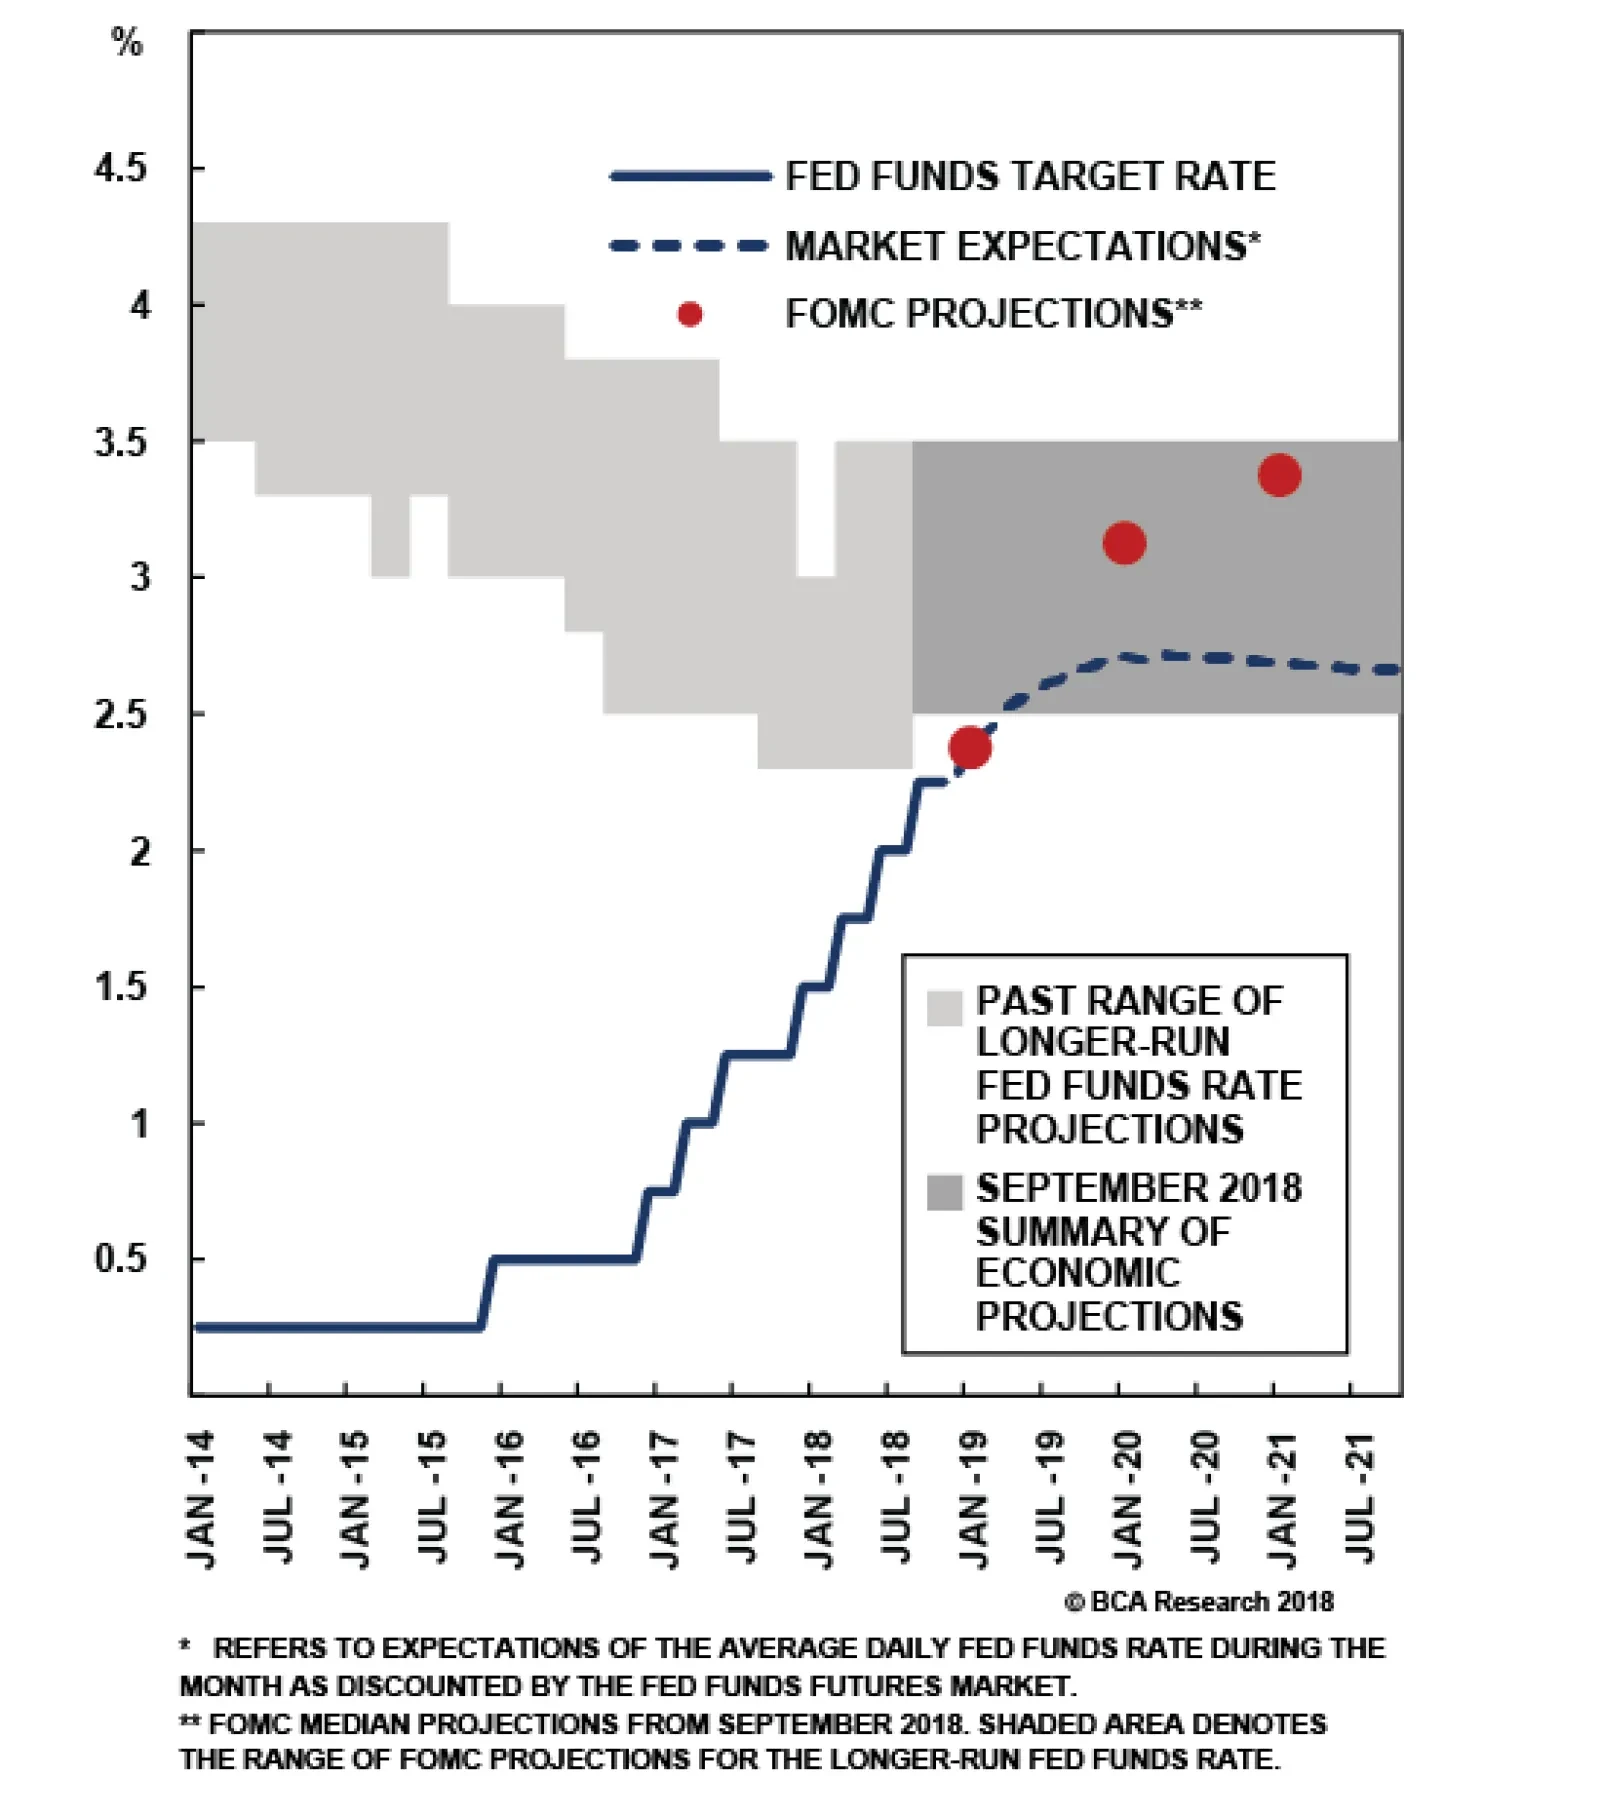
The “dots” in the September Summary of Economic Projections foresaw one rate increase this December and three additional hikes next year. The market is currently pricing in only two hikes through to end-2019 and no hikes beyond then (Chart 8). If our baseline scenario for the U.S. economy unfolds as expected, the Fed will raise rates four times next year, which will keep the U.S. dollar well bid. Chart 8The Market Does Not Buy The Dots
Shades Of 2015
Shades Of 2015
Oil And The Global Economy: Why It Will Not Be As Bad This Time Around As in 2015, a key question today is how the recent drop in oil prices will affect both the U.S. and the global economy. Here there is some good news. The balance sheets of U.S. energy companies have improved markedly over the past few years. Rapid productivity has allowed shale producers to boost production to record levels without having to incur substantially higher costs. In fact, capital spending in the energy sector is far lower as a share of GDP today than it was in the lead-up to the 2015 shale bust (Chart 9). Chart 9Energy Sector Capex Is Far Below Its 2014 Peak
Energy Sector Capex Is Far Below Its 2014 Peak
Energy Sector Capex Is Far Below Its 2014 Peak
Saudi Arabia’s reaction to the slide in oil prices is also likely to be different this time around. In 2015, the Saudis refrained from cutting output in the hope that this would undermine Iran and decimate the fledgling U.S. shale industry. In the end, the Iranian regime endured, and while U.S. production did fall temporarily, it quickly rebounded (Chart 10). Chart 10Who Won The Market Share War Of 2015?
Who Won The Market Share War Of 2015?
Who Won The Market Share War Of 2015?
Going into September, the Saudis ramped up production after President Trump indicated his intent to tighten sanctions on Iranian oil exports. In the end, Trump declined to reimpose the sanctions. This left the market with a surfeit of crude. There is a limit to how much Saudi Arabia can cut output. Now that the stock market is well off its highs, President Trump has started to take credit for low oil prices. Nevertheless, the Saudis are keenly aware that they need crude to trade at about $83 per barrel just to balance their budget. Our geopolitical and energy strategists expect the Kingdom to cut production by enough to push up prices from current levels. Russia has also hinted at restraining supply. If U.S. producers fill part of the void created by Saudi and Russian production cutbacks, U.S. energy sector capital spending will hold up much better than it did in 2015. Provided that oil prices do not return all the way to their September highs, U.S. consumers will also benefit from an increase in spending power. Investment Conclusions We do not expect the global economy to weaken as much as it did in 2015. Nevertheless, most forward-looking economic indicators point to slower growth over the next few quarters (Chart 11). Global growth will likely bottom out by the middle of 2019, but until then, investors should continue to favor developed over emerging market stocks. They should also overweight defensive equity sectors, such as consumer staples and health care, relative to deep cyclicals, such as materials and industrials. Given sector skews, this implies a regional preference for the U.S. over Europe and Japan. Chart 11Global Growth Is Slowing
Global Growth Is Slowing
Global Growth Is Slowing
As far as the near-term absolute direction of stocks is concerned, the equity score from our MacroQuant market-timing model has risen from its recent lows thanks to an improvement in sentiment/technical components. Nevertheless, the model is still pointing to heightened downside risks to global equities over the remainder of the year and into early 2019 due to slowing growth and the lagged effects of the recent tightening in financial conditions (Chart 12). Chart 12MacroQuant Equity Model* Score Is Off Its Lows, But Is Still Warning Of More Downside For Stocks
Shades Of 2015
Shades Of 2015
Slower global growth and ongoing Fed rate hikes should keep the dollar well bid. Consistent with our qualitative analysis, our model is currently sending a very bullish signal on the greenback (Chart 13). We expect the DXY to reach 100 by early next year. Chart 13MacroQuant U.S. Dollar Model Is Pointing To Further Upside For The Greenback
Shades Of 2015
Shades Of 2015
The model’s near-term outlook on bonds has improved greatly in recent weeks after having spent the better part of the last 18 months in bearish territory (Chart 14). To be clear, this is a tactical signal: The model’s cyclical fair-value estimate for the U.S. 10-year Treasury yield stands at 3.71% – 67 basis points above current levels – which implies that the 12-to-18 month path for yields remains to the upside (Chart 15). Nevertheless, with global growth slowing and lower energy prices dragging down inflation, there is a good chance that the 10-year yield will temporarily fall below 3% before resuming its structural uptrend. Chart 14MacroQuant Recommended Portfolio*: Tactically Favor Bonds Over Stocks
Shades Of 2015
Shades Of 2015
Chart 15MacroQuant U.S. Bond Model*: Treasury Yields Are Still Well Below Fair Value, But The Upside Is Capped Tactically
Shades Of 2015
Shades Of 2015
Peter Berezin, Chief Global Strategist Global Investment Strategy peterb@bcaresearch.com Footnotes 1 Jerome H. Powell, “The Federal Reserve’s Framework for Monitoring Financial Stability,” Federal Reserve, November 28, 2018. Strategy & Market Trends Tactical Trades Strategic Recommendations Closed Trades
Although there are a few signs of easing tensions between the U.S. and China, there are also signs that any agreement will provide just a temporary reprieve from the broader U.S-China tussle. First, China is negotiating under duress. Over the past month…
Presidential summits can have major consequences, but context is everything. Trump’s impending meeting with President Xi will be the third since he took office. The first two did not prevent the trade war. Neither did high-level negotiations in May 2018,…