China

Highlights The October credit and housing market data present a gloomy picture for Chinese domestic demand. Trade remains buoyant, but exports are set to decline materially over the coming months. Many investors are focused too much on external demand and not enough on Chinese domestic demand. China's old economy has been deteriorating for two years, and it is unlikely that exchange rate depreciation alone will reverse this trend. A review of the drivers of credit growth during China's last mini-cycle upswing underscore that the country's monetary transmission mechanism is impaired. This suggests that investors are exposed to fiscal and regulatory policy inertia, as well as time lags once policymakers decide to aggressively stimulate. Chinese stocks may present an excellent buying opportunity over the coming year, but that point has not yet been reached. Stay neutral for now. Feature China's October trade data (released earlier this month) was a frustrating one for investors, as it revealed that market participants will have to wait even further for clarity on the magnitude and duration of the upcoming shock to exports. The strong October trade data has even led to some market participants questioning whether export growth will decelerate at all, a view that we strongly disagree with. It is true that there is no direct reason to expect that the impact of U.S. import tariffs will affect China's non-U.S. exports. But Chart 1 shows that Chinese exports to the U.S. are currently running above the pace that would be predicted by the overall trend in U.S. non-oil imports, a circumstance that is highly unlikely to continue in the face of mutual tariff imposition. Negative export "alpha" would imply a growth rate materially below the dotted line in Chart 1. As such, even though Chinese exports to the U.S. account for only 20% of total exports, the impact of an eventual "reversion to fundamentals" is likely to substantially effect the overall trend in Chinese export growth. Chart 1Export Frontrunning To The U.S. Continues
Export Frontrunning To The U.S. Continues
Export Frontrunning To The U.S. Continues
Given the integrated nature of global trade, persistently strong export growth is also very likely supporting imports. Chart 2 shows that import growth has been closely correlated with domestic industrial activity since 2010, but is now running approximately 10-12 % above would normally be expected. This implies that China's overall trade momentum will weaken considerably over the coming months, which is likely to reverberate through key trade linkages in emerging markets and commodity-producing developed markets. Chart 2Current Import Growth Appears Unsustainable
Current Import Growth Appears Unsustainable
Current Import Growth Appears Unsustainable
October's credit data was also highly significant, as it validated the view that we espoused in our recent report.1 We noted in response to the September credit release that a surge in the 3-month rate of change of adjusted total social financing (TSF) was driven by front-loaded fiscal spending that would not last. Chart 3 shows that special local government bond issuance in October fell by 650 bn RMB relative to the prior month, suggesting that (net) new fiscal stimulus will be required in order for local government bond issuance to materially boost overall credit growth. Chart 3September Was Not The Start Of A New Trend In LG Bond Issuance
September Was Not The Start Of A New Trend In LG Bond Issuance
September Was Not The Start Of A New Trend In LG Bond Issuance
Finally last week's housing data release highlighted that residential sales and construction momentum is faltering (Chart 4), which was likely triggered in part by prior reductions in the PBOC's pledged supplementary lending (PSL) program. We noted in a September Special Report that the pullback in the PSL would negatively impact the housing market on a cyclical basis,2 and October's data certainly supports this view. Chart 4The Housing Market Slowed In October
The Housing Market Slowed In October
The Housing Market Slowed In October
Don't Pin Any Hopes On A Trade "Ceasefire" Against this gloomy economic backdrop market participants have actually been incrementally positive about China over the past few weeks, in anticipation of a possible détente with the U.S. Last week's flurry of optimism about an apparently meaningful resumption in trade talks were somewhat diminished by comments from President Xi and Vice President Pence at the APEC summit over the weekend, but our geopolitical strategists believe that the odds of a short-term "tariff ceasefire" occurring at the G20 summit later this month are genuinely non-trivial (possibly as high as 30-40%). We define a "ceasefire" in this case as a commitment to refrain from any further protectionist action during a renewed period of negotiations, not an immediate and substantive deal that ends the trade war. We agree that any positive actions on the trade front are likely to lead to a short-term boost to Chinese stock prices (and global risk assets more generally). But the key question for investors is whether this will lead to a durable rally lasting several months. In our opinion, three factors argue against this view: A ceasefire probably will not lead to an agreement: There is no indication that either the U.S. or China has changed their positions concerning the dispute, with China reportedly having simply restated their previous offer in advance of the G20 summit. On the U.S. side, attempts to restart negotiations may reflect the desire to give China "one last chance" before moving to impose tariffs on all Chinese imports, which the administration may be planning as a rhetorical counter to any domestic pushback from rising consumer goods prices (the "Walmart effect"). A ceasefire will not roll back tariffs already in place: It is unlikely that the U.S. would impose tariffs on all remaining imports from China (the "third round") while negotiations are taking place. But a near-term shock to Chinese exports is still likely, because the existing tariffs on the first and second round would not be rolled back until a deal is successfully negotiated. It is even possible (albeit unlikely) that the administration will move ahead with the planned increase in the second round tariff to 25% at the end of the year despite the presence of negotiations. A ceasefire alone will not reverse the ongoing slowdown in Chinese domestic demand: The trade war between the U.S. and China is occurring against a backdrop of weaker Chinese domestic demand, a point that we have highlighted numerous times over the past year. As shown in Chart 2 above, the growth momentum of China's old economy peaked well before the trade war began, and a temporary "stay of execution" on the trade front is unlikely to change the downtrend in domestic activity. This last point is important, as it appears that many global investors are focused almost exclusively on China's negative external demand outlook and not nearly enough on weak domestic demand. Chart 5 vividly illustrates this point, by contrasting our new Market-Based China Growth Indicator with our leading indicator for the Li Keqiang Index. Our market-based China Growth Indicator is very similar to the highly informative China Play Index created by BCA's Foreign Exchange Strategy service to hedge against a possible countertrend correction in the U.S. dollar,3 but it is somewhat broader, has four asset class subcomponents, and has been built on a deviation from trend basis (see Box 1 for a description). Chart 5The Market Has Lagged The Macro Data Over The Past Three Years
The Market Has Lagged The Macro Data Over The Past Three Years
The Market Has Lagged The Macro Data Over The Past Three Years
Box 1 Introducing The BCA Market-Based China Growth Indicator Chart A1 presents the BCA Market-Based China Growth Indicator, along with its four asset class subcomponents: currencies, commodities, equities, and rates/fixed-income. The purpose of the indicator is to act as a broad proxy of investor expectations for Chinese growth, and to illustrate which asset classes are providing the strongest/weakest growth signals. Chart A1Investors Are Incrementally Positive, But Rates Caution Against Over Optimism
Investors Are Incrementally Positive, But Rates Caution Against Over Optimism
Investors Are Incrementally Positive, But Rates Caution Against Over Optimism
Table A1 presents a list of the series included in each of the asset class subcomponents, all of which were tested to ensure that they were coincident or lead the Bloomberg Li Keqiang index. The indicator is made up of an equally-weighted average of the four asset class subcomponents, and each series is equally-weighted within its respective subcomponent (meaning that the 17 series do not have equal weights in the overall indicator). Table A1Components Of The BCA Market-Based China Growth Indicator
Trade Is Not China's Only Problem
Trade Is Not China's Only Problem
Chart A1 highlights that the commodity and equity subcomponents are currently providing the most positive signals, whereas the currency component is in line with the overall indicator. The rates component, which provided the earliest warning sign this cycle that Chinese growth was likely to decelerate, remains the weakest element of the indicator and has not been rising over the past few weeks (in contrast to the other components). The chart shows that price signals from China-related assets generally followed or even anticipated our LKI leading indicator prior to 2015, but that the reverse has been true over the past three years. The gap between the two indicators became extreme earlier in the year, and only closed once investors began to react to the emergence of the trade war. But the key point from the chart is that trade is not China's only problem, as our LKI leading indicator shows that Chinese monetary conditions, money, and credit growth have been deteriorating for the better part of the past two years. Monetary Policy: Pushing On A String? One bullish China narrative that currently prevails in the marketplace is that the odds of "big bang" stimulus rise materially in lockstep with any further deterioration in the macro data. Most recently, several China analysts have speculated that the PBOC will soon cut its benchmark policy rate, which would be an unmistakable sign that the monetary policy dial has been turned towards "maximum reflation". Ultimately, we agree with the view that investors hold a put option issued by the Chinese government, but we have strenuously argued that the strike price is considerably lower than many think. On top of this, investors face another risk, namely a circumstance where the exercise price of the China put is even lower than the government intends it to be. This situation could arise if the PBOC decides to fire its bazooka, but the resulting decline in interest rates does not materially boost credit growth. Such a scenario prevailed in the U.S. several years following the global financial crisis, when many investors characterized the Fed's efforts to boost (or at least stabilize) credit growth as "pushing on a string". Chart 6 illustrates that this actually occurred in China during its last mini-cycle upswing, raising the odds of a repeat incident that results in a meaningful lag between the approval of big bang stimulus and its reflationary effect on financial markets. The chart shows the annual change in total social financing as a share of 4-quarter trailing GDP, including and excluding local government bond issuance (both measures exclude equity financing). Chart 6No Major Acceleration In "Standard" Credit Growth In 2015-2016...
No Major Acceleration In "Standard" Credit Growth In 2015-2016...
No Major Acceleration In "Standard" Credit Growth In 2015-2016...
While adjusted TSF excluding local government bonds technically accelerated as a share of GDP from 2015 to late last year, the rise was tepid at best (in contrast to the 2012/2013 episode). It is clear from the chart that most of the acceleration in overall credit during the 2015/2016 period came from a surge in local government bond issuance, not from "standard" credit. This is an important observation, given that interest rates declined significantly over the period (Chart 7). Chart 7...Despite A Substantial Easing In Monetary Policy
...Despite A Substantial Easing In Monetary Policy
...Despite A Substantial Easing In Monetary Policy
From a theoretical perspective, an atypical divergence between interest rates and credit growth can occur either because of abnormal loan demand or loan supply. Chart 8 suggests that it was the latter in China in 2015/2016: loan demand reportedly rose for small/micro, medium, and large enterprises (particularly among small/micro), but the trend in loan approval barely budged (unlike in 2011/2012 when it rebounded sharply). In short, Chart 8 provides support for the view that Chinese banks did not meaningfully ease lending standards during the 2015/2016 episode, despite a substantial easing in monetary policy and (ultimately) a substantial improvement in economic conditions. Chart 8Loan Demand Responded To Lower Rates, But Lending Standards Did Not
Loan Demand Responded To Lower Rates, But Lending Standards Did Not
Loan Demand Responded To Lower Rates, But Lending Standards Did Not
Chart 9 highlights that this almost certainly occurred because of a sharp deterioration in reported bank asset quality that began in 2014. The chart shows that both the non-performing loan and special mention loan ratios rose significantly during this period, the sum of which has only modestly declined. We highlighted the potential for NPL recognition to weigh on credit growth in our two-part joint Special Report with BCA's Geopolitical Strategy service,4 as long as the ongoing financial regulatory crackdown is even half-heartedly implemented. While Chart 8 shows that loan approval modestly ticked higher in Q3, it provides no evidence of stealth easing in financial regulation. Chart 9Banks Did Not Rush To Lend Because Of Deep Concerns Over Asset Quality
Banks Did Not Rush To Lend Because Of Deep Concerns Over Asset Quality
Banks Did Not Rush To Lend Because Of Deep Concerns Over Asset Quality
The key conclusion for investors from these observations is as follows: while China can certainly decide to stimulate aggressively in response to too-weak economic conditions, an impaired monetary transmission mechanism implies that there may be a lag, possibly a substantial one, between the decision to stimulate and its reflationary impact on financial markets. This is of crucial importance to investors aiming to maximize risk-adjusted returns over a 6-12 month time horizon, and weighs heavily on our recommendations. Investment Strategy Recommendations Chart 10 shows our Li Keqiang leading indicator within its component range, a chart that remains at the core of our efforts to predict China's business cycle. The indicator has been built in such a way that a decision of policymakers to push for more local government bond issuance (like in 2015/2016), or an improvement in the efficacy of China's monetary transmission mechanism, are likely to be captured by one or more of its components. Chart 10Only A Narrow Pickup In Our LKI Leading Indicator
Only A Narrow Pickup In Our LKI Leading Indicator
Only A Narrow Pickup In Our LKI Leading Indicator
As we noted in our November 7 Weekly Report,5 the rise in the indicator has been driven by its two monetary conditions components, which have in turn mostly been driven by the substantial weakness in the RMB over the past four months. Given that the ultimate impact of the U.S. tariffs on Chinese exports remains obscured by trade frontrunning, it is unclear if China's exchange rate depreciation will be sufficiently reflationary even to counter the upcoming export shock, let alone reverse the ongoing domestic demand slowdown. As a result, investors should be closely watching for signs of a pickup in money & credit growth, which for now remain absent. Put differently, macrofundamental support for the equity market is lacking. Despite this, Chart 11 highlights that both Chinese A-shares and the investable market are deeply oversold, which in combination with expectations of further monetary stimulus and the potential for a tariff ceasefire have many investors chafing at the bit to go long either market (or both!) over a 6-12 month time horizon. Chart 11Chinese Stocks Are Quite Oversold...
Chinese Stocks Are Quite Oversold...
Chinese Stocks Are Quite Oversold...
Our advice is simply to wait. A trade ceasefire is unlikely to generate more than a short-term boost to stock prices, and our indicators provide the best bet to monitor whether an impaired banking system is responding to any further easing in monetary policy. Finally, while we agree that stocks have priced in a meaningful decline in earnings, that earnings adjustment process has yet to even begin. Chart 12 illustrates the point where Chinese stocks bottomed in relation to the last major decline in earnings, suggesting that stocks need both a valuation discount and earnings clarity before putting in a durable bottom. The latter is missing and may stay missing for several months, highlighting that an outright long position remains premature. Stay tuned! Chart 12...But We Have Yet To Even Begin The Earnings Adjustment Process
...But We Have Yet To Even Begin The Earnings Adjustment Process
...But We Have Yet To Even Begin The Earnings Adjustment Process
Jonathan LaBerge, CFA, Vice President Special Reports jonathanl@bcaresearch.com Footnotes 1 Pease see China Investment Strategy Weekly Report "Is China Making A Policy Mistake?", dated October 31, 2018, available at cis.bcaresearch.com. 2 Pease see China Investment Strategy Special Reports "China's Property Market: Where Will It Go From Here?", dated September 13, 2018, available at cis.bcaresearch.com. 3 Pease see BCA Foreign Exchange Strategy Weekly Report "The Dollar And Risk Assets Are Beholden To China's Stimulus", dated August 3, 2018, available at fes.bcaresearch.com. 4 Pease see China Investment Strategy Special Reports "China: How Stimulating Is The Stimulus?", dated August 8, 2018, and "China: How Stimulating Is The Stimulus? Part Two", dated August 15, 2018, available at cis.bcaresearch.com. 5 Pease see China Investment Strategy Weekly Report "Checking In On The Data", dated November 7, 2018, available at cis.bcaresearch.com. Cyclical Investment Stance Equity Sector Recommendations
Dear Client, Barring any major market developments, we will not be sending you a report next week. Instead, I will be working with my colleagues on BCA's Annual Outlook, which will be published on Monday, November 26. The outlook will feature a wide-ranging discussion with Mr. X and his daughter Ms. X on the key themes that we see shaping global markets in 2019. Best regards, Peter Berezin, Chief Global Strategist Highlights The stock market correction has further to run. We would turn more bullish if global equities were to drop another 8% from current levels. A mundane economic identity - savings minus investment equals the current account balance - provides deep market insight into the workings of the global economy. The U.S. economy is suffering from a shortage of savings, which will push up interest rates and the value of the dollar. In contrast, China has a surfeit of savings. Rectifying this will require a weaker yuan. The political impasse between the EU and Italy over next year's budget will be resolved. However, the fact that Italy lacks a readily available outlet for its excess private-sector savings could spell doom for the euro area down the road. Feature The Correction Ain't Over Our MacroQuant model continues to signal downside risks for global equities over the coming weeks (Chart 1). The model is flagging a deterioration in a variety of leading economic indicators, both in the U.S. and abroad, which tends to be bearish for stocks (Chart 2). Global financial conditions have also tightened since the summer due to the rise in government bond yields, higher credit spreads, and a firmer dollar. Chart 1MacroQuant* Model Suggests Caution Is Still Warranted
S-I=CA In The U.S., China, And Italy
S-I=CA In The U.S., China, And Italy
Chart 2Global Growth Indicators Are Deteriorating
Global Growth Indicators Are Deteriorating
Global Growth Indicators Are Deteriorating
Sentiment remains reasonably upbeat, a bearish contrarian indicator. The November Bank of America Merrill Lynch Global Fund Manager Survey revealed that a net 31% of managers were still overweight global stocks. Past major bottoms in 2008, 2011, 2012, and 2016 all saw equity allocations fall into underweight territory. Strikingly, EM allocations rose in November, with a net 13% of fund managers overweight the asset class. This is in stark contrast to 2015 when a net 30% of fund managers were underweight EM stocks. We do not expect the correction which began in October to morph into a full-fledged bear market. Nevertheless, the near-term path of least resistance for stocks remains to the downside. We would only upgrade global equities to overweight if the MSCI All-Country World index were to fall another 8% from current levels, consistent with a price of $64 on the ACWI ETF. At that level, the forward P/E on the index would be back to 2013 levels (Chart 3). Chart 3A Valuation Reset
A Valuation Reset
A Valuation Reset
A Key Macro Identity One of the first identities undergraduate economics students learn is S-I=CA: The difference between what a country saves and invests is equal to its current account balance.1 While it is easy to dismiss this identity as yet another abstract concept that only egghead economists would find interesting, it has real-world implications for investors of all stripes. To see this, it is useful to expand the identity a bit. Total savings is just the sum of private-sector and public-sector savings. Thus, we can write: Private-sector savings = fixed asset investment + government budget deficit + current account balance In other words, the savings that the private sector generates must either be recycled into investment, soaked up by the government through a budget deficit, or exported abroad via a current account surplus. This relationship always holds ex post. But what happens if it does not hold ex ante? Then "something" must adjust to make the relationship hold. In a normal environment, this "something" is interest rates. If there is a shortfall of private-sector savings - that is, if the right-hand side of the equation above exceeds the left-hand side - an increase in rates can restore the identity by encouraging private savings, discouraging investment, and potentially making it more difficult for the government to pursue an expansionary fiscal policy. Higher rates will also produce a stronger currency, leading to a deterioration in the current account balance. The exact opposite will happen if there is an excess of private-sector savings. What happens if there is excessive savings but the central bank cannot lower interest rates either because it lacks monetary independence - i.e., when a country has a currency peg - or because monetary policy is constrained by the zero lower bound on nominal short-term rates? In that case, employment will decline. One cannot save if one does not have a job that generates income. In practice, this can lead to a vicious circle where falling employment causes households to try to save more for precautionary reasons, while discouraging companies from investing in new capacity. The resulting increase in desired savings is likely to lead to further declines in employment. Keynes referred to this outcome as the paradox of thrift: A situation where one person's desire to save more leads to a collective decline in savings because aggregate income shrinks. Let's turn to what all this means for investors today. The U.S.: Trump's Fiscal Policy Is Inconsistent With His Trade Goals The IMF estimates that the U.S. cyclically-adjusted budget deficit will reach 5.6% of GDP next year. The results of the midterm elections are unlikely to change this outcome. While the takeover of the House of Representatives by the Democrats will preclude Congress from passing another round of tax cuts, our geopolitical strategists believe that there is a better than 50% chance that a bipartisan deal will be reached to increase infrastructure spending.2 They point out that Nancy Pelosi mentioned infrastructure five times during her election night address, without mentioning impeachment once. Recent data on U.S. capital spending has been on the soft side (Chart 4). Core capital goods orders have decelerated and capex intention surveys have come off their highs. Residential investment has also been weak, as reflected in declining housing starts and building permits. Chart 4Both Residential And Nonresidential Investment Have Softened
Both Residential And Nonresidential Investment Have Softened
Both Residential And Nonresidential Investment Have Softened
We would tend to fade the weakness in capital spending (Chart 5). The ISM industrial capacity utilization rate is near cycle highs. Rising wages will incentivize firms to substitute labor with capital, leading to more investment spending. The downside risk to home building is also limited, given that residential investment stands at only 3.9% of GDP, well below the high of 6.7% reached in 2005. If anything, the U.S. is not churning out enough fixed capital, as evidenced by the fact that the average age of the capital stock has risen swiftly over the past decade. As my colleague Doug Peta likes to say, you don't get hurt falling out of a basement window. Chart 5Running Out Of Spare Capacity
Running Out Of Spare Capacity
Running Out Of Spare Capacity
Meanwhile, the personal savings rate stands at over 6%, significantly higher than what one would expect based on its typical relationship with household net worth (Chart 6). Chart 6U.S. Household Savings Rate Is High Relative To Wealth
S-I=CA In The U.S., China, And Italy
S-I=CA In The U.S., China, And Italy
The identity described at the outset of this report implies that the trade balance will necessarily deteriorate if the savings rate falls, investment rises, and the budget deficit remains elevated. If President Trump strikes a trade deal with China, he will have no one to blame for a larger U.S. trade deficit. Hence, he has little incentive to make a deal. Protectionism remains popular in the U.S. Midwest, the battleground on which the next presidential election will be fought. Democrat Sherrod Brown won the Ohio Senate race by 6.4% - a state that Trump carried by 8.1% - on a highly protectionist platform. Trump simply cannot afford to go soft on one of his signature issues. China: What To Do With Excess Savings? The slowdown in Chinese growth this year has been concentrated in domestic demand (Chart 7). Exports have held up well. In fact, Chinese exports to the U.S. are up 13% in dollar terms in the first ten months of the year compared with the same period last year. Chart 7China's Domestic Economy Is Weakening
China's Domestic Economy Is Weakening
China's Domestic Economy Is Weakening
Unfortunately, judging from the steep drop in the export component of the Chinese manufacturing PMI, exports are likely to come under increasing pressure over the coming months (Chart 8). This makes it all the more important for the Chinese authorities to prop up domestic growth. Chart 8China's Export Outlook Is Dire
China's Export Outlook Is Dire
China's Export Outlook Is Dire
China has historically stimulated its economy through debt-financed fixed-investment spending (Chart 9). This made eminent sense when China needed more factories, infrastructure, and modern housing. However, now that China has all this in spades, it is looking for different stimulus options. Chart 9China: Debt And Capital Accumulation Have Gone Hand In Hand
China: Debt And Capital Accumulation Have Gone Hand In Hand
China: Debt And Capital Accumulation Have Gone Hand In Hand
Our formula reveals what those other options must be. If China wants to reduce investment spending to a more sustainable level, it must either boost consumption, increase the fiscal deficit, or raise net exports. Given a hostile export backdrop, it is therefore no surprise that the Chinese government has been cutting taxes, increasing social transfer payments, and letting the currency slide. The problem is that none of these other forms of stimulus are beneficial to the rest of the world, and in some cases, they may be quite detrimental. The rest of the world relies on Chinese investment, not Chinese consumption. Raw materials and capital goods comprise 80% of Chinese imports. China represents close to half of the world's demand for aluminum, copper, zinc, nickel, and steel (Chart 10). Whether it be services or manufactured goods, what Chinese households consume is generally produced in China. Chart 10China Is The Predominant Source Of Global Demand For Metals
China Is The Predominant Source Of Global Demand For Metals
China Is The Predominant Source Of Global Demand For Metals
A weaker yuan will make the Chinese economy more competitive, but at the expense of other emerging markets. A weaker yuan will also raise the price of imported goods, leading to a lower volume of imports. The implication is that both the magnitude and composition of China's stimulus may disappoint. This week's much weaker-than-expected credit and money data - new CNY loans clocked in at RMB 697 billion in October, well below consensus expectations of RMB 905 billion - validates this view. Italy: Getting To "Yes" Is The Easy Part The showdown between Italy's populist leaders and the EU continues. The Lega-Five Star coalition government promised big tax cuts and generous increases in social spending. It is loath to backtrack on its campaign pledges so soon after the election. As long as there is no contagion from Italy to the rest of Europe, the EU has no incentive to back off. While it will never admit it, the EU establishment would love nothing more than to humiliate the Italians in order to dissuade voters across Europe from electing populist politicians. In the end, we expect the Italian government to give in to the EU's demands. Business confidence has plunged (Chart 11). The economy is again teetering on the brink of recession. Italy's banking system would be technically insolvent if the ten-year BTP yield were to rise above 4% based on a mark-to-market accounting of Italian bank holdings of government debt. Chart 11Italy: Is The Economy Heading For Another Dip?
Italy: Is The Economy Heading For Another Dip?
Italy: Is The Economy Heading For Another Dip?
A political resolution to the ongoing crisis would provide short-term relief. However, it may not solve Italy's problems - indeed, it could exacerbate them. Italy's working-age population is shrinking (Chart 12). This has made companies reluctant to expand capacity. Meanwhile, households are busily saving for retirement. Their motivation to save more would only be amplified by the cuts to pension benefits that the previous caretaker government promised and that the EU is insisting be implemented. The overall private-sector financial balance - the difference between what the private sector saves and invests - reached a surplus of 5.1% of GDP in 2017 (Chart 13). Chart 12The Italian Workforce Is Shrinking
S-I=CA In The U.S., China, And Italy
S-I=CA In The U.S., China, And Italy
Chart 13Italy: Private Sector Saves Too Much And Spends Too Little
Italy: Private Sector Saves Too Much And Spends Too Little
Italy: Private Sector Saves Too Much And Spends Too Little
Our formula shows that counterbalancing this private-sector surplus will require a persistent government fiscal deficit or current account surplus. Italy's primary budget balance - its overall budget balance excluding interest payments - hit 1.7% of GDP in 2017 (Chart 14). This primary surplus is necessary to cover the 3.6% of GDP in interest payments that the government has to make, a number that will only rise if the ECB raises rates (hence, our high-conviction view that the ECB will have to keep rates low for years to come). Chart 14Italy Needs A Primary Budget Surplus
Italy Needs A Primary Budget Surplus
Italy Needs A Primary Budget Surplus
Italy runs a modest current account surplus of 2% of GDP. However, its current account balance would be far smaller, and perhaps even negative, if the economy were operating at full employment since stronger domestic demand would suck in more imports. Italy would love to copy Germany, a country which habitually over-saves but exports its excess savings to the rest of the world through a gargantuan 8% of GDP current account surplus. Alas, achieving a larger current account surplus would require either a currency depreciation or productivity-enhancing structural reforms. The former is impossible as long as Italy is a member of the euro area, while the latter has proven to be wishful thinking for as long as people have talked about it. We do not expect Italy to default on its debt or jettison the euro in the near term. But when the next synchronized global downturn arrives - probably in about two years or so - all hell could break loose. Concluding Thoughts An economy facing a shortfall in savings is one where desired spending exceeds income. When the economy has spare capacity, such a savings shortfall is a good thing; it means more demand, more employment, and ultimately, more income. However, once spare capacity is soaked up, a shortage of savings will lead to higher inflation. The U.S. finds itself in the latter situation today. The output gap is fully closed, but growth remains above trend. As we have discussed in past reports, the Fed is likely to raise rates more than the market expects.3 This will lead to higher Treasury yields and a stronger dollar. With that in mind, we are raising our end-year target on our long DXY trade recommendation from 98 to 100, implying another 3% increase from current levels. In the absence of offsetting Chinese stimulus, a stronger dollar will put further pressure on emerging markets. EM equities will likely bottom in the first half of next year once the dollar peaks and global growth stabilizes. Until then, investors should overweight DM stocks relative to their EM peers. Peter Berezin, Chief Global Strategist Global Investment Strategy peterb@bcaresearch.com 1 National savings, S, is equal to Y-C-G, where Y is national income and C and G are household and government consumption, respectively. Substituting this identity into the standard Y=C+I+G+X-M equation yields S-I=X-M. National income includes net foreign earnings. In this case, the trade balance, X-M, is equal to the current account balance. 2 Please see Geopolitical Strategy Special Report, "The 2020 U.S. Election: A "Way Too Soon" Forecast," dated November 7, 2018. 3 Please see Global Investment Strategy Weekly Report, "Bond Bears Maul Goldilocks," dated October 12, 2018; and "The Next U.S. Recession: Waiting For Godot?" dated October 5, 2018. Strategy & Market Trends Tactical Trades Strategic Recommendations Closed Trades
Highlights Global growth has not yet bottomed, this will provide additional support for the dollar. EUR/USD will be a buy once it dips below 1.1, as slowing global growth means that European activity will continue to lag behind the U.S. The dollar is not as expensive as simple metrics suggest. Fade any Sino-U.S. détente in Buenos Aires. The best vehicle to play a dollar correction remains the NZD. GBP volatility is peaking. Feature We have been on the road for the past two weeks, in the U.S. and in the Middle East. Exchanges with clients can reveal what the key narratives driving the markets are and where the walls of worries may lie. This week, we opted to share what have been the major questions plaguing clients minds. Question 1: Has Global Growth Bottomed? The short answer is no. While there are issues affecting Europe, such as Italian budget battles and idiosyncrasies in the German auto sector, the key impetus pushing global growth downward is China. The Chinese economy is slowing as Chinese policymakers are working to force indebtedness lower, and have therefore constrained access to credit, especially in the shadow banking system (Chart I-1). This has not changed. Chart I-1Chinese Policy Tightening In Action China's Deleveraging Is Not Over Yet
Chinese Policy Tightening In Action China's Deleveraging Is Not Over Yet
Chinese Policy Tightening In Action China's Deleveraging Is Not Over Yet
It is also true that Chinese policy makers have been trying to limit the downside to growth. They have injected liquidity in the banking system, let the renminbi depreciate, and allegedly, supported a stock market spiraling downward under the pressure of margin calls. Moreover, fiscal policy is being eased, with income tax cuts pointing to a desire to support household consumption, especially spending on services. But none of these policy actions seems to matter for the world economy, at least for now. China impacts global growth through its imports, and non-food commodities, investment goods, machinery equipment and transportation goods constitute 85% of total Chinese imports. These goods are levered to industrial activity and the Chinese investment cycle. The latter in turn is levered to the Chinese credit cycle (Chart I-2). Hence, as long as China tries to reign in credit growth, Chinese imports will be under pressure. Chart I-2Slowing Chinese Credit Impulse Means Slower Chinese Imports
bca.fes_wr_2018_11_16_s1_c2
bca.fes_wr_2018_11_16_s1_c2
What about the recent rebound in Chinese imports? Our China Strategist posits that it has been linked to front running of orders before the Trump tariffs enter into effect. The trend in credit growth remain poor. The October's money and credit numbers show that the China's total social financing grew at its slowest pace in 12 years, and money growth as well as traditional loan growth has also relapsed (Chart I-3). Hence, China doesn't have an appetite for credit yet. Chart I-3Chinese Credit Is Not Responding To Chinese Stimulus
Chinese Credit Is Not Responding To Chinese Stimulus
Chinese Credit Is Not Responding To Chinese Stimulus
It is hard to fully know why the country's appetite for credit is slowing despite the expanding list of small measures implemented by authorities to support economic activity. On the one hand, it seems that lenders are reluctant to lend. On the other, the private sector does not seems hungry to spend either. As BCA's Emerging Market Strategy service highlighted, even the Chinese consumer is displaying a declining marginal propensity to consume, and retail sales as well as car sales are declining (Chart I-4).1 This suggests that China will continue to act as an anchor on global growth for the time being. Chart I-4Chinese Households Are Cautious
Chinese Households Are Cautious
Chinese Households Are Cautious
Stresses outside of China also remain problematic for global growth. Emerging market financial conditions have tightened significantly. This will continue to act as a drag on global industrial activity (Chart I-5). In fact, the recent poor GDP numbers out of Germany and Japan, two nations highly levered to the global industrial cycle, confirm that the pain originating in the EM space is spreading around the globe. Chart I-5EM Financial Conditions Suggest Continued Downward Pressure On Growth
EM Financial Conditions Suggest Continued Downward Pressure On Growth
EM Financial Conditions Suggest Continued Downward Pressure On Growth
Ultimately, since the U.S. economy is a low beta economy, even if U.S. growth downshifts in response to shocks to global growth, it is likely to slow less than the rest of the world. This explains why the dollar exhibits little constant correlation with U.S. growth, but a tight negative relationship with global growth (Chart I-6). Chart I-6The Countercyclical Dollar
The Countercyclical Dollar
The Countercyclical Dollar
Hence, since we see little hope for an imminent bottom in global growth, additional dollar upside remains. Thus, we re-iterate our target for DXY at 100. Nevertheless, make no mistake, the easy gains in the greenback are behind us. The remainder of the rally will likely prove volatile. Question 2: Is The Growth Divergence Between The U.S. And The Euro Area Peaking? Will This Reverse The Dollar Rally? Economic data in the U.S. has begun to weaken, especially on the durable good orders and the housing fronts. Moreover, the recent core CPI data, which came in at 2.1%, was a disappointment. The strong dollar, higher interest rates, tighter financial conditions, and the potential hit to profits from falling oil prices all suggest that U.S. capex could slow. However, as Chart I-7 illustrates, Europe is slowing more than the U.S. Despite the rollover in the U.S. Leading Economic Indicator, the gap between the U.S. and the euro area LEI is in fact growing in favor of the U.S. This is because the U.S. is a low beta economy and it outperforms Europe when global growth slows, especially when the negative impulse emanates out of China (Chart I-8). Chart I-7U.S. Growth May Be Slowing, But It Is Still Outperforming...
U.S. Growth May Be Slowing, But It Is Still Outperforming...
U.S. Growth May Be Slowing, But It Is Still Outperforming...
Chart I-8...Especially If China Does Not Pick Up
...Especially If China Does Not Pick Up
...Especially If China Does Not Pick Up
Nonetheless, the Fed has already increased rates eight times this cycle and the market anticipates a bit more than two interest rate hikes in the U.S. over the next 12 months, while in Europe, rate expectations are much more muted. Will this slowdown in U.S. growth cause U.S. rate and yield differentials versus the euro area - which stand near historical highs - to fall, providing a welcome fillip for EUR/USD in the process (Chart I-9)? Chart I-9U.S. Spreads Are Wide
U.S. Spreads Are Wide
U.S. Spreads Are Wide
We doubt it. First, three deep structural problems still hamper Europe: Italy still faces challenging debt arithmetic if interest rates rise quickly, which means that Italy continues to teeter close to the hedge of a Eurosceptic drama. European banks are still much weaker than U.S. ones and have a large amount of EM exposure, limiting their capacity to handle higher rates. Europe is far from a true fiscal union, which means that the job of supporting growth lies much more heavily on monetary authorities than in the U.S. This forces the European Central Bank to stay more dovish than the Fed. Second, once the cost of currency hedging is taken into account, the spread between U.S. and European bonds yields becomes negative (Chart I-10)! This suggests that unhedged U.S. yields can rise further versus European ones as U.S. hedged yields are not attractive. This means that yields and interest rates in the U.S. can remain high or even rise relative to Europe, making it attractive to buy the greenback for investors willing to take on currency risk. Chart I-10U.S. Hedged Yields Are Low
U.S. Hedged Yields Are Low
U.S. Hedged Yields Are Low
Hence, we do not expect that the slowdown in U.S. growth will constitutes a major problem for the dollar. Instead, we are looking for EUR/USD to fall below 1.10 before buying the common currency again. Question 3: Is The Dollar Expensive? The answer to this question seems obvious. When looking at a simple purchasing-power parity model, the dollar does look very expensive (Chart I-11). However, valuing currencies is a much more complex question than just looking at PPP metrics. Once other factors are taken into account, the dollar trades in line with its long-term drivers (Chart I-12). The dollar might not be as expensive as PPP metrics suggest because the U.S. productivity growth is higher than in most other G10 nations, because neutral interest rates in the U.S. are structurally higher than in Europe or Japan, and because the U.S. current account deficit is stable despite a strong dollar as the U.S. morphs from an energy importer to an energy exporter. Chart I-11U.S. Dollar And PPP Is The Greenback Really This Expensive?
U.S. Dollar And PPP Is The Greenback Really This Expensive?
U.S. Dollar And PPP Is The Greenback Really This Expensive?
Chart I-12Maybe Not
Maybe Not
Maybe Not
On a short-term basis, there is no evident misalignment in the USD either. The DXY dollar index trades in line with our short-term metrics, suggesting that until now, the bulk of the dollar rally this year was a correction of its previous undervaluation (Chart I-13). Furthermore, the dollar tends to peak at higher degree of overvaluations, and, if U.S. growth continues to outperform the rest of the world, the fair value of the DXY could rise further. Chart I-13No Short-Term Misalignment
No Short-Term Misalignment
No Short-Term Misalignment
Question 4: Will Sino-U.S. Relations Improve After The Buenos Aires G20 Meeting? We are skeptical that Sino-U.S. relations will improve after the Buenos Aires meeting at the end of the month. The White House could delay the imposition of a third round of tariffs as well as the increase in the current tariff rate from 10% to 25%. Such actions would likely result in a temporary bounce back in risk assets and EM related plays as well as correction in the USD. However, President Trump has no incentive to make a full-blown trade deal with China right now. The midterm elections confirmed that the U.S. electorate is not pro-free trade and that the political apparatus in the U.S. is unified in fighting China. At the end of the day, China is a great scapegoat for the income inequality problem plaguing the U.S. Question 5: Will The Dollar Correct After Its Furious 2018 Rally? Our inclination is to think that there are short-term risks building up in the dollar, a topic we discussed at length three weeks ago.2 Namely, traders are now very long the dollar, and risk-on currencies have been rallying against the dollar despite the strength in the DXY. This suggests that the corners of the FX market most levered to global growth might be sniffing out a stabilization in global conditions. Indeed, the Chinese economic surprise index has improved (Chart I-14). While Chinese data has not meaningfully picked up, expectations toward China are very depressed. As such, a slowdown in the pace of deterioration could be interpreted as good news for global growth. The countercyclical dollar may correct. Chart I-14Are Expectations Toward China Too Depressed?
Are Expectations Toward China Too Depressed?
Are Expectations Toward China Too Depressed?
We have not played the dollar correction risk through selling DXY or buying EUR/USD. Instead, we have bought the NZD against both the USD and the GBP. The beaten down kiwi would be the currency most likely to rebound if global growth conditions were to surprise to the upside, even if temporarily. This has proved to be the right call. We remain positive on the NZD for the coming two months. However, from a risk management perpectives we are closing our long NZD/USD trade at 4.8% profit. However, we doubt that any dollar correction is likely to morph into a genuine bear market. If global growth conditions were indeed to improve, this would give more ammo for the Fed to hike in line with its "dots". The market knows that and would revise upward the modest 60 basis point of hikes currently anticipated over the coming 12 months. As such, the resultant increase in real rates would likely hurt the still-fragile EM economies and cause a renewed tightening in EM financial conditions. This would in turn lead to additional slowdown in global growth and would support the dollar. Hence, our current positive predisposition toward the kiwi is temporary in nature. Question 6: Has The Pound Bottomed, Will GBP-Volatility Recede Anytime Soon? In September, we warned that the pound did not compensate investors adequately for the political uncertainty surrounding Brexit risks.3 Specifically, we were most worried about British domestic politics, not the EU side of the negotiations. However, because we believed that ultimately, either soft Brexit or Bremain would ultimately prevail, we refrained from selling the pound outright. Instead, we recommended investors buy the GBP's volatility. Today, Prime Minister Theresa May is in danger as two additional ministers resigned from her cabinet after she presented the Brexit deal that was hammered out with Brussels. The risk of a new election or a hard-liner Brexit Tory replacing her is growing by the minute. Markets are once again clobbering the pound, and GBP implied volatility is trading at level last seen directly after the June 2016 referendum (Chart I-15). Chart I-15Close Long GBP Vol Bets
Close Long GBP Vol Bets
Close Long GBP Vol Bets
At current levels, the pound is now an attractive play for long-term investors. Additionally, while a new election is likely to cause more tremors into the pound, we are inclined to recommend investors close long GBP volatility trades as the British public is growing more disillusioned with Brexit. Our conviction is only growing that only the softest form of Brexit will be implemented. As a result, the risk-reward ratio from selling the pound or buying its volatility has now significantly deteriorated. We are closing our short GBP/NZD trade at a 6% profit in four weeks. Mathieu Savary, Vice President Foreign Exchange Strategy mathieu@bcaresearch.com Footnotes 1 Please see Emerging Markets Strategy Weekly Report, titled "On Domino Effects And Portfolio Outflows", dated November 15, 2018, available at ems.bcaresearch.com 2 Please see Foreign Exchange Strategy Weekly Report, titled "Risk To The Dollar View", dated October 26, 2018, available at fes.bcaresearch.com 3 Please see Foreign Exchange Strategy Special Report, titled "Assessing the Geopolitical Risk Premium In the Pound", dated September 7, 2018, available at fes.bcaresearch.com Currencies U.S. Dollar Chart II-1USD Technicals 1
USD Technicals 1
USD Technicals 1
Chart II-2USD Technicals 2
USD Technicals 2
USD Technicals 2
Recent data in the U.S. has been mixed: Both core inflation and core PCE came in below expectations, coming in at 2.1% and 1.6% respectively. However, Q3 GDP growth surprised to the upside, coming in at 3.5%. Moreover, nonfarm payrolls also came in above expectations, coming in at 250 thousand. The DXY index has been able to appreciate over the past three weeks. We maintain our bullish bias towards the dollar, given that despite its rise, this currency remains fairly valued. Moreover, we expect global growth to continue deaccelerating, as Chinese authorities continue to tighten. That being said, potential upside might be limited from current levels, as speculators are very long the dollar. Report Links: Updating Our Intermediate Timing Models - November 2, 2018 In Fall, Leaves Turn Red, The Dollar Turns Green - October 12, 2018 Policy Divergences Are Still The Name Of The Game - August 14, 2018 The Euro Chart II-3EUR Technicals 1
EUR Technicals 1
EUR Technicals 1
Chart II-4EUR Technicals 2
EUR Technicals 2
EUR Technicals 2
Recent data in the Euro area has been mixed: Core inflation increased and outperformed expectations, coming in at 1.1%. Moreover, Markit Services PMI also surprised to the upside, coming in at 53.7. However, Markit Manufacturing PMI surprised negatively, coming in at 52. EUR/USD has depreciated over that past three weeks. We remain bearish on the euro, given that we expect global growth to keep slowing, hurting export-driven economies like the euro area. Furthermore, Italian debt dynamics will continue to plague the Eurozone. That being said, if the euro were to fall below 1.1, we would tamper our bearishness. Report Links: Evaluating The ECB's Options In December - November 6, 2018 Updating Our Intermediate Timing Models - November 2, 2018 Will Rising Wages Cause An Imminent Change In Policy Direction In Europe And Japan? - October 5, 2018 The Yen Chart II-5JPY Technicals 1
JPY Technicals 1
JPY Technicals 1
Chart II-6JPY Technicals 2
JPY Technicals 2
JPY Technicals 2
Recent data in Japan has been mixed: The unemployment rate surprised positively, coming in at 2.3%. This measure also decreased from last month. However, housing starts yearly growth underperformed expectations, coming in at -1.5%. Moreover, overall household spending yearly growth also surprised negatively, coming in at -1.6%. Q2 GDP contracted and also came in below expectations, driven by poor capex growth. USD/JPY has also appreciated over the past three weeks. We remain positive on the trade-weighted yen, given that the continued slowdown in global growth, fueled by the dual tightening of policy by Chinese authorities and the Fed, will help safe haven currencies like the yen. Moreover, the current selloff in U.S. markets could also provide a boon for this currency if it forces the Fed to tamper its hawkishness. Report Links: Updating Our Intermediate Timing Models - November 2, 2018 Will Rising Wages Cause An Imminent Change In Policy Direction In Europe And Japan? - October 5, 2018 Rhetoric Is Not Always Policy - July 27, 2018 British Pound Chart II-7GBP Technicals 1
GBP Technicals 1
GBP Technicals 1
Chart II-8GBP Technicals 2
GBP Technicals 2
GBP Technicals 2
Recent data in the U.K. has been mixed: Average hourly earnings excluding bonus yearly growth surprised to the upside, coming in at 3.2%. However, core inflation underperformed expectations, coming in at 1.9%. Moreover, retail sales yearly growth also surprised negatively, coming in at 2.2%. After rising for the last three weeks, GBP/USD fell by over 1.5% on Thursday, after two ministers quit Theresa's May cabinet. While the headline risk remains large, especially as the U.K. could soon go through an election, we do not want to be greedy and our closing our long GBP-vol bets. We are also closing our short GBP/NZD bet. At current levels, GBP is now an attractive long-term play. Report Links: Updating Our Intermediate Timing Models - November 2, 2018 Clashing Forces: The Fed And EM Financial Conditions - October 19, 2018 Updating Our Long-Term FX Fair Value Models - June 22, 2018 Australian Dollar Chart II-9AUD Technicals 1
AUD Technicals 1
AUD Technicals 1
Chart II-10AUD Technicals 2
AUD Technicals 2
AUD Technicals 2
Recent data in Australia has been positive: Employment growth outperformed expectation, coming in at 32.8 thousand. Moreover, the participation rate also surprised to the upside, coming in at 65.6%. Finally, the unemployment rate also surprised positively, coming in at 5%. AUD/USD has risen by 3.39% the past 3 weeks. We are inclined to fade this rally as the poor outlook for the Chinese economy could soon transform these strong Australian economic results into much more disappointing numbers. Report Links: Updating Our Intermediate Timing Models - November 2, 2018 Policy Divergences Are Still The Name Of The Game - August 14, 2018 What Is Good For China Doesn't Always Help The World - June 29, 2018 New Zealand Dollar Chart II-11NZD Technicals 1
NZD Technicals 1
NZD Technicals 1
Chart II-12NZD Technicals 2
NZD Technicals 2
NZD Technicals 2
Recent data in New Zealand has been positive: Employment growth outperformed expectations, coming in at 1.1%. Moreover, the participation rate also surprise to the upside, coming in at 71.1%. Finally, the unemployment rate also surprised positively, coming in at 3.9%. NZD/USD has risen by more than 5.5% the past 3 weeks. The NZD continues to be one of our favorite currencies in the G10, given that rate expectations continue to be very low, even though economic data has strengthened. Moreover, food prices, dairies in particular have limited downside from here, especially as they are not very exposed to China's policy tightening. Report Links: Updating Our Intermediate Timing Models - November 2, 2018 Clashing Forces: The Fed And EM Financial Conditions - October 19, 2018 In Fall, Leaves Turn Red, The Dollar Turns Green - October 12, 2018 Canadian Dollar Chart II-13CAD Technicals 1
CAD Technicals 1
CAD Technicals 1
Chart II-14CAD Technicals 2
CAD Technicals 2
CAD Technicals 2
Recent data in Canada has been positive: The net change in employment outperformed expectations, coming in at 11.2 thousand. Moreover, housing starts also surprised to the upside, coming in at 206 thousand. Finally, the unemployment rate also surprised positively, coming in at 5.8%. USD/CAD has risen by 1.2% these past 3 weeks. The weakness in oil prices have caused the Canadian dollar to be one of the worst performing currencies in the G10 in recent weeks. We are reticent to be too bullish on the CAD, given that markets are now pricing in a BoC that will be more hawkish than the Fed. Report Links: Updating Our Intermediate Timing Models - November 2, 2018 Clashing Forces: The Fed And EM Financial Conditions - October 19, 2018 Updating Our Long-Term FX Fair Value Models - June 22, 2018 Swiss Franc Chart II-15CHF Technicals 1
CHF Technicals 1
CHF Technicals 1
Chart II-16CHF Technicals 2
CHF Technicals 2
CHF Technicals 2
Recent data in Switzerland has been negative: Real retail sales yearly growth came in significantly below expectations, coming in at -2.7%. Moreover, the SVME Purchasing Manager's Index also surprised to the downside, coming in at 57.4. Finally, the KOF leading Indicator also surprised negatively, coming in at 100.1. EUR/CHF has been flat in recent weeks. We continue to be bearish on the franc on a cyclical basis, given that inflationary forces in Switzerland remain too tepid for the SNB to hike policy rates. Moreover, the SNB will also have to intervene in currency markets if the franc becomes more expensive in response to the current risk-off environment. Report Links: Updating Our Intermediate Timing Models - November 2, 2018 Updating Our Long-Term FX Fair Value Models - June 22, 2018 Updating Our Intermediate Timing Models - May 18, 2018 Norwegian Krone Chart II-17NOK Technicals 1
NOK Technicals 1
NOK Technicals 1
Chart II-18NOK Technicals 2
NOK Technicals 2
NOK Technicals 2
Recent data In Norway has been mixed: Both headline and core inflation underperformed expectations, coming in at 3.1% and 1.6% respectively. Moreover, manufacturing output also surprised to the downside, coming in at -0.3%. However, registered unemployment surprised positively, coming in at 79.7 thousand. USD/NOK has risen by 1.5%, as falling oil prices have weighed heavily on the krone. We are bullish on the krone relative to the Canadian dollar, given that rate expectations in Canada are much more fully priced in Canada than they are in Norway, even though the inflationary backdrop is similar. Report Links: Updating Our Intermediate Timing Models - November 2, 2018 Clashing Forces: The Fed And EM Financial Conditions - October 19, 2018 Updating Our Long-Term FX Fair Value Models - June 22, 2018 Swedish Krona Chart II-19SEK Technicals 1
SEK Technicals 1
SEK Technicals 1
Chart II-20SEK Technicals 2
SEK Technicals 2
SEK Technicals 2
Recent data in Sweden has been mixed: Retail sales yearly growth outperformed expectations, coming in at 2.1%. Manufacturing PMI also outperformed expectations, coming in at 55. However, headline inflation surprised to the downside, coming in at 2.3%. USD/SEK has depreciated by roughly 1% for the past 3 weeks. Overall, we are bullish on the krona on a long-term basis. After all, the Riksbank is on the verge of beginning a tightening cycle, as imbalances in the Swedish economy are only growing more dangerous. With that being said, the krona could suffer if global growth slows further, as Sweden is very exposed to the gyrations of the global economy. Report Links: Updating Our Intermediate Timing Models - November 2, 2018 Updating Our Long-Term FX Fair Value Models - June 22, 2018 Updating Our Intermediate Timing Models - May 18, 2018 Trades & Forecasts Forecast Summary Core Portfolio Tactical Trades Closed Trades
The Chinese economy is transitioning from investment- and export-led growth to consumer-led growth. Amid downward pressure on investment growth and escalating China-U.S. trade tensions, the strength and durability of household consumption in China has become…
Our Chief Geopolitical Strategist, Marko Papic, just wrote a fantastic piece on how the secular upswing in U.S.-China tensions could shape the future of critical industries (to impacting both investors and governments) and capital market behavior.1 The…
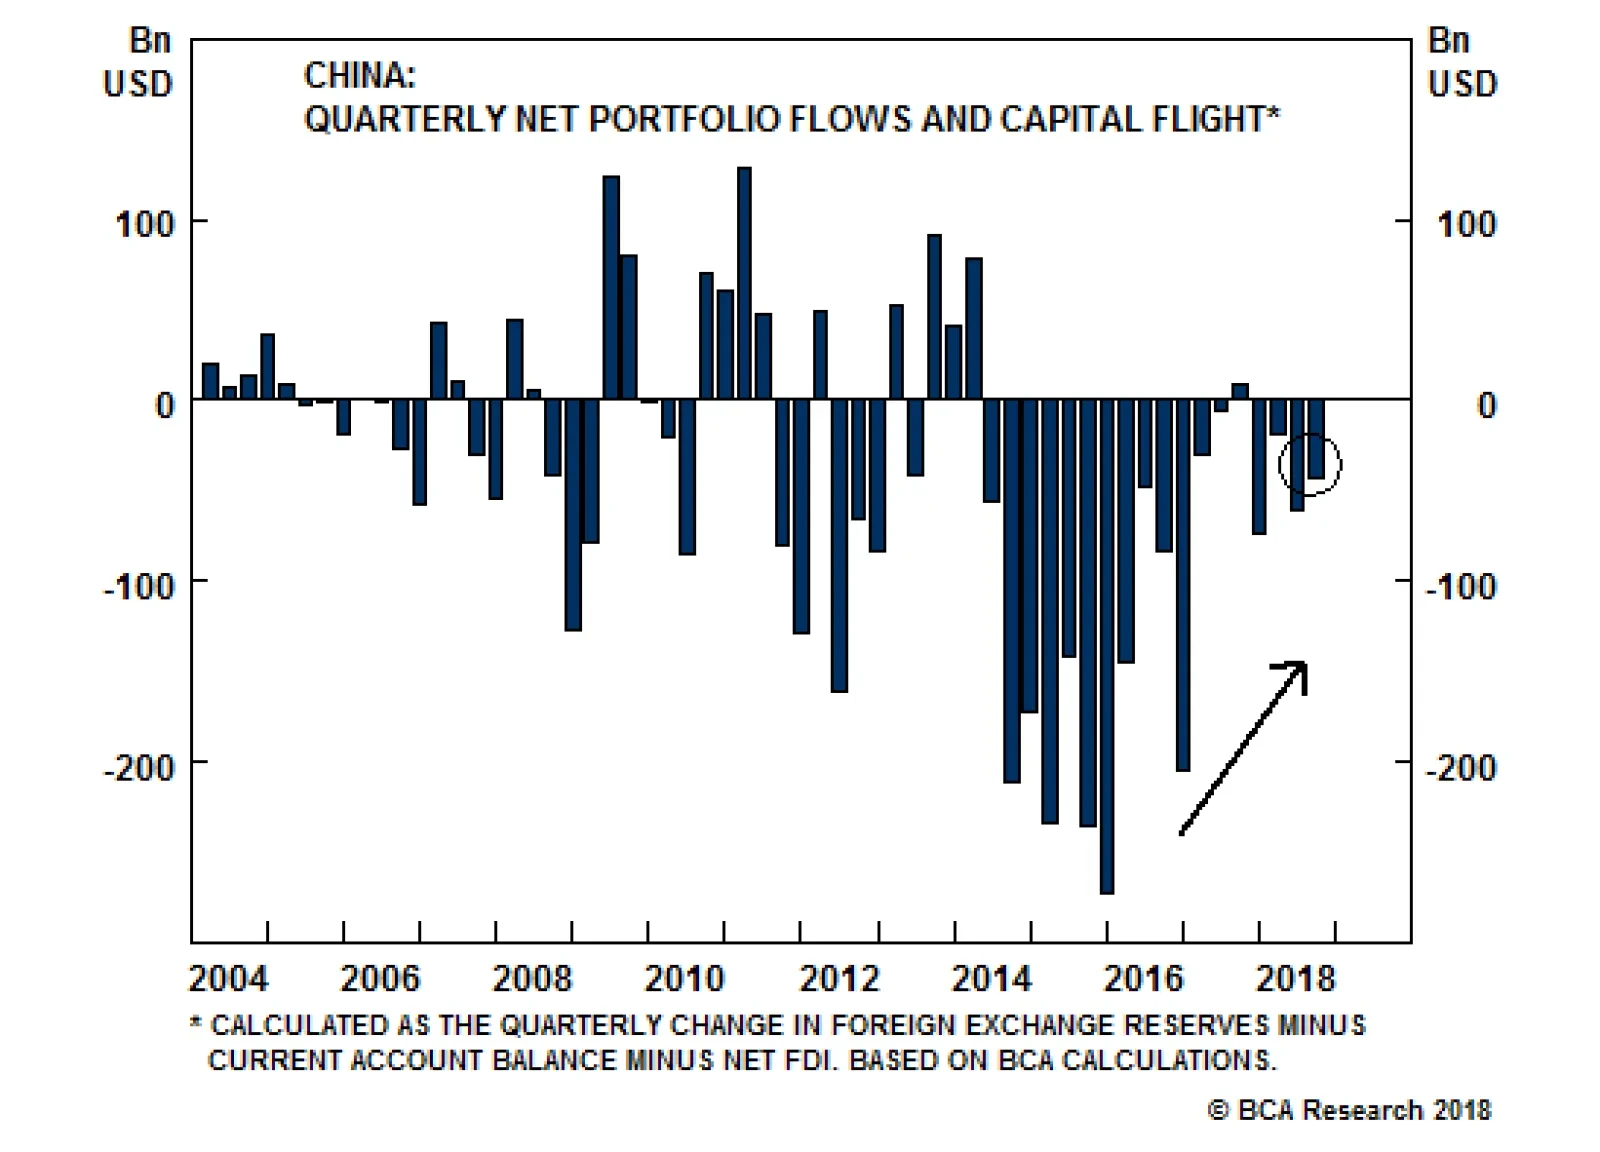
In 2015, a 4.7 percent depreciation precipitated a US$483 billion outflow of Chinese FX reserves. Conversely, the RMB has declined by about 10% in 2018 without any meaningful capital outflows or FX reserve deployment (see chart). To be fair, forex reserves…
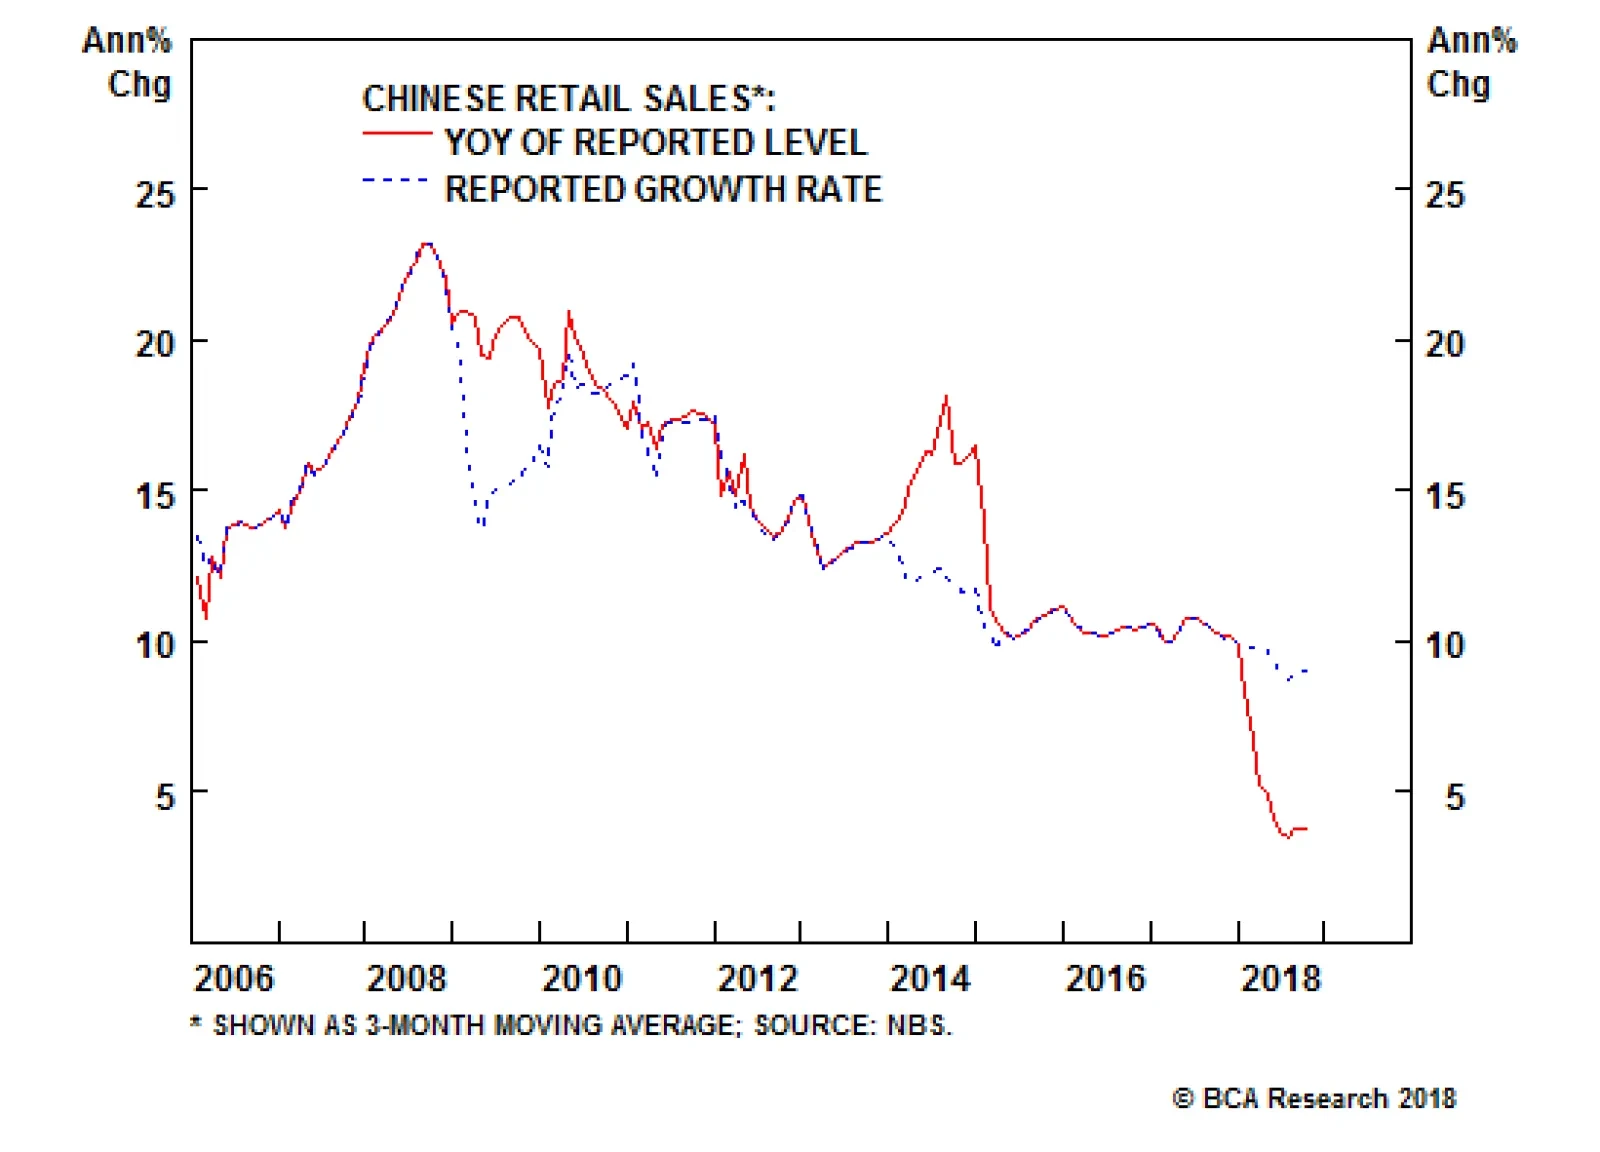
Highlights Chinese pro-consumption policy stimulus will likely stabilize Chinese household consumption growth at 8-10% over the next 12-15 months, with service consumption continuing to be the key driver. Our research shows that Chinese nominal retail sales of consumer goods are currently growing at only 3-4%, significantly lower than the 9-10% pace that the Chinese government has reported, and that the market has commonly quoted. We expect it to rebound moderately to 4-6% in 2019 on the government's pro-consumption stimulus. The services sector including healthcare, education, travel, entertainment, sports, high-tech, daycare for kids, nursing homes for the elderly, and so on will likely experience strong growth. In the consumer discretionary space, car sales will also likely rebound as the country may soon release stimulus measures supporting the auto industry. For now, we advise overweighting consumer discretionary stocks versus the benchmark. We also recommend going long consumer discretionary versus consumer staples. Feature The Chinese economy is in transition from investment- and export-led growth to consumer-led growth. With faltering investment growth and escalating China-U.S. trade tensions, the strength and durability of Chinese household consumption has become all the more important to the country's economic growth. To address increasing challenges facing the economy, the government over the past several months has released a slew of policies aimed at stimulating domestic consumption. Our focus in this week's report is to outline these policies and in turn gauge what the strength of Chinese household consumption will be over the next 12-15 months. In order to do this, some key questions need to be addressed, including: What is the current growth rate of household consumption? What pro-consumption policies have already been implemented, and what additional policies are likely on the way? How effective will stimulus be on Chinese household consumption this time around? One of our key findings is that Chinese nominal retail sales of consumer goods - a common proxy for Chinese household spending - is currently growing at only 3-4%, significantly lower than the 9-10% pace the Chinese government has reported, and that the market has commonly quoted (Chart 1). Chart Retail Sales Growth Measure: Which One Is Accurate?
Retail Sales Growth Measure: Which One Is Accurate?
Retail Sales Growth Measure: Which One Is Accurate?
Another important finding is that recent pro-consumption policy stimulus will likely increase household income levels by 400-500 billion RMB. In addition, we expect more pro-consumption policies from the Chinese government later this year or early 2019 - i.e., cutting car sales taxes or giving out subsidies to encourage households' purchases of automobiles, especially in rural areas, and/or lowering the policy rate to spur spending by reducing households' borrowing costs. This will stabilize Chinese household consumption growth at 8-10% over the next 12-15 months, with service consumption continuing to be the key driver. Making Sense Of The Data According to the National Bureau of Statistics (NBS) data, Chinese nominal household consumption accounted for about 40% of GDP last year, and grew 8.2% year-on-year (about 9-10% in 2015 and 2016). We estimate that currently about 65-70% of Chinese household consumption is consumer goods, with the remainder going to services. Goods consumption Chinese retail sales figures are probably the most-often-used among market participants as a proxy for Chinese household consumption, despite the fact that the data only provide a partial picture of Chinese household spending: spending on consumer goods. Based on the NBS's definition, Chinese total retail sales of consumer goods refer to the sum of retail sales of commodities sold to urban and rural households for household consumption, and to social institutions for public consumption for non-production purposes. Chinese total retail sales also include online goods sales but do not include online service sales. They also do not include many service sectors including education, medical care, travel, entertainment, eldercare and childcare. In short, while Chinese retail sales cannot represent the full picture of Chinese household consumption, they can indeed reveal the strength of Chinese household consumption on consumer goods. The most quoted retail sales growth data by the majority of market participants is from the NBS - a straight growth number that the bureau reported every month - which recently decelerated to 9% (the dotted line in Chart 1). The bureau does not give out information about how to calculate this growth data. The NBS also reports the level data of retail sales every month, from which the year-on-year growth actually plunged to 3.8% (the solid line in Chart 1). Which one is more accurate? All of the findings below suggest the validity of the growth estimates we calculated from the level of NBS retail sales. For major consuming discretionary goods like cars, washing machines, air conditioners, refrigerators and TVs, all products excluding TVs exhibited a sharp drop in sales volume growth this year (Chart 2). Chart 2Falling Sales Volume Nearly Across The Board From Discretionary Goods...
Falling Sales Volume Nearly Across The Board From Discretionary Goods...
Falling Sales Volume Nearly Across The Board From Discretionary Goods...
Some major consumer staples such as dairy products, soft drinks and liquor - also experienced a sharp decline in sales-volume terms (Chart 3). Chart 3...To Major Consumer Staples
...To Major Consumer Staples
...To Major Consumer Staples
The sub-categories of total nominal retail sales in value terms also showed a significant slowdown in terms of urban and rural, and in terms of commodity goods and catering (Chart 4). Chart 4Weakness In Retail Sales From Urban To Rural
Weakness In Retail Sales From Urban To Rural
Weakness In Retail Sales From Urban To Rural
Meanwhile, 26 out of 31 provinces experienced retail sales growth slower than 6% for the first six months, with three provinces - Shandong, Jilin and Guizhou - in contraction. Why did Chinese retail sales experience such a significant drop this year? We believe it is because households' sentiment and willingness to consume has diminished considerably (Chart 5). Chart 5Falling Marginal Propensity To Consume
Falling Marginal Propensity To Consume
Falling Marginal Propensity To Consume
The cracking down of peer-to-peer lending, falling stock prices and high mortgage payments this year have all reduced household wealth. Mortgage interest payments currently account for nearly 50% of the nation's household disposable income, higher than 45% a year ago.1 In addition, rising China-U.S. trade tensions have also increased uncertainty on future income growth and affected confidence. Service consumption If our estimate of Chinese retail sales growth can correctly capture the strength of consumer goods consumption, what data can be used to measure services consumption. Chart 6 can at least provide some sense in gauging the strength of household service consumption, as tourism, medical services and entertainment services (i.e., movie box office receipts) are all major household service consumption components. In the meantime, online services sales can also somewhat reflect the overall strength of Chinese household services consumption. Chart 6Services Consumption Still Growing At A Double Digit Pace
Services Consumption Still Growing At A Double Digit Pace
Services Consumption Still Growing At A Double Digit Pace
Chart 6 clearly shows that despite the growth deceleration, nominal services consumption growth is currently still quite strong - in the range of 10-15% - considerably higher than the 3-4% growth in nominal consumer goods consumption. To gauge how Chinese nominal household consumption growth will be going forward, we need to assess the pro-consumption policies that have already been implemented. Consumption Stimulus A flurry of pro-consumption policies has been announced over the past several months, aiming at spurring consumer spending to support the country's underlying economic growth. Personal tax cuts and tax exemptions will increase households' ability to spend, while improvements in the quality of goods and services supplied and more availability of high-quality products will also encourage consumption. On October 21, China unveiled a new income tax law to boost consumption. The law increases the tax-free threshold from 3,000 RMB per month to 5,000 RMB per month and expands the lower tax brackets, effective October 1, 2018. It also adds new itemized tax deductions related to education, housing, eldercare, childcare and medical care, which will come into effect on January 1, 2019. Additional details of the new itemized deductions have so far not been released. The Ministry of Finance estimates that the tax changes will collectively lift household incomes by approximately 320 billion RMB. This is equivalent to about 1% of household consumption expenditures, or about 0.4% of GDP. Given that the total amount of personal income tax was 1.2 trillion RMB last year, the total tax deduction from the new income law and new itemized tax deductions should be much smaller than the amount of total personal income tax. Assuming 40-50% of the 1.2 trillion RMB personal tax will be deducted in 2019, this will be equal to about 500-600 billion RMB in household incomes (1.6-1.9% of household consumption expenditures, and about 0.6-0.7% of GDP). On September 20, the government released a policy guideline: "New measures to spur residential consumption." Two weeks later, on October 11, the government announced a "three-year (2018-2020) action plan to stimulate domestic consumption." The government's plan is geared to facilitating a virtuous cycle in which boosting consumption leads to supply innovation, and subsequently improvement in new consumption growth. According to the plan, the authority will widen the openness of seven key service sectors for private and / or overseas companies to enter in sectors such as tourism, culture, sports, healthcare, eldercare, home services and education/training. The country aims to develop rental markets, promote new-energy automobiles, support high-tech products (VR, robots, etc.), encourage green consumption and upgrade the quality of existing goods and services. Insufficient high-quality supply in these service sectors have in the past curbed consumption growth to some extent. By boosting the supply of high-quality services, the government expects to increase consumption in these sectors. Starting on July 1, China reduced import tariffs on 1449 imported items, resulting in a decline in average import tariffs from 15.7% to 6.9%. Starting on November 1, the government further lowered tariffs with most-favored nations on an additional 1585 items with the average tax rate falling from 10.5% to 7.8%. Clearly, there are two trends from these policies. First, the services sector including healthcare, education, travel, entertainment, sports, high-tech, childcare, eldercare, and so on will benefit most, as households in general have high demand for these services and are willing to spend more on these sectors (Chart 7). Chart 7Service Consumption Vs. Consumer Staples Consumption: Higher Growth
Chinese Household Consumption: Full Steam Ahead?
Chinese Household Consumption: Full Steam Ahead?
For example, while China's aging population will have increasing demands for medical and eldercare service, the termination of the one-child policy will continue to boost demand for childcare and education services. Food and clothing accounts for about 35% of total Chinese household consumption expenditures (Chart 8), significantly higher than the 21% proportion in South Korea. Meanwhile, Chinese consumers spend 11% of their disposable income on education, culture and recreation, lower than the 17% figure in South Korea. Chart 8Chinese Household Consumption Structure
Chinese Household Consumption: Full Steam Ahead?
Chinese Household Consumption: Full Steam Ahead?
Second, the supply of high-quality consumer goods and high-quality services will strongly increase in response to rising demand of wealthier Chinese consumers. This increase in supply will be met by both domestic production of goods and services and overseas imports. What additional policies could be implemented in the remainder of 2018 and 2019? The government may release more supportive policies to promote car sales - i.e., reducing the sales tax on cars with a capacity of 1.6L or lower, or providing subsidies on car purchases. They have implemented similar stimulus measures since 2008. If recent pro-consumption policies and supportive policies for the auto industry still cannot revive household consumption strongly enough, the authorities may cut the policy rate to spur additional spending. After knowing the probable scale of the pro-consumption stimulus, we can now put everything together to see what Chinese household consumption growth could be in 2019. How Strong Will Household Consumption Be? Structurally, we believe growth in Chinese household consumption is facing strong headwinds, including lower household income growth in real terms (inflation-adjusted) because of slowing productivity growth and rising household debt levels (Chart 9). Chart 9Structural Headwinds For Chinese Household Consumption Growth
Structural Headwinds For Chinese Household Consumption Growth
Structural Headwinds For Chinese Household Consumption Growth
However, over the next 12-15 months, we still expect the government's pro-consumption policies to be able to stabilize domestic household consumption growth at 8-10%. We estimated in the first section that the new income law and itemized tax deduction policy will likely release about 500-600 billion RMB of income available for spending. The ratio of marginal propensity to consume gauges the proportion of one additional unit of disposable income spent on consumption. We estimated that the marginal propensity to consume for Chinese households is currently at about 50%. This will result in 250-300 billion RMB spending on household consumption, equaling about 0.7-0.8% of 2017 Chinese retail sales of consumer goods (36.6 trillion RMB), or 0.8-0.9% of household consumption expenditures. Autos will be another major potential driver of overall household consumption growth. China has stimulated the car industry by slashing the auto sales tax from 10% to 5% in 2009-2010 and again in 2015-2016. As a result, the volume of passenger car sales jumped 50% in 2009 and 15% in 2016, respectively (Chart 10). While car sales have dropped each time the stimulus measures have expired, a temporary growth rebound in auto sales in 2019 is still possible. Chart 10The Government May Stimulate The Auto Market Again
The Government May Stimulate The Auto Market Again
The Government May Stimulate The Auto Market Again
As car sales volumes are currently in double-digit contraction, the Chinese government is likely to implement similar stimulus measures in late 2018 or early 2019. If so, Chinese car sales in volume terms may rebound by 5-10% in 2019. By the end of last year, the measure of urban households with cars was about 37.5 out of 100. There is still plenty of upside, with the rural areas having much bigger potential for car sales than urban areas. The value of Chinese auto sales was 4.2 trillion RMB last year. It increased 280 billion RMB in 2016 and 220 billion in 2017, but decreased 220 billion for the first nine months of this year. Assuming a 5% growth in the auto sales value next year because of the stimulus, it will be about 200 billion RMB increase, equivalent to 0.2% of 2017 GDP or 0.6% of household consumption expenditures. Although households have already taken out much more in the way of consumer loans for purchases of homes and other day-to-day expenses, with plenty of consumption-related stimulus policy in place, consumer loan growth will likely continue to grow in the double digits in 2019 (Chart 11). In September, household loans for short-term consumption (non-mortgage) grew at 28% year-on-year. Chart 11Consumer Loan Growth May Remain Strong In 2019
Consumer Loan Growth May Remain Strong In 2019
Consumer Loan Growth May Remain Strong In 2019
Chart 12 shows that the breakdown of household borrowing - medium- and long-term consumption loans (mostly mortgage loans) accounted for 60% of total household borrowing. Chart 12Most Of Consumption Loans Are Mortgage
Chinese Household Consumption: Full Steam Ahead?
Chinese Household Consumption: Full Steam Ahead?
With the property market now slowing down and a gradual decline in the Chinese central bank's PSL lending,2 property sold has been decelerating (Chart 13). This may lead to less mortgage borrowing, leaving more loans available for short-term spending. Chart 13Household Borrowing In 2019: Less For Mortgage And More For Consumption?
Household Borrowing In 2019: Less For Mortgage And More For Consumption?
Household Borrowing In 2019: Less For Mortgage And More For Consumption?
How different is this round of stimulus versus the previous two episodes? First, the strength of household consumption growth due to recent policy stimuli will be much weaker than the 2009-2010 and 2015-2016 episodes (Chart 14). Chart 14Stimulus Impact On Household Consumption Growth In 2019: Less Than Previous Episodes
Stimulus Impact On Household Consumption Growth In 2019: Less Than Previous Episodes
Stimulus Impact On Household Consumption Growth In 2019: Less Than Previous Episodes
Home appliance markets like TVs, air conditioners, washing machines and refrigerators have already entered a mature phase. On average, as of the end of 2017 there were already 133 TVs, 100.3 air conditioners, 97.1 washing machines and 97.2 refrigerators for every 100 urban households (Chart 15, top panel). Even in rural areas, as of the end of last year there were 120 TVs, 52.6 air conditioners, 86.3 washing machines and 91.7 refrigerators for every 100 households, significantly higher than 2008 levels (Chart 15, bottom panel). Chart 15Home Appliance Markets: More Mature Than The Auto Market
Chinese Household Consumption: Full Steam Ahead?
Chinese Household Consumption: Full Steam Ahead?
Second, this time the stimulus is focusing more on the services sector, while the previous two episodes were more on consumer goods. As result, this time the stimulus will have much less impact on commodities than the previous two episodes, in which major commodity goods sales and production experienced significant growth. Overall, China's pro-consumption policies will likely stabilize Chinese household consumption growth at 8-10% over the next 12-15 months, with services consumption remaining the key driver. We expect household service consumption to continue to grow at 10-15%, and retail sales growth to rebound to 4-6% from 3-4%. Investment Implications Chinese pro-consumption policy will likely benefit services and the automobile industry more than consumer staples. Meanwhile, commodity sectors may not benefit much. For now, we recommend overweighting the domestic consumer discretionary sector versus the Chinese CSI300 benchmark, a trade that we are initiating as of today (Chart 16, top panel). The sector's relative P/E and P/B valuations versus the benchmark also suggest its relative attractiveness (Chart 16, middle and bottom panels). Chart 16Overweight Consumer Discretionary Versus Benchmark
Overweight Consumer Discretionary Versus Benchmark
Overweight Consumer Discretionary Versus Benchmark
China's pro-consumption stimulus also warrants the opposite position of what was one of our most successful trades over the past year (long investable staples / short investable discretionary), which we closed at the end of September for a profit of 48%.3 Within the domestic market, investors should go long consumer discretionary versus consumer staples, a trade that we are also initiating as of today (Chart 17). In addition to the cyclical tailwind from policy, relative valuation ratios suggest that the former is likely to outperform the later. Chart 17Go Long Consumer Discretionary Versus Consumer Staples
Go Long Consumer Discretionary Versus Consumer Staples
Go Long Consumer Discretionary Versus Consumer Staples
Finally, our conclusion that policymakers are likely to succeed at stabilizing household consumption growth has implications beyond the relative performance of consumer stocks. Our outlook for a stable consumer over the coming year supports the argument that China will not push for a significant reacceleration in credit growth as a response to ongoing economic weakness, and argues in favor of our view that the "strike price" of the China put option has fallen. As we have noted in previous reports, we have no doubt that Chinese policymakers will eventually move to a maximum reflationary stance if they feel that the existing slowdown will lead to deep, threatening economic instability. But it will be impossible for investors and policymakers to make a judgement about the true odds of such an outcome without hard evidence of the magnitude of the tariff-induced export shock, which for now remains obscured by trade front-running (which may persist until the new year). This means that it is too soon to bottom fish deeply oversold Chinese financial assets (such as A-shares), and China-related plays more generally. Ellen JingYuan He, Associate Vice President Emerging Markets Strategy EllenJ@bcaresearch.com 1 Pease refer to Table 1 in the China Investment Strategy Special Reports "China's Property Market: Where Will It Go From Here? ", dated September 13, and Table 1 in the Emerging Markets Strategy Special Report "China Real Estate: A Never-Bursting Bubble?", dated April 6, 2018, available at ems.bcaresearch.com. 2 Pease see China Investment Strategy Special Report "China's Property Market: Where Will It Go From Here?", dated September 13, 2018, available at cis.bcaresearch.com. 3 Pease see China Investment Strategy Special Reports "GICS Sector Changes: The Implications For China", dated September 26, 2018, available at cis.bcaresearch.com. Cyclical Investment Stance Equity Sector Recommendations
Highlights So What? The Trump administration is focusing on re-election in 2020, which could push the recession call into 2021. Why? The midterms were investment-relevant, just not in the way most of our clients thought. We are downgrading our alarmism on Iran; Trump is aware of his constraints. But investor optimism regarding the trade war may be overdone. China has contained its capital outflows, which suggests Beijing will be comfortable with more CNY/USD downside. A new GPS mega-theme: Bifurcated Capitalism! Watch carefully for any upcoming trade action on semiconductors. Feature There is no better feeling than hearing from our clients that we got a call wrong because we misjudged the constraints of the Trump administration by focusing too much on its preferences. Why? Because it means that clients are keeping us honest by employing our most important method: constraints over preferences. This is one of the takeaways from a quarter filled with meetings with our clients in the Midwest, Toronto, Amsterdam, Rotterdam, The Hague, Frankfurt, Berlin, Auckland, Melbourne, Sydney, Dubai, Abu Dhabi, and sunny Marbella, Spain! In this report, we discuss several pieces of insight from our clients. Midterms Are Investment Relevant Generally speaking, few of our clients agreed with our assessment that the midterm elections were not investment-relevant. The further away from the U.S. we traveled, the greater the sense among investors that equity markets influence U.S. politics: both the upcoming takeover of the House of Representatives by the Democratic Party and the odds of trade war intensification. We strongly disagree with this assessment. Both periods of equity market turbulence this year were preceded by a rising U.S. 10-year yield, not any particularly damning trade war chatter (Chart 1). In fact, the intensification of the trade war this summer occurred amidst a fairly buoyant S&P 500! Meanwhile, the odds of a Democratic takeover of the House were priced in well before the October equity decline began. Chart 1Yields, Not Trade, Matter For Stocks
Yields, Not Trade, Matter For Stocks
Yields, Not Trade, Matter For Stocks
Generally speaking, even midterms that produce gridlock have led to a relief rally (Chart 2). This time could be the same, especially because the likely next Speaker of the House, Nancy Pelosi, has signalled that the main policy goal for 2019 would be infrastructure spending. In her "victory" speech following the election, Pelosi mentioned infrastructure numerous times (impeachment, zero times). Chart 2Stocks Are Indifferent To Midterm Results
Stocks Are Indifferent To Midterm Results
Stocks Are Indifferent To Midterm Results
Democratic Representative Peter DeFazio, likely head of the House of Representatives committee overseeing transportation, has already signalled that he will ask for "real money, real investment."1 DeFazio has previously proposed a $500bn infrastructure plan, backed by issuance of 30-year Treasuries and raising fuel taxes. He has rejected the February 2017 Trump proposal, which largely relied on raising private money for the job. Would President Trump go with such a plan? Maybe. In early 2018, he stunned lawmakers by saying that he supported hiking the federal gasoline tax by 25 cents a gallon (the federal 18.4 cent-a-gallon gasoline tax has not been hiked since 1993). He has since confirmed that "everything is on the table" to achieve an infrastructure deal. Several clients from around the world pointed out that both Democrats and President Trump have an incentive to make a deal. President Trump wants to avoid the deeply negative fiscal thrust awaiting him in 2020 (Chart 3). Given the House takeover by the Democrats, it is tough to imagine that new tax cuts are the means for Trump to avoid the "stimulus cliff." As such, another round of stimulative fiscal spending may be the only way for him to avoid a late-2020 recession (although the latter is currently the BCA House View). Chart 3Can Trump And Pelosi Reverse...
Can Trump And Pelosi Reverse...
Can Trump And Pelosi Reverse...
Democrats, on the other hand, have an incentive to ditch "Resistance" and embrace policy-making. Yes, hastening the recession in 2020 would be the Machiavellian play, but President Trump would be able to blame Democrats for the downturn - since they will necessarily have had to participate in planning an infrastructure bill only to sink it. They also learned the lesson from the January 2018 government shutdown, which backfired at the polls and forced Senate Democrats to come to an agreement quickly on a two-year stimulative budget deal. What about the GOP fiscal conservatives? They don't necessarily need to come on board. The House is held by Democrats. And the Democrats in the Senate would only need 15-18 GOP Senators to support a profligate infrastructure plan. Given that infrastructure is popular, that the president will be pushing it, and that the GOP-controlled Senate agreed with the budget bill in January, we think that even more Republican Senators can go along with an infrastructure plan. Another big takeaway from the midterms is that the GOP suffered deep losses in the Midwest. President Trump's party lost ten out of twelve races in the region (Table 1). The two most representative contests were the loss of Republican Wisconsin Governor and one-time rising presidential star Scott Walker, and the victory of the left-wing and über-protectionist Democratic Senator Sherrod Brown of Ohio. Table 1Massive Republican Losses Across The Midwest
Insights From The Road - Constraints And Investing
Insights From The Road - Constraints And Investing
Senator Brown won his contest comfortably by 6.4% in a state that Trump carried by 8.13%. The appeal of Brown to the very blue-collar voters that Trump himself won is obvious. On trade, there is no daylight between the left-wing Brown and President Trump. Meanwhile, Walker, an establishment Republican who built his reputation on busting public-sector unions, could not replicate Trump's success in Wisconsin. Several of our clients suggested that the GOP performance in the Midwest was poor because of the aggressive trade rhetoric. But that makes little sense. Republicans did not run Trump-style populists in the Midwest, to their obvious detriment. Democrats have always claimed to be for "fair trade" rather than "free trade." And we know, empirically, that Trump saw a key swing of turnout in 2016 in these states, largely thanks to his protectionist rhetoric (Chart 4). Chart 4Trump Owes The Midwest The Presidency
Trump Owes The Midwest The Presidency
Trump Owes The Midwest The Presidency
President Trump cannot take Michigan, Pennsylvania, and Wisconsin lightly. His performance in 2016 was extraordinary, but also tight. The Democrats will win these states if Trump does not grow voter turnout and support, according to demographic projections - and they lost them by less than a percentage point of white voters (Map 1). As such, we think that Democrats will talk tough on trade and try to reclaim their union and blue-collar voters, while President Trump has to double down on an aggressive trade posture towards China. Map 1Can 'White Hype' Work In 2020? Trump's Margins Are Small
Insights From The Road - Constraints And Investing
Insights From The Road - Constraints And Investing
The midterms are investment relevant after all, but not in the way some might think. The Democratic takeover of the House, and the resultant gridlock, will potentially avert the "stimulus cliff" in 2020. This ought to support short-term inflation expectations and thus allow the Fed to stay-the-course. For markets, this could be unsettling given the correlation between yields and downturns in 2018. For the dollar, this should be supportive. The odds of an infrastructure deal are good, above 50%, with the key risk being a Democratic House focused on impeaching Trump. Such a bill would augur even higher levels of fiscal spending through 2020, possibly prolonging the business cycle, and setting up an even wider budget deficit when the next recession hits (Chart 5). Chart 5Pro-Cyclical Policy Has To Continue
Pro-Cyclical Policy Has To Continue
Pro-Cyclical Policy Has To Continue
Meanwhile, the shellacking in the Midwest ought to embolden the president to go even harder against China on trade. Rather than the upcoming Xi-Trump meeting in Buenos Aires, the key bellwether of this thesis is whether Trump signals afterwards that he will implement the tariff rate hike on January 1, 2019 (and whether he announces a third round of tariffs). Bottom Line: Go long building products and construction material stocks. Stay short China-exposed S&P 500 companies. The 10-year yield may end the year even closer to 3.5% when the market realizes that the odds of an infrastructure deal are higher than previously thought. The political path of least resistance in the U.S. continues to point towards greater profligacy. Trump Is Aware Of His Constraints In The Middle East Throughout 2018, we have flagged U.S.-Iran tensions as the risk for 2019. In early October, we went long Brent / short S&P 500 as a hedge against this risk, a trade that we closed for a 6% gain last week. During our meetings with clients this quarter, however, several astute observers pointed out that in our own analyses we have stressed the geopolitical and political constraints to President Trump. First, we have argued that the original 2015 nuclear deal signed by President Obama had a deep geopolitical logic, allowing the U.S. to pivot to Asia and stare down China by geopolitically deleveraging the U.S. from the Middle East. If President Trump undermined the détente with Iran, he would be opening up a two-front conflict with both China and Iran, diluting his administration's focus and capabilities. Second, we noted that a rise in oil prices could precipitate an early recession and push up gasoline prices in 2019, a probable death knell for any president's re-election prospects. Our clients were right to ask: Why would President Trump face down these constraints, given the high cost that he would incur? We did not have a very good answer to this question. It is difficult to understand President Trump's preferences for raising tensions against Iran beyond the fact that he promised to do so in his campaign, appears to want to undermine all of President Obama's policies, and turned to Iran hawks to head his foreign policy. Are these preferences worth the risk of a recession in 2019? Or worth the risk of triggering yet another military conflict in the Middle East over a country that only 7% of Americans consider is the 'greatest enemy' (Chart 6)? Chart 6Americans Don't Perceive Iran As 'The Greatest Enemy'
Insights From The Road - Constraints And Investing
Insights From The Road - Constraints And Investing
Given that the administration has offered exemptions to the oil embargo to eight key importers, it now appears that President Trump is well aware of his geopolitical and domestic constraints. The combined imports of Iranian oil by these eight states is ~1.4mm b/d. While we do not have the detail of the volumes that will be allowed under the waivers, it is likely that these Iranian sales will recover some of the ~1mm b/d of exports lost already (Chart 7). Chart 7Waivers Will Restore Iranian Exports For 180 Days
Insights From The Road - Constraints And Investing
Insights From The Road - Constraints And Investing
What does this mean for investors? On one hand, it means that the risk of oil prices spiking north of $100 per barrel have substantively decreased. On the other hand, however, it also means that the Trump administration agrees with BCA's Commodity & Energy Strategy view that oil markets remain tight and that OPEC 2.0's spare capacity may be a constraint to future production increases. Bottom Line: The risks of an oil-price-shock-induced 2019 recession have fallen. However, oil prices may yet surge in 2019 to the $85-95 level (Brent) on the back of supply risks in Venezuela and Iran, especially if Saudi Arabia and Russia prove unable to expand production much beyond their current levels. Most of our clients in the Middle East shared the skepticism of our commodity strategists that Saudi Arabia would be able to increase production much higher than current levels in 2019. However, the view was not unanimous. Risks Of Saudi Arabia Going Rogue Have Declined Clients in the Middle East were convinced that the murder of journalist Jamal Khashoggi would have no impact on Saudi oil production decisions. However, the insight from the region is that the incident has probably ended the "blank cheque" that the Trump administration initially gave Riyadh on foreign policy. For global investors, this may not have a major impact. But it may have been at least part of the administration's reasoning behind giving embargo exemptions to such a large number of economies. The incident has likely forced Saudi Arabia to adjust its calculus on three issues: Qatar: The Saudi-Qatari split never made much sense in the first place. It was initially endorsed by President Trump, who may not have understood the strategic value of Qatar to the United States. Defense Secretary James Mattis almost immediately responded by reaffirming the U.S. commitment to the Persian Gulf country which hosts one of the most strategic U.S. air bases in the world. Yemen: The U.S. has now openly called on Saudi Arabia to end its military operations in Yemen. We would expect Riyadh to acquiesce to the request. Iran: With the U.S. giving major importers of Iranian oil exemptions, the message is twofold. First, the U.S. cares about its domestic economic stability. Second, the U.S. does not care about Saudi domestic economic stability. Our commodity strategists believe that Saudi fiscal breakeven oil price is around $85. As such, the U.S. decision to slow-roll the sanctions against Iran will be received with chagrin in Riyadh, especially as the latter will now have to shoulder both lower oil prices and the American request for higher output. Could Saudi Arabia break with the U.S.? Not a chance. The U.S. is the Saudis' security guarantor. As such, it is up to Saudi Arabia to acquiesce to American foreign policy goals, not the other way around. While we think that President Trump ultimately succumbed to geopolitical and political constraints when he decided to take the "phoney war" approach to Iran, he may have been nudged in that direction by Khashoggi's tragic murder. Bottom Line: A major risk for investors in 2019 was that the Trump administration would treat Saudi preferences for a major confrontation with Iran as its own interests. Such a strategy would have destabilized the global oil markets and potentially have unwound the 2015 U.S.-Iran détente that has allowed the U.S. to focus on China. However, the death of Khashoggi has marginally hurt President Trump domestically - given that it makes him look soft on Saudi Arabia, an unpopular stance in the U.S. Moreover, the administration has come to grips with the risks of a dire oil shock should Iran retaliate. The shift in U.S. policy vis-à-vis Saudi Arabia will therefore refocus the Trump administration on its own priorities, not that of its ally in the Middle East. Trade War Is All About CNY/USD In The Short Term... Clients in Australia and New Zealand are the most sophisticated Western investors when it comes to China. The level of macro understanding of the Chinese economy and the markets in these two countries is unparalleled (outside of China itself, of course). We therefore always appreciate the insights we pick up from our clients Down Under. And they are convinced that the massive capital outflow from China has clearly ceased. The flow of Chinese capital into Auckland, Melbourne, and Sydney real estate has definitely slowed, and anecdotal evidence appears to be showing up in the price data (Chart 8). Separately, this intel has been confirmed by clients from British Columbia and California. Chart 8Pacific Rim Home Prices Rolling Over
Pacific Rim Home Prices Rolling Over
Pacific Rim Home Prices Rolling Over
The reality is that China has successfully closed its capital account. How else can we explain that a 4.7% CNY/USD depreciation in 2015 precipitated a $483 billion outflow of forex reserves, whereas a 10.1% depreciation this year has not had a major impact (Chart 9)? Chart 9On Balance, China Is Experiencing Modest Outflows
Insights From The Road - Constraints And Investing
Insights From The Road - Constraints And Investing
To be fair, forex reserves declined by $34bn in October, but that is still a far cry from the panic in 2015. Our other indicators suggest that the impact on capital seepage is muted this time around, largely due to the official crackdown on various forms of capital outflows: Quarterly data (Chart 10) reflecting the change in foreign exchange reserves minus the sum of the current account balance and FDI, indicate that while net inflows have remained negative, they are still a far cry from 2015 levels. Chart 10Far Cry From 2016 Crisis
Far Cry From 2016 Crisis
Far Cry From 2016 Crisis
Import data (Chart 11) no longer show the massive deviation between Chinese national statistics and IMF figures. Imports from Hong Kong (Chart 12), specifically, are now down to normal levels, with the fake invoicing problem having quieted down for now. Chart 11No More Confusion Regarding Imports
No More Confusion Regarding Imports
No More Confusion Regarding Imports
Chart 12Fake Invoicing Has Been Curbed
Fake Invoicing Has Been Curbed
Fake Invoicing Has Been Curbed
Growth rate of foreign reserves (Chart 13) is not clearly contracting yet, and has been positive this year. Chart 13Severe FX Reserve Drawdown Has Ended
Severe FX Reserve Drawdown Has Ended
Severe FX Reserve Drawdown Has Ended
Chinese foreign borrowing (Chart 14) is down from stratospheric levels, which limits the volume of potential outflows. Chart 14China's Foreign Lending Has Eased
China's Foreign Lending Has Eased
China's Foreign Lending Has Eased
And the orgy of M&A and investment deals in the U.S. (Chart 15) has ended. Chart 15M&A Deals Have Eased
Insights From The Road - Constraints And Investing
Insights From The Road - Constraints And Investing
Bottom Line: Anecdotal and official data suggest that capital outflows are in check despite their recent uptick. This could embolden Chinese leaders to continue using CNY/USD depreciation as their primary weapon against President Trump's tariffs, especially if the global backdrop is not collapsing. An increase of the 10% tariff rate to 25% on January 1 could, therefore, precipitate further weakness in the CNY/USD. The announcement of a third round of tariffs covering the remainder of Chinese imports could do the same. This would be negative for global risk assets, particularly EM equities and currencies. ... In the Long Term, Bifurcated Capitalism Our annual pilgrimage to Oceania included our traditional meeting with The Smartest Man In Oceania The Bloke From Down Under.2 He shares our belief that the long-term result of the broader Sino-American geopolitical conflict will be a form of Bifurcated Capitalism. His exact words were that "countries may soon have to choose between being in the Amazon or Alibaba camp," a great real-world implication of our mega-theme. Australian and New Zealand clients are particularly sensitive to the idea that the world may soon be split into spheres of influence because both countries are so high-beta to China, while obviously retaining their membership card in the West. Our suspicion is that both will be fine as they export mainly a high-grade and diversified range of commodities to China. Short of war, it is unlikely that the U.S. will one day demand that New Zealand stop its dairy exports to China, or that Australia stop iron ore and LNG exports. Countries exporting semiconductors to China, on the other hand, could face a choice between enforcing a future embargo or incurring the wrath of their closest military ally. The Bloke From Down Under has pointed out that, given China's dependency on semiconductor technology, a U.S. embargo of this critical tech could be comparable to the U.S. oil embargo against Japan that precipitated the latter's attack on Pearl Harbor. Chart 16China Accounts For 60% Of Global Semiconductor Demand
Insights From The Road - Constraints And Investing
Insights From The Road - Constraints And Investing
The global semiconductor market reached $354 billion in 2016, with China accounting for 60% of total consumption (Chart 16). Despite the country's insatiable appetite for semiconductors, no Chinese firm is among the world's top 20 makers. This is why Beijing's "Made in China 2025" plan has focused so much on semiconductor capability (Chart 17). The goal is for China to become self-sufficient in semiconductors, gaining 35% share of the global design market. Chart 17China's High-Tech Protectionism
Insights From The Road - Constraints And Investing
Insights From The Road - Constraints And Investing
A key feature of Bifurcated Capitalism will be impairment of investment in high-tech that has dual-use applications in military. Semiconductors obviously make that list. Another key feature would be investment restrictions in such high-tech sectors, particularly the kind of investments and M&A deals that China has been looking for in the U.S. this decade. Further, clients in California are very concerned about the U.S.'s proposed export controls, which would cut off access to China and wreak havoc on the industry. The Trump administration has already signalled that it will restrict Chinese inbound investment. Congress passed, with a large bipartisan majority, an expanded review system, the Foreign Investment Risk Review Modernization Act (FIRRMA). The law has expanded the purview of the Committee on Foreign Investment in the United States (CFIUS), a secretive interagency panel nominally under control of the Treasury Department that can block inbound investment on national security grounds. CFIUS, at its core, has always been an entity focused on China. While the Treasury Department initially signalled it would take as much as 18 months to adopt the new FIRRMA rules, Secretary Mnuchin has accelerated the process. The procedure now will expand review from only large-stake takeovers to joint ventures and smaller investments by foreigners, particularly in technology deemed critical for national security reasons. This oversight began on November 10 and will allow CFIUS to block foreigners from taking a stake in a business making sensitive technology even if it gives the foreign investors merely a board seat. Countries of "special concern" will inherently receive heightened scrutiny, and a country's history of compliance with U.S. law, as well as cybersecurity and American citizens' privacy, will be considerations. A new interagency process led by the Commerce Department will focus on refurbishing export controls so as to protect "emerging and foundational technologies." Such impediments to capital flows are likely to become endemic and expand beyond the U.S. We may be seeing the first steps in the Bifurcated Capitalism concept that one day comes to dominate the global economy. Entire countries and sectors may become off-limits to Western investors and vice-versa for Chinese market participants. At the very least, companies whose revenue growth is currently slated to come from expansion in overseas markets may see those expectations falter. At its most pessimistic, however, Bifurcated Capitalism may precipitate geopolitical conflict if it denies China or the U.S. critical technology or commodities. Marko Papic, Senior Vice President Chief Geopolitical Strategist marko@bcaresearch.com 1 Please see David Shepardson, "Democrats to push for big infrastructure bill with 'real money' in 2019," Reuters, dated November 7, 2018, available at reuters.com. 2 At the time of publication, the said investor was unable to secure the permission of his wife for the "The Smartest Man" moniker. Geopolitical Calendar
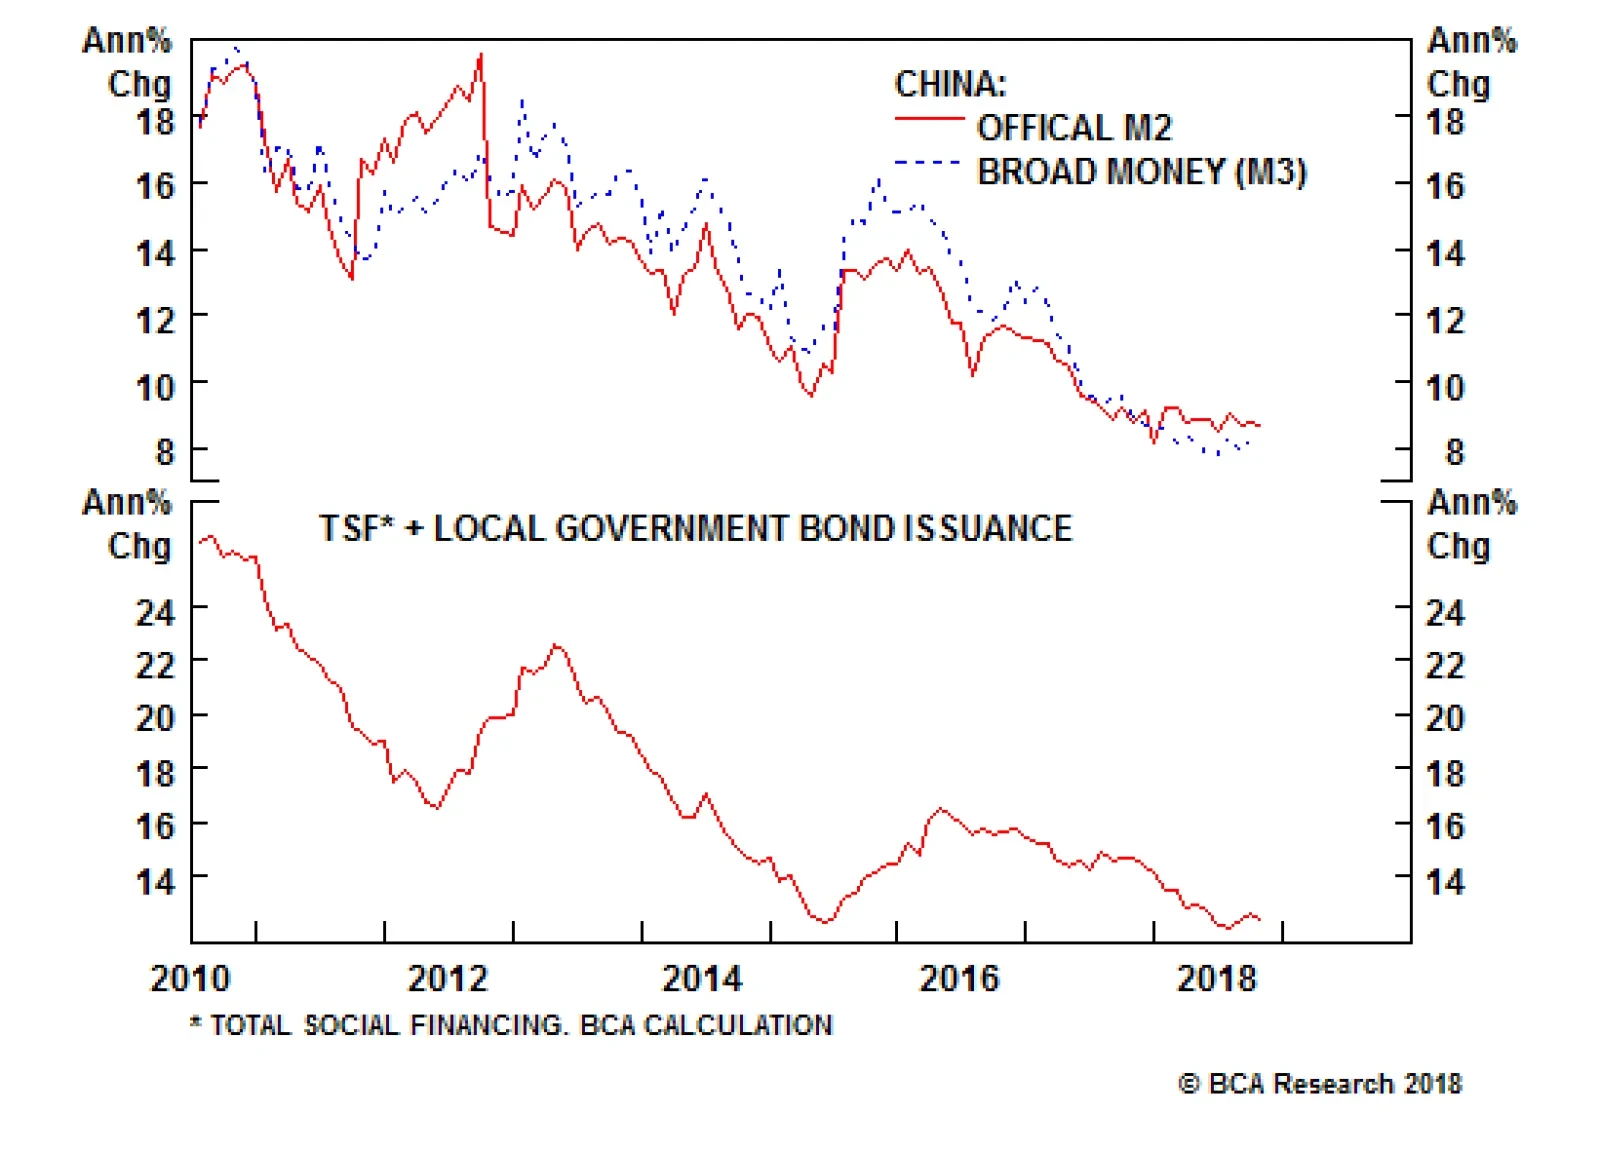
China’s credit data has climbed the ranks of the most important data to monitor for global investors. Chinese credit is a critical input in Chinese growth forecasts. More important, China is the primary driver of global growth, and the latter is an important…
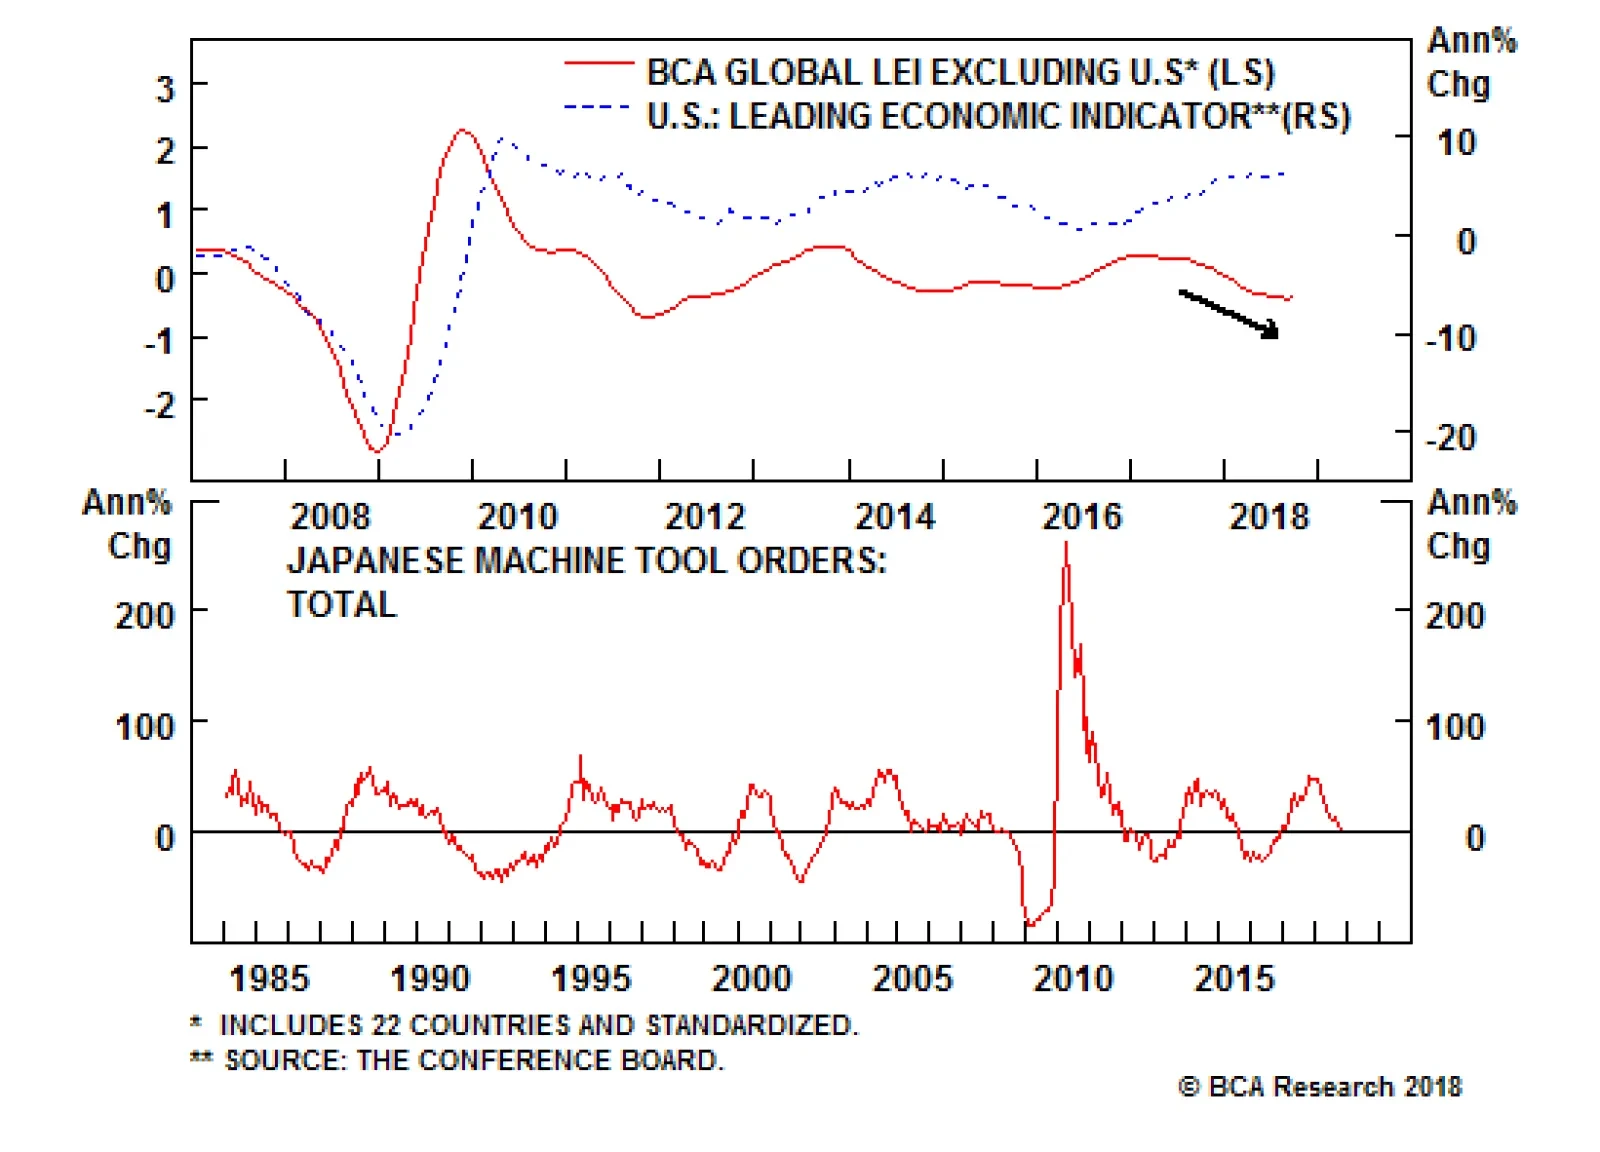
After many hotels and flights, and deep interaction with clients on the current global outlook, it was clear that investors are much more aware of the “U.S. versus China” narrative and the downward potential in China. The slowdown in the Chinese economy and…