China
After many hotels and flights, and deep interaction with clients on the current global outlook, it was clear that investors are much more aware of the “U.S. versus China” narrative and the downward potential in China. The slowdown in the Chinese economy and…

As is tradition, during client visits in Europe last week, I had the pleasure of reconnecting with Ms. Mea, a long-term BCA client.1 It was our third encounter and, as always, Ms. Mea was eager to delve into our reasoning, challenge our views and strategy, as well as gauge our conviction level. We devote this week's report to key parts of our dialogue. I hope clients find it insightful and beneficial. Ms. Mea: Isn't the EM selloff and underperformance already overextended? I am afraid you will overstay your negative view on EM risk assets as happened in 2016. What are you watching to ensure you alter your stance as and when appropriate? Answer: I am very cognizant of not overstaying my negative stance on EM. I viewed the EM/China rally from their 2016 lows as a mid-cycle outperformance in a structural downtrend.2 Consequently, I argued the rally was not sustainable and that it was a matter of time before EMs and China-plays entered into a new bear market. Barring perfect timing, it was difficult to make money during that rally. Investors who averaged in EM stocks and local bonds over the past three years (including late 2015/early 2016 lows) and did not sell early this year have not made money. The current down-leg in EM financial markets may be the last phase of the bear market/underperformance that began in 2011, and it will eventually create a major buying opportunity. That said, this bear market will likely last much longer and be larger in magnitude than many investors expect. In the recent report titled EMs Are In A Bear Market, I elaborated on why this is a bear market and not just a correction. We also discussed how much further it might go.3 Big-picture macro themes - such as China/EM credit excesses and misallocation of capital - have informed my core views in recent years. Notwithstanding, I am watching various market signals that often lead economic data and are typically early in signaling a reversal in financial markets. Just a few examples of market signals and indicators I am following closely: Turns in EM corporate bond yields often coincide with reversals in EM stocks. For now, EM corporate bond yields are rising, and hence they do not signal a bottom in EM share prices (Chart I-1, top panel). Chart I-1EM/Asian Corporate Bonds Signal Downside Risks To Share Prices
EM/Asian Corporate Bonds Signal Downside Risks To Share Prices
EM/Asian Corporate Bonds Signal Downside Risks To Share Prices
The same holds true for Emerging Asian markets: surging corporate bond yields are heralding further declines in Asian share prices (Chart I-1, bottom panel). Our Risk-on versus Safe-Haven (RSH) currency ratio positively correlates with EM equity prices. The RSH ratio has recently rebounded but has not broken above its 200-day moving average (Chart I-2). Hence, there is no meaningful buy signal as of yet. Chart I-2Our Market Risk Indicator
bca.ems_wr_2018_11_08_s1_c2
bca.ems_wr_2018_11_08_s1_c2
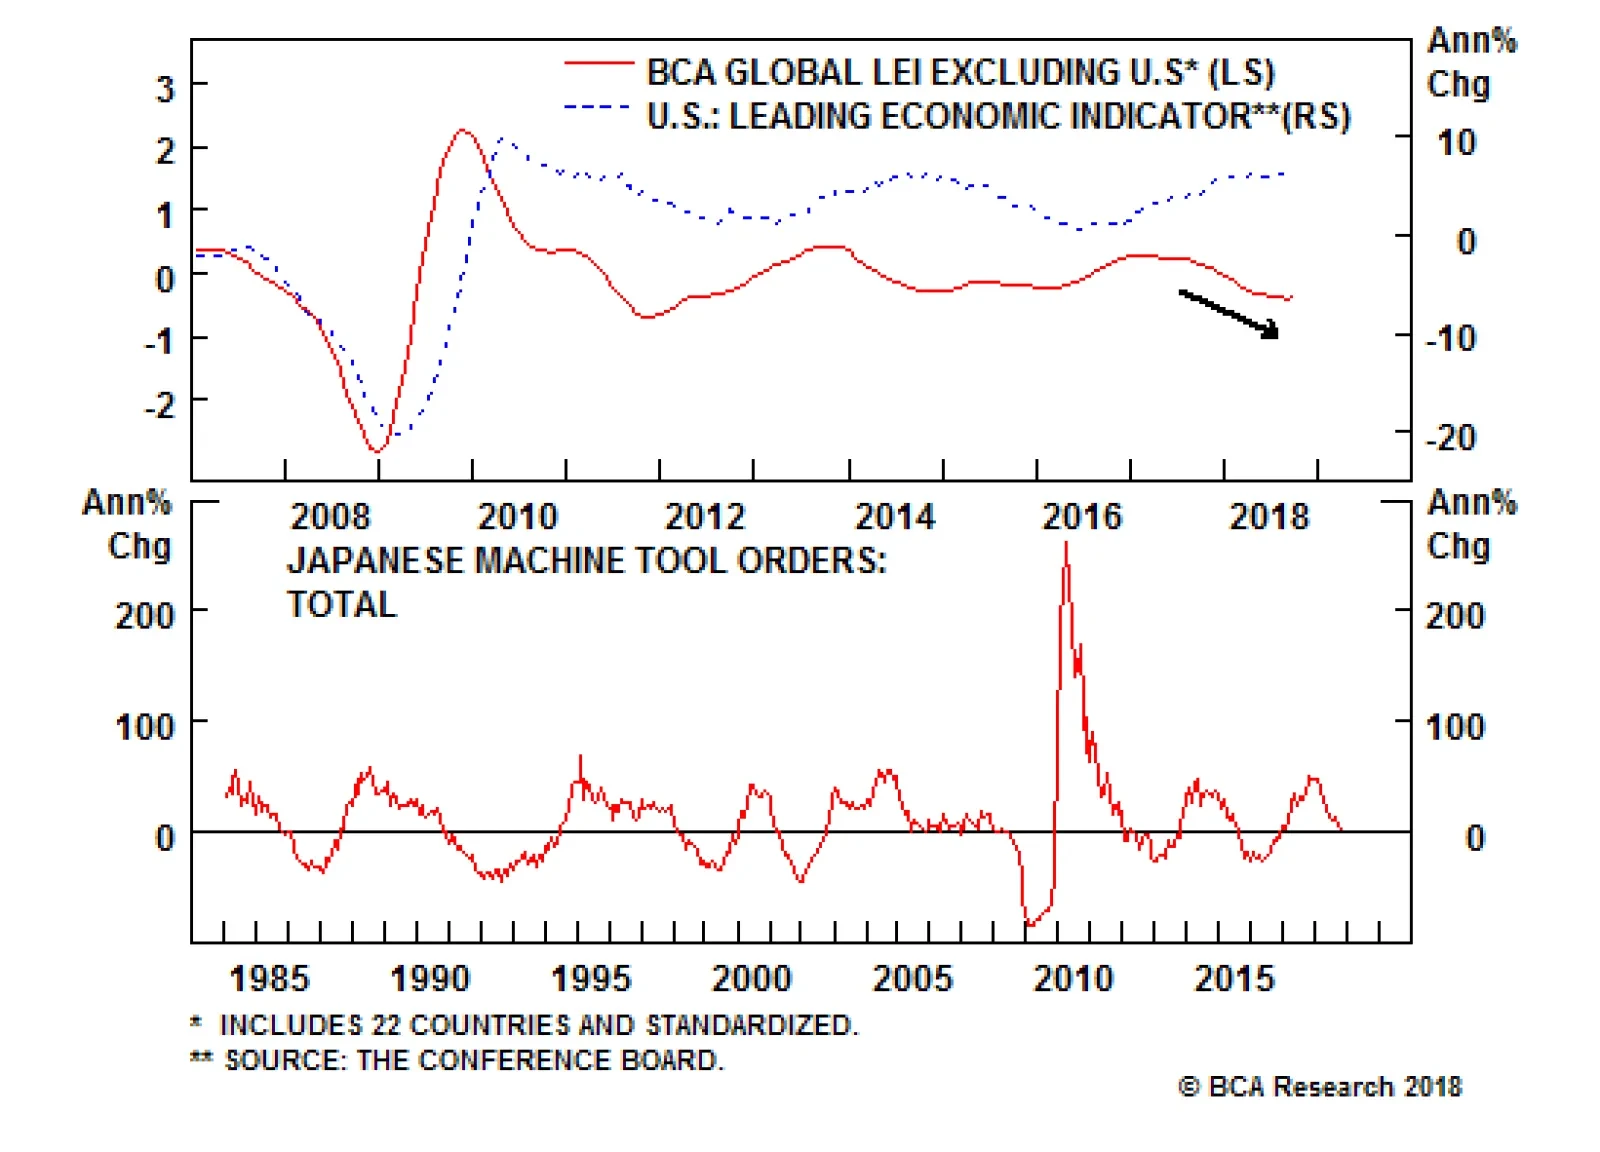
The annual rate of change of this indicator leads the global trade cycles and entails further slowdown in global trade (Chart I-3). Chart I-3Global Trade Slowdown Is Not Over
bca.ems_wr_2018_11_08_s1_c3
bca.ems_wr_2018_11_08_s1_c3
Finally, a number of EM equity indexes - small-caps and an equal-weighted index - have broken below their 3-year moving averages (Chart I-4). This entails that the selloff in EM stocks is very broad-based. It could also entail that the overall EM index will likely break below its 3-year moving average as well (Chart I-4, bottom panel). Chart I-4EM Equity Selloff Has Been Broad-Based
EM Equity Selloff Has Been Broad-Based
EM Equity Selloff Has Been Broad-Based
Apart from market signals, I am also monitoring economic data, and so far, there are few signs of a revival in global trade or EM growth. The EM manufacturing PMI is falling (Chart I-5, top panel). Manufacturing output growth in Asia and Germany are decelerating sharply (Chart I-5, bottom panel). When global trade growth underwhelms, EM risk assets and currencies fare poorly. Chart I-5Global Growth And EM Credit Spreads
Global Growth And EM Credit Spreads
Global Growth And EM Credit Spreads
Remarkably, both panels of Chart I-5 corroborate that the key reason for the EM selloff this year has not been the Federal Reserve tightening but the deceleration in global trade. We do not foresee a reversal in global trade and China/EM growth deceleration in the coming months. This heralds maintaining our negative view on EM risk assets and currencies for now. Ms. Mea: It is true that China is slowing, but policymakers are also stimulating and a lot of bad news may already be priced into China-related markets. Why do you believe there is more downside in China-related markets and EM risk assets from today's levels? Answer: Indeed, China is easing policy, but policy stimulus has so far been limited. It also works with a time lag. First, the bottoms in the money and the combined credit and fiscal spending impulses preceded the trough in EM and commodities by 6 months at the bottom in 2015 and by about 15 months at the top in 2017 (Chart I-6). Even if the money as well as credit and fiscal impulses bottom today it could take several more months before the selloff in EM financial markets and commodities prices abates. Chart I-6China: Money, Credit And Fiscal Impulses And Financial Markets
bca.ems_wr_2018_11_08_s1_c6
bca.ems_wr_2018_11_08_s1_c6
Second, the stimulus has so far been limited. The recently increased issuance of special bonds by local governments was already part of this year's budget. Simply, it was delayed early this year and has been pushed into the third quarter. In addition, there are reports that 42% of this recent special bond issuance will be used for rural land purchases rather than infrastructure spending.4 The former will not boost economic activity and demand for raw materials and industrial goods. Additionally, the ongoing regulatory tightening of banks and non-bank financial institutions will hinder these institutions' willingness and ability to extend credit, despite lower interest rates. We discussed in a recent report5 that both the effectiveness of the monetary transmission mechanism and the time lag between policy easing and a bottom in the business cycle are contingent on the money multiplier (creditors' willingness to lend and borrowers' readiness to borrow) and the velocity of money (marginal propensity to spend among households and companies). On both accounts, odds are that the transmission mechanism will be slower and somewhat impaired this time around than in the past. Chart I-7 illustrates that the marginal propensity to spend/invest by companies is diminishing, and it has historically defined the primary trend in industrial metals prices. Chart I-7China: Companies Are Turning More Cautious On Capex
China: Companies Are Turning More Cautious On Capex
China: Companies Are Turning More Cautious On Capex
Third, most of the fiscal stimulus - tax cuts and income tax deductions - are designed to raise household incomes. This will primarily help spending on some consumer goods and services. Yet, there will be little help for property sales, construction and infrastructure spending. These three types of spending drive most of the demand for commodities, materials and industrial goods. In turn, industrial goods, machinery, commodities and materials account for about 80% of total Chinese imports. Hence, the channels by which China affects the rest of the world are via imports of capital goods, materials and commodities. Overall, China's tax reforms will have little bearing on its imports from other countries. The latter are heavily exposed to the mainland's construction and infrastructure spending, which in turn are driven by the Chinese credit cycle. This is why we spend so much time analyzing mainland money and credit cycles. Finally, the significance of U.S. import tariffs for the Chinese economy should be put into perspective. China's exports to the U.S. make up only 3.6% of its GDP. This compares with the mainland's total exports of 20% and capital spending of 42% of GDP (Chart I-8). Chart I-8What Drives China's Growth
What Drives China's Growth
What Drives China's Growth
Consequently, capital spending is much more important to the Middle Kingdom's growth than its shipments to the U.S. That said, the trade confrontation between the U.S. and China is likely already negatively affecting overall business and consumer confidence in China (Chart I-9). Chart I-9China: Service Sector Is Moderating
China: Service Sector Is Moderating
China: Service Sector Is Moderating
In addition, Chart I-10 illustrates that China's manufacturing PMI for export orders have plunged, signifying an imminent slump in its exports. This could be due to its shipments not only to the U.S. but also to developing economies, which account for a larger share of total exports than shipments to the U.S. and EU combined. Considerable depreciation in EM currencies has made their imports more expensive, dampening their capacity to import. Chart I-10Chinese Exports Are At Risk
Chinese Exports Are At Risk
Chinese Exports Are At Risk
In brief, China's growth will continue to disappoint, weighing on China plays in financial markets. Ms. Mea: Why has strong U.S. growth not helped global trade, China and EM in general? How do U.S. economic and financial markets enter into your analysis about the world and EM? Answer: One common mistake that many commentators make is to form a view on the U.S. growth outlook and then extrapolate it to the rest of the world. The U.S. economy is still the largest, but it is no longer the sole dominant force in the global economy. Chart I-11 shows that U.S. and EU annual imports are equal to $2.5 and $2.2 trillion, respectively. Combined annual imports of China and the rest of EM amount to $6 trillion - hence, they are much larger than the aggregate imports of U.S. and EU. This is why global trade can deviate from time to time from U.S. domestic demand cycles. Chart I-11EM Imports Are Larger Than U.S. And EU Imports Together
EM Imports Are Larger Than U.S. And EU Imports Together
EM Imports Are Larger Than U.S. And EU Imports Together
That said, due to their sheer size, U.S. financial markets have a much larger impact on global markets than U.S. imports do on global trade. EM financial markets are greatly influenced by their counterparts in the U.S. In this respect, we have a few observations: U.S. growth is robust, the labor market is tight and core inflation is rising. Barring a major deflation shock from EM, the path of least resistance for U.S. bond yields and the fed funds rate is up. Continued rate hikes by the Fed constitute a major menace to EM risk assets. For now, the growth divergence between the U.S. and rest of the world will continue to be manifested in a stronger U.S. dollar. This is a bad omen for EMs. Chart I-12A Risk To U.S. Share Prices
A Risk To U.S. Share Prices
A Risk To U.S. Share Prices
Rising U.S. corporate bond yields have historically been associated with lower U.S. share prices, and presently portend a further drop in American equities (Chart I-12). Finally, the surge in equity market leaders - specifically, new economy stocks - has been on par with previous bubbles, as shown in Chart I-13. Chart I-13History Of Financial Bubbles
History Of Financial Bubbles
History Of Financial Bubbles
It is impossible to know whether or not this is a bubble that has already reached its top. But the magnitude and speed of the rally, at minimum, warrant a consolidation phase. On the whole, Fed tightening, rising corporate bond yields, a strong dollar and elevated valuations warrant further correction in U.S. share prices. This will reinforce the downtrend in EM risk assets. Ms. Mea: Are fundamentals in many EM countries not better today than they were amid the taper tantrum in 2013? Specifically, current account balances in many developing nations have improved and their currencies have cheapened. Answer: Your observation is correct - current account deficits have improved and currencies have become much cheaper than before. Nevertheless, these are necessary but not sufficient conditions to turn bullish: First, marginal shifts in balance of payments drive exchange rates. Even though current account deficits are currently smaller and currencies are moderately cheap in many EMs, a deterioration in their current accounts due to weakening exports in general and falling commodities prices in particular will depress their currencies. In this context, China's imports are critical. As they decelerate, EM ex-China's current account balances will deteriorate and their exchange rates will depreciate. Second, current account surpluses do not always preclude currency depreciation. Chart I-14 shows that the Korean won, the Taiwanese dollar and the Malaysian ringgit experienced bouts of depreciation, despite running current account surpluses. Chart I-14Current Account Surpluses And Exchange Rates
Current Account Surpluses And Exchange Rates
Current Account Surpluses And Exchange Rates
Third, emerging Asian currencies are at a risk from another spell of RMB depreciation. Chart I-15 illustrates that CNY/USD exchange rate correlates with the interest rate differential between China and the U.S. As the Fed hikes rates further and the People's Bank of China (PBoC) keep interest rates stable, the yuan will likely depreciate against the greenback. Chart I-15CNY/USD And Interest Rates
CNY/USD And Interest Rates
CNY/USD And Interest Rates
Despite capital controls, it seems the interest rate differential affects the exchange rate in China too. Given the ongoing growth slowdown and declining return on capital in China, there are rising pressures for capital to exit the country. If the authorities push up interest rates to make the yuan attractive to hold, it will hurt the already overleveraged and weak economy. If the PBoC reduces interest rates further to help the real economy, the RMB will come under depreciation pressure. Given the constraints Chinese policymakers are facing, reducing interest rates and allowing the yuan to depreciate further is the least-worst outcome for the nation. Yet, this will rattle Asian currencies and risk assets. Finally, EM currency valuations are but particularly cheap, except Argentina, Turkey and Mexico as depicted in Chart I-16A & Chart I-16B. When currency valuations are not at an extreme, they usually do not matter for the medium-term outlook. Chart I-16AEM Currency Valuations
EM Currency Valuations
EM Currency Valuations
Chart I-16BEM Currency Valuations
EM Currency Valuations
EM Currency Valuations
As to the EM fixed-income market, exchange rates are the key driver of their performance. Currencies depreciation causes a selloff in high-yielding local currency bonds and typically leads to credit spread widening. The latter occurs because U.S. dollar debt becomes more difficult to service when the value of local currency declines. Besides, EM currencies usually weaken amid a global trade slowdown and falling commodities prices. The latter two undermine issuers' revenues and their capacity to service debt, warranting wider credit spreads. Ms. Mea: What about equity valuations? Aren't they cheap? Chart I-17EM Equity Multiples
bca.ems_wr_2018_11_08_s1_c17
bca.ems_wr_2018_11_08_s1_c17
Answer: EM stocks are not very cheap. Our composite valuation indicator based on a 20% trimmed mean of trailing and forward P/Es, PBV, price-to-cash earnings and price-to-dividend ratios denotes a slightly attractive valuation (Chart I-17). According to our cyclically-adjusted P/E ratio, EM equities are also moderately cheap (Chart I-18). Chart I-18EM Equities: Cyclically-Adjusted P/E Ratio
EM Equities: Cyclically-Adjusted P/E Ratio
EM Equities: Cyclically-Adjusted P/E Ratio
In short, EM equity valuations are modestly cheap. As with currencies, however, unless valuations are at an extreme (say, one or two-standard deviations from their mean), they may not matter for a while. Barring extreme over- or undervaluation, share prices are typically driven by profit cycles. Importantly, EM corporate earnings are set to decelerate further and probably contract in the first half of 2019 (Chart I-19). If this scenario transpires, share prices will drop further, regardless of valuations. Chart I-19EM Corporate Earnings Are At Risk
EM Corporate Earnings Are At Risk
EM Corporate Earnings Are At Risk
Ms. Mea: Why don't you write about risks to your view? And, I would like to use this opportunity to ask what are the risks to your view presently? Answer: The basis of why I do not write about the risks to my view is as follows: The risks to a view are often the cases when the key pillars of analysis do not play out. It follows that in these cases, the risks to the view are obvious and there is no need to write about them. To sum up our discussion today, the key pillars of my view are: China's policy stimulus has so far been moderate and the stimulus usually works with a time lag. Additionally, the combination of the regulatory tightening on banks and non-bank financial organizations and the lingering credit and property market excesses in China will generate a growth slowdown that will be longer and deeper than the markets currently expect. The Fed will continue ratcheting up rates as U.S. core inflation is grinding higher. The combination of the above three will produce weaker global growth, a stronger U.S. dollar, and lower commodities prices. All in all, these are bearish for EM risk assets. It is evident that if these themes and assumptions are incorrect, the view will be wrong. Hence, writing that the risks to my view are that my assumptions and themes are mistaken is nothing other than tautology. That said, there are seldom cases when the underlying economic themes and the assumptions are valid, yet the investment recommendations are amiss. These are, in fact, true risks to the view and they are worthy of discussion. Yet, identifying in advance what could go wrong when the analysis and assumption are accurate is very difficult. Presently, I can think of one reason why my investment recommendations could be erroneous even if my economic themes end up being largely valid: It is the shortage of investable assets worldwide relative to capital that is looking to be invested. Quantitative easing programs in the advanced economies have shrunk the size of investable assets. As a result, too much money is chasing too few assets. Consequently, the risk to my view is that EM assets never become sufficiently cheap and that fundamentals do not matter that much. In other words, investors could rush back into EM risk assets despite the poor growth backdrop and not-so-cheap valuations. This is akin to a game of musical chairs where the number of participants is greater than the number of chairs. To complicate things, some chairs are broken, i.e., some assets are of bad quality. As a result, game participants (i.e., investors) are now facing a tough choice between (1) being somewhat prudent and risking being left without a chair; or (2) rushing in and getting either a good chair or a broken chair (depending on luck). Applying this musical chairs analogy, buying EM risk assets at the current juncture is similar to rushing in and hoping to get a good chair. It is a very high-risk bet and success is contingent on luck. In my subjective assessment, there is about a 30% chance that this strategy - buying EM risk now - will be successful with 70% odds favoring being risk averse for the time being. The latter entails staying with a defensive strategy in EM and underweighting/shorting EM versus DM. Ms. Mea: What is your recommended country allocation currently? Answer: In the EM equity space, our overweights are Korea, Thailand, Brazil, Mexico, Colombia, Chile, Russia, and central Europe. Our underweights, on the other hand, are India, Indonesia, the Philippines, Hong Kong, South Africa and Peru. Chart I-20 demonstrates the performance of our fully invested EM equity portfolio versus the EM MSCI benchmark. This portfolio is constructed based on our country recommendations. Hence, it is a measure of alpha that clients could derive from our country calls and geographical equity allocations. Chart I-20EMS's Fully-Invested Model Equity Portfolio Performance
EMS's Fully-Invested Model Equity Portfolio Performance
EMS's Fully-Invested Model Equity Portfolio Performance
This fully invested equity model portfolio has outperformed the MSCI EM equity benchmark by about 65% with very low volatility since its initiation in May 2008. This translates into 500-basis-points of compounded outperformance per year. In the currency space, we continue recommending shorting a basket of the following EM currencies versus the dollar: ZAR, IDR, MYR, KRW and CLP. The full list of our country recommendations for equity, local fixed-income, credit and currency markets are available below. Arthur Budaghyan, Senior Vice President Emerging Markets Strategy arthurb@bcaresearch.com 1 Please see Emerging Markets Strategy Special Reports, "Where Are EMs In The Cycle?" dated May 3, 2018 and "Ms. Mea Challenges The EMS View," dated October 19, 2018, available at ems.bcaresearch.com. 2 Please see Emerging Markets Strategy Weekly Report, "Understanding The EM/China Cycles," dated July 19, 2018, available at ems.bcaresearch.com. 3 Please see Emerging Markets Strategy Weekly Report, "EMs Are In A Bear Market," dated October 18, 2018, available at ems.bcaresearch.com. 4 Please see: https://www.bloomberg.com/news/articles/2018-10-21/china-s-195-billion-debt-splurge-has-less-bang-than-you-think 5 Please see Emerging Markets Strategy Weekly Report, "EMs Are In A Bear Market," dated October 25, 2018, available at ems.bcaresearch.com. Equity Recommendations Fixed-Income, Credit And Currency Recommendations
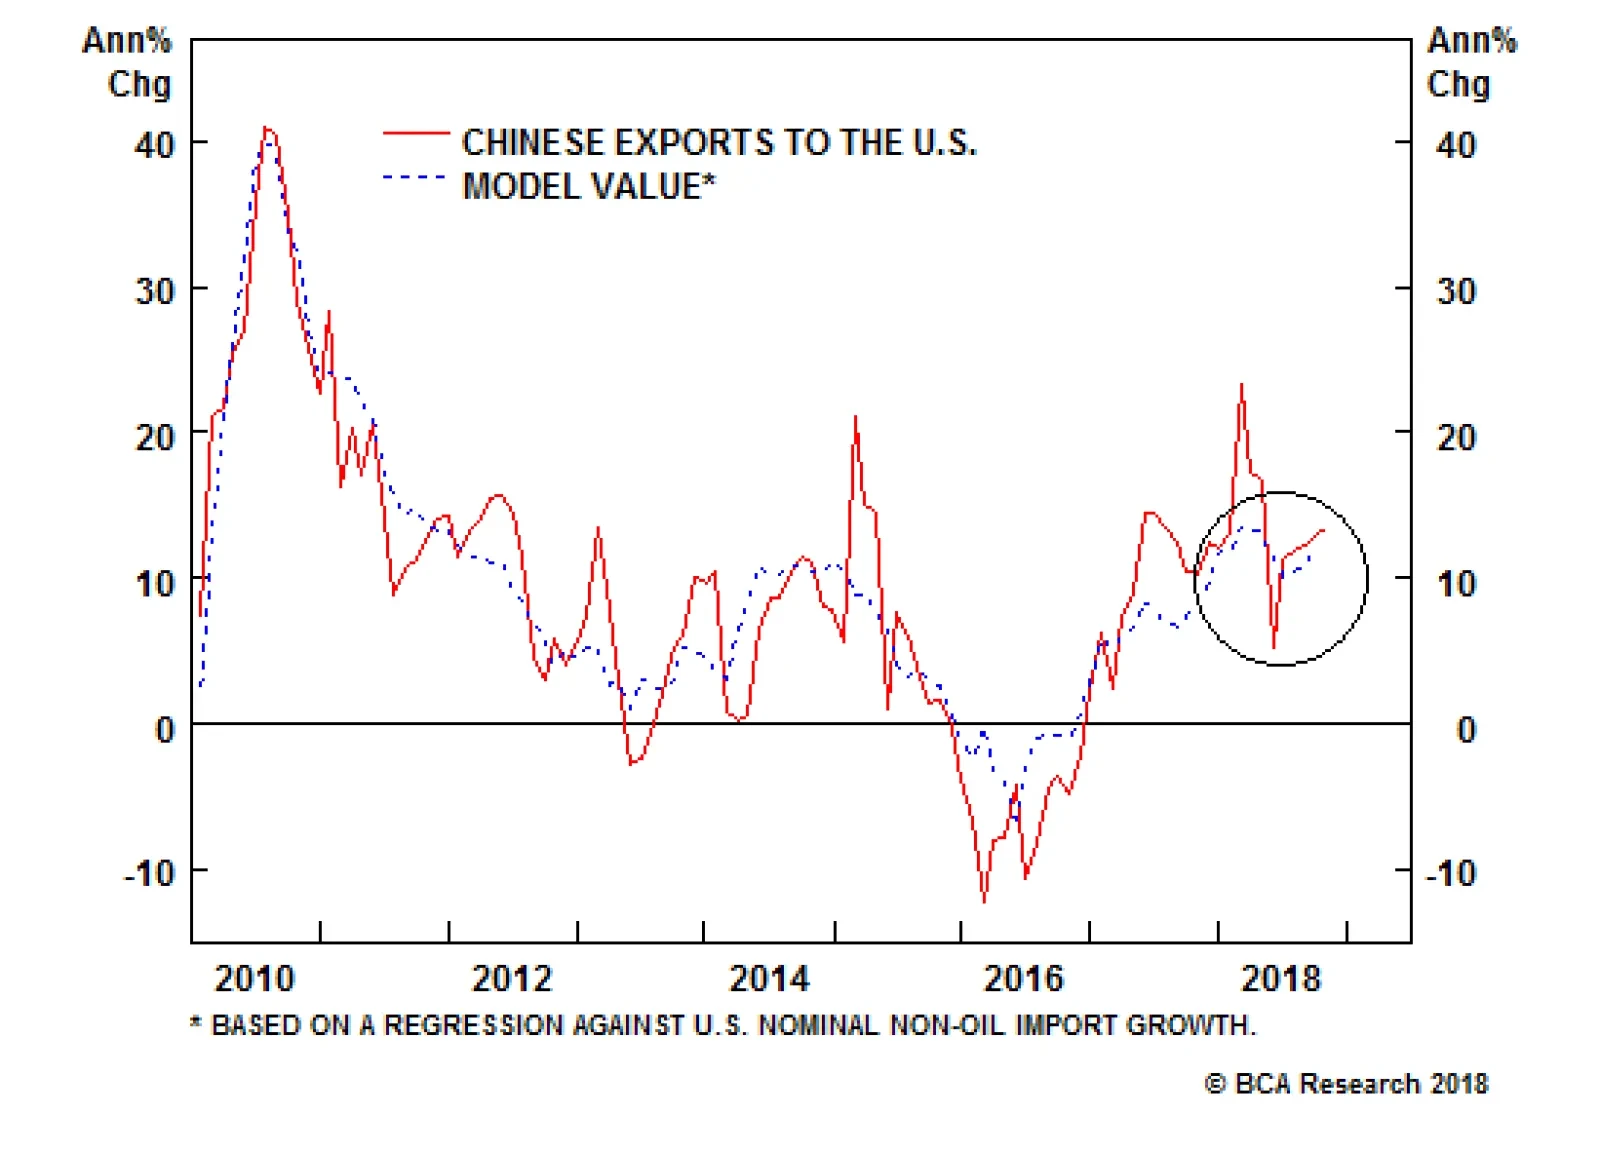
There is no direct reason to expect that the imposition of U.S. import tariffs will impact China’s exports to the world ex-U.S., but the robustness of exports to the U.S. strongly suggests that trade frontrunning continues and is masking the underlying trend.…
Our technical indicators for both domestic and investable markets suggest that Chinese stocks have actually reached 1 standard deviation oversold, a level that has historically served as a platform for a rebound. Still, this speaks merely to the odds of a…
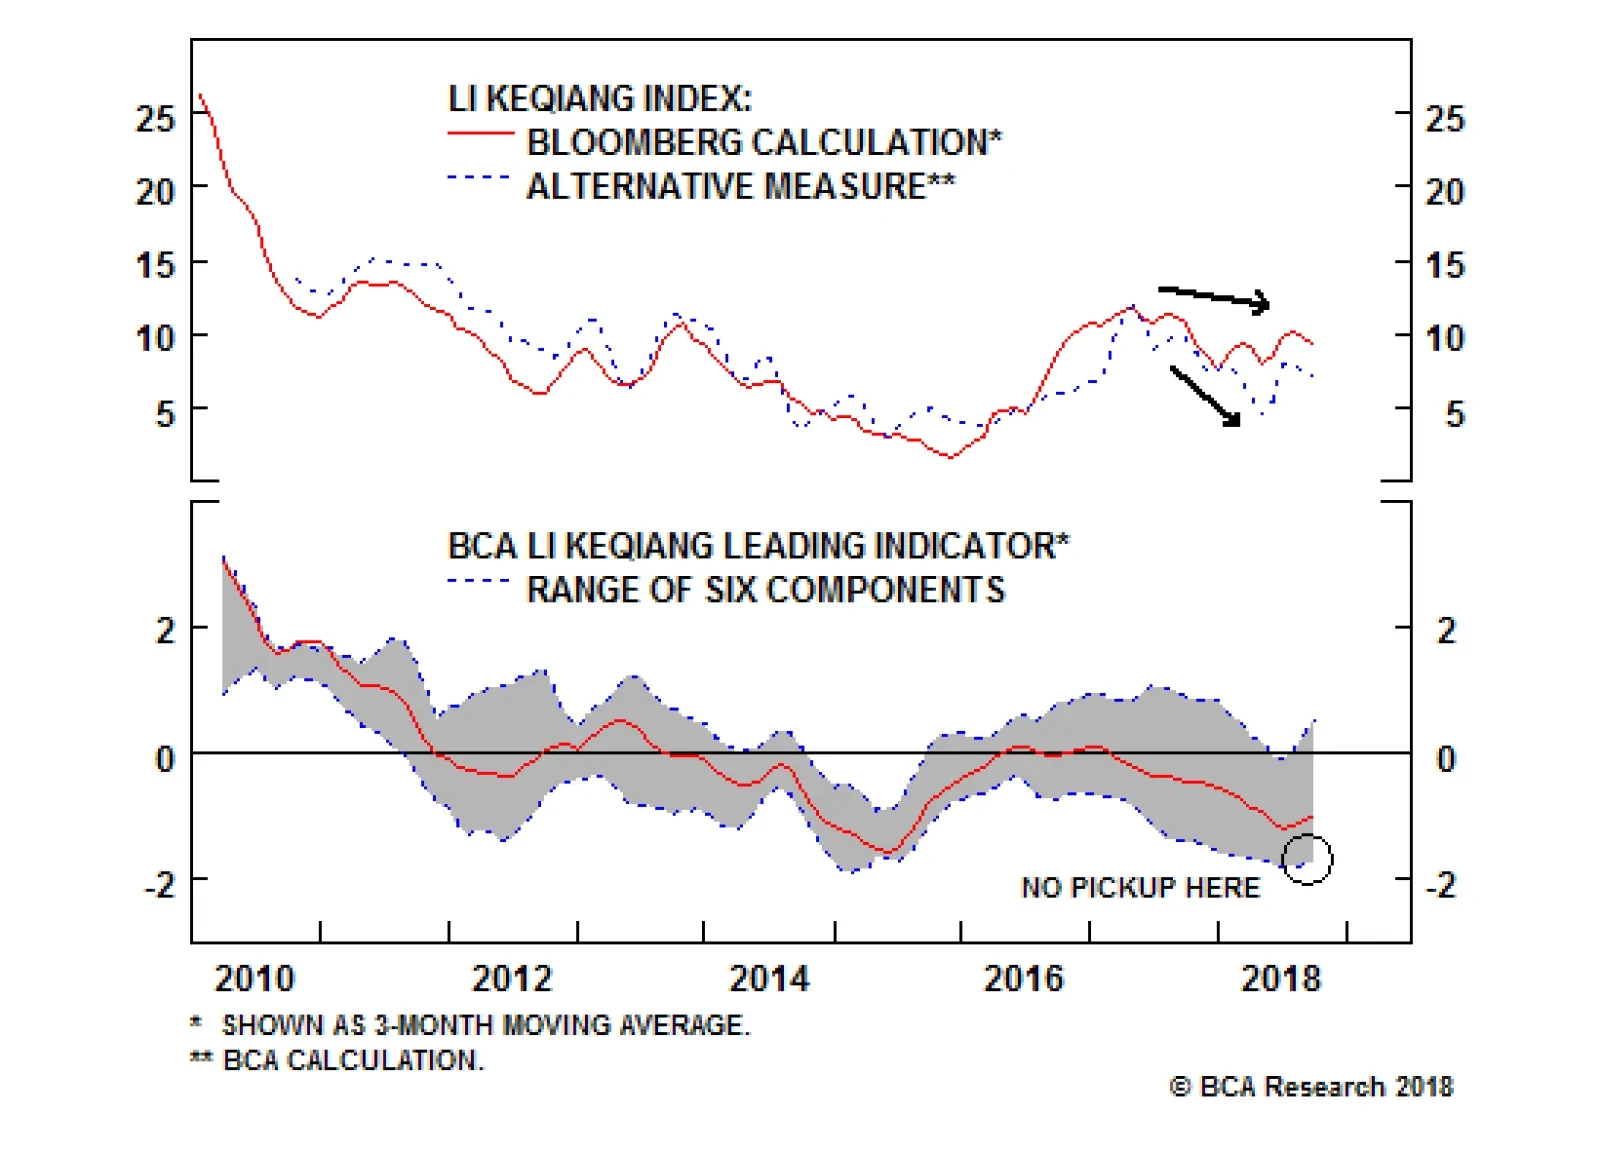
Bloomberg's measure of the Li Keqiang index (LKI) fell in September, confirming that activity in China's old economy is trending lower. A downtrend in industrial activity is even more apparent in our alternative LKI, which is constructed using total freight…
Highlights China's old economy continues to slow in the leadup to the negative effect of U.S. import tariffs on Chinese export growth. Weaker trade data over the coming few months is likely to weigh further on investor sentiment. Our Li Keqiang leading indicator has risen off of its low, but not in a broad-based fashion. While the RMB depreciation has caused Chinese monetary conditions indexes to move sharply higher, money and credit growth remain weak. The recent breakdown in Chinese consumer staples stocks is an exception to the broad trend of low-beta sector outperformance. Fears have risen that the Chinese consumer is faltering, a concern that we will address in a Special Report next week. Feature Tables 1 and 2 highlight key developments in China's economy and its financial markets over the past month. On the growth front, the September update to Bloomberg's measure of the Li Keqiang index (LKI), and our newly created alternative LKI, makes it clear that China's economy continues to slow in the leadup to the negative shock from the external sector. The fact that both LKIs peaked early in 2017 highlights that the slowdown was precipitated by monetary tightening, which has only recently reversed. This easing in monetary conditions has likely improved the liquidity situation in China, but it remains to be seen whether it will prompt any meaningful acceleration in credit growth. Table 1The Trend In Domestic Demand, And The Outlook For Trade, Is Negative
Checking In On The Data
Checking In On The Data
Table 2Financial Market Performance Summary
Checking In On The Data
Checking In On The Data
From an investment strategy perspective, our recommendations remain unchanged. Despite deeply oversold conditions in China's stock markets, investors should avoid outright long positions for now due to the high odds of additional negative catalysts over the coming few months. We expect further weakness in the RMB, and expect USD-CNY to break through 7, suggesting that investors trading within the Chinese equity universe should only favor domestic stocks in currency-hedged terms for now. Finally, we continue to recommend an overweight stance towards low-beta sectors within the investable market, and believe that onshore corporate bonds are a buy despite pervasive default concerns. In reference to Tables 1 and 2, we provide several detailed observations concerning developments in China's macro and financial market data below: Bloomberg's measure of the Li Keqiang index (LKI) fell in September, confirming that activity in China's old economy is trending lower. A downtrend in industrial activity is even more apparent in our alternative LKI (Chart 1), which is constructed using total freight (instead of railway freight) and secondary industry electricity consumption (instead of overall electricity production). Chart 1China's Old Economy Is Slowing, Before The Trade Shock Hits
China's Old Economy Is Slowing, Before The Trade Shock Hits
China's Old Economy Is Slowing, Before The Trade Shock Hits
Our BCA Li Keqiang leading indicator has risen somewhat from its June low, driven by the two monetary conditions indexes (MCIs) included in the indicator. Both of these MCIs have, in turn, been driven by the substantial weakness in the RMB over the past four months. This sharp improvement has not been matched by the other components of the indicator: Chart 2 illustrates that the low end of the component range remains quite weak, in contrast to mid-2015 when both the high and low ends of the range were in a clear uptrend. Chart 2A Narrow Pickup In Our LKI Leading Indicator
A Narrow Pickup In Our LKI Leading Indicator
A Narrow Pickup In Our LKI Leading Indicator
Nearly all of the housing market indicators included in Table 1 are above their 12-month moving average, with the exception of pledged supplementary lending by the PBOC. Pledged supplementary lending itself sequentially increased quite meaningfully in October, underscoring that policymakers are keen to avoid the risk of overtightening the economy at a time when external demand is likely to weaken considerably. Still, smoothed residential sales volume growth has ticked down for two months in a row, suggesting that the extremely stretched pace of floor space started is likely to moderate over the coming months. Chinese export growth remains buoyant, despite several manufacturing and general business condition surveys showing a substantial deterioration over the past few months. As we go to press, China's October trade data has not yet been released, but we expect exports to weaken considerably in the coming few months. This could further weigh on investor sentiment if the slowdown exceeds the market's expectations. Within China's equity market universe, both domestic and investable stocks are deeply oversold in absolute terms, having declined 30% and 28% from their late-January peaks, respectively. Our technical indicators for both markets suggest that Chinese stocks have actually reached 1 standard deviation oversold, a level that has historically served as a platform for a rebound. Still, this speaks merely to the odds of a rebound, not when one will occur, and we can identify further negative catalysts for the equity over the coming 3 months. Avoid outright long positions for now. Despite having fallen significantly themselves, Taiwan and Hong Kong's equity markets have materially outperformed Chinese investable stocks since the beginning of the year (Chart 3). However, Taiwan's outperformance trend has recently moved in the opposite direction, as global investors begin to price in the fact that tensions between the U.S. and China are strategic and long-term in nature, not merely focused on trade.1 Taiwan is extremely exposed to this rivalry, warranting a higher equity risk premium. Chart 3Taiwan's Recent Outperformance Is Likely Reversing
Taiwan's Recent Outperformance Is Likely Reversing
Taiwan's Recent Outperformance Is Likely Reversing
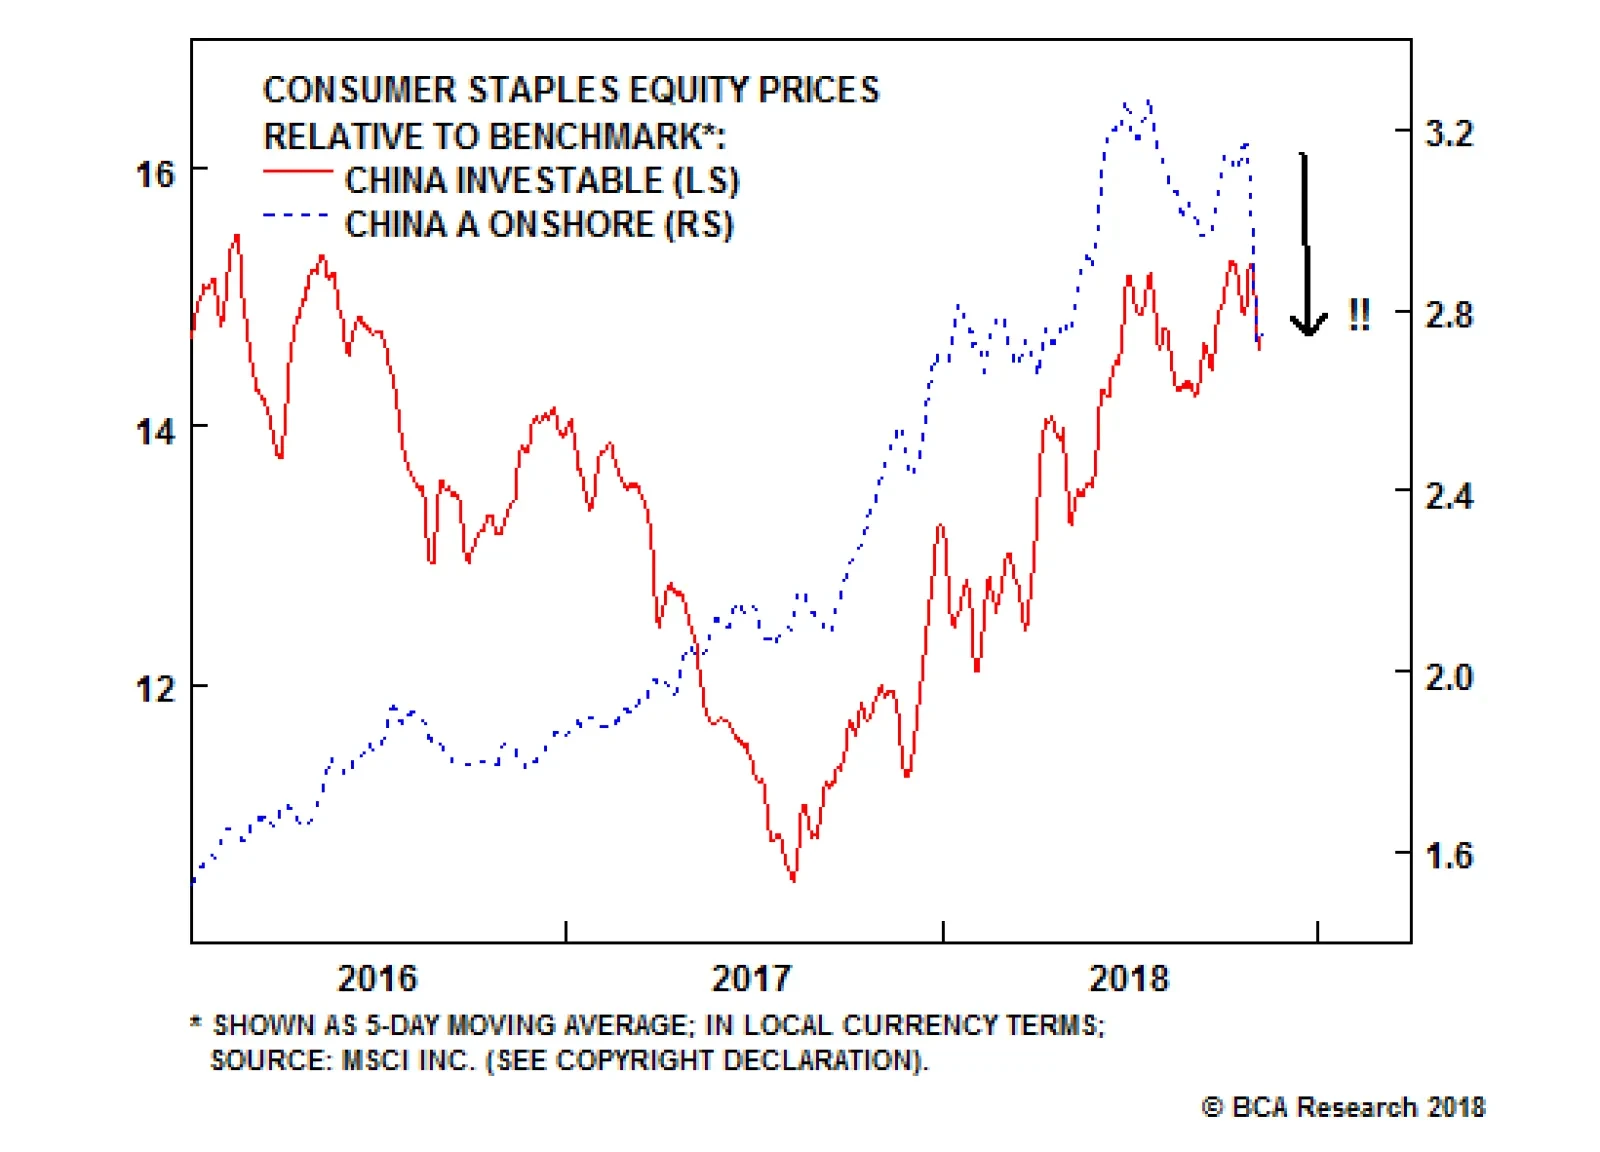
Within Chinese investable stocks, low-beta equity sectors have in general continued to outperform over the past month. Our long MSC China low-beta sectors / short MSCI China trade is up 10% since initiation on June 27, and we expect further gains in the near-term. One exception to this trend is the relative performance of domestic and investable consumer staples stocks, which have recently underperformed their respective broad markets (Chart 4). The selloff has been sharp in the case of the domestic market, and has been in response to heightened fears that household consumption is weakening, a sector of the economy that heretofore had been reliably strong. In response to these developments, please note that BCA's China Investment Strategy service will be publishing a Special Report outlook detailing the outlook for the Chinese consumer next week. Chart 4Fears About Chinese Consumers Are Growing
Fears About Chinese Consumers Are Growing
Fears About Chinese Consumers Are Growing
The Chinese government bond yield curve has bull steepened considerably since the middle of the year, although it has oscillated without a trend over the past month. To the extent that traditional interpretations of the yield curve apply similarly to China, this suggests that domestic investors are pessimistic about the growth outlook, and expect monetary policy to remain easy. For now, this supports our recommendation to avoid outright long positions in Chinese stocks. Domestic Chinese and global investors remain deeply averse to Chinese corporate bonds, and we continue to disagree that aversion is warranted. Chart 5 highlights that the ChinaBond Corporate Bond total return index remains in a solid uptrend, even for bonds rated AA-. Incredibly, panel 2 of Chart 5 illustrates that global investors who have access to onshore corporate bonds have not lost money this year in unhedged terms, despite the material weakness in the RMB since the middle of the year. We continue to recommend onshore corporate bond positions over the coming 6-12 months.2 Chart 5Chinese Corporate Bonds: A Contrarian Long
Chinese Corporate Bonds: A Contrarian Long
Chinese Corporate Bonds: A Contrarian Long
CNY-USD rose materially last week, in response to speculation that the U.S. is readying a possible trade deal with China. Our geopolitical strategists recommend fading the odds of a near-term trade truce, implying that the odds of USD-CNY breeching 7 over the coming months are substantial. While economically meaningless in and of itself, the threshold is psychologically important and its failure to hold could spark meaningful renewed fears of uncontrolled capital outflow from China. Jonathan LaBerge, CFA, Vice President Special Reports jonathanl@bcaresearch.com 1 Please see Emerging Markets Strategy Weekly Report "EMs Are In A Bear Market," published October 18, 2018. Available at ems.bcaresearch.com. 2 Please see China Investment Strategy Weekly Report "Investing In The Middle Of A Trade War," published September 19, 2018. Available at cis.bcaresearch.com. Cyclical Investment Stance Equity Sector Recommendations
Highlights So What? Donald Trump's reelection depends on the timing of the next recession. Why? The midterm elections will not determine Trump's reelection chances. Rather, the timing of the next recession will. BCA's House View expects it by 2020. Otherwise, President Trump is favored to win. Trump may be downgrading "maximum pressure" on Iran, reducing the risk of a 2019 recession. Trade war with China, gridlock, and budget deficits are the most investment-relevant outcomes of U.S. politics in 2018-20. Feature The preliminary results of the U.S. midterm elections are in, with the Democrats gaining the House and failing to gain the Senate, as expected. Our view remains that the implications for investors are minimal. The policy status quo is now locked in - a gridlocked government is unlikely to produce a major change in economic policy over the next two years. While the election is to some extent a rebuke to Trump, this report argues that he remains the favored candidate for the 2020 presidential election - unless a recession occurs. A Preliminary Look At The Midterms First, the preliminary takeaways from the midterms, as the results come in: The Democrats took the House of Representatives, with a preliminary net gain of 27 seats, resulting in a 51%-plus majority, and this is projected to rise to 34 seats as we go to press Wednesday morning. This is above the average for midterm election gains by the opposition party, especially given that Republicans have held the advantage in electoral districting. Performance in the Midwest, other swing states, and suburban areas poses a threat to Trump and Republicans in 2020. Republicans held the Senate, with a net gain of at least two seats, for a 51%-plus majority. Democrats were defending 10 seats in states that Trump won in 2016. While Democrats did well in the Midwest, these candidates had the advantage of incumbency. On the state level, the Democrats gained a net seven governorships, two of them in key Midwestern states. The gubernatorial races were partly cyclical, as the Republicans had hit a historic high-water mark in governors' seats and were bound to fall back a bit. However, the Democratic victory in Michigan and Wisconsin, key Midwestern Trump states, is a very positive sign for the Democrats, since they were not incumbents in either state and had to unseat incumbent Governor Scott Walker in Wisconsin. (Their victory in Maine could also help them in the electoral college in 2020.) The governors' races also suggest that moderate Democrats are more appealing to voters than activist Democrats. Candidate Andrew Gillum's loss in Florida is a disappointment for the progressive wing of the Democratic Party.1 With the House alone, Democrats will not be able to push major legislation through. In the current partisan environment it will be nigh-impossible to reach the 60 votes needed to end debate in the Senate ("cloture"), and even then House Democrats will face a presidential veto. They will not be able to repeal Trump's tax cuts, re-regulate the economy, abandon the trade wars, resurrect Obamacare, or revive the 2015 Iranian nuclear deal. Like the Republicans after 2010, they will be trapped in the position of controlling only one half of one of the three constitutional branches. The most they can do is hold hearings and bring forth witnesses in an attempt to tarnish Trump's 2020 reelection chances. They may eventually bring impeachment articles against him, but without two-thirds of the Senate they cannot remove him from office (unless the GOP grassroots abandons him, giving senators permission to do so). U.S. equities generally move upward after midterm elections - including midterms that produce gridlock (Chart 1A & Chart 1B). However, the October selloff could drag into November. More worryingly, as Chart 1B shows, the post-election rally tends to peter out only six months after a gridlock midterm, unlike midterms that reinforce the ruling party. Chart 1AMidterm U.S. Elections Tend To Be Bullish...
Midterm U.S. Elections Tend To Be Bullish...
Midterm U.S. Elections Tend To Be Bullish...
Chart 1B... But Markets Lose Steam Six Months Post-Gridlock
... But Markets Lose Steam Six Months Post-Gridlock
... But Markets Lose Steam Six Months Post-Gridlock
However, the 2018 midterms could be mildly positive for the markets, as they do not portend any major new policies or uncertainty. Trump's proposed additional tax cuts would have threatened higher inflation and more Fed rate hikes, whereas House Democrats will not be able to raise taxes or cut spending alone. Bipartisan entitlement reform seems unlikely in 2018-20 given the acrimony of the two parties and structural factors such as inequality and populism. An outstanding question is health care, which Republicans left unresolved after failing to repeal Obamacare, and which exit polls show was a driving factor behind Democratic victories. Separately, as an additional marginal positive for risk assets, the Trump administration has reportedly granted eight waivers to countries that import Iranian oil. We have signaled that Trump's "maximum pressure" doctrine poses a key risk for markets due to the danger of an Iran-induced oil price shock. A shift toward more lax enforcement reduces the tail-risk of a recession in 2019 (Chart 2). Of course, the waivers will expire in 180 days and may be a mere ploy to ensure smooth markets ahead of the midterm election, so the jury is still out on this issue. Chart 2Rapid Increases In Oil Prices Tend To Precede Recessions
The 2020 U.S. Election: A "Way Too Soon" Forecast
The 2020 U.S. Election: A "Way Too Soon" Forecast
This brings us to the main focus of this report: what do the midterms suggest about the 2020 election? Bottom Line: The midterm elections have produced a gridlocked Congress. Trump can continue with his foreign policy, most of his trade policy, his deregulatory decrees, and his appointment of court judges with limited interference from House Democrats. The only thing the Democrats can prevent him from doing is cutting taxes further. He tends to agree with Democrats on the need for more spending! While the U.S. market could rally on the back of this result, we do not see U.S. politics being a critical catalyst for markets going forward. On balance, a gridlocked result brings less uncertainty than would otherwise be the case, which is positive for markets in the short term. The Midterms And The 2020 Election There is a weak relationship at best between an opposition party's gains in the midterms and its performance in the presidential election two years later. Given that the president's party almost always loses the midterms - and yet that incumbent presidents tend to be reelected - the midterm has little diagnostic value for the presidential vote, as can be seen in recent elections (Chart 3A & Chart 3B). Chart 3AMidterm Has Little Predictive Power For Presidential Popular Vote ...
The 2020 U.S. Election: A "Way Too Soon" Forecast
The 2020 U.S. Election: A "Way Too Soon" Forecast
Chart 3B... Nor For Presidential Electoral College Vote
The 2020 U.S. Election: A "Way Too Soon" Forecast
The 2020 U.S. Election: A "Way Too Soon" Forecast
Nevertheless, historian Allan Lichtman has shown that since 1860, a midterm loss is marginally negative for a president's reelection chances.2 And for Republicans in recent years, losses in midterm elections are very weakly correlated with Republican losses of seats in the electoral college two years later (Chart 4). Chart 4Republican Midterm Loss Could Foreshadow Electoral College Losses
The 2020 U.S. Election: A "Way Too Soon" Forecast
The 2020 U.S. Election: A "Way Too Soon" Forecast
Still, this midterm election does not give any reason to believe that Trump's reelection chances have been damaged any more than Ronald Reagan's were after 1982, or Bill Clinton's after 1994, or Barack Obama's after 2010. All three of these presidents went on to a second term. A midterm loss simply does not stack the odds against reelection. Why are midterm elections of limited consequence for the president? They are fundamentally different from presidential elections. For instance, "the buck stops here" applies to the president alone, whereas in the midterms voters often seek to keep the president in check by voting against his party in Congress.3 Despite the consensus media narrative, the president is not that unpopular. Trump's approval rating today is about the same as that of Clinton and Obama at this stage in their first term (Chart 5). This week's midterm was not a wave of "resistance" to Trump so much as a run-of-the-mill midterm in which the president's party lost seats. Its outcome should not be overstated. Bottom Line: There is not much correlation between midterms and presidential elections. The best historians view it as a marginal negative for the incumbent. This result is not a mortal wound for Trump. Chart 5President Trump Is Hardly Losing The Popularity Contest
The 2020 U.S. Election: A "Way Too Soon" Forecast
The 2020 U.S. Election: A "Way Too Soon" Forecast
2020: The Recession Call Is The Election Call The incumbent party has lost the White House every single time that a recession occurred during the campaign proper (Chart 6).4 The incumbent party has lost 50%-60% of the time if recession occurred in the calendar year before the election or in the first half of the election year. Chart 6A 2020 Recession Is Trump's Biggest Threat
A 2020 Recession Is Trump's Biggest Threat
A 2020 Recession Is Trump's Biggest Threat
This is a problem for President Trump because the current economic expansion is long in the tooth. In July 2019, it will become the longest running economic expansion in U.S. history, following the 1991-2001 expansion. The 2020 election will occur sixteen months after the record is broken, which means that averting a recession over this entire period will be remarkable. BCA's House View holds that 2020 is the most likely year for a recession to occur. The economy is at full employment, inflation is trending upwards, and the Fed's interest rate hikes will become restrictive sometime in 2019. The yield curve could invert in the second half of 2019 - and inversion tends to precede recession by anywhere from 5-to-16 months (Table 1). No wonder Trump has called the Fed his "biggest threat."5 Table 1Inverted Yield Curve Is An Ominous Sign
The 2020 U.S. Election: A "Way Too Soon" Forecast
The 2020 U.S. Election: A "Way Too Soon" Forecast
The risks to this 2020 recession call are probably skewed toward 2021 instead of 2019. The still-positive U.S. fiscal thrust in 2019 and possibly 2020 and the Trump administration's newly flexible approach to Iran sanctions, if maintained, reduce the tail-risk of a recession in 2019. If there is not a recession by 2020, Trump is the favored candidate to win. First, incumbents win 69% of all U.S. presidential elections. Second, incumbents win 80% of the time when the economy is not in recession, and 76% of the time when real annual per capita GDP growth over the course of the term exceeds the average of the previous two terms, which will likely be the case in 2020 unless there is a recession (Chart 7). Chart 7Relative Economic Performance Could Give Trump Firepower
Relative Economic Performance Could Give Trump Firepower
Relative Economic Performance Could Give Trump Firepower
The above probabilities are drawn from the aforementioned Professor Allan Lichtman, at American University in Washington D.C., who has accurately predicted the outcome of every presidential election since 1984 (except the disputed 2000 election). Lichtman views presidential elections as a referendum on the party that controls the White House. He presents "13 Keys to the Presidency," which are true or false statements based on historically derived indicators of presidential performance. If six or more of the 13 keys are false, the incumbent will lose. On our own reading of Lichtman's keys, Trump is currently lined up to lose a maximum of four keys - two shy of the six needed to unseat him (Table 2). This is a generous reading for the Democrats: Trump's party has lost seats in the midterm election relative to 2014; his term has seen sustained social unrest; he is tainted by major scandal; and he is lacking in charisma. Yet on a stricter reading Trump only has one key against him (the midterm). Table 2Lichtman's Thirteen Keys To The White House*
The 2020 U.S. Election: A "Way Too Soon" Forecast
The 2020 U.S. Election: A "Way Too Soon" Forecast
What would it take to push Trump over the edge? Aside from a recession (which would trigger one or both of the economic keys against him), he would need to see two-to-four of the following factors take shape: a serious foreign policy or military failure, a charismatic Democratic opponent in 2020, a significant challenge to his nomination within the Republican Party, or a robust third party candidacy emerge. In our view, none of these developments are on the horizon yet, though they are probable enough. For instance, it is easy to see Trump's audacious foreign policy on China, Iran, and North Korea leading to a failure that counts against him. Thus, as things currently stand, Trump is the candidate to beat as long as the economy holds up. What about impeachment and removal from office prior to 2020? As long as Trump remains popular among Republican voters he will prevent the Senate from turning against him (Chart 8). What could cause public opinion to change? Clear, irrefutable, accessible, "smoking gun" evidence of personal wrongdoing that affected Trump's campaigns or duties in office. Nixon was not brought down until the Watergate tapes became public - and that required a Supreme Court order. Only then did Republican opinion turn against him and expose him to impeachment and removal - prompting him to resign. Chart 8Trump Cannot Be Removed From Office
The 2020 U.S. Election: A "Way Too Soon" Forecast
The 2020 U.S. Election: A "Way Too Soon" Forecast
All that being said, Trump tends to trail his likeliest 2020 adversaries in one-on-one opinion polling. Given our recession call, we would not dispute online betting markets giving Trump a less-than-50% chance of reelection at present (Chart 9). The Democratic selection process has hardly begun: e.g. Joe Biden could have health problems, and Michelle Obama, Oprah Winfrey, or other surprise candidates could decide to run. The world will be a different place in 2020. Bottom Line: The recession call is the election call. If BCA is right about a recession by 2020, then Trump will lose. If we are wrong, then Trump is favored to win. Chart 9A Strong Opponent Has Yet To Emerge
The 2020 U.S. Election: A "Way Too Soon" Forecast
The 2020 U.S. Election: A "Way Too Soon" Forecast
Is It Even Possible For Trump To Win Again? Election Scenarios Is it demographically possible for Trump to win? Yes. In 2016 BCA dubbed Trump's electoral strategy "White Hype," based on his apparent attempt to increase the support and turnout of white voters, primarily in "Rust Belt" battleground states. While Republican policy wonks might have envisioned a "big tent" Republican Party for the future, demographic trends in 2016 suggested that this strategy was premature. Indeed, drawing from a major demographic study by the Center for American Progress and other Washington think tanks,6 we found that a big increase in white turnout and support was the only 2016 election scenario in which a victory in both the popular vote and electoral college vote was possible. In other words, while "Minority Outreach" have worked as a GOP strategy in the future, Donald Trump's team was mathematically correct in realizing that only White Hype would work in the actual election at hand. This strategy did not win Trump the popular vote, but it did secure him the requisite electoral college seats, notably from the formerly blue of Wisconsin, Michigan, and Pennsylvania. Comparing the 2016 results with our pre-election projections confirms this point: Trump won the very swing states where he increased white GOP support and lost the swing states where he did not. Pennsylvania is the notable exception, but he won there by increasing white turnout instead of white GOP support.7 Can Trump do this again? Yes, but not easily. Map 1 depicts the 2016 election results with red and blue states, plus the percentage swing in white party support that would have been necessary to turn the state to the opposite party (white support for the GOP is the independent variable). In Michigan, a 0.3% shift in the white vote away from Republicans would have deprived Trump of victory; in Wisconsin and Pennsylvania, a 0.8% shift would have done the same; in Florida, a 1.5% change would have done so. Map 1The 'White Hype' Strategy Narrowly Worked In 2016
The 2020 U.S. Election: A "Way Too Soon" Forecast
The 2020 U.S. Election: A "Way Too Soon" Forecast
Critically, the country's demographics have changed significantly since 2016 - to Trump's detriment. The white eligible voting population in swing states will have fallen sharply from 81% of the population to 76% of the population by 2020 (Chart 10). Chart 10Demographic Shift Does Not Favor Trump
The 2020 U.S. Election: A "Way Too Soon" Forecast
The 2020 U.S. Election: A "Way Too Soon" Forecast
Thus, to determine whether Trump still has a pathway to victory, we looked at eight scenarios, drawing on the updated Center for American Progress study. The assumptions behind the scenarios in Table 3 are as follows: Status Quo - This replicates the 2016 result and projects it forward with 2020 demographics. 2016 Sans Third Party - Replicates the 2016 result but normalizes the third party vote, which was elevated that year. Minority Revolt - In this scenario, Hispanics, Asians, and other minorities turn out in large numbers to support Democrats, even with white non-college educated voters supporting Republicans at a decent rate. The Kanye West Strategy - Trump performs a miracle and generates a swing of minority voters in favor of Republicans. Blue Collar Democrats - White non-college-educated support returns to 2012 norms, meaning back to Democrats. Romney's Ghost - White college-educated support returns to 2012 levels. White Hype - White non-college-educated support swings to Republicans. Obama versus Trump - White college-educated voters ally with minorities in opposition to a surge in white non-college-educated voters for Republicans. Table 3Assumptions For Key Electoral Scenarios In 2020
The 2020 U.S. Election: A "Way Too Soon" Forecast
The 2020 U.S. Election: A "Way Too Soon" Forecast
The results show that Trump's best chance at remaining in the White House is still White Hype, as it is still the only scenario in which Trump can statistically win a victory in the popular vote (Chart 11). Another pathway to victory is the "2016 Sans Third Party" scenario. But this scenario still calls for White Hype, since a third party challenger is out of his hands (Chart 12).8 Chart 11'White Hype' May Be Only Way To Secure Both Popular And Electoral College Vote...
The 2020 U.S. Election: A "Way Too Soon" Forecast
The 2020 U.S. Election: A "Way Too Soon" Forecast
Chart 12... Although Moving To The Center Could Still Yield Electoral College Vote
The 2020 U.S. Election: A "Way Too Soon" Forecast
The 2020 U.S. Election: A "Way Too Soon" Forecast
However, the data show that Trump cannot win merely by replicating his white turnout and support from 2016, due to demographic changes wiping away the thin margins in key swing states. He needs some additional increases in support. These increases will ultimately have to be culled from his record in office - which reinforces the all-important question of the timing of recession, but also raises the question of whether Trump will move to the center to woo the median voter. In the "Kanye West" and "Romney's Ghost" scenarios, Trump wins the electoral college by broadening his appeal to minorities and college-educated white voters. This may sound far-fetched, but President Clinton reinvented himself after the "Republican Revolution" of 1994 by compromising with Republicans in Congress. The slim margins in the Midwest suggest that the probability of Trump shifting to the middle is not as low as one might think. Especially if there is no recession. Independents remain the largest voting block - and they have not lost much steam, if any, since 2016. Moreover, the number of independents who lean Republican is in an uptrend (Chart 13). Without a recession, or a failure on Lichtman's keys, Trump will likely broaden his base. Chart 13Trump Shows Promise Among Independents
Trump Shows Promise Among Independents
Trump Shows Promise Among Independents
Bottom Line: Trump needs to increase white turnout and GOP support beyond 2016 levels in order to win 2020. Demographics will not allow a simple repeat of his 2016 performance. However, he may be able to generate the requisite turnout and support by moving to the center, courting college-educated whites and even minorities. His success will depend on his record in office. Investment Implications What are the implications of the above findings for 2018-20 and beyond? The Rust Belt states of Michigan, Pennsylvania, and Wisconsin will become pseudo-apocalyptic battlegrounds in 2020. The Democrats must aim to take back all three to win the White House, as they cannot win with just two alone.9 They are likely to focus on these states because they are erstwhile blue states and the vote margin is so slim that the slightest factors could shift the balance - meaning that Democrats could win here without a general pro-Democratic shift in opinion that hurts Trump in other key swing states such as Florida, North Carolina, or Arizona. The "Blue Collar Democrat" scenario, for instance, merely requires that white non-college-educated voters return to their 2012 level of support for Democrats. Joe Biden is the logical candidate, health permitting, as he is from Pennsylvania and was literally on the ballot in 2012! Moreover, these states are the easiest to flip to the Democratic side via the woman vote. In Michigan, a 0.5% swing of women to the Democrats would have turned the state blue again; in Pennsylvania that number is 1.6% and in Wisconsin it is 1.7% (Table 4). These are the lowest of any state. Women from the Midwest or with a base in the Midwest - such as Michelle Obama or Oprah Winfrey - would also be logical candidates. Table 4Women Voters May Hold The Balance
The 2020 U.S. Election: A "Way Too Soon" Forecast
The 2020 U.S. Election: A "Way Too Soon" Forecast
The Democrats could also pursue a separate or complementary strategy by courting African American turnout and support, especially in Florida, Georgia, and North Carolina. But it is more difficult to flip these states than the Midwestern ones. With the Rust Belt as the fulcrum of his electoral strategy and reelection, Trump has a major incentive to maintain economic nationalism over the coming two years. Trump may be more pragmatic in the use of tariffs, and will certainly engage in talks with China and others, but he ultimately must remain "tough" on trade. He has fewer constraints in pursuing trade war with China than with Europe. For the same Rust Belt reason, the Democrats, if they get into the Oval Office, will not be overly kind to the "butchers of Beijing," as President Clinton called the Chinese leadership in the 1992 presidential campaign (after the 1989 Tiananmen Square incident). Hence we are structurally bearish U.S.-China relations and related assets. Interestingly, if Trump moves to the middle, and tones down "white nationalism" in pursuit of college-educated whites and minorities, then he would have an incentive to dampen the flames of social division ahead of 2020. The key is that in an environment without recession, Trump has the option of courting voters on the basis of his economic and policy performance alone. Whereas if he is seen fanning social divisions, it could backfire, as Democrats could benefit from a sense of national crisis and instability in a presidential election. Either way, culture wars, controversial rhetoric, identity politics, unrest, and violence will continue in the United States as the fringes of the political spectrum use identity politics and wedge issues to rile up voters.The question is how the leading parties and their candidates handle it. What about after 2020? Are there any conclusions that can be drawn regardless of which party controls the White House? The two biggest policy certainties are that fiscal spending will go up and that generational conflict will rise. On fiscal spending, Trump was a game changer by removing fiscal hawkishness from the Republican agenda. Democrats are not proposing fiscal responsibility either. The most likely areas of bipartisan legislation in 2018-20 are health care and infrastructure - returning House Speaker Nancy Pelosi mentioned infrastructure several times in her election-night speech - which would add to the deficit. The deficit is already set to widen sharply, judging by the fact that it has been widening at a time when unemployment is falling. This aberration has only occurred during the economic boom of the 1950s and the inflation and subsequent stagflation beginning in the late 1960s (Chart 14). The current outlook implies a return of the stagflationary scenario. In the late 1960s, the World War I generation was retiring, lifting the dependent-to-worker ratio and increasing consumption relative to savings. Today, as Peter Berezin of BCA's Global Investment Strategy has shown, the Baby Boomers are retiring with a similar impact. Chart 14The Deficit Is Blowing Out Even Without A Recession
The Deficit Is Blowing Out Even Without A Recession
The Deficit Is Blowing Out Even Without A Recession
Trump made an appeal to elderly voters in the midterms by warning that unfettered immigration and Democratic entitlement expansions would take away from existing senior benefits. By contrast, Democrats will argue that Republicans want to cut benefits for all to pay for tax cuts for the rich, and will try to activate Millennial voters on a range of progressive issues that antagonize older voters. The result is that policy debates will focus more on generational differences. Mammoth budget deficits - not to mention trade war - will be good for inflation, good for gold, and a headwind for U.S. government bonds and the USD as long as the environment is not recessionary. The greatest policy uncertainties are health care and immigration. These are the two major outstanding policy issues that Republicans and Democrats will vie over in 2018 and beyond. While President Trump could achieve something with the Democrats on either of these issues with some painful compromises, it is too soon to have a high conviction on the outcome. But assuming that over the coming years some immigration restrictions come into play and that some kind of public health care option becomes more widely available, there are two more reasons to expect inflation to trend upward on a secular basis. Also on a secular basis, defense stocks stand to benefit from geopolitical multipolarity, especially U.S.-China antagonism. Tech stocks stand to suffer due to the trade war and an increasingly bipartisan consensus that this sector needs to be regulated. Matt Gertken, Vice President Geopolitical Strategy mattg@bcaresearch.com Marko Papic, Senior Vice President Chief Geopolitical Strategist marko@bcaresearch.com 1 Furthermore, victories on the state level, if built upon in the 2020 election, could give the Democrats an advantage in gerrymandering, i.e. electoral redistricting, which is an important political process in the United States. 2 Please see Allan J. Lichtman, Predicting The Next President: The Keys To The White House 2016 (New York: Rowman and Littlefield, 2016). 3 Please see Joseph Bafumi, Robert S. Erikson, and Christopher Wlezien, "Balancing, Generic Polls and Midterm Congressional Elections," The Journal of Politics 72:3 (2010), pp. 705-19. 4 Please see footnote 2 above. 5 Please see Sylvan Lane, “Trump says Fed is his ‘biggest threat,’ blasting own appointees,” The Hill, October 16, 2018, available at thehill.com. 6 Please see Rob Griffin, Ruy Teixeira, and William H. Frey, "America's Electoral Future: Demographic Shifts and the Future of the Trump Coalition," Center for American Progress, dated April 14, 2018, available at www.americanprogress.org. 7 In several cases, he did not have to lift white support by as much as we projected because minority support for the Democrats dropped off after Obama left the stage. 8 Interestingly, however, this scenario would result in an electoral college tie! Since the House would then vote on a state delegation basis, it would likely hand Trump the victory (and Pence would also win the Senate). 9 However, if they win Pennsylvania plus one electoral vote in Maine, they can win the electoral college with either Michigan or Wisconsin.
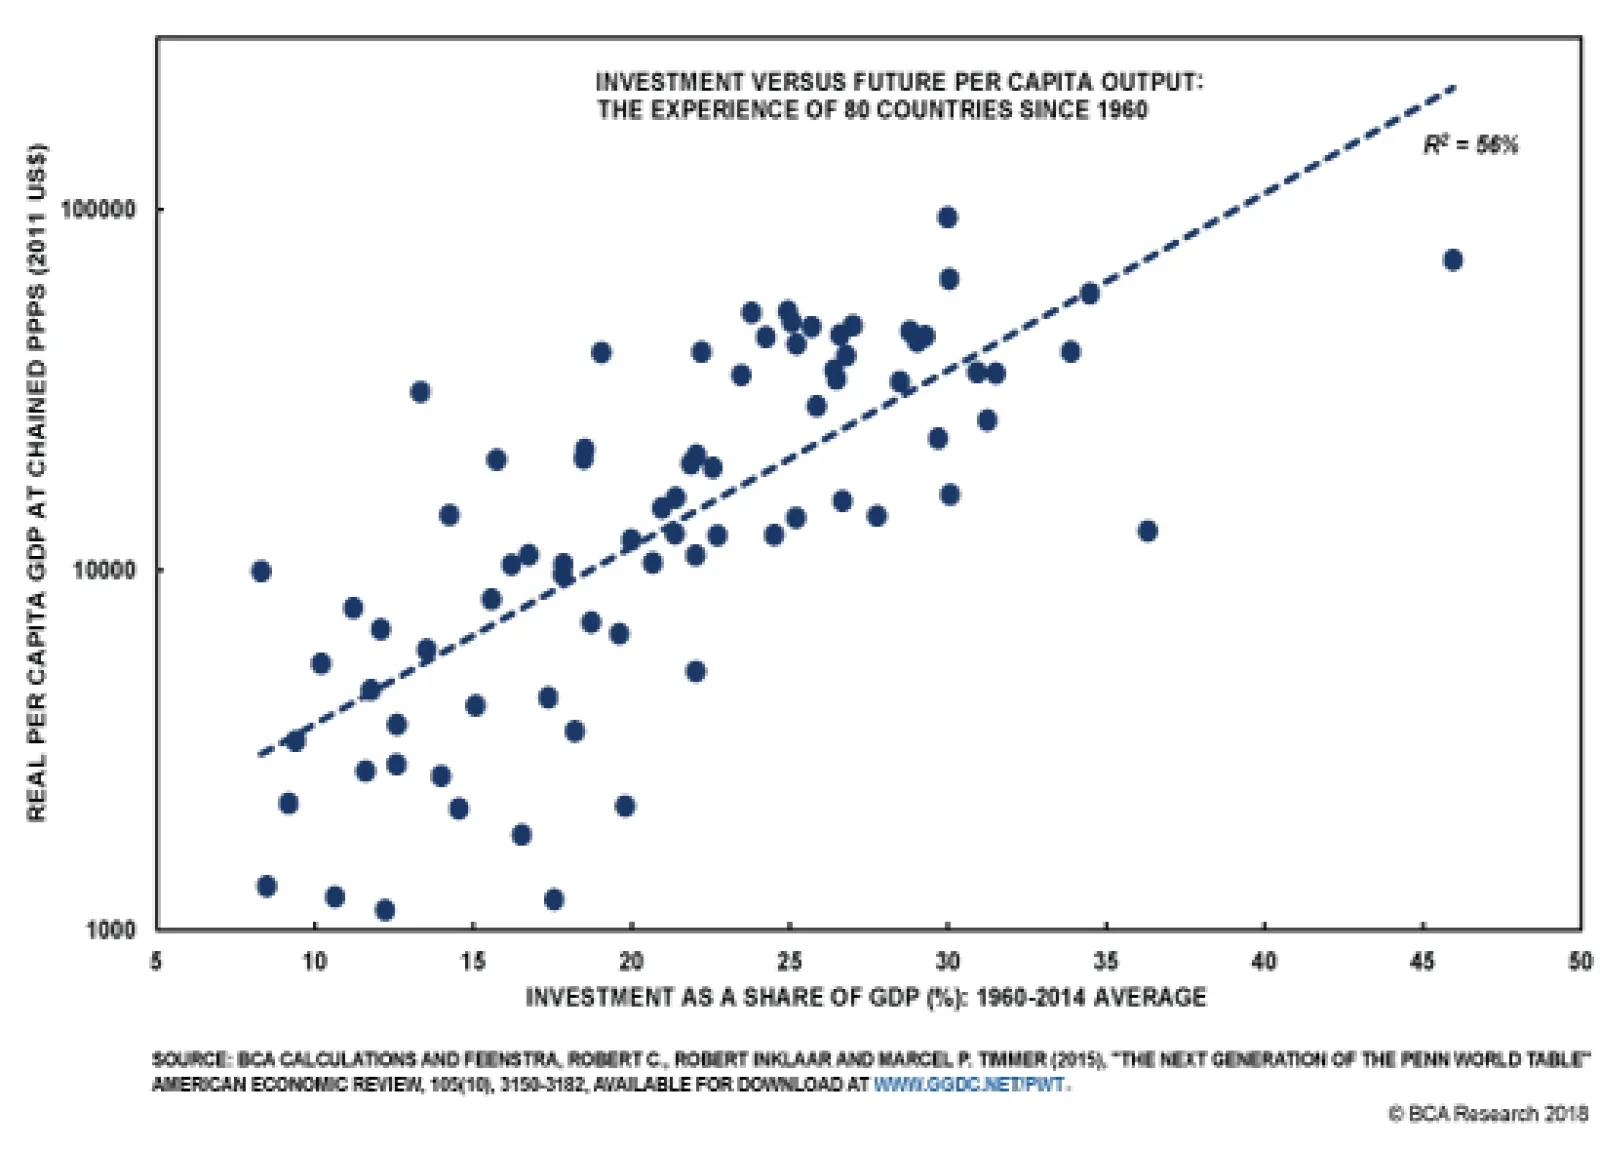
The above chart presents, in a nutshell, the theoretical support for the "keep investing" view. The chart depicts real per capita GDP for 80 countries in 2014 as a function of the average share of gross capital formation to GDP from 1960 to 2014. The chart…
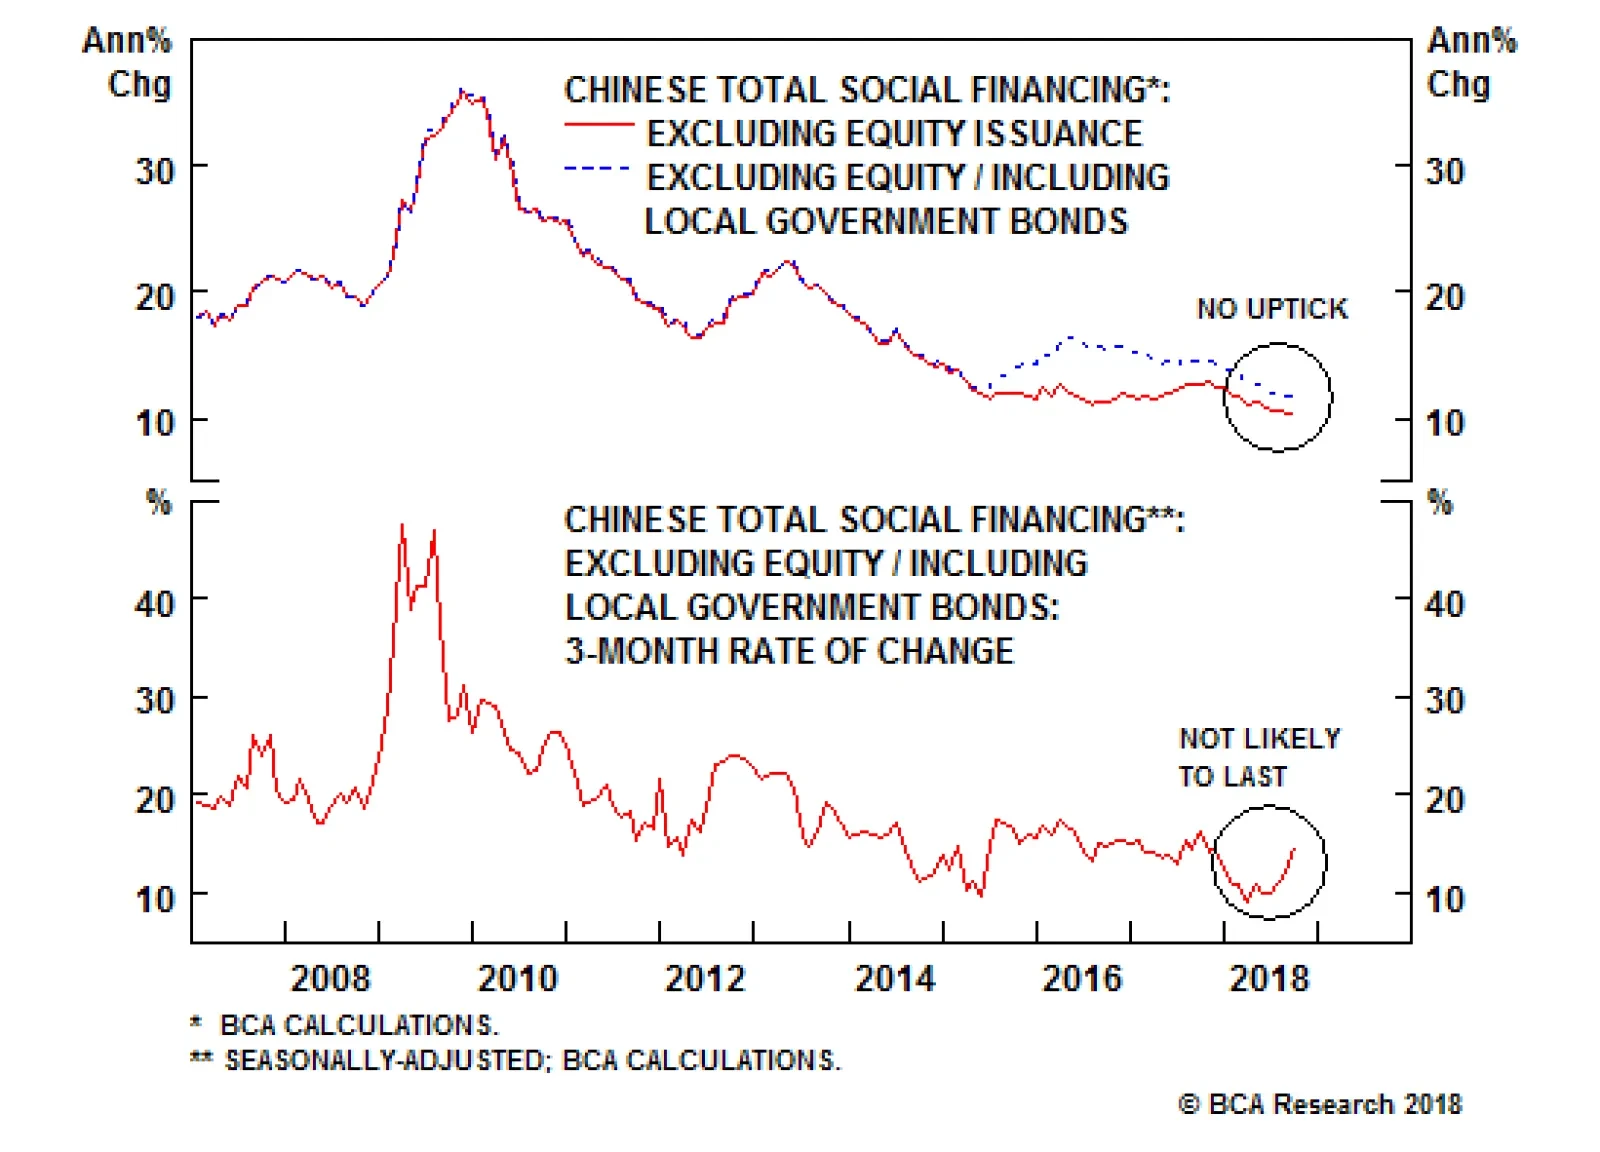
September's total social financing data, released earlier this month, provided important evidence supporting our view that Chinese policymakers are not aiming for a significant acceleration in private sector credit growth. The above chart highlights that the…
Highlights After tumbling more than 20% between June and August, copper prices have remained largely static. This reflects the tug-of-war between the near-term bullish physical market fundamentals, and the cloudier macro headwinds ahead, arising from a stronger U.S. dollar. Furthermore, Chinese policymakers are unlikely to abandon their reform agenda and stimulate massively, which will put downside pressure on copper prices further down the road. Despite our negative 12-month outlook, we do not rule out the potential for some upside going into year-end, on the back of falling inventories. Energy: Overweight. News leaked earlier this week indicates the Trump administration is divided over whether to grant waivers on Iranian crude oil imports to big importers like China, India and Turkey, following the re-imposition of sanctions on November 4.1 The U.S. State Department, in particular, appears worried the sanctions will produce a price spike that could derail growth in the U.S. and its allies. This suggests the Administration will be less determined to enforce its Iranian export sanctions, until it has been assured Saudi Arabia and Russia will be able to bring enough production on line in 1H19 to cover the lost Iranian exports, and possible deeper Venezuelan losses. Markets will remain focused on actual export losses from Iran - if they come in at the high end of expectations (i.e., greater than 1.5mm b/d), we expect higher prices; if it becomes apparent the U.S. will go soft on enforcing sanctions, prices would fall. Expect higher volatility. Base Metals: Neutral. Copper prices could rally over the short term, on the back of lower inventories. However, longer term, we see no catalysts to push prices toward recent highs of ~ $3.30/lb on the COMEX. Precious Metals: Neutral. Gold's break above $1,200/oz is holding, but it continues to grind in a $1,210 to $1,240/oz range. Ags/Softs: Underweight. The USDA will report on export sales of grains and oil seeds today. Soybean exports were down 21% y/y for the current crop year, based on the Department's October 18 report. Feature Tight Market Conditions Suggest A Brief Upswing ... After remaining in the $2.90-$3.30/lb trading range for the better part of 1H18, copper prices plunged ~20% since their June peak. The trigger? The escalation of the U.S.-China trade war. The increasingly acrimonious trade relationship acted as a reality check. Investors betting on strike-induced mine supply shortfalls earlier this year were forced to adjust expectations regarding the resilience of the global, and, more specifically, the Chinese business cycles.2 The negative impact of the trade war is clear: copper prices moved to the downside with each escalation in the dispute (Chart of the Week). While current market fundamentals do not necessarily warrant such drastic declines, we see these developments as a wake-up call to market participants. Copper sentiment - previously buoyed by expectations of mine strikes (which failed to materialize) - has come crashing down (Chart 2). Chart of the WeekCopper Down On Trade War
Copper Down On Trade War
Copper Down On Trade War
Chart 2Sentiment Has Come Crashing Down
Sentiment Has Come Crashing Down
Sentiment Has Come Crashing Down
However, the outlook in the very near term is not so bleak. The evidence below suggests tight physical conditions, indicating copper's next move could be to the upside: Chinese copper imports came in strong in September (Chart 3). While unwrought copper imports reached a 2.5-year high, ores and concentrates forged new record highs. Chart 3Chinese Imports Came In Strong
Chinese Imports Came In Strong
Chinese Imports Came In Strong
The resilience of Chinese purchases comes on the back of restrictions on scrap imports, which account for a significant share global copper supply (Chart 4). As we have been highlighting, Chinese restrictions on the purity of scrap imports require other forms of the metal to fill the supply gap.3 At the same time, the 25% tariff imposed on Chinese imports of U.S. scrap since August also manifests itself in greater demand for other forms of the metal. This is evident in weak scrap copper imports (Chart 5). Chart 4A Dependable Secondary Market Is Essential For Global Supply
Copper Could Rally In The Short Term; Long-Term Fundamentals Less Bullish
Copper Could Rally In The Short Term; Long-Term Fundamentals Less Bullish
Chart 5Scrap Import Restrictions Raise Need For Other Forms Of Copper
Scrap Import Restrictions Raise Need For Other Forms Of Copper
Scrap Import Restrictions Raise Need For Other Forms Of Copper
Copper inventories at the three major global exchange warehouses have been declining steadily and together now stand at half their late April peak (Chart 6). This is their lowest level since late 2016. Chart 6Exchange Inventories At Two Year Low
Exchange Inventories At Two Year Low
Exchange Inventories At Two Year Low
The above evidence of a tight market is in line with copper's futures curve, which is recently pricing a premium for physical delivery (Chart 7). Chart 7Markets Pricing A Premium For Physical Delivery
Markets Pricing A Premium For Physical Delivery
Markets Pricing A Premium For Physical Delivery
Going into the winter, smelter disruptions may lend further upside support amid these tight conditions: The Vedanta copper smelter in the Indian state of Tamil Nadu was forced to shut down in May due to violent protests. The smelter has an annual production of over 400k MT. In Chile, Codelco gave notice to the market that two of its four smelters will undergo weeks-long outages, in order to comply with tightening of emissions rules - requiring smelters to capture 95% of emissions - due to take effect in December. This will halt production from smelters at the Chuquicamata and Salvador mines for 75 days and 45 days, respectively. Furthermore, in mid-October BHP Billiton reduced its 2018 copper production forecast by 3% to between 1.62mm MT and 1.7mm MT, due to shutdowns at its Olympic Dam facility in Australia and Spence in Chile. Bottom Line: Dynamics at the scrap level in China and disruptions at major smelters in India, Chile and Australia justify tight copper market conditions. This offers potential for a minor rebound in copper prices in the very near term. ... Ahead Of Macro Headwinds In the medium term, macro headwinds will dominate the physical market, capping gains in copper prices. Most notably, fall-out from the U.S.-China trade war in absence of aggressive traditional forms of stimulus, will weigh on demand there. Furthermore, U.S. dollar strength on the back of economic and monetary policy divergences, will make the red metal more expensive for global consumers. Ex-U.S. Growth Unpromising Given the stimulative fiscal policies in the U.S., our House View still does not expect a recession before late-2020. However in the meantime, the global economy will be characterized by divergence in favor of the U.S. (Chart 8). Chart 8Global Economic Divergence Favors U.S.
Global Economic Divergence Favors U.S.
Global Economic Divergence Favors U.S.
Of utmost importance is, of course, China - where roughly half of global refined copper is consumed. The trade dispute with the U.S. has raised concerns over the resilience of the Chinese economy. Recent data releases have done little to ease fears of a manufacturing slowdown. The Li Keqiang Index and our China construction proxy - both of which are strongly correlated with copper prices - are on a slight downtrend (Chart 9). Chart 9Ominous Signs From China
Ominous Signs From China
Ominous Signs From China
China's 3Q18 GDP data indicate the Chinese economy grew by the slowest pace in nearly a decade (Chart 10). At the same time, PMI's have fallen to or near the 50 level - the boom-bust line - reflecting pessimism in the manufacturing sector. The real estate market - where 45% of China's copper is consumed - also looks gloomy. Home sales rolled over, boding ill for future housing starts. Chart 10Weak Q3 GDP Mirrors Manufacturing And Property Sectors
Weak Q3 GDP Mirrors Manufacturing And Property Sectors
Weak Q3 GDP Mirrors Manufacturing And Property Sectors
What's more, we are not betting on a flood of stimulus to rescue China's ailing economy. As our colleagues at BCA's Geopolitical Strategy service have been highlighting, the drive to combat vulnerabilities in financial markets raised the pain threshold of Chinese policymakers.4 As such, they are not likely to abandon their reform agenda at the first sign of weakness, as they traditionally have. Although some measures have already been implemented to ease policy, the current response is not yet as promising for commodity markets as has historically been the case. For one, credit growth is constrained by China's de-leveraging campaign. Although there is some evidence that the clampdown on shadow financing is easing, it is not yet at simulative levels (Chart 11). And while the money impulse is rebounding thanks to Reserve Requirement Ratio cuts, the credit impulse is still falling deeper into negative territory. Chart 11Shadow Banking Restrained By Reform Agenda
Shadow Banking Restrained By Reform Agenda
Shadow Banking Restrained By Reform Agenda
Additionally, as Peter Berezin who heads BCA's Global Investment Strategy highlights, China's more recent forms of (consumption-based) stimulus such as income tax reforms do not boost commodity demand. The same goes for the other way in which Chinese authorities are trying to stabilize their economy: by depreciating the RMB. This is in clear contrast to traditional measures such as fixed asset investment, which stimulate demand for raw materials and capital goods.5 Overall, the current level of stimulus is not sufficient to boost the Chinese economy. Nor, by extension, is it enough to lift EMs, and commodity prices in the process. In fact, copper markets have been oblivious to various announcements by Chinese authorities that they are easing policy (Chart 12). Chart 12Copper Markets Oblivious To Chinese Stimulus
Copper Markets Oblivious To Chinese Stimulus
Copper Markets Oblivious To Chinese Stimulus
Our Geopolitical Strategists warn that the U.S.-China trade war could get worse before it improves. Thus, while policymakers are not yet compelled to throw in the towel with their reform agenda, they are pragmatic and will likely intensify their response if conditions deteriorate further. If authorities were to deploy massively stimulative fiscal and monetary policy by propping up infrastructure and the real estate sector - as they traditionally have done - chances are that we would be able to escape further price weakness in copper markets. For now, the evidence points at a more modest policy approach. Green Dollar, Red Metal As a counter-cyclical currency, the U.S. dollar will shine in the current weaker ex-U.S. growth environment. What's more, limited spare capacity in the U.S. and a strong labor market foreshadow rising U.S. inflation readings. This will justify continued tightening by the Fed. Economic divergences favoring the U.S. economy will amplify the impact. Rising U.S. borrowing costs will be painful for debt-laden EM economies. Their Central Banks will struggle to keep the pace with the Fed. Similarly, the European Central Bank - conscious of turmoil in Italy - will be forced to maintain a more dovish stance. This will weigh down on the EUR/USD. A stronger dollar generally dents demand by making commodities - priced in U.S. dollars - more expensive for foreign consumers. While energy markets dominated by supply risks remain disconnected from their long-term negative correlation with the U.S. dollar, the relationship with metals has re-converged (Chart 13).6 This leaves copper more vulnerable to the downside amid dollar strengthening. The impact will be magnified for Chinese consumers as the RMB weakens further, forcing the top consumer to cut down on imports of the red metal. Chart 13USD-Copper Relationship Re-converged
USD-Copper Relationship Re-converged
USD-Copper Relationship Re-converged
Bottom Line: Headwinds from weakness in China and a stronger dollar will be a drag on demand next year. Unless Chinese policymakers temporarily abandon their reform agenda and stimulate massively, medium term copper prices will face pressures to the downside. Model Updates Given the macro headwinds outlined above, we revised our copper demand forecast. Our balances now point to a slight surplus in 2019 (Chart 14). In the context of 24mm MT of consumption p.a., a 100k MT surplus can be characterized as a balanced market. This makes prices vulnerable to upside or downside surprises, which can easily tip the scale. Chart 14Broadly Balanced Market
Copper Could Rally In The Short Term; Long-Term Fundamentals Less Bullish
Copper Could Rally In The Short Term; Long-Term Fundamentals Less Bullish
In line with our market assessment, we simulated forecasts for copper prices based on a 5% and 10% appreciation in the USD over the coming 12 months (Chart 15). Chart 15Macro Headwinds In 2019
Macro Headwinds In 2019
Macro Headwinds In 2019
Roukaya Ibrahim, Editor/Strategist Commodity & Energy Strategy RoukayaI@bcaresearch.com 1 Reuters published an interesting analysis containing the apparently leaked information re the internal disputes in the Trump administration entitled "Trump's sanctions on Iran tested by oil-thirsty China, India" on October 29, 2018. 2 In the Commodity & Energy Strategy Weekly Report published January 25, 2018, we highlighted the risk to mine supply in 2018 on the back of an unusually large number of labor contract renegotiations taking place this year - representing ~ 5 mm MT worth of mined copper. Most noteworthy was the risk of a strike at the Escondida copper mine in Chile. These have been largely resolved with minimal impact on supply. Please see "Stronger USD, Slower China Growth Threaten Copper," available at ces.bcaresearch.com. 3 Please see BCA Research Commodity & Energy Strategy Weekly Report titled "Copper: A Break Out, Or A Break Down?" dated May 17, 2018. Available at ces.bcaresearch.com. 4 Please see BCA Research Geopolitical Strategy Special Report titled "China Sticks To The Three Battles," dated October 24, 2018. Available at gps.bcaresearch.com. 5 Please see BCA Research Global Investment Strategy Weekly Report "Chinese Stimulus: Not So Stimulating" dated October 26, 2018, available at gis.bcaresearch.com. 6 Please see BCA Research Commodity & Energy Strategy Weekly Report titled "Correlations Vs. USD Weaken," dated June 14, 2018. Available at ces.bcaresearch.com. Investment Views and Themes Recommendations Strategic Recommendations Tactical Trades Commodity Prices and Plays Reference Table
Copper Could Rally In The Short Term; Long-Term Fundamentals Less Bullish
Copper Could Rally In The Short Term; Long-Term Fundamentals Less Bullish
Trades Closed in 2018 Summary of Trades Closed in 2017
Copper Could Rally In The Short Term; Long-Term Fundamentals Less Bullish
Copper Could Rally In The Short Term; Long-Term Fundamentals Less Bullish