China

Highlights Economic data and policy announcements over the past month reflect the view that policymakers are serious about restraining credit growth, and that they will attempt to combat any weakness in external demand by boosting domestic consumption. A review of historical episodes of "outsized" investment intensity shows that policymakers have good reason to try and shift the composition of China's economy towards consumption, as it suggests that China's current experience probably cannot be sustained. A shift even somewhat away from heavy investment-led growth means that the "strike price" of the China put option has fallen relative to past economic slowdowns, implying that it will take more pain before investors can cash in. It is too soon to move towards an outright long position favoring domestic stocks, even though considerable bad news has been priced in. CNY-USD likely has further downside, and investors allocating among Chinese stocks should only favor domestic over investable equities in currency-hedged terms. Feature September's total social financing data, released earlier this month, provided important evidence supporting our view that Chinese policymakers are not aiming for a significant acceleration in private sector credit growth. Chart 1 highlights that the year-over-year growth rate of adjusted total social financing (TSF) actually ticked modestly lower in September, in clear contrast to the bet of many investors that China is following its "old stimulus rulebook". Chart 1Chinese Policymakers Are Not Pumping The Credit Taps
Chinese Policymakers Are Not Pumping The Credit Taps
Chinese Policymakers Are Not Pumping The Credit Taps
Some market participants have pointed to the fact that adjusted TSF is rising sharply on a 3-month annualized basis after adjusting for seasonality (Chart 2), and have concluded from this fact that a sustained expansion in credit growth is forthcoming. However, Chart 3 illustrates that the pickup shown in Chart 2 is due to a surge in special local government bond issuance, which reflects front-loading of fiscal spending. Financial news outlets have reported that "provincial authorities had by the end of September already raised 92 percent of the 1.35 trillion yuan ($195 billion) worth of special infrastructure bonds that the central government has targeted for the entire year",1 implying that local government bond issuance in Q4 will drop off significantly relative to the past three months. Chart 2A Near-Term Pickup...
A Near-Term Pickup...
A Near-Term Pickup...
Chart 3...Caused By Front-Loaded Fiscal Spending
...Caused By Front-Loaded Fiscal Spending
...Caused By Front-Loaded Fiscal Spending
The September credit data aside, we acknowledge that there have been several small-scale stimulus announcements from the Chinese government over the past month. But the bottom line for now is that developments over this period reflect the view that policymakers are serious about restraining credit growth, and that they will attempt to combat any weakness in external demand by boosting domestic consumption.2 Restraining Credit Growth: Wisdom Or Folly? China's unwillingness to resort to a significant acceleration in credit growth to help stabilize its economy has surprised some investors, and raised criticism in some corners that the country is making a policy mistake. A recurring argument in this vein, particularly among perennial China bulls, is that policymakers should not be concerned about China's elevated levels of private sector debt because it is the natural and inevitable result of a high savings rate. According to this view, restraining credit growth and attempting to boost consumption merely dooms China's ability to escape the middle-income trap, because higher per capita income can only be achieved by further growth in the stock of capital. BCA's China Investment Strategy service does not dispute the notion that a high savings rate can lead to a high leverage ratio, particularly among small, fast-growing economies. But in the case of China, the sharp rise in private sector debt that has occurred since 2010 was not natural, and certainly was not inevitable. Instead, our view is that it was the result of an explicit "least-bad" choice made by policymakers to weather the reality of poor external demand following the global financial crisis. Chart 4 presents, in a nutshell, the theoretical support for the "keep investing" view. The chart depicts real per capita GDP for 80 countries in 2014 as a function of the average share of gross capital formation to GDP from 1960 to 2014. The chart clearly shows that richer countries today have tended to invest more on average in the past, which is entirely consistent with textbook economic theory. Chart 4Higher Investment Has Led To Higher Per Capita GDP Growth...
Is China Making A Policy Mistake?
Is China Making A Policy Mistake?
However, there are two reasons why the simple inference from Chart 4 that China should just "keep investing" is deeply flawed. First, while investment as a share of GDP in China has recently declined from its 2011-2014 peak, it remains close to 45%. This is a massive rate of investment, and a historical review points to the conclusion that it probably cannot be sustained: 45% is nearly off the x-axis scale shown in Chart 4, suggesting that China's current rate of investment is not achievable over extended periods of time. In fact, the chart suggests that 30% is the highest realistic rate of investment as a share of GDP that a country can maintain over an extended period. In 2014, based on the definition of the data from the Penn World Table (GDP share of gross capital formation at current purchasing power parity), China had maintained its investment share above 30% for 12 years. At first blush, there appears to be some precedent suggesting that China's outsized investment run can go on for longer: among the 80 countries included in Chart 4, 14 of them have experienced a longer continuous run of investment as a share of GDP. However, Chart 5 shows that most of these experiences occurred in the 1960s and 1970s, when global exports as a share of GDP were rising from a very low base. This implies that historical examples of outsized investment runs have largely reflected export-driven catch-up stories, which bodes poorly for China's ability to continue to invest at its recent massive scale given that global exports to GDP appear to have peaked. Chart 5...But Very High Rates Of Investment Have Driven By Exports
...But Very High Rates Of Investment Have Driven By Exports
...But Very High Rates Of Investment Have Driven By Exports
Second, the relationship shown in Chart 4 captures the potential gains of profitable and rational investment, or in other words the accumulation of a "useful" stock of capital. But an unfortunate reality facing savers is that while one can choose to save or invest, one cannot necessarily choose the accompanying rate of return. If China invests heavily at very low or negative rates of return, the idea that investment will lead China out of the middle-income trap is very likely wrong. As we have discussed in previous reports, there is good evidence to suggest that the marginal gains from investment in China have been falling. The private sector debt-to-GDP ratio features prominently in the case against profitable investment in China: despite a massive rise in investment and debt from 2002-2007, the private sector debt-to-GDP ratio barely rose, because this debt was used to accumulate capital that verifiably delivered nominal GDP growth. Yet following 2010 the ratio rose sharply, implying that the returns from the investment that has taken place over the past decade have been (at least so far) considerably lower than those of the prior decade. Also, we noted in our August 29 Special Report that state-owned enterprises (SOEs) have accounted for a sizeable portion of the private sector leveraging that occurred after 2010,3 and that the marginal operating gain from debt for SOEs has become negative (Chart 6). A gap between the cost/return on borrowed funds strongly implies that the investment channeled through SOEs over the past several years does not represent, on balance, the accumulation of useful capital. Chart 6Strong Evidence Against Productive SOE Investment
Strong Evidence Against Productive SOE Investment
Strong Evidence Against Productive SOE Investment
In our view, a cohesive story emerges from the above analysis, one that counters the view that China is making a policy mistake by trying to avoid another significant episode of private sector leveraging. China's enormous catchup in per capita GDP over the past 20 years was initially export-led, but was sustained after 2010 by quasi-fiscal spending in the form of a material leveraging of state-owned enterprises. This shadow government spending was aimed at preventing large-scale job losses, but proved to be considerably less productive than the private, export-driven investment-boom that preceded it. This suggests that China is simply investing too much for an economy that needs to accumulate capital for the purposes of domestic production, and that any further, aggressive leveraging of the private sector will simply raise the odds or the cost of the eventual bailout. While investors who are hoping to profit from China's credit excesses may wish for a different outcome, the bottom line is that Chinese policymakers will act in the best interests of their country, and they have good reason to try and shift China's economy away from extremely high rates of investment towards more consumption. Implications For Investment Strategy As would be the case in any other major country, we have no doubt that Chinese policymakers will eventually move to a maximum reflationary stance (which would imply a significant reacceleration in credit growth) if they feel that the existing slowdown will lead to deep, threatening economic instability. The key point for investors is that a desire of policymakers to shift even somewhat away from heavy investment-led growth means that the "strike price" of the China put option has fallen relative to past economic slowdowns, implying that it will take more pain before investors can cash in. Within the universe of Chinese financial assets, there are three pertinent investment strategy questions that arise from this reality: Even if there is more pain to come, Chinese domestic stocks have fallen 30% in local currency terms, and close to 40% in U.S. dollar terms (Chart 7). Is it time to go outright long? Should investors allocating among Chinese stocks favor domestic or investable equities? What is the outlook for CNY-USD? For now, our answers are as follows: 1) not yet, 2) domestic over investable in currency-hedged terms, and 3) weaker (possibly significantly so). Chart 7The Bear Market In A-Shares Is Advanced...
The Bear Market In A-Shares Is Advanced...
The Bear Market In A-Shares Is Advanced...
We agree that 30% is a reasonable estimate of the likely decline in domestic earnings over the coming year, which normally would suggest that A-shares have fully priced the bad news and that investors should consider buying. However, there are two key reasons why we think this conclusion is premature: We noted in our September 19 Weekly Report that the lesson of 2014/2015 was Chinese stocks needed both policy stimulus and earnings clarity before bottoming.4 For now, China's stimulative response has been measured, and we have yet to see any decline in domestic 12-month forward earnings (Chart 8). While it is not the only factor contributing to the decline, the escalation in the trade war with the U.S. acted as a clear negative catalyst for the Chinese stock market. We have argued that the evolution of the trade positions of both sides suggests that the imposition of a third and final round of import tariffs covering all Chinese exports to the U.S. is likely, which would further reduce Chinese earnings visibility for investors. News reports this week suggested that an announcement to this effect could occur in early-December, if a meeting between Presidents Trump and Xi is called off or fails (as we expect). Chart 8...But Forward EPS Have Yet To Start Falling
...But Forward EPS Have Yet To Start Falling
...But Forward EPS Have Yet To Start Falling
Chart 9 presents our framework for forecasting CNY-USD as a function of various U.S. import tariff scenarios, which we used to argue that a break above the psychologically-important level of 7 for USD-CNY appeared likely barring strong action from the PBOC4. The RMB has weakened in line with our view over the past month, and Chart 9 shows that it stands to weaken further, potentially significantly, if the U.S. does move ahead with a 25% import tariff on all imports from China. Chart 9Further Downside In CNY-USD Is Likely
Further Downside In CNY-USD Is Likely
Further Downside In CNY-USD Is Likely
Finally, our negative outlook for the currency informs our view that a relative position favoring domestic over investable stocks should be currency-hedged. Chart 10 shows that an uptrend in relative performance does appear to be forming in local currency terms, but not in U.S. dollar terms (due to the recent renewed weakness in CNY-USD). Chart 10Relative To Investable Stocks, Only Favor A-Shares In Hedged Terms
Relative To Investable Stocks, Only Favor A-Shares In Hedged Terms
Relative To Investable Stocks, Only Favor A-Shares In Hedged Terms
We opened a shadow trade in our July 5 Weekly Report of being long the MSCI China A Onshore index / short MSCI China index,5 which we said we would consider implementing in response to a 5% rally in relative performance. Our intention was to structure this trade in unhedged terms (consistent with most of the trades in our trade book), and our judgement is that it is simply too early to do so despite the fact that a 5% relative rise in U.S. dollar terms has indeed occurred. Signs of a durable bottom in CNY-USD, or an assessment of minimal further downside coupled with strong outperformance of domestic stocks in local currency terms, are likely catalysts for a green light. Jonathan LaBerge, CFA, Vice President Special Reports jonathanl@bcaresearch.com 1 "China Is Struggling To Find Projects To Spend Bond Splurge On", Bloomberg News, October 22, 2018. 2 Pease see China Investment Strategy Special Reports "China: How Stimulating Is The Stimulus?", dated August 8, 2018, and "China: How Stimulating Is The Stimulus? Part Two", dated August 15, 2018, available at cis.bcaresearch.com. 3 Pease see China Investment Strategy Special Report "Chinese Policymakers: Facing A Trade-Off Between Growth And Leveraging", dated August 29, 2018, available at cis.bcaresearch.com. 4 Pease see China Investment Strategy Weekly Report "Investing In The Middle Of A Trade War", dated September 19, 2018, available at cis.bcaresearch.com. 5 Pease see China Investment Strategy Weekly Report "Standing On One Leg", dated July 5, 2018, available at cis.bcaresearch.com. Cyclical Investment Stance Equity Sector Recommendations
If the Chinese government were to deliver a massive dose of traditional fiscal/credit easing, this would boost fixed-asset investment and thus commodity prices, helping emerging markets in the process. Such a dollop of stimulus would also lift global growth.…
Question: Why are financial markets rioting, even though China has announced stimulus? Answer: The market’s interpretation is that Chinese stimulus measures adopted thus far are insufficient to reverse China’s growth outlook in the near term. We agree with…
Highlights The correction in global equities is not yet over, but we would turn more constructive if stocks retreated about 6% from current levels. Among the many things bothering investors, the fate of the Chinese economy remains high on the list. Chinese growth continues to slow, with the impact of the trade war yet to be fully felt. Investors are likely to end up being disappointed by both the size and the composition of Chinese stimulus. High debt levels and excess capacity limit the prospective benefits of traditional fiscal/credit easing. Stimulus measures aimed at boosting consumption, which is what the authorities are increasingly focusing on, would help the Chinese economy. However, they would generate only small gains for the rest of the world. A weaker yuan would be outright negative for other economies. Cyclically and structurally, we expect the bond bear market to continue, but slower Chinese growth and a stronger dollar could temporarily cap Treasury yields over the coming months. Feature Correction Slightly More Than Halfway Through We argued in our October 5th report that "prudent investors should consider scaling back risk if they are currently overweight risk assets" because the market was at an elevated risk of a "phase transition" from unbridled optimism to a more sober appreciation of the risks presently facing the global economy.1 The good news is that the ongoing correction will be just that, a correction. Both monetary and fiscal policy in the U.S. remain highly accommodative. The next recession will not occur until late-2020 at the earliest. U.S. equities, which account for over half of global stock market capitalization, rarely enter sustained bear markets outside of recessions (Chart 1). Chart 1Recessions And Bear Markets Usually Overlap
Recessions And Bear Markets Usually Overlap
Recessions And Bear Markets Usually Overlap
The bad news is that we have yet to reach a capitulation point. As we noted last week, corrections usually end when investors stop believing that they are witnessing a correction and start thinking that a bear market is afoot.2 Normally, stocks need to break through prior support levels several times before "buy the dip" investors throw in the towel. This week saw the S&P 500 fall below its October 11th lows. A few more iterations of this pattern may be necessary. To repeat what we wrote before, barring any major new developments, we would turn bullish on global equities again if the MSCI All-Country World Index were to fall by 12% 10% 8% 6% from current levels. With that in mind, we are putting in a limit order to buy the ACWI ETF at $64.3 Emerging Markets: Time To Pay The Piper Even if we were to turn more positive on global equities, we would maintain our preference for developed market stocks over emerging markets, despite the latter's higher beta nature. The wave of liquidity created by the Fed and other major central banks over the past decade ended up flowing into places where it was not needed. Emerging markets were a prime destination: Dollar-denominated debt in emerging markets now stands at levels reached just before the late-1990s Asian Crisis (Chart 2). Chart 2EM Dollar Debt At Late-1990s Levels
EM Dollar Debt At Late-1990s Levels
EM Dollar Debt At Late-1990s Levels
While EM valuations have cheapened considerably, they are not yet at washed out levels. The latest BofA Merrill Lynch Global Fund Manager Survey showed that managers were slightly net overweight emerging market equities in October. This is a far cry from 2015, when a net 30% of managers were underweight EM stocks. Chinese Stimulus To The Rescue? China figures heavily into the equation. If the Chinese government were to deliver a massive dose of traditional fiscal/credit easing, this would boost fixed-asset investment and thus commodity prices, helping emerging markets in the process. Such a dollop of stimulus would also lift global growth. As a countercyclical currency, the U.S. dollar tends to weaken when global growth accelerates (Chart 3). The reflationary impulse from higher commodity prices and a softer dollar would be manna from heaven for emerging markets. Chart 3Decelerating Global Growth Tends To Be Bullish For The Dollar
Decelerating Global Growth Tends To Be Bullish For The Dollar
Decelerating Global Growth Tends To Be Bullish For The Dollar
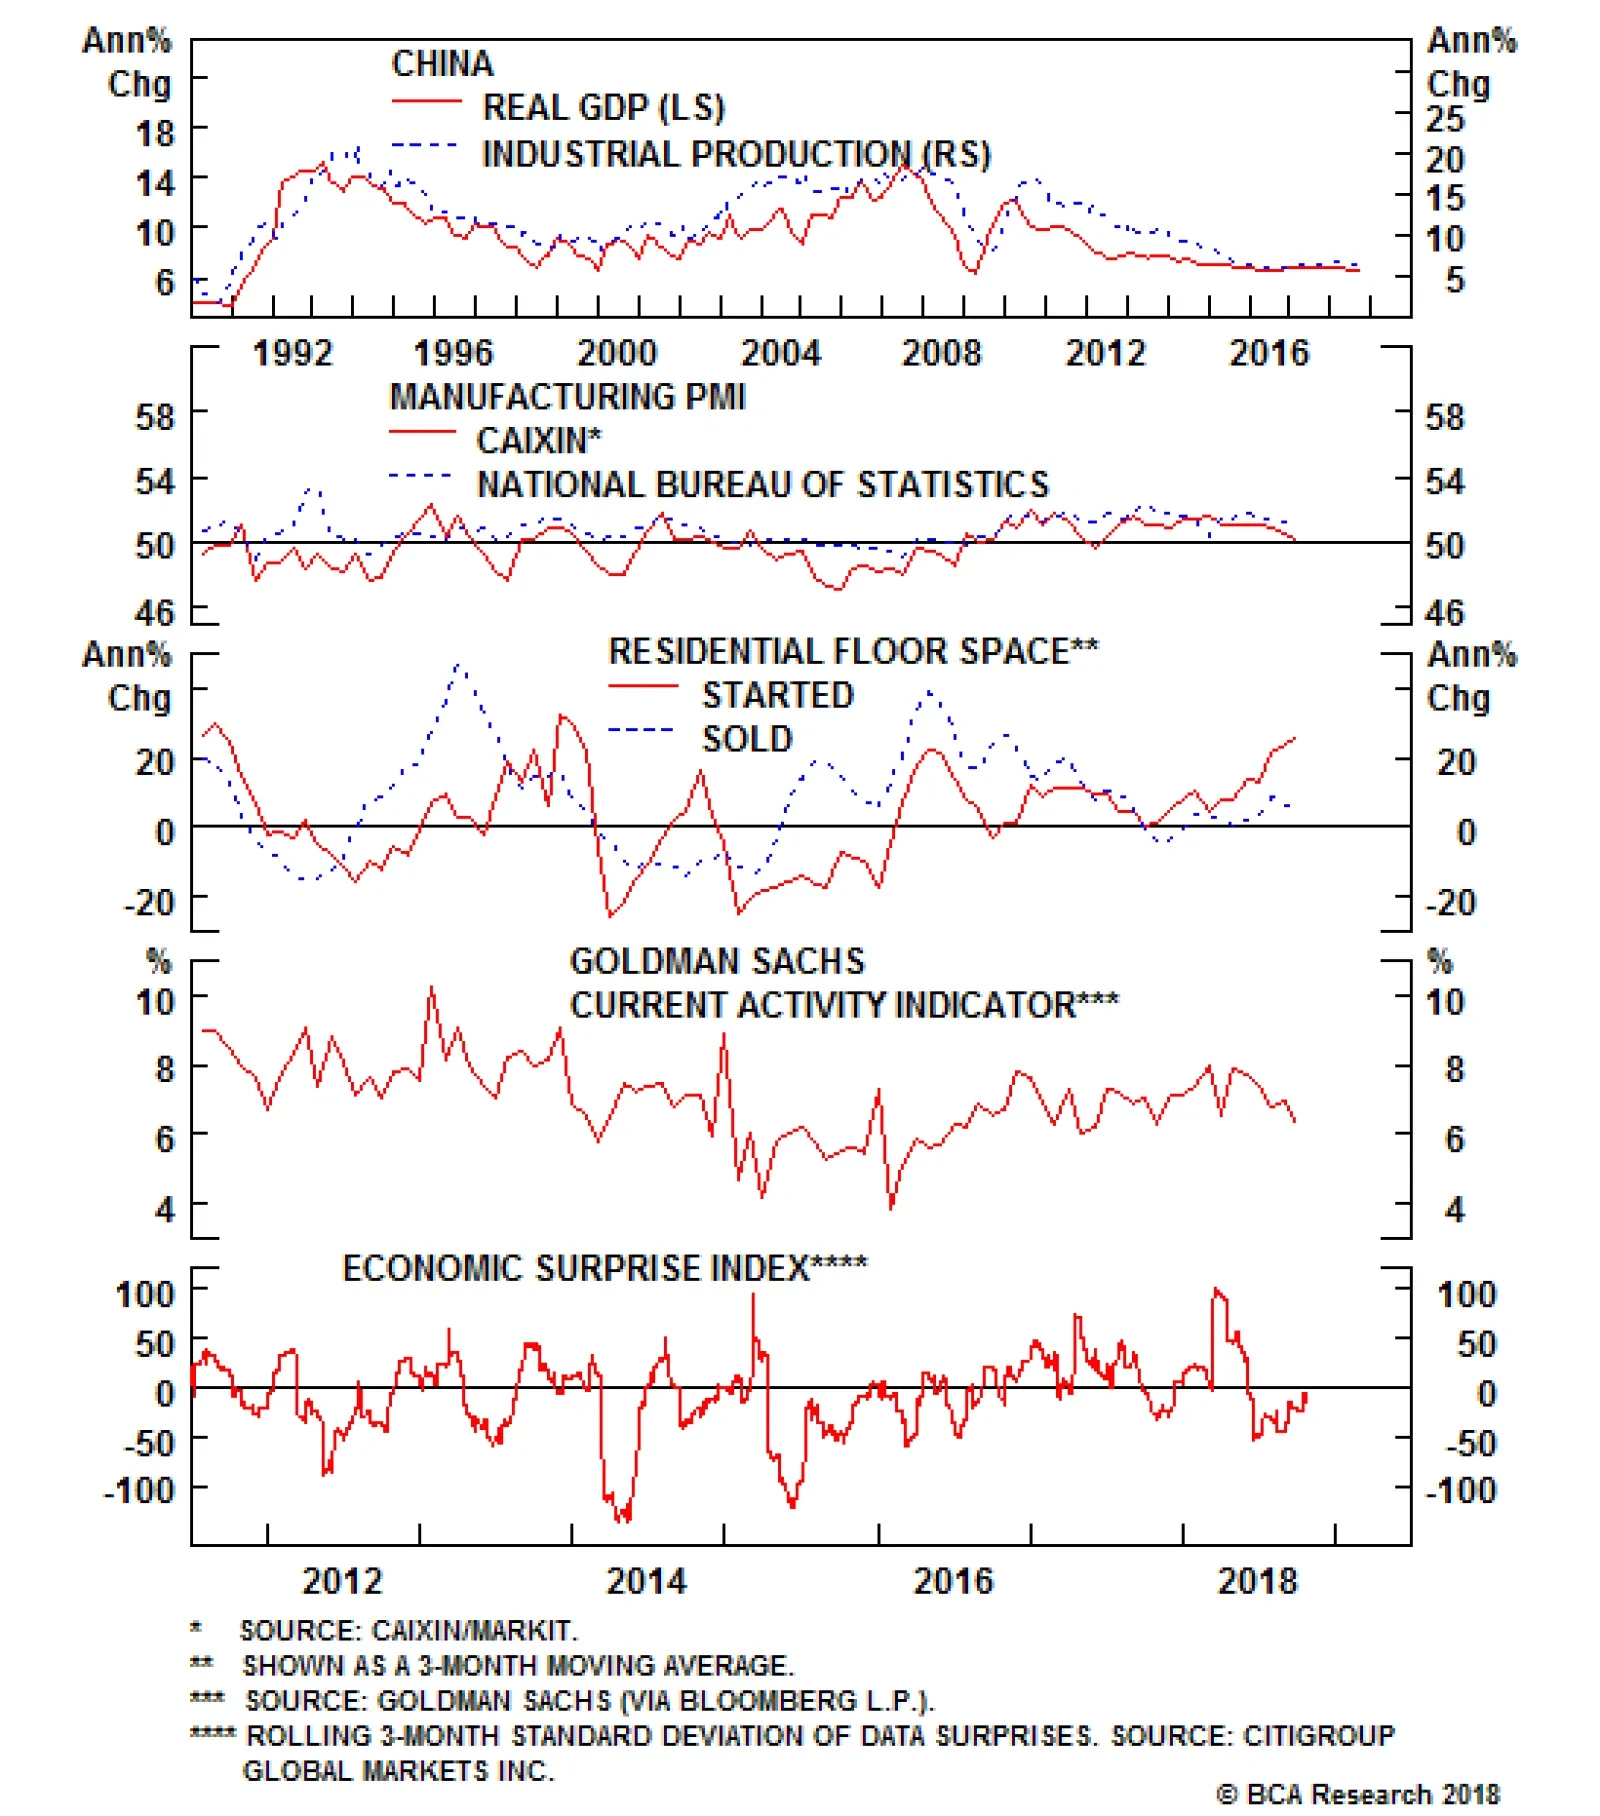
If we had strong confidence that such a burst of stimulus were forthcoming, we would be comfortable in calling the end of the global stock market correction now and going overweight EM assets. Unfortunately, the evidence so far suggests that while the Chinese authorities are stimulating the economy, they are not doing so by enough to reignite growth (Chart 4). Chart 4Chinese Growth Remains Soft
Chinese Growth Remains Soft
Chinese Growth Remains Soft
Real GDP increased at a weaker-than-expected pace in the third quarter. Industrial production surprised on the downside in September, echoing declines in the manufacturing PMI. Home sales are running well below housing starts, suggesting downside risk for the latter in the months ahead. Goldman's China Current Activity Indicator has continued to grind lower, while the economic surprise index remains mired in negative territory. Our conversations with clients suggest that most are expecting the recently announced stimulus measures to arrest and then reverse the downward trend in growth. We are not so sure. As our geopolitical team has stressed, the Chinese government has expended a lot of political capital on its reform agenda.4 Abandoning it now would not only cause the government to lose credibility, but it would undermine the very reasons it was implemented in the first place. Waves of stimulus have caused total debt to soar from 140% of GDP in 2008 to 260% of GDP at present (Chart 5). Since most of the new credit has been used to finance fixed-asset investment, China has ended up with a severe overcapacity problem. The rate of return on assets in the state-owned corporate sector has fallen below borrowing costs (Chart 6). Our China team estimates that 15%-to-20% of apartments are sitting vacant.5 Chart 5China: Debt And Capital Accumulation Went Hand In Hand
China: Debt And Capital Accumulation Went Hand In Hand
China: Debt And Capital Accumulation Went Hand In Hand
Chart 6Rate Of Return On Assets Below Borrowing Costs For Chinese SOEs
Rate Of Return On Assets Below Borrowing Costs For Chinese SOEs
Rate Of Return On Assets Below Borrowing Costs For Chinese SOEs
Today, Chinese banks are being told that they must lend more money to support the economy, while ensuring that their loans do not sour. This has become an impossible feat. As such, we are skeptical that the recent acceleration in credit growth will have long legs (Chart 7). Anecdotal evidence suggests that some companies which are receiving credit are simply holding on to the cash, rather than running the risk of being accused of investing in money-losing projects. Monetary policy in China is increasingly pushing on a string. Chart 7China: Only A Modest Acceleration In Credit Growth
China: Only A Modest Acceleration In Credit Growth
China: Only A Modest Acceleration In Credit Growth
Rebalancing: Be Careful What You Wish For This does not mean that China will not try to prop up its economy. It will. But the form of stimulus the government pursues may not be to foreign investors' liking. For example, consider the recently announced income tax reforms, which raise the threshold at which households need to start paying taxes while increasing deductions for education, health, housing, and eldercare. In and of themselves, these measures are admirable and long overdue. The Chinese income tax system is fairly regressive. Poor households face an effective income tax rate exceeding 40%. This is well above OECD norms (Chart 8).6 A more progressive tax system would boost consumption among poorer households. Chart 8High Tax Burden For Low-Income Households In China
Chinese Stimulus: Not So Stimulating
Chinese Stimulus: Not So Stimulating
The snag is that raw materials and capital goods comprise 85% of Chinese imports. As Arthur Budaghyan, BCA's Chief EM strategist, has long noted, policies that boost Chinese consumption are simply less beneficial to the rest of the world than policies that boost investment.7 Pundits who talk about the virtue of "rebalancing" the Chinese economy away from fixed-asset investment and towards consumer spending should be careful what they wish for! The Trade War Will Heat Up One of the more notable aspects of China's recent slowdown is that it has been concentrated in domestic demand rather than in net exports. Remarkably, Chinese exports to the U.S. actually increased by 12% in dollar terms in the first nine months of the year, compared to the same period in 2017. However, judging from the steep drop in the export component of both the official and private-sector Chinese manufacturing PMI, the export sector is likely to come under increasing pressure over the next few quarters as the headwinds from higher tariffs fully manifest themselves (Chart 9). Chart 9China: An Ominous Sign For Exports
China: An Ominous Sign For Exports
China: An Ominous Sign For Exports
Investors hoping that U.S. President Donald Trump and his Chinese counterpart Xi Jinping will reach a deal to end the trade war on the sidelines of the G20 leaders' summit in Buenos Aires on November 29 are likely to be disappointed. As we have stressed in the past, Trump's fiscal policy is completely inconsistent with his trade agenda. Fiscal stimulus in a full-employment economy will suck in imports. It will also force the Fed to raise rates more aggressively than it otherwise would, leading to a stronger dollar. The result will be a larger trade deficit. Trump will not be able to blame Canada or Mexico for a deteriorating trade position because he just signed a "big, beautiful" trade agreement with them (incidentally, the new USCAM USMCA agreement is remarkably similar to the "horrible" one that it replaced with the notable exception that it contains a clause barring Canada and Mexico from negotiating bilateral trade deals with China). This means Trump needs a patsy who will take the blame for America's burgeoning trade deficit. Reaching a deal with China would actually be a strategic mistake for Trump's political career. A Weaker RMB Ahead A weaker Chinese currency would blunt some of the pain inflicted on China's export sector from Trump's tariffs. There is obviously a limit to how far China can let its currency slide, but last week's decision by the U.S. Treasury to refrain from labeling China a currency manipulator will probably embolden the Chinese to allow the currency to depreciate some more from current levels.8 A weaker Chinese currency would be a cold shower for the rest of the world. Not only will it make other economies less competitive in global markets; it will also reduce Chinese imports. Concluding Thoughts Investors spend a lot of time debating the magnitude of China's stimulus plans and not enough time thinking about the composition of that stimulus. Credit/fiscal easing of the sort China has historically engaged in is good for other emerging markets because it sucks in raw materials and capital goods. In contrast, consumption-based stimulus is only modestly beneficial to the rest of the world, while a weaker Chinese currency is an outright negative for other economies. If China focuses more on the latter two types of stimulus and less on the former, global investors are likely to be disappointed. Emerging market assets have cheapened considerably over the past few months and will likely find a bottom in the first half of next year. For now, however, investors should overweight developed market stocks relative to their EM peers. Consistent with our July 5, 2016 call declaring "The End Of The 35-Year Bond Bull Market," both the cyclical and structural trend in bond yields is firmly to the upside. Tactically, however, bonds are deeply oversold (Chart 10). The combination of slower EM growth, disappointments over the magnitude and composition of Chinese stimulus, and a stronger dollar will put a lid on yields over the next few months. Chart 10Treasurys Are Oversold
Treasurys Are Oversold
Treasurys Are Oversold
Peter Berezin, Chief Global Strategist Global Investment Strategy peterb@bcaresearch.com 1 Please see Global Investment Strategy Weekly Report, "The Next U.S. Recession: Waiting For Godot?" dated October 5, 2018. 2 Please see Global Investment Strategy Weekly Report, "Phase Transitions In Financial Markets: Lessons For Today," dated October 19, 2018. 3 Valid during extended trading hours. 4 Please see Geopolitical Strategy and China Investment Strategy Special Report, "How Stimulating Is The Stimulus? Part Two," dated August 15, 2018. 5 Please see Emerging Market Strategy Special Report, "China Real Estate: A Never-Bursting Bubble?" dated April 6, 2018. 6 Please see Global Investment Strategy Special Report, "Is China Heading For A Minsky Moment?" dated April 13, 2018. 7 Please see Emerging Markets Strategy Weekly Report, "The Dollar Rally And China's Imports," dated May 24, 2018. 8 Ironically, while China may not be manipulating its currency based on the Treasury's legal definition, economic logic suggests it is. True, China is no longer buying dollars in a bid to weaken the yuan. In fact, its reserves have actually declined significantly since 2015. However, the value of the yuan is determined not just by current dollar purchases; it is also determined by those that have taken place in the past. If a central bank buys dollars, this bids up the value of those dollars relative to its own currency. If it then stops buying dollars, its currency does not instantly fall back to its original level. All things equal, it just stays where it is. The best parallel is with quantitative easing. Both theory and evidence suggest that it is the stock of bonds that a central bank owns, rather than the flow of bonds in and out of its balance sheet, that determines the level of yields. Strategy & Market Trends Tactical Trades Strategic Recommendations Closed Trades
We have now had two months of full data – August and September – since China’s top leaders announced in late July that they would ease economic policy. The data show that there has not been a major acceleration in total private credit growth. This is based on…
Getting the Chinese economy forecast right requires getting the Chinese credit forecast right, as the latter has been a consistent driver of the former since 2010 (see chart). And getting the Chinese credit forecast right requires getting the Chinese policy…
Highlights Policy easing is a necessary but not sufficient condition for a bottom in the business cycle. For monetary easing to become effective, there should be loan demand, banks should be willing to lend, and businesses and consumers should be keen to spend more. In China, risks to both the money multiplier and the velocity of money are to the downside. This will hinder the effectiveness of monetary policy easing in generating economic growth. Eroding business and consumer confidence in China will - for now - negate the budding improvement in its broad money impulse. Emerging markets risk assets and currencies are set to drop further. Stay put. Feature The selloff in EM and Chinese stocks has begun to weigh heavily on DM share prices. The global equity index has broken below its January lows, entailing further downside. Importantly, global cyclical equity sectors such as global industrials, materials and semiconductors are underperforming, and are breaking down in absolute terms. This confirms global trade is in a full downturn swing (Chart I-1). Chart I-1Global Trade Is Decelerating
Global Trade Is Decelerating
Global Trade Is Decelerating
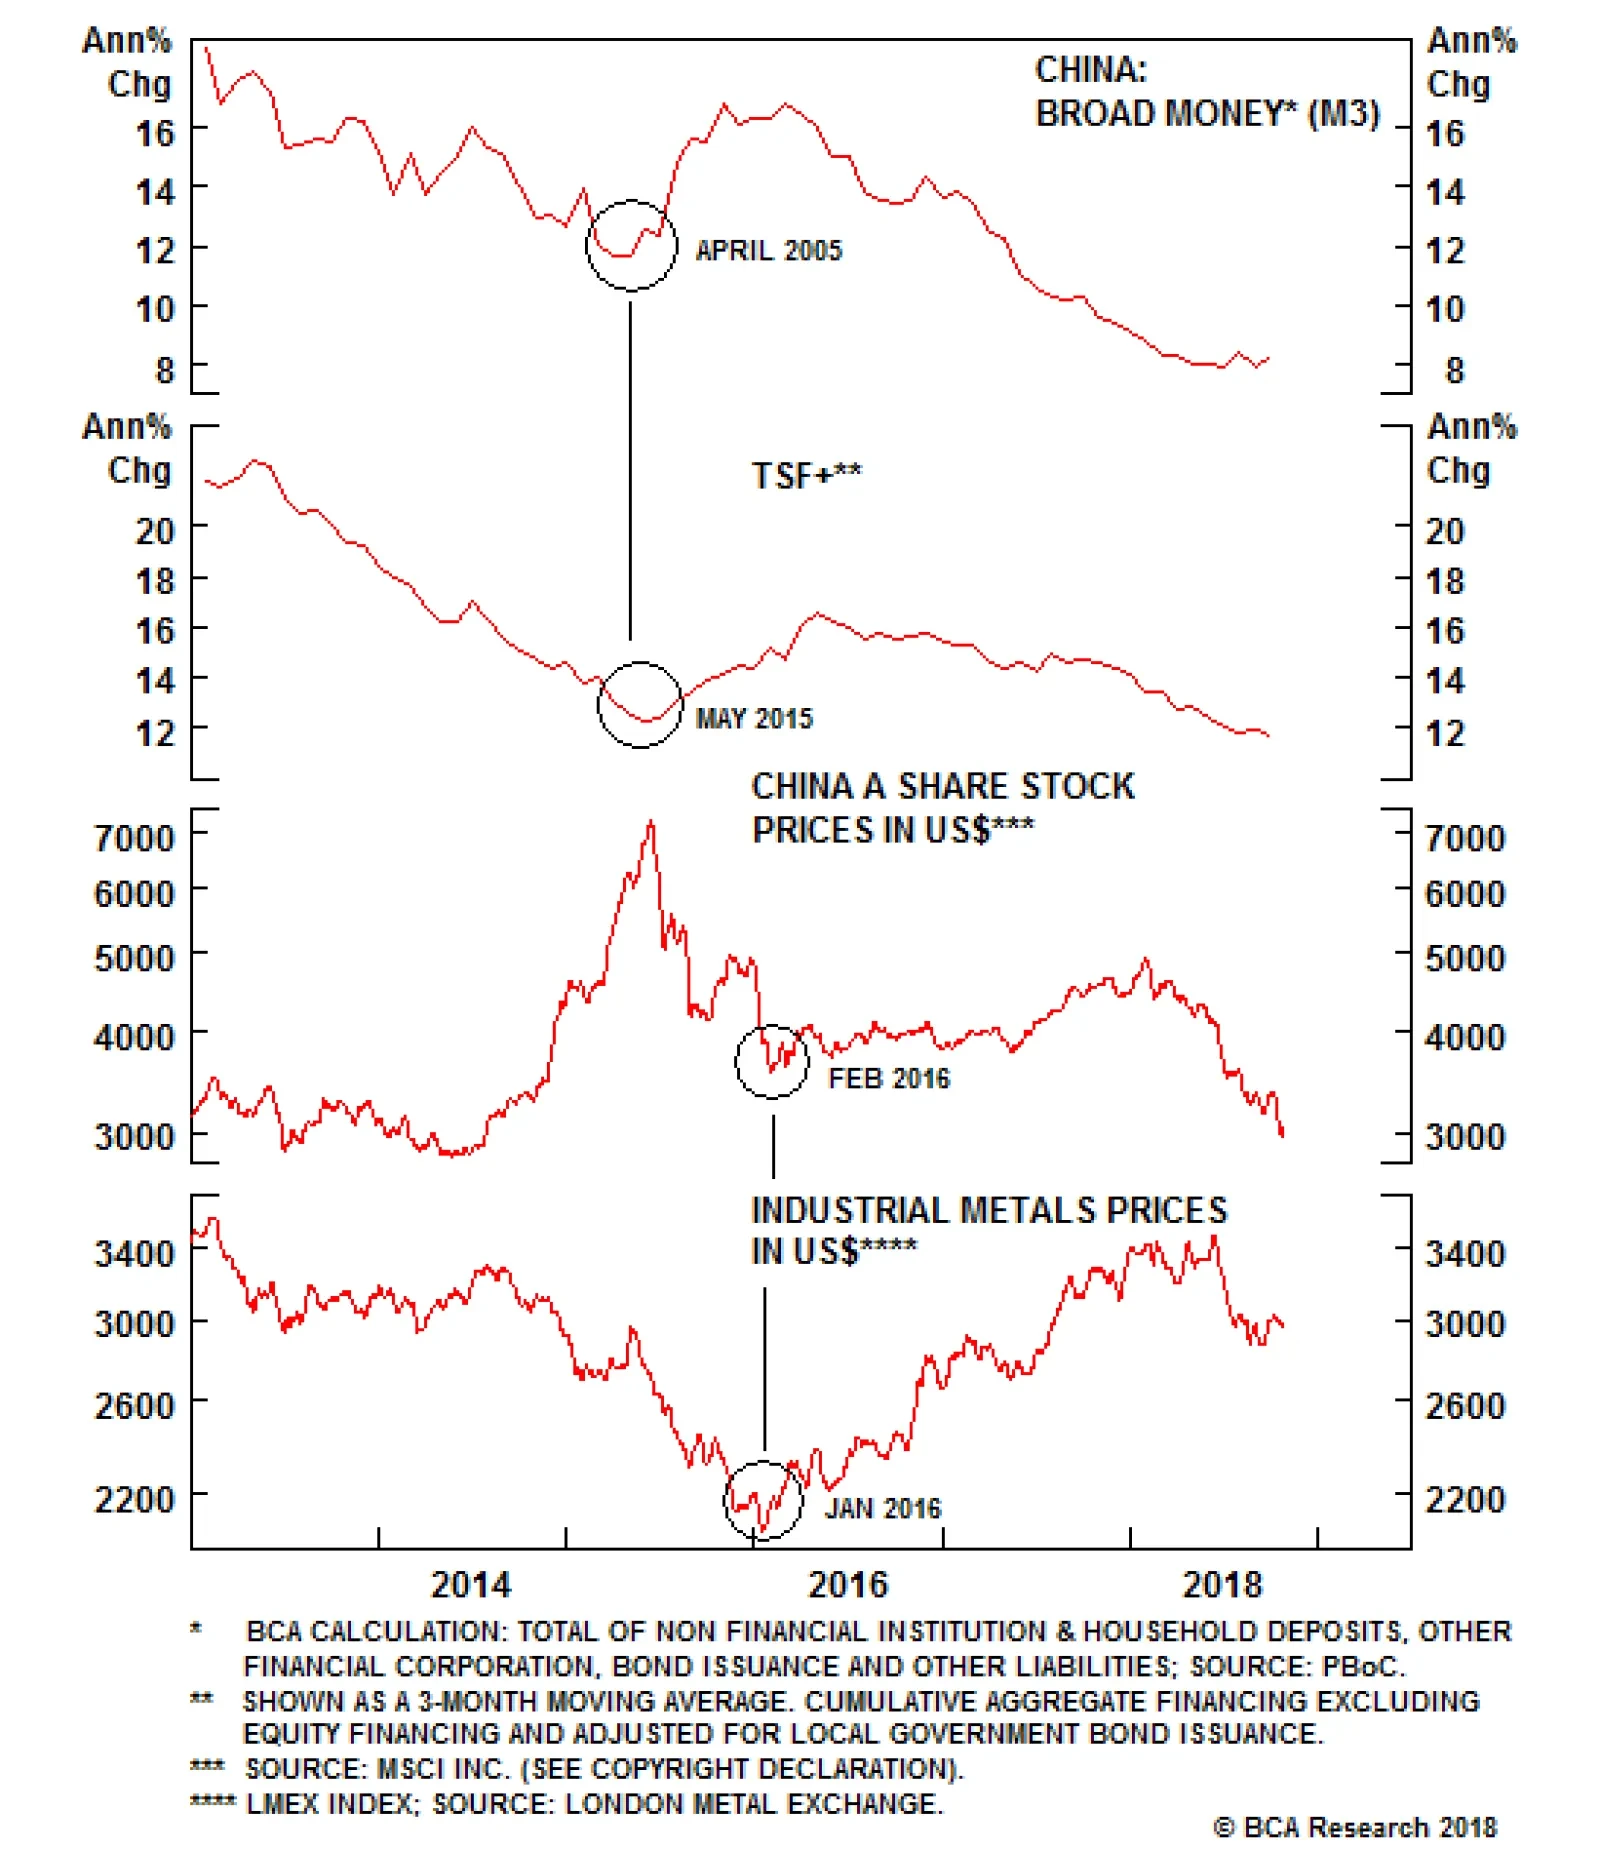
What is required to turn around this global trade slowdown? Our bias is that this growth slump has roots in China/EM and trade tensions are dampening business and investor sentiment on top of that. Consequently, a reversal in the equity selloff is largely contingent on an improvement in China's economy. It is in this context that we devote this week's report to an extensive discussion surrounding the issues of policy stimulus, deleveraging and growth in China. In this report, we answer the questions we think are most pertinent to investors at this moment. Question: Why are financial markets rioting, even though China has announced stimulus? Answer: The market's interpretation is that these stimuli are insufficient to turn around China's business cycle immediately. We agree with this assessment. Policy easing does not always immediately translate into higher share prices and improving growth. For example, amid China's 2015 stock market crash, the Chinese authorities began aggressively stimulating in the middle of 2015, yet Chinese and global markets continued to riot until February 2016 (Chart I-2). Chart I-2China In 2015: Money Growth Preceded Bottom In Markets By Seven Months
China In 2015: Money Growth Preceded Bottom In Markets By Seven Months
China In 2015: Money Growth Preceded Bottom In Markets By Seven Months
Indeed, there was a period of seven months when EM and DM stocks plummeted, despite on-going and very aggressive policy easing in China. In short, these stimulus measures did not preclude a considerable drawdown in global and EM share prices. Outside China, there have been other examples where policy easing did not preclude a full-fledged bear market. For instance, in 2001-'02 and 2007-'08, the Federal Reserve was cutting interest rates aggressively, yet the bear market in U.S. equities did not reverse (Chart I-3). Chart I-3AFed's Easing Did Not Prevent Equity Bear Market
Fed's Easing Did Not Prevent Equity Bear Market
Fed's Easing Did Not Prevent Equity Bear Market
Chart I-3BFed's Easing Did Not Prevent Equity Bear Market
Fed's Easing Did Not Prevent Equity Bear Market
Fed's Easing Did Not Prevent Equity Bear Market
Similarly, the ECB was expanding its balance sheet from the onset of the euro area debt crisis in 2011, yet the region's share prices did not bottom until the middle of 2012, 12 months later (Chart I-4). Chart I-4ECB Balance Sheet Expansion Did Not Prevent Equity Bear Market
ECB Balance Sheet Expansion Did Not Prevent Equity Bear Market
ECB Balance Sheet Expansion Did Not Prevent Equity Bear Market
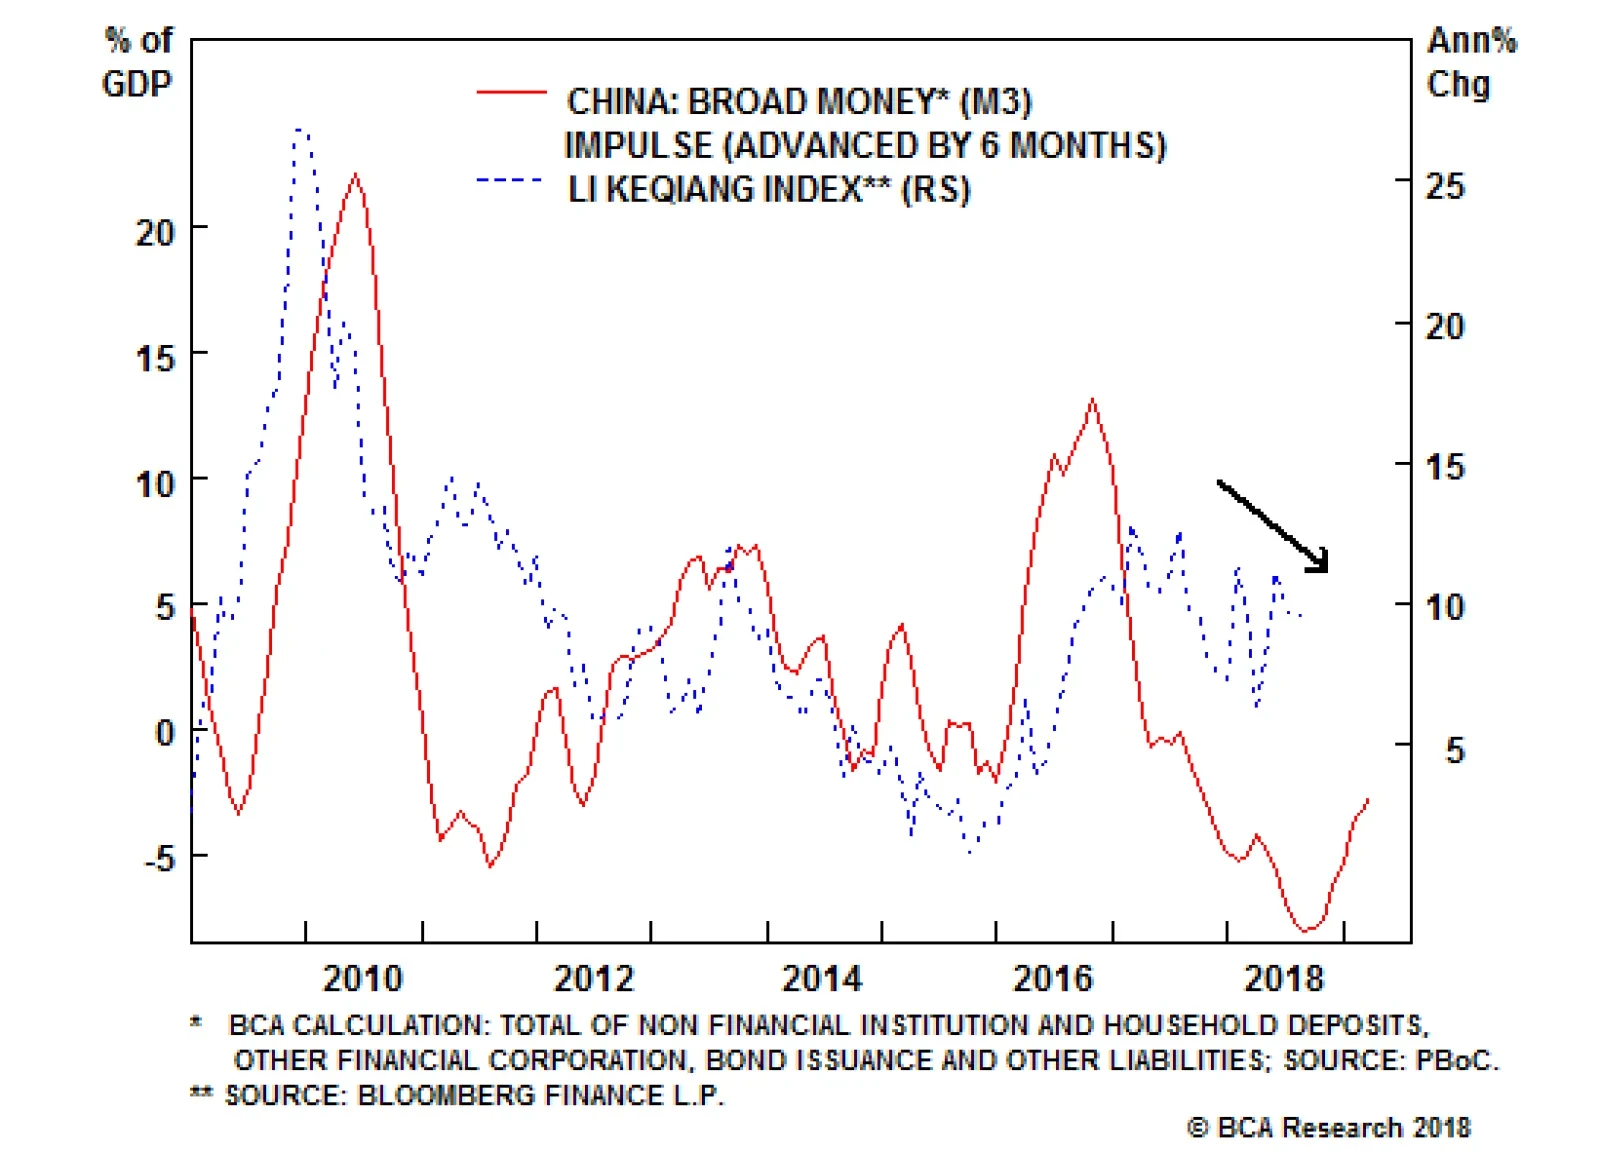
Question: It is clear there could be a time lag between policymakers stimulating and financial markets and the business cycle turning the corner. What is causing these time lags, and how should one handicap them? Answer: Indeed, monetary and fiscal policies affect the economy with time lags. These lags vary from cycle to cycle. In China, the broad money impulse has improved of late (Chart I-5). Historically, this has led the mainland's business cycle by about nine months on average. Hence, it signifies a tentative bottom early next year. Chart I-5China: Money Impulse Has Bottomed
China: Money Impulse Has Bottomed
China: Money Impulse Has Bottomed
The credit impulse, however, has not improved at all (Chart I-6). The current divergence between credit and money impulses is due to a plunge in shadow (non-bank) credit (Chart I-7). The distinction between broad money and credit is as follows: money is originated by commercial banks when they lend to or acquire an asset from non-banks. Meanwhile, total credit also includes lending and bond purchases by non-banks. Chart I-6China: Credit Impulse Has Not Yet Bottomed
China: Credit Impulse Has Not Yet Bottomed
China: Credit Impulse Has Not Yet Bottomed
Chart I-7Bank And Non-Bank Credit Have Diverged
Bank And Non-Bank Credit Has Diverged
Bank And Non-Bank Credit Has Diverged
Importantly, money/credit fluctuations are not the sole factors that generate swings in economic activity. Companies' and households' willingness to consume and invest matter too. We have written extensively in the past that changes in the velocity of money mirror fluctuations in the marginal propensity to consume and invest.1 Technically speaking, nominal GDP growth is a product of money growth and change in the velocity of money. Nominal GDP = Money Growth x Velocity Of Money When a decline in the velocity of money - stemming from eroding business and consumer confidence - overwhelms an acceleration in money growth, economic growth weakens, despite improvement in the money impulse. Notably, money and credit have led previous business cycles in China by varying time periods. In other words, the velocity of money has not been constant on the mainland. In particular, both the money and credit impulses were early - by about 12 months - in forecasting a growth slowdown in China and global trade at the beginning of 2017. The reason why a growth slowdown did not commence at that time was due to the surge in the velocity of money. The latter is akin to confidence among economic agents. In short, companies and households turned their money balances faster, which offset the impact of weak money/credit impulses on economic activity. Concerning fiscal policy, time lags differ because of implementation delays and varying fiscal multipliers. In China, aggregate fiscal spending, including central, local governments and managed funds, has not yet accelerated (Chart I-8). Chart I-8China: No Rebound In Broad Fiscal Spending
China: No Rebound In Broad Fiscal Spending
China: No Rebound In Broad Fiscal Spending
While special bond issuance by local governments spiked in August and September, overall credit flows in the economy have not yet improved - please refer to Chart I-6. As an aside, there are reports that 42% of the amount raised via special bond issuance will be used to purchase land rather than for infrastructure spending.2 This will not benefit economic growth much. Question: Do you think the time lag between the bottom in China's money/credit impulses and the business cycle will be longer or shorter this time around? Answer: Our bias is that the time lag between the bottom in money/credit impulses and the resultant pickup in growth will be longer than before. Presently, there is some evidence that both business and consumer sentiment in China are beginning to whither at the hands of the trade wars, tanking domestic share prices and budding deflation in real estate prices. Eroding business and consumer confidence in China will - for now - negate the improvement in the broad money impulse. Chart I-9 depicts the velocity of money in China. After rising over the past two years, our bias is that it will drop again. It is critical to realize that forecasting the direction and magnitude of swings in the velocity of money - the marginal propensity to spend - is a dismal science. It reflects business and consumer sentiment, and any assessment on this is very subjective. This is why economic forecasting and investment calls are more of an art. Chart I-9China: The Velocity Of Money
China: The Velocity Of Money
China: The Velocity Of Money
Among many variables we are monitoring to gauge the turn in the mainland's business cycle is the marginal propensity to invest among mainland industrial companies. This indicator is falling, suggesting that monetary policy easing is facing formidable hurdles in re-igniting investment appetite among Chinese companies (Chart I-10). Chart I-10Companies' Marginal Propensity To Spend
Companies' Marginal Propensity To Spend
Companies' Marginal Propensity To Spend
The BCA Emerging Markets Strategy team's assessment is that China-related financial markets are in an air pocket. Investors should not try to catch falling knives. On the contrary, there is still meaningful downside. Question: But the People's Bank of China has been injecting a lot of liquidity into the system via various facilities. Would this liquidity not find its way into financial markets and the real economy? Answer: When a central bank injects liquidity into the banking system, it creates excess reserves. Excess reserves also rise when a central bank cuts the required reserve ratio (RRR). It is essential to differentiate money that households and business use to conduct transactions from reserves of commercial banks at the central bank. Required and excess reserves are not a part of narrow and broad monetary aggregates. Excess reserves are the banking system's liquidity held at the central bank. Importantly, banks do not lend reserves, and do not use reserves to pay for assets they purchase from non-banks. Banks use reserves to settle transactions/payments among themselves. Reserves are "manufactured" solely by central banks. Commercial banks cannot create reserves. They do, however, create the overwhelming majority of money when they lend to or purchase an asset from non-banks. Central banks create broad money - that circulates in the economy - only when they lend to or buy assets from non-banks. Given central banks typically do few transactions with non-banks, central banks originate a very small portion of the broad money supply. For example, as a part of quantitative easing efforts, new money is originated only when a central bank buys bonds from a non-bank (say, an insurance company). In contrast, no money is created when a central bank buys bonds from a bank. In brief, there is no automatic leakage of reserves into the real economy and financial markets. Banks need to be willing to lend to and purchase assets from non-banks for the money supply to expand. Question: But won't expanding excess reserves - banking system liquidity - eventually encourage banks to lend and purchase financial assets? Answer: It will at some point, but it is not imminent. The mainland banking system's excess reserves ratio is depicted in Chart I-11. A few observations are in order: Chart I-11China: Excess Reserves Not Are Growing
China: Excess Reserves Not Are Growing
China: Excess Reserves Not Are Growing
First, the excess reserve ratio - excess reserves (ER) as a share of total deposits - is currently rather low (Chart I-11, top panel). The absolute level of ER is not elevated either (Chart I-11, middle panel). To adjust the absolute level of ER for seasonality, we show the annual change of this measure - it has dropped to zero in September (Chart I-11, bottom panel). This is in contrast to the prevailing market narrative that the PBoC is injecting a lot of liquidity into the system. While they have been injecting liquidity via RRR cuts, at the same time many lending facilities have been maturing without renewal. Does the low level of ER ratio mean the PBoC has been tightening? No, it has not been tightening. Shrinking excess reserves that lead to higher money market rates would qualify as tightening. Provided money market rates are low and are not rising in China, there has been no de-facto tightening, despite the low level of reserves (Chart I-12). Chart I-12China: Excess Reserves And Interest Rates
China: Excess Reserves And Interest Rates
China: Excess Reserves And Interest Rates
Second, any central bank can simultaneously target either quantity of reserves or short-term interest rates, but not both. Before 2014, the PBoC was targeting the level of ER. As a result, short-term interest rates fluctuated a lot to equilibrate demand and supply for ER. Since early 2014, the PBoC has switched to targeting interest rates. Therefore, the level of ER is no longer a policy objective, but rather a tool to navigate interest rates. Chart I-13 illustrates what drives PBoC policy in terms of interest rates and liquidity management. The PBoC sets interest rates based on the strength in the economy - i.e., interest rates rise when loan demand is improving and fall when loan demand is weakening (Chart I-13, top panel). Chart I-13China: What Drives Interest Rates?
China: What Drives Interest Rates?
China: What Drives Interest Rates?
Then, the central bank adjusts the amount of ER to achieve its desired level of short-term interest rates. Hence, the amount of ER is a function of demand for reserves by banks at the current level of interest rates. The current low level of ER is indicative of weak demand for ER by banks. As loan origination has diminished, economic activity has cooled off and the number of transactions by companies and consumers has dwindled, demand for reserves among banks has declined. Third, declining/expanding ER do not always cause a slowdown/acceleration in money/credit growth, as demonstrated on Chart I-14. There is another variable that stands between ER and money/credit: the money multiplier (MM). The latter is defined as how much broad money/credit banks create per one unit of ER. A rising money multiplier reflects banks' willingness and ability to expand their balance sheets aggressively. A falling multiplier signifies growing risk aversion among banks, or their inability to expand their balance sheets. Chart I-14China: Excess Reserves And Money/Credit Impulses
China: Excess Reserves And Money/Credit Impulses
China: Excess Reserves And Money/Credit Impulses
Notably, the credit boom in China since 2009 has been driven not by rapidly expanding ER but primarily by a surging MM. The MM has skyrocketed from 40 in 2008 to 65 presently (Chart I-15). This was the manifestation of excessive risk taking by banks. Chart I-15China: Money Multiplier
China: Money Multiplier
China: Money Multiplier
Why is it sensible to expect the MM in China to decline? With ongoing regulatory tightening, falling asset prices and rising defaults, the odds are non-trivial that mainland banks will be reluctant to expand their balance sheets aggressively. We are not implying they will not boost lending forever, but they may be slower to do so compared to previous downturns. Following the peak in their respective credit bubbles and experiencing deteriorating asset quality, banks in Japan, the U.S., the U.K. and euro area shrunk their balance sheets - even though their respective central banks provided enormous amount of excess reserves, and interest rates were at zero. We do not expect bank credit growth to contract in China like it did in those countries. In fact, bank assets and broad credit are still growing at an annual rate of 7% and 12%, respectively (Chart I-16 and Chart I-7 above). Our point is that deleveraging in China has barely begun, and it still remains a policy priority. Consequently, money and credit growth will languish longer in this downturn than in previous ones. Chart I-16China: Bank Asset Growth To Stay Tame
China: Bank Asset Growth To Stay Tame
China: Bank Asset Growth To Stay Tame
Question: So, how would you summarize the key known unknowns to gauge whether and when monetary policy easing will translate into stronger economic growth? Answer: For monetary policy easing to translate effectively into economic growth, the MM and the velocity of money should rise. Both are driven by sentiment and marginal propensity to lend, borrow and spend. Hence, variations in the MM as well as the velocity of money are contingent on sentiment and behavior among bankers, companies and households. The regulatory clampdown on banks and non-bank financial institutions will hamper their willingness and ability to lend, despite sufficient liquidity and low interest rates. Hence, the MM could surprise on the downside. A combination of the ongoing crackdown on leverage, the starting point of high indebtedness, falling asset prices and trade confrontations, will likely weigh on corporate and consumer sentiment, curb their spending and, thereby, dampen the velocity of money. All in all, risks to both the MM and the velocity of money are to the downside rather than upside at the moment. This will hinder the transmission mechanism from policy easing to economic growth. Question: What is your take on financial markets? Are we close to the bottom in EMs and China-related plays? Answer: EMs and China-plays are in a genuine bear market as we have argued in past.3 BCA's Emerging Markets Strategy service reckons there is still meaningful downside in EM risk assets and currencies. The EM/China bear market will continue. The Fed is not about to come to markets' rescue, because U.S. growth is very robust and inflation is rising. A very important market to watch is the RMB exchange rate. If the RMB depreciates further - which is our baseline scenario - Asian and other EM financial markets will continue plunging. The RMB/USD exchange rate has been closely tracking the interest rate differential between China and the U.S. (Chart I-17). As the Fed continues to raise rates and China maintains rates at their current level or reduces them to stimulate, the RMB will depreciate. Chart I-17RMB/USD And Interest Rate Differentials
RMB/USD And Interest Rate Differentials
RMB/USD And Interest Rate Differentials
Yuan depreciation will lead to a decline in other Asian currencies. In fact, the Korean won is at a critical technical juncture, and a major move is in the cards. Our bias is it will likely break down, consistent with our bearish view on EM risk assets and currencies. As the RMB depreciates, the amount of U.S. dollars that China emits to emerging economies via imports will decline. This will hurt EM exports to China, their currencies and commodities prices. Overall, the U.S. dollar has more upside. The growth disparity between the U.S. and the rest of world warrants a stronger greenback. The latter and a slowdown in EM/China herald a considerable drop in commodities prices. Question: One commodity that has defied the dollar rally and slowdown in China is oil. Will crude continue to float higher? Answer: Oil prices have risen much further and for far longer than we expected.That said, it appears that oil prices are finally beginning to crack, and we see considerable downside.4 China's imports of oil and petroleum products has decelerated substantially (Chart I-18, top panel). This is occurring at a time when Chinese oil strategic and commercial inventories are very elevated (Chart I-18, bottom panel). Chart I-18China's Oil Imports To Weaken Further
China's Oil Imports To Weaken Further
China's Oil Imports To Weaken Further
Oil prices in local currency terms are at record highs in many developing countries. Given oil and fuel subsidies have been removed or reduced in recent years, high oil prices are curbing oil demand in many emerging economies. Global oil production has been outpacing global oil demand since May (Chart I-19, top panel). Typically, this heralds a rollover in oil prices (Chart I-19, bottom panel). Chart I-19A Risk To Oil Prices
A Risk To Oil Prices
A Risk To Oil Prices
Finally, oil output has been surging in the U.S. and strong in Russia (Chart I-20); further, Saudi Arabia could boost its crude output as per its recent pledge. Chart I-20Global Oil Output Has Been Surging
Global Oil Output Has Been Surging
Global Oil Output Has Been Surging
While geopolitics remains a supportive factor for crude prices, it seems a lot of good news is already priced in the oil market and investors are very long. In short, oil prices are probably heading south. This will contribute to the negative investment sentiment toward EM financial markets. Arthur Budaghyan, Senior Vice President Emerging Markets Strategy arthurb@bcaresearch.com Lin Xiang, Research Analyst linx@bcaresearch.com 1 Please see Emerging Markets Strategy Weekly Report, "Questions For Emerging Markets," dated November 29, 2017, available at ems.bcaresearch.com. 2https://www.bloomberg.com/news/articles/2018-10-21/china-s-195-billion-debt-splurge-has-less-bang-than-you-think 3 Please see Emerging Markets Strategy Weekly Report, "EMs Are In A Bear Market," dated October 18, 2018; the link is available on page 17. 4 This is BCA's Emerging Markets Strategy team's view and differs from the BCA house view on oil. Equity Recommendations Fixed-Income, Credit And Currency Recommendations
Highlights So What? Ongoing reforms will drag on China's policy easing measures. Why? Xi Jinping is not abandoning his "Three Tough Battles" against leverage, pollution, and poverty. China is striving to contain leverage, despite the shift of rhetoric away from deleveraging. China's anti-pollution targets have eased, but in a pragmatic way. Barring a sharp economic deceleration, China's stimulus measures will be about stability rather than reacceleration. Feature China's leader Xi Jinping has clearly focused on two systemic risks: leverage and pollution (Table 1). Xi redoubled his efforts to address these risks in 2017 when he launched the "Three Tough Battles" against financial systemic risk, pollution, and poverty that will last through 2020. In this Special Report we provide a "status update" on the three battles, particularly the anti-pollution campaign. Investors should not mistake China's policy easing for a wholesale reversal of reform in order to stimulate growth. Today's policy environment and response is different from what investors are familiar with, which is large-scale fiscal and credit injections that pump up infrastructure and property construction and materially reaccelerate global and Chinese demand. Table 1Central Government Spending Preferences (Under Leader's Immediate Control)
China Sticks To The "Three Battles"
China Sticks To The "Three Battles"
The First Battle: Financial Systemic Risk First, a word about financial systemic risk, which is of the utmost importance to China's economic trajectory, the global investment outlook, and Xi Jinping's other two policy battles. We have now had two months of full data - August and September - since China's top leaders announced in late July that they would ease economic policy. The data show that there has not been a major acceleration in total private credit growth. This is based on the adjusted total social financing measure used by BCA's China Investment Strategy, which now includes the special purpose bonds that local governments have been issuing rapidly in response to central government demands to ease policy (Chart 1). Chart 1No Credit Spike ... Yet
No Credit Spike ... Yet
No Credit Spike ... Yet
We also closely watch China's money supply. Monetary impulses are bottoming and the M2 impulse is now positive (Chart 2). This is a marginal positive for both the Chinese and global economic outlook in 2019, though it is at odds with China's credit impulse. Chart 2Money And Credit Impulses At Odds
Money And Credit Impulses At Odds
Money And Credit Impulses At Odds
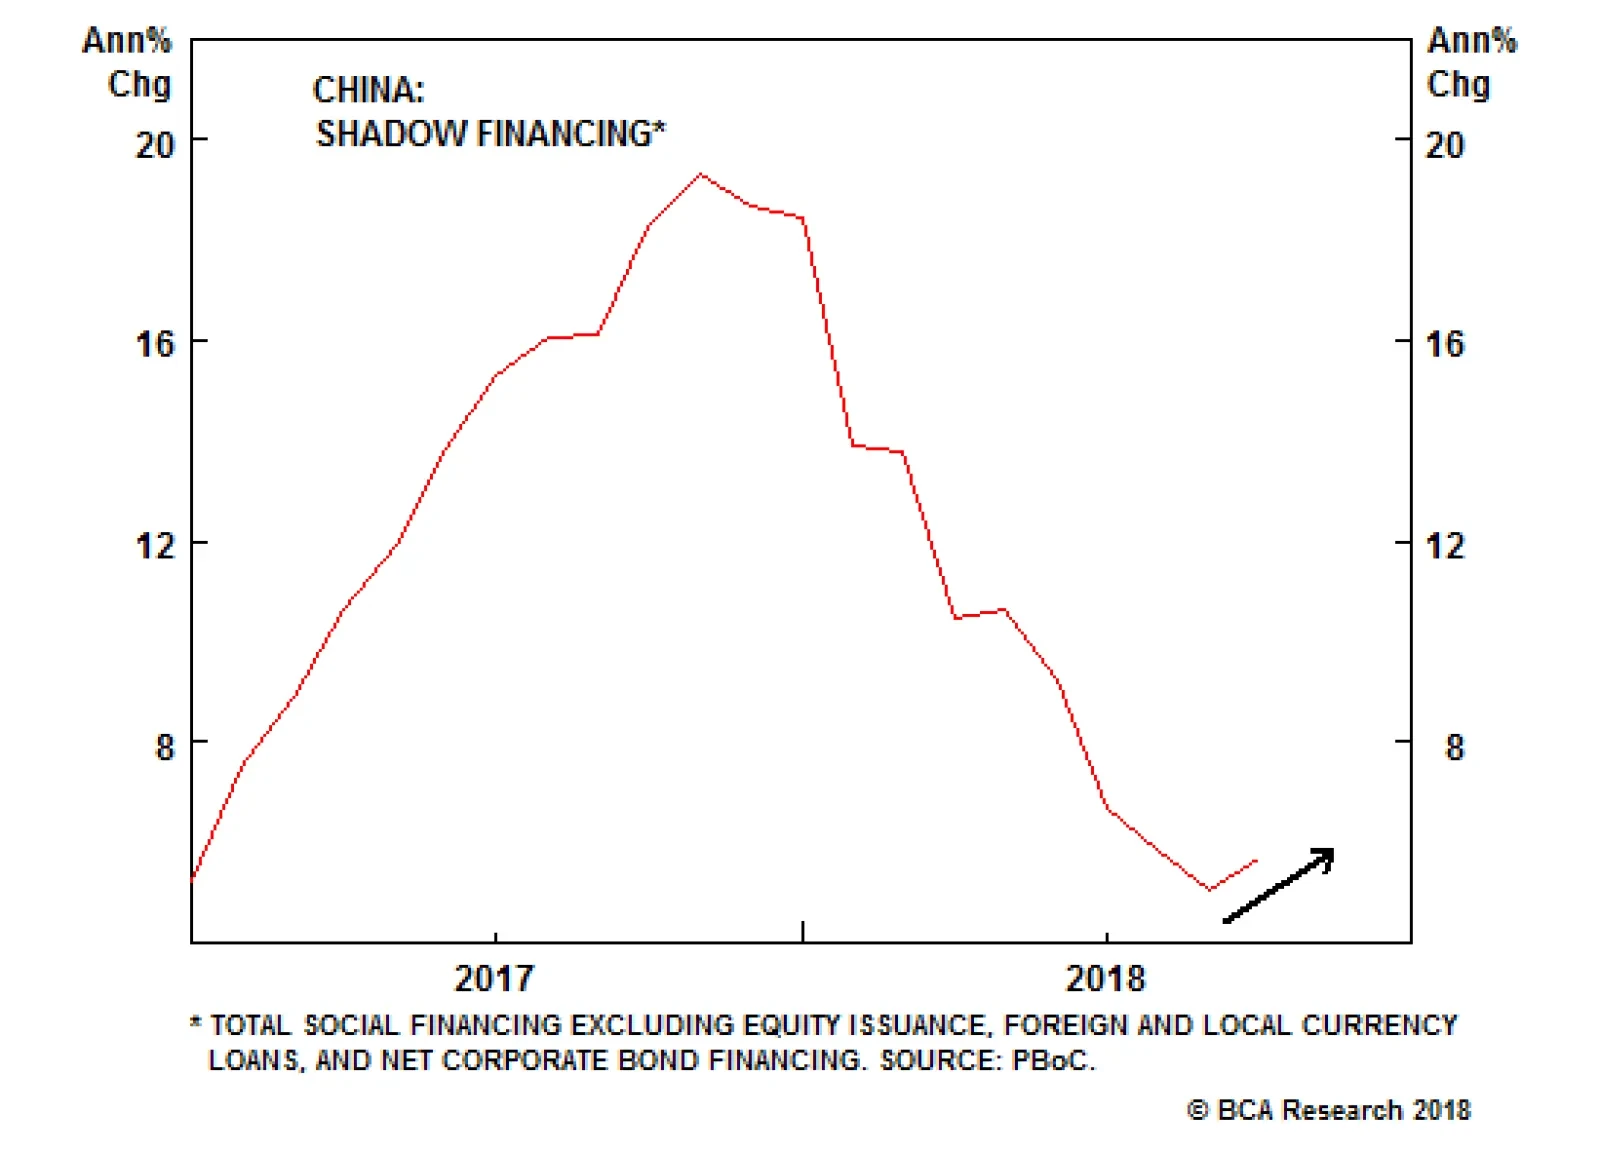
While bank loan growth remains steady, informal lending growth is starting to pick up (Chart 3). This could herald a relaxation of controls on shadow banking, although that is by no means clear yet. Chart 3Shadow Banking Crackdown Is Easing
Shadow Banking Crackdown Is Easing
Shadow Banking Crackdown Is Easing
Fiscal spending is also becoming more proactive, as is apparent from the spike in local government bond issuance (Chart 4). However, these new bonds hardly make a dent in the total credit picture, as shown in Chart 1 above. Chart 4Fiscal Policy Becomes More Proactive
China Sticks To The "Three Battles"
China Sticks To The "Three Battles"
We expect China to stimulate more if internal or external conditions worsen. That looks likely, as we also have a structurally bearish view of the U.S.-China relationship. The trade war could prompt the U.S. to extend tariffs to all Chinese imports at the 25% rate that will apply to $200 billion worth of imports as of January 1, 2019. To be prudent, investors need to be prepared for even a 45% tariff rate on all Chinese imports, as President Trump first threatened on the campaign trail. People's Bank of China Governor Yi Gang has recently implied that benchmark interest rates could be cut if necessary, in addition to further cuts to the required reserve ratio. These measures would have the additional effect of weakening CNY/USD, which could also be stimulative for China, but may first disrupt emerging markets and worsen the trade war. The foregoing data reveal that, while the government has clearly toned down its rhetoric about deleveraging, it continues to try to contain the rise in leverage. China's administration - in contrast to many bullish investors - views leverage as a form of systemic risk. The top leaders perceive that excess leverage is bad for productivity. It delays China's adjustment to a more sustainable, consumer-driven economic model. And it exacerbates quality-of-life problems that could lead to socio-political instability, such as land appropriation and environmental degradation. China's economy can only reaccelerate sharply if Xi Jinping and his deputies - namely his top economic adviser Liu He and also Guo Shuqing, the party secretary of the PBOC - throw in the towel and allow total credit to skyrocket. President Xi is pragmatic and ultimately may have to do this - if conditions get bad enough. But for now, the pace of deceleration is not so quick that throwing in the towel is warranted. Furthermore, the trade war provides Xi with ample domestic political "coverage" to blame the U.S. for any economic pain incurred while pursuing badly needed domestic restructuring. Bottom Line: The Chinese administration wants to contain leverage, and this policy imperative will not easily waver. Data shows that the policy shifts announced in July were indeed evidence of "fine-tuning" rather than wholesale stimulus. The U.S. trade war provides the Xi administration with a scapegoat to absorb public anger when the pain of long-needed economic adjustments sets in. We remain data-dependent and will alter our global asset allocation recommendation - long DM / short EM - if evidence of a wholesale policy shift occurs. The Second Battle: Pollution What about Xi's second battle, the anti-pollution campaign? Is China already throwing out its new environmental regulations in order to stimulate growth? No, but it is compromising them for the sake of stability. Chart 5China Is Resource Intensive
China Is Resource Intensive
China Is Resource Intensive
China's rapid rise from an agrarian society to an industrial power came at a devastating environmental cost. The heavy resource intensity of its economy (Chart 5) translates to extremely high pollution levels (Chart 6). Chart 6A Highly Polluting Economy
A Highly Polluting Economy
A Highly Polluting Economy
To some extent, this is a natural phase of development. The "environmental Kuznets curve" hypothesizes that as economies industrialize they become increasingly polluting - and yet at a certain level of income the relationship reverses and economic growth becomes associated with environmental improvement (Diagram 1).1 Diagram 1The 'Environmental Kuznets Curve' Applies To Air Pollution
China Sticks To The "Three Battles"
China Sticks To The "Three Battles"
Chart 7China Following In The Footsteps Of Less Resource-Intensive Neighbors
China Sticks To The "Three Battles"
China Sticks To The "Three Battles"
As China transitions to a services-led economy, its appetite for commodities will slow. This is what happened in the advanced economies - and China is already on this path (Chart 7). The transition points away from export-manufacturing, which means that the share of electricity consumed by the industrial sector - currently disproportionately large - will ease (Chart 8). Chart 8Manufacturing Intensity Will Moderate
China Sticks To The "Three Battles"
China Sticks To The "Three Battles"
Chart 9Reliance On Coal Power Will Fall
China Sticks To The "Three Battles"
China Sticks To The "Three Battles"
China's consumption of coal, on which it depends very heavily (Chart 9), will continue to fall as a share of total energy consumption. And coal is significantly more polluting than other forms of energy (Table 2). Table 2Natural Gas Emits Less Carbon
China Sticks To The "Three Battles"
China Sticks To The "Three Battles"
Already, growth in the service sector - the so-called tertiary industries - now outpaces manufacturing growth and accounts for more than half of Chinese GDP (Chart 10). Chart 10Rising Service Sector Means Less Pollution
Rising Service Sector Means Less Pollution
Rising Service Sector Means Less Pollution
However, the pace of change is too slow for the Chinese public, which has been suffering from the health-related costs of rapid industrialization. The World Health Organization reports that in 2016, over a million deaths in China were attributed to ambient air pollution.2 Chart 11There Is A Reason Xi Jinping Cracked Down On Corruption And Pollution
China Sticks To The "Three Battles"
China Sticks To The "Three Battles"
The Pew Research Center finds that 76% of survey respondents would classify air pollution as a "big problem," and nearly half of which a "very big problem" (Chart 11). On top of that, a 2016 survey shows that the Chinese public favors clean air over industry if forced to make a tradeoff (Chart 12). Chart 12The Public Understands The Tradeoff
China Sticks To The "Three Battles"
China Sticks To The "Three Battles"
To prevent public discontent from boiling over, China launched a sweeping effort to restrain pollution when Xi Jinping took power in 2012-13 - particularly after the appallingly smoggy winter of 2013, known as "airpocalypse." Chart 13Air Pollution Is Trending Downwards
Air Pollution Is Trending Downwards
Air Pollution Is Trending Downwards
These measures have broadly been effective. Readings of China's preferred measure of air pollution - PM2.5 concentration3 - have fallen steadily (Chart 13). The goals were achieved by means of overcapacity cuts in the coal and steel sectors - including shutting down low-quality steel plants - and replacing coal with cleaner forms of energy, particularly natural gas (Chart 14). Chart 14Coal Reliance Is Declining
Coal Reliance Is Declining
Coal Reliance Is Declining
However, pollution is a structural challenge, not one that can be solved in a single five-year plan. Though PM2.5 emissions have fallen by 35% in 2017 compared to 2012, the current concentration of 47.3 µm/m3 remains well above China's national standard for maximum annual average exposure of 35 µm/m3. China's standards are also lax relative to international peers. The World Health Organization recommends a much lower annual mean for the concentration level at 10 µm/m3. Furthermore, air pollution is not equally concentrated throughout the country. The industrialized north is significantly more polluted than the rest of the country (Map 1). The provinces of Shanxi and Shaanxi saw PM2.5 levels rise from 2015-17, reaching the highest alert levels. Map 1China's Air Pollution By Province
China Sticks To The "Three Battles"
China Sticks To The "Three Battles"
As a result, the Xi administration has doubled down on its anti-pollution goals. The 13th Five Year Plan, covering 2016-20, was the first national economic blueprint to include air pollution targets. It got off to a rocky start because China had to stimulate the economy aggressively in 2015-16 to fend off a destabilizing slowdown. Pumping credit and fiscal spending into the industrial economy led to a rebound in high-polluting activity (Chart 15). Yet, as mentioned, when Xi consolidated power in 2017, he elevated the war on pollution to the "second battle" of the three battles. Chart 15Excess Credit Means Excess Pollution
Excess Credit Means Excess Pollution
Excess Credit Means Excess Pollution
Pursuant to this 2018-20 framework, the latest action plan for air pollution reinforces the targets of the Five Year Plan and its 2020 deadline: The plan applies to all cities of prefectural or higher level, and thus expands the government's actions beyond the major cities in the Beijing-Tianjin-Hebei, Yangtze River Delta, and Pearl River Delta areas. Furthermore, the Pearl River Delta is no longer one of the key regions, having made substantive progress. It has been replaced by the Fen-Wei Plains, which include Xi'an and parts of Shaanxi, Henan, and Shanxi provinces. These provinces rely on coal for energy and contain polluting industries. PM2.5 levels must fall by at least 18% from 2015 baseline levels in cities of prefectural or higher level and anywhere else where standards have not been met. Targets for reducing volatile organic compounds (VOC) and nitrogen oxide emissions are set to 10% and 15%, respectively, by the end of the period. The number of good-air days should reach 80 percent annually and the percentage of heavily polluted days should decrease by more than 25 percent from 2015 levels. The new air pollution goals are not as aggressive as those of the 2012-17 plan. For instance, the 18% cut in PM2.5 levels is less than the maximum 25% cut in the previous plan. However, the new goals are more precise and targeted. Rather than impose further declines in regions where air pollution has been successfully reduced, the plan aims to prevent heavy industries from migrating to other parts of China to evade environmental restrictions. After all, many of China's coal producers are located in the Fen-Wei Plains, which will no longer escape the regulator's eye (Chart 16). Chart 16The Fen-Wei Plain Now Under Scrutiny
China Sticks To The "Three Battles"
China Sticks To The "Three Battles"
What is the market implication of the above? In our view, some market participants have misread the new anti-pollution targets as a form of economic stimulus because they are less aggressive than those of the previous five years. While it is true that China faces a tradeoff between clean air and economic growth (Chart 17), the regulatory easing looks like an attempt to make the anti-pollution goals more realistic and achievable rather than abandoning the overarching anti-pollution push (see Box 1). In net terms, China is still tightening regulation. Chart 17Heavy Industrial Model Drives Pollution
Heavy Industrial Model Drives Pollution
Heavy Industrial Model Drives Pollution
Box 1 Easing Up On winter Curbs? China has recently relied on heavy industry production curbs to limit pollution during the especially smog-prone winter months. The 2017-18 season saw the first of these wintertime cuts. Production in highly polluting industries such as coal, aluminum, and steel was slashed by up to 50% in 28 northern cities between mid-November 2017 and mid-March 2018. As a result, fine particle emissions fell. The year-on-year change in emissions peaked with the start of the cuts and troughed with their end, falling by an average 18% y/y over the period (Chart 18). Chart 18Last Winter's Anti-Pollution Crackdown
China Sticks To The "Three Battles"
China Sticks To The "Three Battles"
Cuts will continue this winter, in theory limiting steel and aluminum production as well as coal consumption. However, the impact looks to be less dramatic this time around: While the August draft plan reportedly set PM2.5 reduction targets at 5% y/y for the 2018-19 winter, the final plan, released by the newly formed Ministry of Ecology and Environment, set a less ambitious objective of a 3% reduction in emissions. Blanket production cuts are being replaced by more flexible measures that will be overseen by local governments. Central government inspection teams will be dispatched less frequently. The new changes reflect the fact that Chinese policymakers are fine-tuning their policies to minimize the negative impact on industry as well as households that use coal-fired heating: The revision of emissions cuts from 5% in the August draft to 3% in the final plan reflects a more realistic cut than the 15% cut last year. But it is still a cut. The scrapping of blanket measures, in favor of more flexible cuts determined by regional emissions levels, will avoid penalizing producers who have already abided by the targets. It will also reward producers who have upgraded their facilities to be more eco-friendly. While year-on-year changes in emissions fell in northern China last winter, they spiked in the rest of the country, as economic agents shifted to areas not covered by the new rules. The same pattern emerged in the steel industry: steel production cuts in northern China were offset by a ramp-up in steel production from other regions (Chart 19). The newest plan expands the coverage of the regulations even as its demands are less draconian. Chart 19Polluters Know How To Evade Controls
Polluters Know How To Evade Controls
Polluters Know How To Evade Controls
Last winter, local governments frantically shut down coal usage in order to meet strict 2017 deadlines for the plan to convert 20 million rural households from coal-heating to gas-heating by 2020. However, natural gas supplies could not pick up the slack - storage capacity, LNG import capacity, internal distribution, Central Asian imports, and bureaucratic coordination all fell short.4 Millions of households lost heating during the winter months, the authorities were forced to backtrack and allow coal imports, and a massive public backlash ensued. It is not surprising, then, that the government is compromising its coal-to-gas requirements for the coming winter.5 While the gas crunch is not expected to be as bad this winter, the underlying problems with natural gas storage, import, or distribution problems remain unresolved. So it makes sense for Beijing to give local governments more flexibility. A total conversion to natural gas heating is still supposed to be accomplished by 2020 in the Beijing-Tianjin-Hebei region as well as in Shanxi and Shaanxi.6 The goal post may be moved but policies will still push in this direction. Ultimately, pollution is a cross-regional phenomenon - and it has proven to generate significant political opposition movements over time. Many developed nations have gone through a period of political upheaval sparked by popular backlash against the excesses of industrialization - including pollution.7 China does not have voters who can vote on environmental demands, but it greatly fears the political ramifications of widespread protests due to unbearable living and health conditions. As with the anti-corruption and anti-leverage campaigns, the Xi administration is trying to catch up to the magnitude of the problem and mitigate it before something snaps and triggers a general uproar. Bottom Line: China has pared back its emissions cuts for 2018-20 and softened its pollution curbs for the winter. These actions are less negative for economic growth than earlier curbs and proposals would have been. However, they still amount to a net increase in China's environmental regulation, which is in keeping with Xi Jinping's overarching policy priorities. The Third Battle: Poverty Poverty rates have collapsed in China since its opening up and reform in 1979. Xi's third battle is to eliminate rural poverty by 2020. This is the only battle of the three that is growth-enhancing rather than growth-constraining. It lifts China's growth by transferring government funds to the poorest citizens, who have the highest propensity to consume. At the average rate of rural poverty reduction over the past several years, there will still be around 11-12 million rural poor by the end of 2020 (Chart 20). Thus China will have to spend more to meet the target, creating a net increase in fiscal spending. Chart 20Anti-Poverty Campaign Requires Spending
Anti-Poverty Campaign Requires Spending
Anti-Poverty Campaign Requires Spending
The war on poverty underscores a constraint on the previous two battles: growth and stability. Financial and environmental regulation cannot be imposed so aggressively as to lead to a sharp drop in growth or employment. This is China's "Socialist Put" - and it remains in place despite the fact that the government has a higher threshold for economic pain since 2017. While Xi has signaled that China will do away with annual GDP growth targets, he has not discarded them immediately. The leadership is still bound by the economic targets due in 2020 - the doubling of GDP from 2010 levels and the doubling of rural and urban incomes (Chart 21). Chart 21Stimulus Necessary If 2020-21 Goals In Jeopardy
Stimulus Necessary If 2020-21 Goals In Jeopardy
Stimulus Necessary If 2020-21 Goals In Jeopardy
These targets are especially important because they more or less coincide with the "centenary goal" of making China a "moderately prosperous society" by 2021. The latter year will mark the 100th anniversary of the Communist Party; the administration will want to make sure that the economy is in good shape. The Chinese leadership takes its two centenary goals (2021 and 2049) seriously.8 As long as headline GDP growth does not fall too far below the average of 6.5% per year in 2018-20, the first centenary goals will be met. New tax cuts worth an estimated 1% of GDP, and other targeted measures, will help reach the goal for urban income, which is the one most at risk. If these goals look to be met, China can save its biggest stimulus measures for later. In recent years, China's economic "mini-cycles" have lasted about 1.4-to-2 years, from the trough of the total credit impulse to the peak of nominal GDP (Chart 22). If China launches a large-scale stimulus now, peak output will occur in 2020 and the economy will be decelerating into 2021. This would be bad timing for the centenary. It would make more sense for China to save some dry powder for 2019 or 2020 to ensure a positive economic backdrop in 2021. Chart 22Economy Peaks Two Years Post-Stimulus
Economy Peaks Two Years Post-Stimulus
Economy Peaks Two Years Post-Stimulus
Bottom Line: We would need to see a much bigger shock to the economy than is currently in the offing for Xi to abandon his reform agenda for a traditional fiscal-and-credit splurge that exacerbates the credit bubble, fires up overbuilt industries, and annihilates all the hard work of his recent financial and environmental regulations. Investment Conclusions The above findings suggest that coal prices can rise in the near term.Demand will be supported by more flexibility on pollution curbs, while supply will be constrained by the ongoing supply-side cuts in coal production. Steel prices may fall, as production will rise amid less stringent environmental rules. More broadly, however, investors should understand what the recent tactical "easing" measures suggest about China's policy settings overall. China's political system is a system of single-party rule, in which the Communist Party explicitly rejects the legitimacy of "checks and balances" or political liberalism. However, the government cannot do whatever it wants. Its authoritarian model still requires it to address public pressure and maintain general popular approval - otherwise it would lose legitimacy and ultimately power. For the past four decades, the Communist Party has maintained legitimacy by providing economic growth and rising incomes - and these are still essential. But as the economy matures and growth rates naturally fall, it becomes more important to re-establish the party's legitimacy on improving quality of life. Xi Jinping made this point official in his address to the nineteenth National Party Congress last October, but it has driven his administration since 2012.9 The Communist Party is flush with tax revenues and maintains absolute control over government branches, banks, key corporations, security forces, and most forms of civil association. With these tools it can, for the most part, maintain its rule against regional or topical challenges. What it fears are systemic risks - challenges to its authority that span ideological, ethnic, class, or regional divides. Here the government is behind the curve, as quality of life has been entirely neglected during the country's high-growth phase of economic development. Thus Xi has tried to make up for lost time and tackle the most flagrant quality-of-life concerns. His anti-corruption campaign, for instance, sought to address the chief source of public discontent from the moment he came into office - as well as to recentralize power into his own hands so that he could tackle the other major grievances with zero resistance from the party or state bureaucracy. Now his top priorities are leverage and pollution, both of which pose systemic risks and hence the forthcoming improvement in fiscal and credit indicators will not proceed unchecked. Matt Gertken, Vice President Geopolitical Strategy mattg@bcaresearch.com Roukaya Ibrahim, Editor/Strategist roukayai@bcaresearch.com 1 There is a large body of literature on the Environmental Kuznets Curve; the important point for this study is that it holds up well to empirical scrutiny when it comes to modeling air pollution concentrations. Please see David I. Stern, "The Environmental Kuznets Curve After 25 Years," Australian National University, CCEP Working Paper 1514 (December 2015), available at ageconsearch.umn.edu. 2 The death rate attributable to ambient air pollution is 81 per 100,000 people, which places China among the most dangerously polluted countries, alongside North Korea, Russia, and several developing eastern European countries. Please see the WHO's Global Health Observatory data repository, available at www.who.int/gho/en. 3 PM2.5 is a general term for particles and liquid droplets in the atmosphere with aerodynamic diameters less than or equal to 2.5 microns (µm). Short- or long-term exposure to these particles has been found to lead to adverse cardiovascular effects such as heart attacks and strokes. 4 Please see David Sandalow, Akos Losz, and Sheng Yan, "A Natural Gas Giant Awakens: China's Quest for Blue Skies Shapes Global Markets," Columbia Center on Global Energy Policy, July 27, 2018. 5 Please see Yujing Liu, "China scrambles to avoid a repeat of last winter's botched coal-to-gas conversion programme in highly polluting northern rural areas," SCMP, September 24, 2018, available at www.scmp.com. 6 Please see "China coal city vows 'no-coal zones' in bid to curb pollution," Reuters, October 11, 2018, available at reuters.com. 7 The Great London Smog of 1952 is a classic example, but for a detailed study please see Russell J. Dalton and Manfred Kuechler, Challenging the Political Order: New Social and Political Movements in Western Democracies (Cambridge: Polity, 1990). 8 The first goal is to create a "moderately prosperous society in all respects," namely by doubling real GDP and rural and urban per capita income from 2010 levels by 2020. The second goal is to make China into a "modern socialist country that is prosperous, strong, democratic, culturally advanced, and harmonious," with the GDP per capita of a moderately developed country at around $55,000 in 2014 dollars. Please see "CPC Q&A: What are China's two centennial goals and why do they matter?" Xinhua, October 17, 2017, available at www.xinhuanet.com. 9 Xi, in his work report at the party congress in 2017, said, "what we now face is the contradiction between unbalanced and inadequate development and the people's ever-growing needs for a better life." This is a new formulation of the "principal contradiction" facing Chinese society, by contrast with the earlier formulation, which emphasized "the ever-growing material and cultural needs of the people and the low level of social production," according to former President Hu Jintao in 2007.
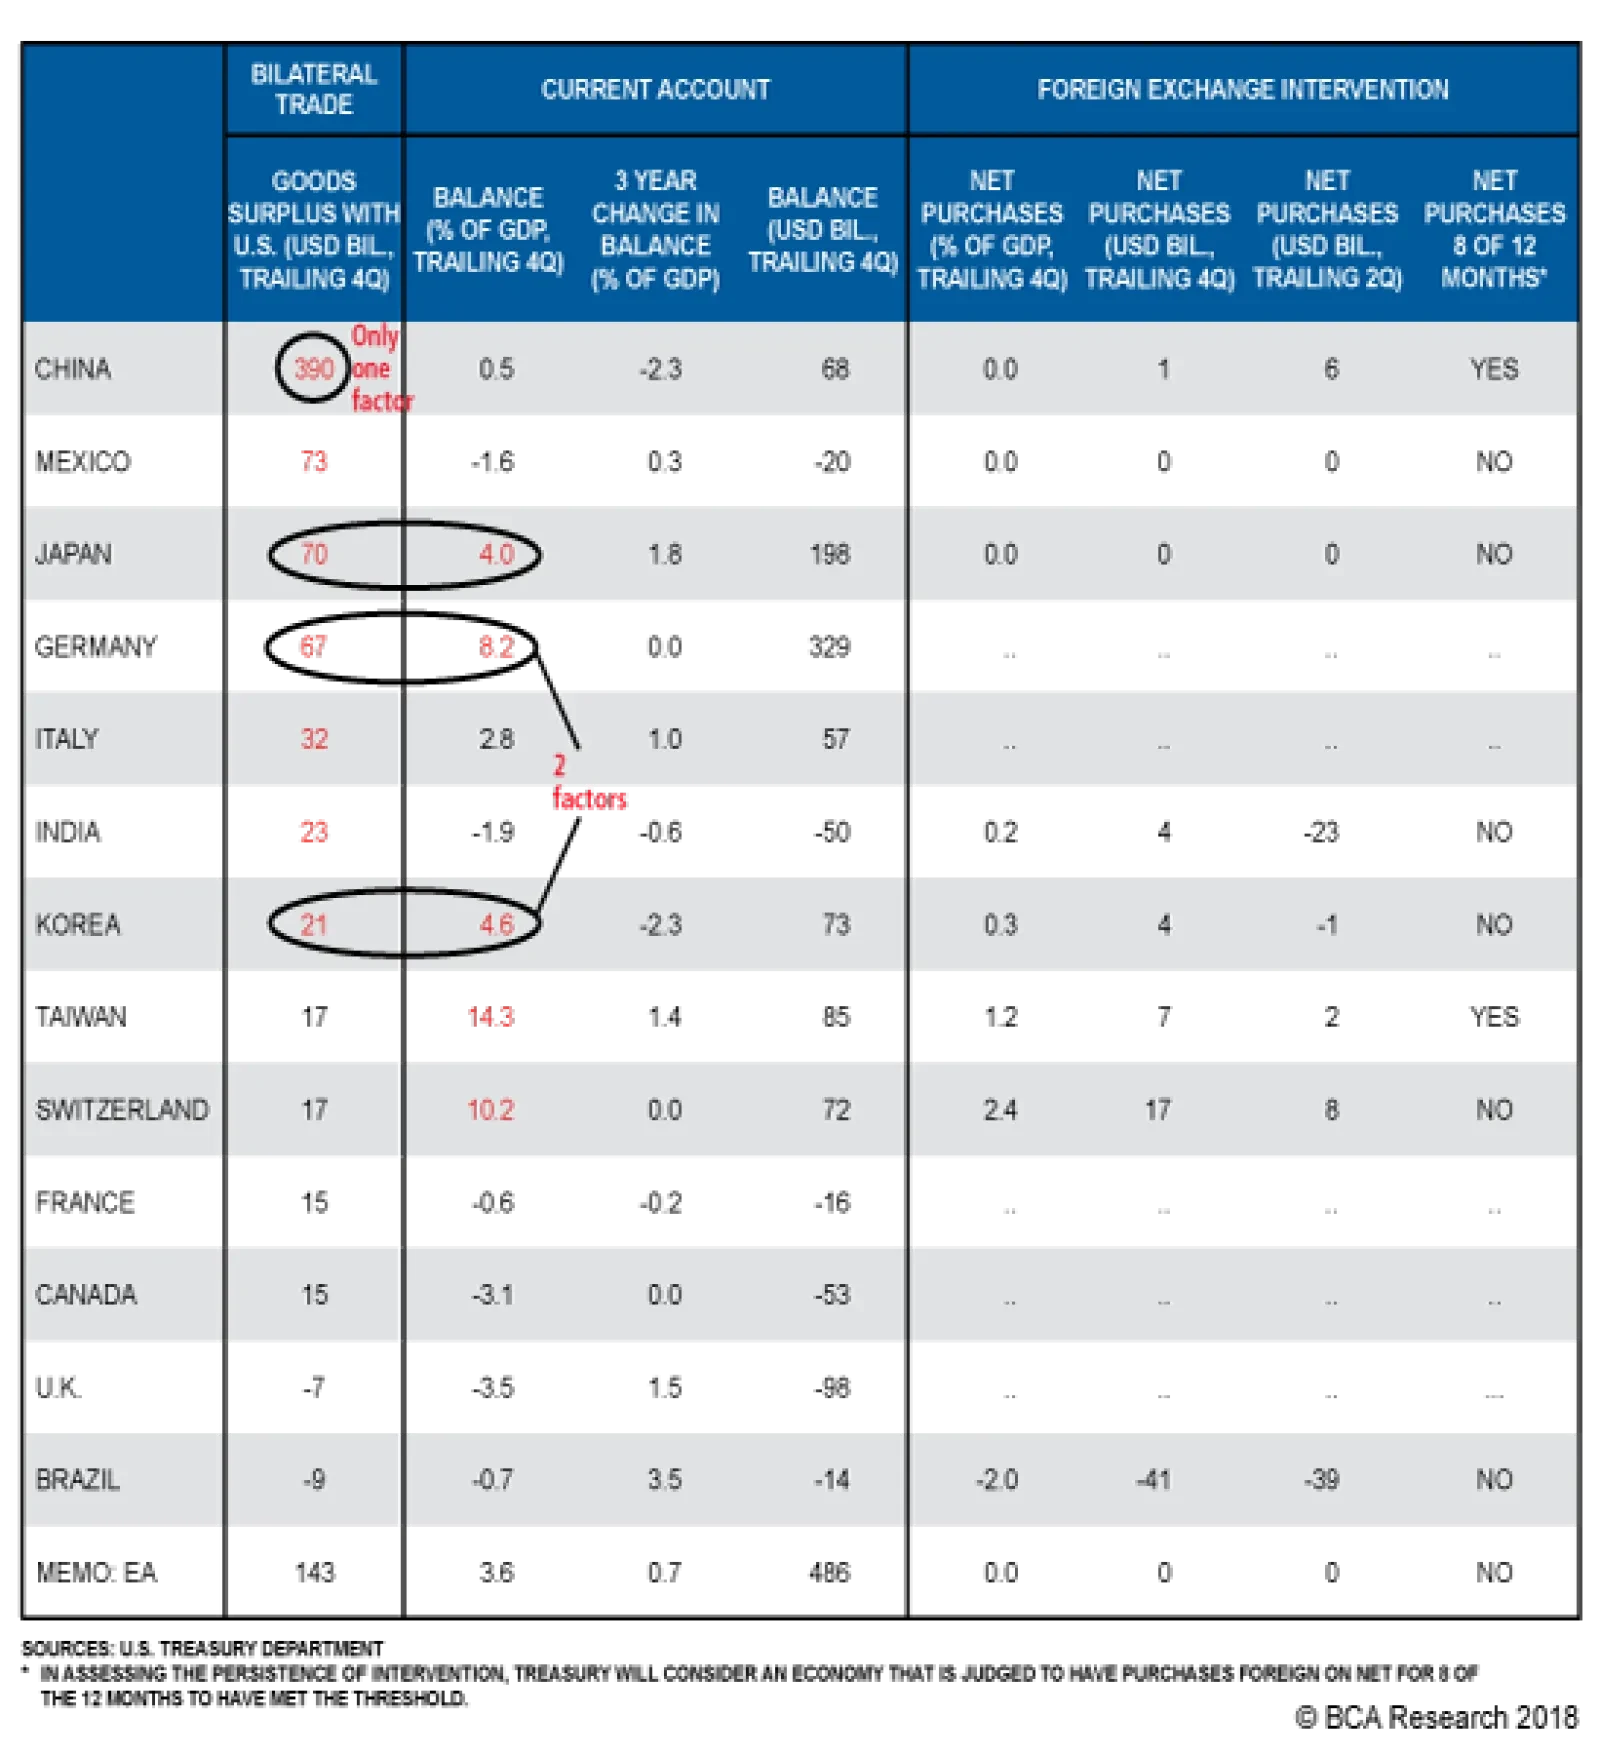
Despite the White House's vociferous pronouncements that China is breaking the rules on trade and currency, the Treasury Department declined to name China a currency manipulator in its latest bi-annual report. The most interesting piece of news from the…
Highlights The Fed remains on a tightening course as the U.S. economy has no spare capacity, yet growth in the rest of the world is suffering as EM financial conditions are tightening. It will take more pain for the Fed to capitulate and pause its 25-basis-points-per-quarter hiking campaign. This clash will heighten currency volatility and, as a result, carry trades will suffer. This means the current rebound in EM currencies is to be sold, and the dollar has more upside. China has not been deemed a currency manipulator, hence the RMB could fall more, creating a deflationary shock for the world. Keep an eye on what might become rocky U.S.-EU trade negotiations. Short CAD/NOK. Short GBP/NZD. Feature A significant increase in volatility across markets has been the defining characteristic of the past two weeks. This tumultuous environment is likely to persist as the Federal Reserve is set to tighten policy, and EM financial conditions deteriorate further. While it is true that enough market turbulence could cause the Fed to blink and temporarily pause its tightening cycle, the U.S. central bank has yet to hit this pain threshold. As a result, we expect carry trades and EM currencies to suffer further, even as we established a few hedges last week. The Battle Between The Fed And Global Growth Has Just Begun The Fed is set to increase interest rates further. For now there is little reason for the institution that sets the global risk-free rate to deviate from its current trajectory of increasing interest rates by 25 basis points per quarter. First, capacity utilization in the U.S. keeps increasing, and in fact, the amount of spare capacity in the U.S. economy is at its lowest level since 1989. This kind of capacity pressure has historically been enough to prompt the Fed to keep increasing rates, as it points toward growing inflationary risks (Chart I-1). Chart I-1No Spare Capacity In The U.S.
No Spare Capacity In The U.S.
No Spare Capacity In The U.S.
Second, the labor market is currently at full capacity. This week's release of the JOLTS data not only highlighted that U.S. job openings continue to rise and are now well above the number of unemployed workers, but it also showed that the voluntary quit rate is at a 17-year high. U.S. workers are no longer petrified by fear of not finding a job if they were to jettison their current one. This is symptomatic of an economy running beyond full employment. Additionally, as Chart I-2 illustrates, the number of states where the unemployment rate stands below levels consistent with full employment is near a record high. Historically, this indicator has explained the Fed's policy well. Chart I-2The Labor Market And The Fed
The Labor Market And The Fed
The Labor Market And The Fed
Third, and obviously a consequence of the previous two points, various components of the ISM survey are pointing toward an acceleration in U.S. core inflation (Chart I-3). This highlights that with the U.S. at full employment, the rise in inflation is giving free reign to the Fed to further lift interest rates. This development explains why Federal Open Market Committee members are much more willing than previously to display hawkish colors. Chart I-3U.S. Inflation Is In An Uptrend
U.S. Inflation Is In An Uptrend
U.S. Inflation Is In An Uptrend
The problem for the currency market is that this hawkish Fed is not emerging in a vacuum. Global growth has begun to slow, and in fact is set to slow more. Korean export growth has been decelerating sharply, which historically has been a harbinger for global profit growth and global industrial production (Chart I-4). Chart I-4U.S. Strength Does Not Equate To Global Strength
U.S. Strength Does Not Equate To Global Strength
U.S. Strength Does Not Equate To Global Strength
What lies behind this growth slowdown? In our view, two key shocks explain this vulnerability. First, China is deleveraging. Chart I-5 shows that efforts to curtail corporate debt have been bearing fruit. In response to the regulatory and administrative tightening imposed by Beijing, smaller financial institutions are not building up their working capital required to expand their loan book. As a result, the Chinese credit impulse remains weak. The chart does highlight that deleveraging could take a breather in the coming months, in keeping with the change in official rhetoric. However, this pause is likely to be temporary. Do not expect China to push enough stimulus in its economy to cause a sharp rebound in indebtedness and capex. Xi Jinping has not yet abandoned his shadow bank crackdown, which weighs on overall credit expansion. Chart I-5Chinese Policy Tightening In Action Chinese Deleveraging Is Still Worth Monitoring
Chinese Policy Tightening In Action Chinese Deleveraging Is Still Worth Monitoring
Chinese Policy Tightening In Action Chinese Deleveraging Is Still Worth Monitoring
Second, EM liquidity is deteriorating. Chart I-6 illustrates that global reserves growth has moved into negative territory. Historically, this indicates that our EM Financial Conditions Index (FCI) will continue to tighten. Many factors lie behind this deterioration in the EM FCI, among them: the collapse in performance of carry trades;1 the increase in the dollar and in U.S. interest rates that is causing the cost of servicing foreign currency debt to rise; and EM central banks fighting against currency outflows. Chart I-6Global Liquidity Is Tightening, So Are EM FCI
Global Liquidity Is Tightening, So Are EM FCI
Global Liquidity Is Tightening, So Are EM FCI
This tightening in the EM FCI has important implications for global growth. As Chart I-7 shows, a tightening EM FCI is associated with a slowdown in BCA's Global Nowcast of industrial activity. As such, the tightening in EM financial conditions suggests that global industrial production can slow further. Since intermediate goods constitute 44% of global trade, this also implies that global exports growth could suffer more in the coming quarters. As a result, Europe, Japan and commodity producers remain at risk. The same can be said of EM Asia, which is the corner of the global economy most levered to global trade and global manufacturing. In fact, our Emerging Markets Strategy colleagues are currently reducing their allocation to Asia within EM portfolios.2 Chart I-7Tighter EM Financial Conditions Equal Lower Growth
Tighter EM Financial Conditions Equal Lower Growth
Tighter EM Financial Conditions Equal Lower Growth
This deterioration in global growth and global trade is deflationary for the global economy. It is also deflationary for the U.S. economy. As we have highlighted in the past, since the U.S. economy is less levered to global trade and global IP than the rest of the world, weakening global growth tends to lift the greenback. Thus, if global goods prices are declining, such a shock can be compounded in the U.S. by a rising dollar. Does this mean the Fed will be forced to stop hiking rates in response to the growing turmoil engulfing the global economy and global financial markets? The Fed feedback loop suggests that if the dollar rises enough, if U.S. spreads widen enough, and if deflationary pressures build enough in response to these shocks, it will back off, as it did in 2016 (Chart I-8). Chart I-8The Fed Policy Loop
Clashing Forces: The Fed And EM Financial Conditions
Clashing Forces: The Fed And EM Financial Conditions
However, the key question is that of the Fed's current pain threshold. We posit that 2018 is not 2016. As Ryan Swift argues in the most recent installment of BCA's U.S. Bond Strategy, the stronger the domestic economy is and the deeper domestic U.S. inflationary pressures are, the more the Fed will tolerate weaker global growth and tighter U.S. financial conditions.3 Currently, the U.S. domestic economy is so strong and so inflationary that despite less supportive U.S. financial conditions, our Fed Monitor still points toward more rate hikes in the coming quarters (Chart I-9). This is in sharp contrast to 2016, when the Fed Monitor highlighted the need for easier policy as U.S deflationary pressures were greater than inflationary ones. Chart I-9The BCA Fed Monitor 2018 Is Not 2016
The BCA Fed Monitor 2018 Is Not 2016
The BCA Fed Monitor 2018 Is Not 2016
As a result, we think that before the Fed blinks, the situation around the world will have to get worse. This means investors can expect further strength in the dollar and a further increase in borrowing costs around the world. Moreover, since the increase in U.S. bond yields is dominated by real rates, this means that the global cost of capital will continue its ascent - exactly as global growth is easing. This means financial markets could experience additional pain. In fact, Chart I-10 shows that the global shadow rate is a leading indicator of the currency market's volatility. Since the Fed is raising rates and the European Central Bank is tapering its asset purchases, the global shadow rate has scope to rise further. This points toward a continued increase in FX volatility. Higher FX volatility means that carry trades are likely to deteriorate again.4 If carry trades are to suffer more, this also implies that the current rebound in EM currencies is likely to prove temporary. Moreover, since an unwind in carry trades means that liquidity is leaving high interest rate countries, this also means that the EM FCI is set to tighten further, and global IP could suffer more. Chart I-10Higher Vol Ahead
Higher Vol Ahead
Higher Vol Ahead
Hence, we recommend investors maintain a defensive stance in their FX exposure, favoring the dollar and the yen over the euro and commodity currencies. To be clear, we bought the NZD last week, but this position is a hedge. China is trying to manage the growth slowdown and is attempting to implement targeted stimulus measures. The risk is real that Beijing over-stimulates, which would cause the USD to weaken. The NZD is the best place to protect investors against this risk. Bottom Line: The Fed will continue to tighten policy as the U.S. economy is running well above capacity, creating domestic inflationary pressures. Meanwhile, EM economies are being hit by the combined assault of Chinese deleveraging and tightening financial conditions. This means the Fed is hiking in an environment of sagging global growth. Since it will take more pain for the Fed to back off, the dollar will rise further and carry trades will bear the brunt of the pain as FX volatility will pick up more. Use any rebound in EM currencies to sell them. Do the same with commodity currencies; AUD/JPY has further downside ahead. Breathe A Sigh Of Relief: China Is Not A Currency Manipulator On Wednesday, the U.S. Treasury published its bi-annual Macroeconomic and Foreign Exchange Policies of Major Trading Partners of the United States report, better known in the market as the "Currency Manipulator Report." Despite the White House's vociferous pronouncements, the Treasury declined to name China a currency manipulator. This does not mean that it will not in the future, but it does mean that China may be willing to let the RMB weaken a bit further in the coming months to alleviate the pain of the trade war with the U.S. After all, a simple way to nullify the impact of tariffs is to let your currency fall. If Washington is not willing to take up this year's depreciation as a pretext for additional tariffs, then Beijing could just let the markets do its bidding and let the RMB weaken. This is dangerous for the global economy and for commodity prices. A weaker RMB means that the purchasing power of Chinese buyers in international markets will decline. This also means that the volume of Chinese purchases of industrial commodities could suffer. As a result, we continue to recommend investors minimize their exposure to the AUD. Moreover, a weaker RMB could cause fears of competitive devaluation across Asia, which means the Asian currency complex remains at risk. The most interesting piece of news from the report was that China only meets one of the three criteria that must be met to be deemed a currency manipulator: a bilateral trade surplus with the U.S. greater than US$20 billion. The Chinese aggregate current account surplus is well below the 3% of GDP threshold used by the U.S. Treasury, and the Chinese monetary authorities are not intervening in a single direction to depress their currency. But as Table I-1 shows, Japan, Germany and Korea already meet two of the Treasury's three criteria, and are thus ostensibly at an even greater risk of being named currency manipulators than China. However, the U.S. has already concluded a new trade deal with Korea that contains a currency component, and is seeking to do the same with Japan. Table I-1Where Does China Stand On The Treasury's Grid?
Clashing Forces: The Fed And EM Financial Conditions
Clashing Forces: The Fed And EM Financial Conditions
It is true that naming China a currency manipulator will ultimately be a political decision, and on this front, the outlook is not good for China due to the structural decline in U.S.-China relations. But a chat with Matt Gertken of our Geopolitical Strategy Service reminded us that the EU and the U.S. are beginning to negotiate a trade deal, and Germany's large trade surplus could easily become a target. The U.S. and EU did not conclude the TTIP trade deal, so there is no foundation for the upcoming negotiations as there was with Korea, Canada, and Mexico. This raises the risk that the negotiations could be difficult and that the White House could threaten to implement tariffs against Germany under section 232 of the Trade Expansion Act of 1962 as a lever during the negotiations to get a more favorable deal for the U.S. This also means that heated trade negotiations between Europe and the U.S. could become a source of headline risk in the coming months, especially in the New Year - something the market does not need. Ultimately the U.S.'s main beef is with China and the Trump administration will want Europe's assistance in that quarrel. But Trump may still believe he can use tough tactics with the EU along the way. Bottom Line: China is not a currency manipulator. China could use this lack of designation as an opportunity to let the RMB weaken a bit further in the coming months. Moreover, Germany's large trade surpluses and the impending U.S.-EU trade negotiations suggest that the White House could use the lever of tariffs under section 232. This means that the risk of U.S.-EU trade-war headlines hitting the wire in the winter will be meaningful, though not as consequential as the U.S.-China conflict. This will contribute to higher volatility in the FX market. Sell CAD/NOK A potentially profitable opportunity to sell CAD/NOK has emerged. To begin with, CAD/NOK is an expensive cross, trading 10% above its purchasing-power-parity equilibrium (Chart I-11). While valuations are rarely a good timing tool in the FX markets, the technical picture is also interesting as the Loonie is losing its upward momentum against the Nokkie (Chart I-12). Chart I-11CAD/NOK Is Expensive
CAD/NOK Is Expensive
CAD/NOK Is Expensive
Chart I-12From A Technical Perspective, CAD/NOK Is Vulnerable
From A Technical Perspective, CAD/NOK Is Vulnerable
From A Technical Perspective, CAD/NOK Is Vulnerable
Economics point to a favorable picture as well. Now that the Norges Bank has joined the Bank of Canada in increasing rates, peak policy divergence is over. When policy divergences were at their apex, CAD/NOK was not able to break out. With Norway's current account standing at 6.6% of GDP versus -3% for Canada, without the help of policy, the CAD is likely to lose an important support versus the NOK. Moreover, there is scope for upgrading interest rate expectations in Norway relative to Canada. As Chart I-13 illustrates, the Canadian credit impulse has fallen relative to that of Norway, and Canada's employment growth is contracting when compared to the Nordic oil producer. This helps explain why Canadian PMIs are near record lows vis-Ã -vis Norway's, and why Canadian relative LEIs are also plunging to levels only recorded twice over the past 20 years. Chart I-13Canada's Economy Is Underperforming Norway's
Canada's Economy Is Underperforming Norway's
Canada's Economy Is Underperforming Norway's
Additionally, CAD/NOK has historically tracked the performance of both exports and retail sales growth in Canada relative to Norway. Both these indicators have sharply diverged from CAD/NOK, and they suggest this cross could experience significant downside over the coming quarters (Chart I-14). This also further reinforces the idea that the Norwegian output gap may now be closing fast, especially relative to Canada. Chart I-14Economic Indicators Point To CAD/NOK Weaknesses
Economic Indicators Point To CAD/NOK Weaknesses
Economic Indicators Point To CAD/NOK Weaknesses
In fact, Norwegian core inflation has also gathered steam, rising at a 2.2% rate, in line with Canada's. Meanwhile, Norwegian house prices are proving sturdier than Canadian real estate prices. This combination of similar inflation, improving growth, and outperforming dwelling prices suggests there is scope for investors to upgrade their assessment of the Norges Bank's policy versus that of the BoC. Finally, CAD/NOK is often affected by the spread between the Canadian Oil Benchmark and Brent (Chart I-15). Currently, the WCS/Brent spread is at a record low and may well rebound a bit. However, BCA's Commodity & Energy Strategy service expects Brent prices to rise to US$95/bbl in 2019, with a significant right-tail risk due to supply-curtailment.5 As the bottom panel of Chart I-15 illustrates, the WCS/Brent spread is inversely correlated to aggregate oil prices. Thus, higher Brent prices, especially if caused by supply disruptions, could lead to a continued large discount in the Canadian oil benchmark, and therefore downside risk to CAD/NOK. Chart I-15CAD/NOK Likes Weak Oil Prices
CAD/NOK Likes Weak Oil Prices
CAD/NOK Likes Weak Oil Prices
This trade is not without risks. CAD/NOK is often positively correlated to the DXY dollar index. This means that this trade is at odds with our USD view. However, in the past five years, CAD/NOK and the DXY have diverged for more than two months more than 10 times. The current domestic fundamentals in Canada relative to Norway suggest that a low-correlation period is likely to emerge. Bottom Line: CAD/NOK is an attractive short. It is expensive and losing momentum exactly as the Canadian economy is falling behind Norway's. As such, investors are likely to upgrade their expectations for the Norges Bank relative to the BoC. This should weigh on CAD/NOK. No Brexit Risk Compensation In GBP; Sell GBP/NZD Six weeks ago, we published a Special Report arguing that while the pound was cheap on a long-term basis, its affordability mostly reflected the expensiveness of the greenback and that actually there was no risk premium embedded in the GBP to compensate investors for Brexit-related uncertainty.6 We argued that because there was a large stock of short bets on the GBP, the pound could rebound on a tactical basis but that such a rebound was likely to prove short-lived as there remained many political hurdles to pass before Brexit uncertainty abated. We thus expected GBP volatility to pick up. Now that the pound has rebounded, where do we stand? The Brexit risk premium remains as absent as it was in early September (Chart I-16). It is also true that the probability of a no-deal Brexit has decreased, which means that long-term investors could benefit from beginning to overweight the pound in their portfolios. However, a political labyrinth remains in front of us, which suggests that GBP volatility is likely to remain elevated, and that the pound could even suffer some tactical downside. Chart I-16No Brexit Risk Premium In GBP
No Brexit Risk Premium In GBP
No Brexit Risk Premium In GBP
We have decided to express this near-term bearish Sterling view by selling GBP/NZD as a way to avoid taking on more dollar risk. First, since November 2016, GBP/NZD has rallied by 20%. Today, long positioning in the pound relative to the Kiwi is toward the top end of the range that has prevailed since 2004 (Chart I-17). This suggests that long bets in the GBP versus the NZD have already been placed. Chart I-17Speculators Are Already Long GBP/NZD
Speculators Are Already Long GBP/NZD
Speculators Are Already Long GBP/NZD
Second, the U.K. and New Zealand are two countries where the housing market heavily influences domestic activity. In fact, as Chart I-18 shows, GBP/NZD tends to broadly track U.K. relative to New Zealand house prices. Currently, British residential prices are sharply weakening relative to New Zealand. Previous instances where GBP/NZD strengthened while relative dwelling prices fell were followed by vicious falls in this cross. Chart I-18Relative House Prices Point To A Weaker GBP/NZD...
Relative House Prices Point To A Weaker GBP/NZD...
Relative House Prices Point To A Weaker GBP/NZD...
Meanwhile, the U.K. LEI has fallen to its lowest level since 2008 relative to New Zealand's. Moreover, U.K. inflation seems to be rolling over while New Zealand's may be bottoming. This combination suggests that investors expecting more rate hikes from the Bank of England over the coming 12 months but nothing out of the Reserve Bank of New Zealand could be forced to adjust their expectations in a pound-bearish fashion. Finally, over the past four years, GBP/NZD has followed the performance of British relative to Kiwi equities with a roughly one-quarter lag. As Chart I-19 shows, this relationship suggests that GBP/NZD has downside over the remainder of the year. Chart I-19...And So Do Relative Stock Prices
...And So Do Relative Stock Prices
...And So Do Relative Stock Prices
Bottom Line: The British pound may be an attractive long-term buy, but the number of political landmines in the Brexit process remains high over the coming four months. As a result, we anticipate volatility in the GBP to remain elevated. Moreover, GBP has had a very nice bull run over the past two months and is now vulnerable to a short-term pullback. In order to avoid taking on more dollar risk, we recommend investors capitalize on the pound's tactical downside by selling GBP/NZD, as economic dynamics point toward a higher kiwi versus the pound. Mathieu Savary, Vice President Foreign Exchange Strategy mathieu@bcaresearch.com 1 Please see Foreign Exchange Strategy Weekly Report, titled "Canaries In The Coal Mine Alert: EM/JPY Carry Trades", dated December 1, 2017, and the Weekly Report, titled "Canaries In The Coal Mine Alert 2: More On EM Carry Trades And Global Growth", dated December 15, 2017, both available at fes.bcaresearch.com 2 Please see Emerging Markets Strategy Weekly Report, titled "EMs Are In A Bear Market" dated October 18, 2018, available at ems.bcaresearch.com 3 Please see U.S. Bond Strategy Weekly Report, titled "Rate Shock", dated October 16, 2018, available at usbs.bcaresearch.com 4 Please see Foreign Exchange Strategy Special Report, titled "Carry Trades: More Than Pennies And Steamrollers", dated May 6, 2016, available at fes.bcaresearch.com 5 Please see Commodity & Energy Strategy Weekly Report, titled "Odds Of Oil-Price Spike In 1H19 Rise; 2019 Brent Forecast Lifted $15 to $95/bbl" dated September 20, 2018, available at ces.bcaresearch.com 6 Please see Foreign Exchange Strategy Special Report, titled "Assessing the Geopolitical Risk Premium In the Pound", dated September 7, 2018, available at fes.bcaresearch.com Currencies U.S. Dollar Chart II-1USD Technicals 1
USD Technicals 1
USD Technicals 1
Chart II-2USD Technicals 2
USD Technicals 2
USD Technicals 2
Recent data in the U.S. has been mixed: The retail sales control group growth outperformed expectations, coming at 0.5%, while retail sales ex autos growth surprised to the downside, coming in at -0.1%. JOLTS job openings outperformed expectations, coming in at 7.136 million. Moreover, both continuing jobless claims and initial jobless claims surprised positively, coming in at 1.640 million and 210 thousand respectively. DXY has risen by roughly 0.6% this week. We continue to believe that the dollar has cyclical upside; as the fed will likely raise rates more than what is currently discounted by the market. Additionally, slowing global growth and positive momentum should also provide a boon for the dollar. Tactically, however, positioning remains stretched, which means that a short correction is likely. Report Links: In Fall, Leaves Turn Red, The Dollar Turns Green - October 12, 2018 Policy Divergences Are Still The Name Of The Game - August 14, 2018 The Dollar And Risk Assets Are Beholden To China's Stimulus - August 3, 2018 The Euro Chart II-3EUR Technicals 1
EUR Technicals 1
EUR Technicals 1
Chart II-4EUR Technicals 2
EUR Technicals 2
EUR Technicals 2
Recent data in the Euro area has been mixed: Industrial production yearly growth outperformed expectations, coming in at 0.9%. Moreover, construction output yearly growth also surprised to the upside, coming in at 2.5%. However, core inflation surprised negatively, coming in at 0.9%, while headline inflation was in line with expectations at 2.1%. EUR/USD has fallen by roughly 1% since last week. We expect the euro to have cyclical downside, given that it will be hard for the ECB to raise rates significantly in an environment where emerging markets are suffering. After all, Europe's economy is highly dependent on exports, which means that any hiccup in EM growth reverberates strongly on European inflation dynamics. Report Links: Will Rising Wages Cause An Imminent Change In Policy Direction In Europe And Japan? - October 5, 2018 Policy Divergences Are Still The Name Of The Game - August 14, 2018 Time To Pause And Breathe - July 6, 2018 The Yen Chart II-5JPY Technicals 1
JPY Technicals 1
JPY Technicals 1
Chart II-6JPY Technicals 2
JPY Technicals 2
JPY Technicals 2
Recent data in Japan has been positive: Capacity Utilization outperformed expectations, coming in at s positive 2.2%. It also increased relative to last month's reading. Moreover, industrial production yearly growth also surprised positively, coming in at 0.2%. Finally, the Tertiary Industry Index month-on-month growth also surprised to the upside, coming in at 0.5%. USD/JPY has been flat this week. We are neutral on USD/JPY on a cyclical basis, given that the tailwinds of rising rate differentials between U.S. and Japan will likely be counteracted by increased volatility, a positive factor for the yen. Investors who wish to hedge their short exposure to Treasurys can do so by shorting EUR/JPY, given that this cross is positively correlated to U.S. bond yields. Report Links: Will Rising Wages Cause An Imminent Change In Policy Direction In Europe And Japan? - October 5, 2018 Rhetoric Is Not Always Policy - July 27, 2018 Updating Our Long-Term FX Fair Value Models - June 22, 2018 British Pound Chart II-7GBP Technicals 1
GBP Technicals 1
GBP Technicals 1
Chart II-8GBP Technicals 2
GBP Technicals 2
GBP Technicals 2
Recent data in the U.K. has been mixed: The yearly growth of average earnings including and excluding bonus outperformed expectations, coming in at 2.7% and 3.1% respectively. However, the claimant count change surprised negatively, coming in at 18.5 thousand. Finally, while the core inflation number of 1.9% outperformed expectations slightly, headline inflation underperformed substantially, coming in at 2.4%. GBP/USD has decreased by roughly 1.5% this week. Overall, we are bearish on the pound in the short-term, given that there is very little geopolitical risk price into this currency at the moment. This means that GBP will be very sensitive to any flare up in Brexit negotiations. We look to bet on renewed Brexit tensions by shorting GBP/NZD. Report Links: Updating Our Long-Term FX Fair Value Models - June 22, 2018 Inflation Is In The Price - June 15, 2018 Updating Our Intermediate Timing Models - May 18, 2018 Australian Dollar Chart II-9AUD Technicals 1
AUD Technicals 1
AUD Technicals 1
Chart II-10AUD Technicals 2
AUD Technicals 2
AUD Technicals 2
Recent data in Australia has been mixed: The change in employment underperformed expectations, coming in at 5.6 thousand. Moreover, the participation rate also surprised to the downside, coming in at 65.4%. This measure also decreased from last month's number. However, the unemployment rate surprised positively, coming in at 5% and decreasing from the august reading of 5.3%; the labor underutilization measure tracked by the RBA also fell. AUD/USD has been flat this week. Overall, we continue to be bearish on the aussie, as the deleveraging campaign in China will be felt most strongly on China's industrial sector; a sector to which the Australian economy is highly levered, given that its main export is iron ore. Moreover, raising rates in the U.S. will continue to create an environment of volatility, hurting high beta plays like the AUD. Report Links: Policy Divergences Are Still The Name Of The Game - August 14, 2018 What Is Good For China Doesn't Always Help The World - June 29, 2018 Updating Our Long-Term FX Fair Value Models - June 22, 2018 New Zealand Dollar Chart II-11NZD Technicals 1
NZD Technicals 1
NZD Technicals 1
Chart II-12NZD Technicals 2
NZD Technicals 2
NZD Technicals 2
NZD/USD has risen by 0.4% this week. Last week, we bought the kiwi, as a hedge against dollar weakness. While the dollar has gained strength against most other currencies, the NZD has actually appreciated. We are also shorting GBP/NZD this week. This cross has broadly followed relative house price dynamics between U.K. and New Zealand, and the continued relative outperformance of kiwi housing points towards further weakening in GBP/NZD. Moreover, long positioning on this cross remains very high by historical standards, which means that there can significant downside for this cross on a 3 month basis. Report Links: In Fall, Leaves Turn Red, The Dollar Turns Green - October 12, 2018 Updating Our Long-Term FX Fair Value Models - June 22, 2018 Updating Our Intermediate Timing Models - May 18, 2018 Canadian Dollar Chart II-13CAD Technicals 1
CAD Technicals 1
CAD Technicals 1
Chart II-14CAD Technicals 2
CAD Technicals 2
CAD Technicals 2
USD/CAD has risen by roughly 0.5% this week. This week we are shorting CAD/NOK. This cross is expensive according to our PPP valuations. Moreover, the economic picture is also favorable for the NOK as the policy divergence between Norway and Canada has likely reached its peak. The credit impulse and the growth in employment are both stronger in Norway, while Norway's core inflation is now in line with Canada's. This means that rates in Norway have further upside, given that Canada's hiking cycle is much more advanced than Norway's. Report Links: Updating Our Long-Term FX Fair Value Models - June 22, 2018 Inflation Is In The Price - June 15, 2018 Rome Is Burning: Is It The End? - June 1, 2018 Swiss Franc Chart II-15CHF Technicals 1
CHF Technicals 1
CHF Technicals 1
Chart II-16CHF Technicals 2
CHF Technicals 2
CHF Technicals 2
Recent data in Switzerland has been negative: Producer price inflation underperformed expectations, coming in at 2.6%. Moreover, the trade balance also surprised to the downside, coming in at CHF 2.434 million. EUR/CHF has fallen by 0.7% this week, as the EU leaders have expressed their displeasure towards Italy's new fiscal plan. On a structural basis, we continue to be bearish on the franc, as inflationary pressures continue to be too weak in Switzerland for the SNB to move away from its ultra-dovish monetary policy. That being said, political risks in emanating from Europe could prove to be bearish for this cross on a tactical basis. Report Links: Updating Our Long-Term FX Fair Value Models - June 22, 2018 Updating Our Intermediate Timing Models - May 18, 2018 Value Strategies In FX Markets: Putting PPP To The Test - May 11, 2018 Norwegian Krone Chart II-17NOK Technicals 1
NOK Technicals 1
NOK Technicals 1
Chart II-18NOK Technicals 2
NOK Technicals 2
NOK Technicals 2
USD/NOK has risen by roughly 0.7% this week. The Norwegian krone is our favorite currency within the G10 commodity currencies. Norway is the only commodity currency with a substantial current account surplus. Furthermore, our commodity strategists expect oil to continue to strengthen, even though base metals might suffer in the face of Chinese monetary tightening. This relative outperformance by oil will help oil currencies outperform the NZD and the AUD. We are also shorting CAD/NOK this week, as Norway's economic strength is now matching Canada's. Thus, given that the Norges Bank has kept rates lower the BoC, there is room for rate differentials to move against CAD/NOK now that the Norwegian central bank has begun to lift its policy rate. Report Links: Updating Our Long-Term FX Fair Value Models - June 22, 2018 Updating Our Intermediate Timing Models - May 18, 2018 Value Strategies In FX Markets: Putting PPP To The Test - May 11, 2018 Swedish Krona Chart II-19SEK Technicals 1
SEK Technicals 1
SEK Technicals 1
Chart II-20SEK Technicals 2
SEK Technicals 2
SEK Technicals 2
USD/SEK has risen by roughly 0.7% this week. We are bullish on the Swedish krona on a cyclical basis, as rates in Sweden are too low for the current inflationary backdrop. In our view, the Risksbank will have to make sure sooner rather than later that its monetary policy matches the country's economic reality. We are also bearish on EUR/SEK, as current real rate differentials points to weakness for this cross. Furthermore, easing by Chinese monetary authorities could provide further downside to EUR/SEK. After all the SEK is more sensitive to liquidity conditions than the EUR, which means that when liquidity is plentiful, EUR/SEK suffers. Report Links: Updating Our Long-Term FX Fair Value Models - June 22, 2018 Updating Our Intermediate Timing Models - May 18, 2018 Value Strategies In FX Markets: Putting PPP To The Test - May 11, 2018 Trades & Forecasts Forecast Summary Core Portfolio Tactical Trades Closed Trades