China
Iron ore prices may have limited downside and could outperform steel prices over the next 12-15 months. This is primarily due to increasing shutdowns of mainland China iron ore mines. Government data show that Chinese domestic iron ore output contracted 40%…
On the supply side, coal output will rise only moderately (i.e., 2-3%) in 2019. There are three drivers pushing up Chinese coal output. In May the government asked domestic coal producers to ramp up coal output. 660 million tons of capacity is currently…
Production of both crude steel and steel products will rise considerably next year, as the steel sector's de-capacity target is almost reached and new advanced capacity will come quickly on stream to replace old or inefficient capacity that has already exited…

We have been overweighting Taiwanese stocks within an EM equity portfolio since 2007, and this bourse has outperformed the EM index by 30% since that time (Chart II-1). Presently, odds of a pullback in relative performance have risen considerably, and we recommend reducing allocation to this bourse from overweight to neutral. With the exception of DRAM prices, semiconductor prices are collapsing (Chart II-2). This is a nail in the coffin for this semi- and technology hardware-heavy bourse.
Take Profits On Overweight Taiwanese Stocks Position
Take Profits On Overweight Taiwanese Stocks Position
Deflation In Semiconductor Prices
Deflation In Semiconductor Prices
In the past, Taiwan has depreciated its currency to offset the impact of falling export prices in dollar terms on corporate profitability. This option is no longer available to the authorities. It seems the Trump administration has made it clear to the island that its political and military support partially hinges on Taiwan not intervening in the currency market. In short, the authorities will not be able to resort to material currency depreciation to fight deflation in manufacturing goods as they have in the past. This is bad news for Taiwan's manufacturing-heavy economy, and especially corporate profitability. Exports and manufacturing are decelerating (Chart II-3). Exports of electronic products parts lead non-financial EBITDA, and currently foreshadow a deteriorating profit outlook (Chart II-4).
Taiwan's Business Cycle
Taiwan's Business Cycle
Taiwan: Corporate Profits Are At Risk
Taiwan: Corporate Profits Are At Risk
The recent underperformance of Taiwanese small-cap stocks versus their EM peers is a red flag for the relative performance of large caps. Last but not least, Taiwan is extremely exposed to U.S.-China strategic tensions, as our geopolitical team has argued.1 Escalating geopolitical and strategic tensions between the U.S. and China are taking us closer to a point where these risks are set to materialize, and the risk premium on Taiwanese equities to rise. This will hurt Taiwanese stocks' performance in both absolute and relative terms. Bottom Line: We are downgrading our allocation to Taiwanese stocks from overweight to neutral within an EM equity portfolio. This bourse is also vulnerable in absolute terms. This shift is also consistent with our overall portfolio strategy of reducing equity allocations to Asia in favor of Latin America, as well as with our new equity trade of shorting emerging Asia versus Latin America - a recommendation we made last week. In emerging Asia, having downgraded Taiwan, we now remain overweight only in Korea and Thailand. Footnotes 1 Please see Geopolitical Strategy/Emerging Markets Strategy Special Report "Taiwan Is A Potential Black Swan," dated March 30, 2018, the link is available on ems.bcaresearch.com
Highlights The pace of "de-capacity" reforms in China will continue to diminish, with declining shutdowns of inefficient capacity and rising advanced capacity over the next 12-15 months. Coal prices may have less downside than steel prices due to more resilient domestic demand, and lower production growth for the former than the latter. Meanwhile, iron ore prices may have limited downside and could outperform steel prices due to increasing shutdowns of domestic iron ore mines. Go long September 2019 thermal coal and iron ore futures versus September 2019 steel rebar futures. Chinese coal producers' shares may outperform Chinese steel producers' shares. Feature This April, our Special Report titled, "Revisiting China's 'De-Capacity' Reforms," painted a negative picture for steel and coal prices over 2018 and 2019 on diminishing pace of "de-capacity" reforms and rising steel and coal output.1 So far, our call has not yet played out. Both steel and coal prices have been firm over the past five months (Chart 1A). Meanwhile, iron ore and coking coal have also rebounded (Chart 1B). Chart 1ASteel And Coal Prices: More Upside Ahead?
Steel And Coal Prices: More Upside Ahead?
Steel And Coal Prices: More Upside Ahead?
Chart 1BIron Ore And Coking Coal Prices: Following Steel And Coal Prices?
Iron Ore And Coking Coal Prices: Following Steel And Coal Prices?
Iron Ore And Coking Coal Prices: Following Steel And Coal Prices?
In this report, we return to the analysis we laid out back in April, with the goal of identifying whether or not the rally in steel and coal prices will continue. Another major question to answer is why share prices of coal and steel companies have continued to plunge, even though coal and steel prices have held up well. In brief, our research findings still suggest that steel and coal prices are likely to fall over the next 12-15 months on a diminishing pace of de-capacity (less shutdowns of old capacity) and rising advanced capacity. We also reckon that coal prices may have less downside than steel prices over the next 12-15 months due to more resilient domestic demand and smaller production growth compared to steel; we conclude by outlining a long/short trade opportunity tied to this view. Understanding The Recent Price Rally The recent strength in both steel and coal prices has been due to a tighter supply-demand balance than we expected: Steel Falling steel product output and still-solid steel demand growth have pushed up steel prices this year. While crude steel production has had strong growth so far this year (9% year-on-year and 50 million tons in volume), total output of steel product has actually declined by 20 million tons (2.7%) year-on-year during the same period (Chart 2). Steel products, including rebars, wire rods, sheets and other items, are made from crude steel and consumed in end consumption. Tianjin province - a city very close to Beijing - accounted for more than 100% of the reduction of steel product output, as 40% of the province's operating capacity was shut down due to the city's "de-capacity" policy and increasingly stringent environmental regulations. In addition, Chinese steel products production had already experienced huge cut last year by nearly 100 million due to the government's "Ditiaogang" de-capacity policy.2 As a result, strong crude steel output growth this year has not been able to lift steel product production from contraction, creating a shortage in Chinese steel product supply. To put it in perspective, total steel products production for the first eight months of this year is at a five-year low. Chart 2Falling Steel Product Output Amid Strong Crude Steel Production Growth
Falling Steel Product Output Amid Strong Crude Steel Production Growth
Falling Steel Product Output Amid Strong Crude Steel Production Growth
Chart 3Steel Demand Has Been Robust As Well
Steel Demand Has Been Robust As Well
Steel Demand Has Been Robust As Well
Meanwhile, massive pledged supplementary lending (PSL) injections - the People's Bank of China's direct lending to the real estate market - had extended property sales and starts beyond what appeared to be a sustainable trajectory, thereby lifting steel demand to some extent3 (Chart 3). Hence, weaker-than-expected steel products supply combined with slightly better demand than we anticipated have tightened the Chinese domestic steel market further, and underpinned high steel prices. Coal Similarly, the rebound in coal prices has also been due to declining output and strong demand growth. Chinese coal output turned out to be much weaker than we expected due to extremely stringent and frequent environmental and safety inspections on coal output (Chart 4). Back in mid-2017, in order to curb pollution, China demanded that coal mines plant trees, boost efficiency, cut down noise and seal off facilities from the outside world as part of a new "green mining" plan. This year's inspection have been even more stringent. Operations among coal mines, coal-washing plants and coal storage facilities were halted immediately if inspection teams found they failed to meet the related standards. As a result, Chinese coal production contracted 1% for the first eight months of this year. Chart 4Weaker-Than-Expected Coal Output
Weaker-Than-Expected Coal Output
Weaker-Than-Expected Coal Output
Chart 5Resilient Thermal Coal Demand
Resilient Thermal Coal Demand
Resilient Thermal Coal Demand
On the demand side, electricity generation from thermal power has remained quite robust at 7% (Chart 5). Again, coal prices have rebounded as the domestic coal supply-demand balance has tightened. Will Steel And Coal Prices Continue To Rise? The short answer is no. Many of the drivers underpinning the recent rally in steel and coal prices are set to fade over the next 12-15 months: Steel Steel prices will likely weaken in 2019 on rising steel product output and faltering steel demand growth. First, production of both crude steel and steel products will rise considerably next year, as the steel sector's de-capacity target is almost reached and new advanced capacity will come on stream faster to replace old or inefficient capacity that has already exited the market. Table 1 showed the 82% of this year's steel de-capacity target was already achieved by the end of July, leaving not much in the way of additional de-capacity cuts needed through the remainder of 2018. If this year's de-capacity cut target of 30 million tons is fulfilled over the next two months, there will be no need for any more capacity cuts in 2019, as the high end of the 2016-2020 de-capacity target (150 million tons) will be fully met this year. Table 1Supply-Side Reform - Capacity Reduction Target And Actual Achievement
Revisiting China's De-Capacity Reforms
Revisiting China's De-Capacity Reforms
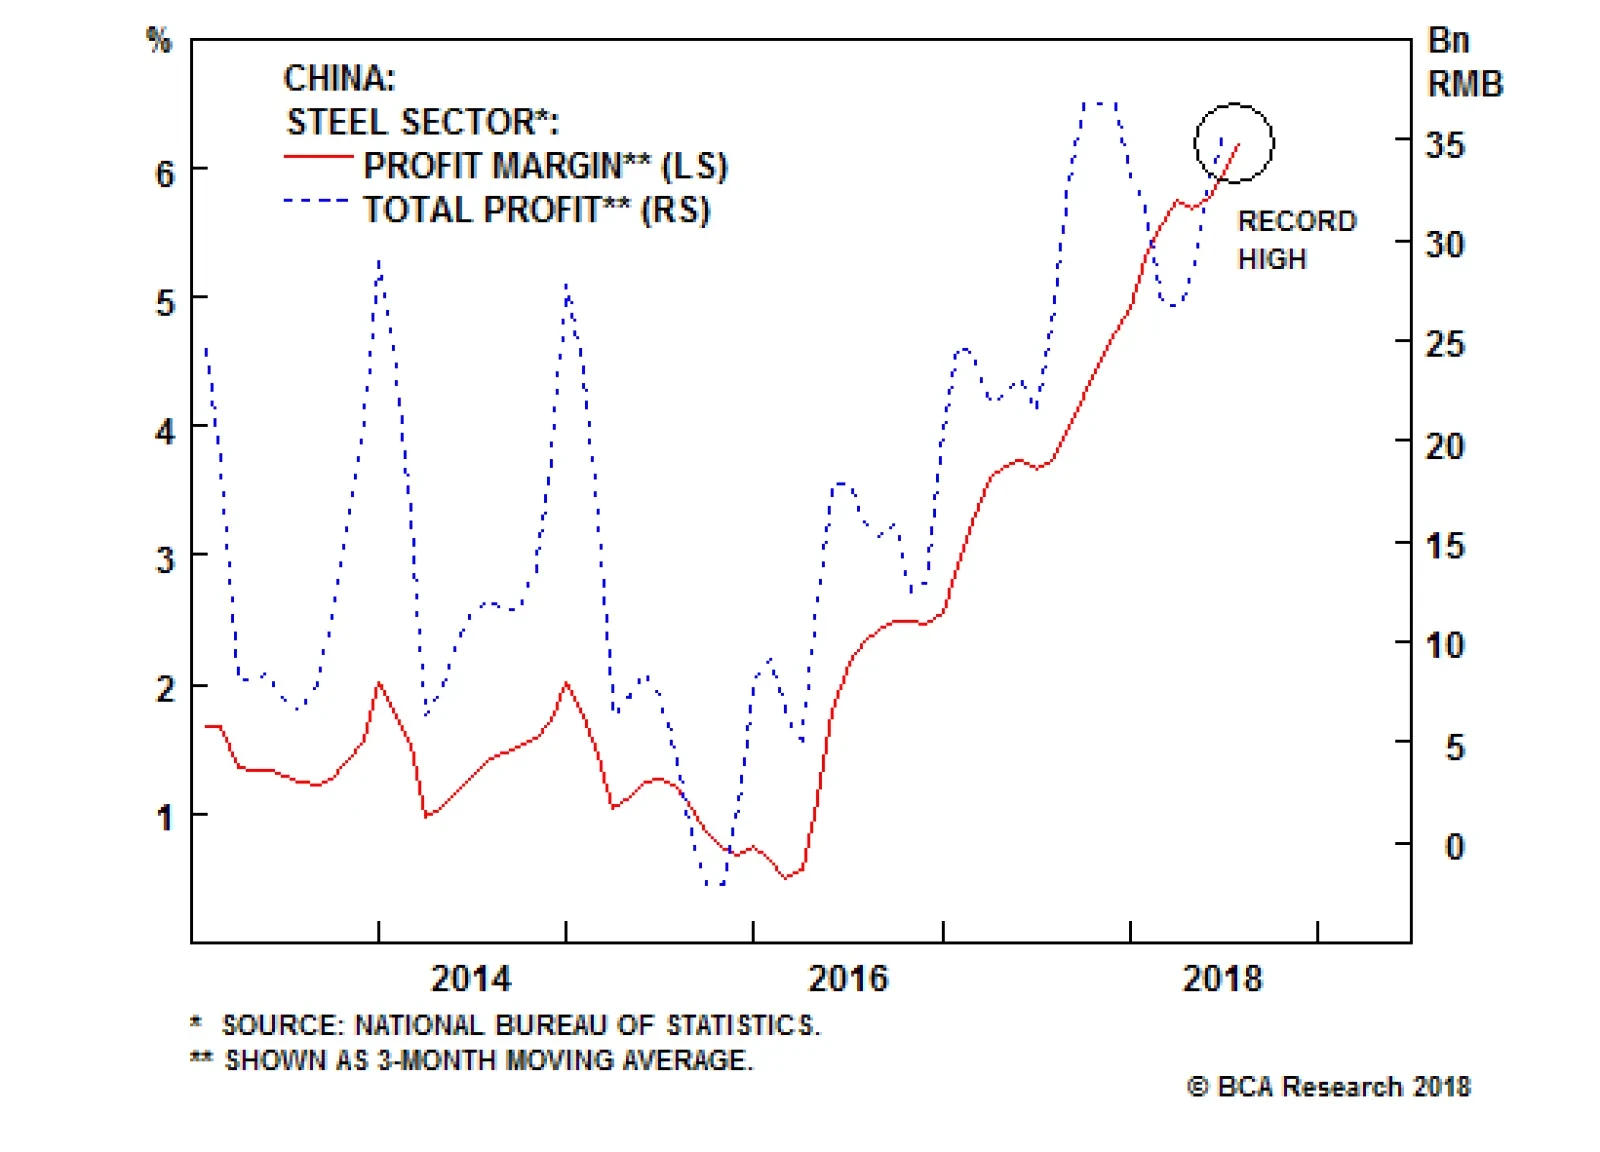
Record-high profit margins that Chinese steel producers are currently enjoying will also help boost steel production (Chart 6). This was the main driver behind this year's strong growth in crude steel output, despite more stringent environmental policies and ongoing de-capacity efforts. In addition, falling graphite electrode prices and increasing graphite electrode production will facilitate the expansion of cleaner electric furnace (EF) steel capacity and production in China (Chart 7). Chart 6Steel Producers' Profit Margin: At A Record High
Steel Producers' Profit Margin: At A Record High
Steel Producers' Profit Margin: At A Record High
Chart 7Rising Graphite Electrode Supply Will Facilitate EF Steel Output
Rising Graphite Electrode Supply Will Facilitate EF Steel Output
Rising Graphite Electrode Supply Will Facilitate EF Steel Output
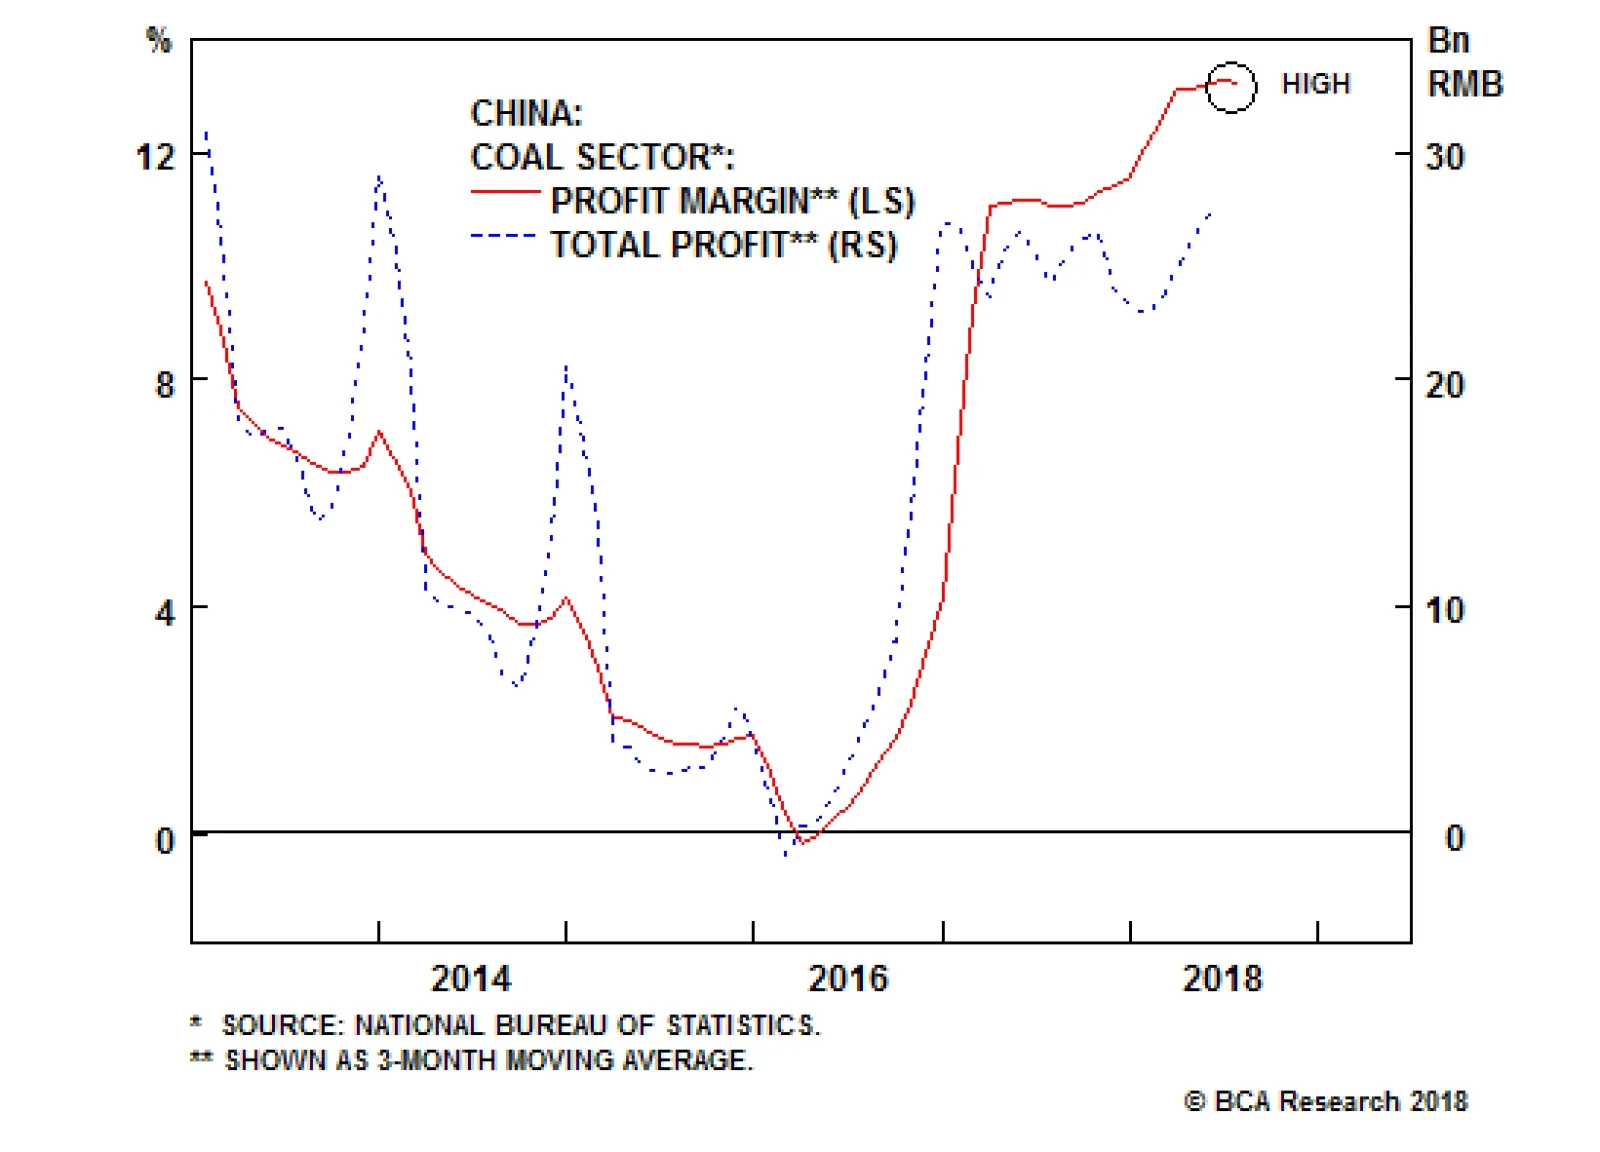
EF technology uses scrap steel as raw materials, graphite electrodes and electricity to produce crude steel. The availability of graphite electrode has been one major bottleneck for the development of EF capacity. As of late 2017, there were about 524,000 tons of new graphite electrode capacity under construction, most of which will be completed within the next two years. This will nearly double the current capacity of 590,000 tons. As this capacity gradually enters into the market, graphite electrode prices will drop further, encouraging more EF steel projects. In 2017, newly added EF steel capacity was about 30 million tons, and EF steel production increased by about 24 million tons (47% year-on-year). With rising graphite electrode supply, EF capacity this year is expected to add 40 million tons, resulting in about a 25-30 million ton increase in EF steel output. In 2019, based on the government's goal of 15% of total steel production being EF steel by 2020, we expect another 25-30 million tons new EF capacity to come online. This alone would translate into 3-4% rise in steel product production in 2019. Second, while steel supply is rising, the demand outlook seems more pessimistic. Our September 13 Special Report titled, "China's Property Market: Where Will It Go From Here?" concluded that the Chinese property market is facing increasing downside risks. Diminishing PSL direct financing from the central bank and shrinking funding sources for Chinese real estate developers point to a considerable slowdown in property starts and construction, which will eventually lead to faltering demand for steel. Chinese auto output growth is weak, with the three-month moving average growth registering a 6% contraction this September. The government has boosted infrastructure projects. This will support steel demand to some extent, but it is unlikely to offset demand weakness from the down-trending property market. The property market is the biggest steel-consuming sector, accounting for 38% of total Chinese steel consumption - much higher than the 23% share from the infrastructure sector. Bottom Line: Steel prices may stay high over the next two or three months due to low inventories and heating-season production controls within the steel industry. Nonetheless, steel prices are vulnerable to the downside over the next 12-15 months on rising steel product output and faltering steel demand growth. Coal Coal prices will likely decline over the next 12-15 months, but the price downside may be less than that of steel. First, on the supply side, coal output will rise only moderately (i.e., 2-3%) in 2019. There are three drivers pushing up Chinese coal output. The government in May asked domestic coal producers to ramp up coal output, as current coal market supply has been tight this year. Particularly, the National Development and Reform Commission (NDRC) demanded that the top three coal produce provinces (Shanxi, Shaanxi, and Inner Mongolia) increase their aggregated coal output by at least 300,000 tons per day as soon as possible. However, the June-July environmental inspections within the major producing province of Mongolia resulted in a 14 million ton year-on-year drop in the province's coal output. If the 300,000 ton per day increase is realized in 2019, it will be equivalent to nearly 100 million tons of new coal supply next year, which is about 2.8% growth from 2017's output of 3.52 billion tons. Based on government data, 660 million tons of capacity is currently under construction, which includes new technologically advanced capacity that has already been built and ready to use but has not yet received government approval. If 30% of the under-construction capacity comes to market in 2019 and runs at a capacity utilization rate of 70%, it will translate into about 140 million tons of new coal supply next year, which is about 4% growth from last year. Due to too-strict production policies during the winter heating season, there was a coal supply crisis last winter. This year, the government is likely to implement a less stringent production policy for coal. In this case, coal producers will likely produce more to take advantage of seven-year-high profit margins (Chart 8). Chart 8Coal Producers' Profit Margin: At A Multi-Year High
Coal Producers' Profit Margin: At A Multi-Year High
Coal Producers' Profit Margin: At A Multi-Year High
However, at the same time there are also two drivers dragging down coal output. Table 1 above shows that at the end of July, only 53% of this year's coal de-capacity target and 65% of the government's 2016-2020 coal capacity reduction target had been achieved. This implies that Chinese coal producers still need to cut 70 million tons of old coal capacity through the remainder of 2018 and another 210 million tons of inefficient capacity in the coming two years (2019 and 2020) - possibly 105 million tons of cuts in each year. Similar to steel, coal de-capacity reforms are also diminishing (e.g. a 150-million ton reduction target in 2018 versus a 105 million-ton reduction target in 2019). However, different from steel, the remaining de-capacity target for coal is still quite significant. With continuing the implementation of its de-capacity plan, excluding the three major producing provinces, the remaining provinces that in general have smaller-scale coal mines may face further cuts in their coal production. For the first eight months of this year, 13 out of the 22 non-top-three coal-producing provinces registered a contraction in coal output. Environmental policies will likely remain strict, given the country seems determined to improve its air quality. More frequent inspection and/or stricter policies will further curb coal production. On balance, we still expect overall coal output to increase moderately (i.e., 2-3%) next year. Second, on the demand side, coal demand growth will weaken only slightly due to robust thermal coal consumption for thermal power generation (Chart 5 above). We expect Chinese electricity consumption to grow at 5-6% next year - a touch lower than this year - on strong demand from both the residential and service sectors. Most of the growth will likely be supplied by thermal power, as some 72% of total electricity generation is currently thermal power. In addition, the government has limited hydropower and nuclear power projects coming onstream next year. In the meantime, coal consumption for heating will likely be replaced by natural gas or electricity, and coking coal demand may fall due to EF steel expansion and more use of scrap steel in blast furnaces. Bottom Line: Coal prices are likely to head south on rising supply and weakening demand growth next year. In addition, we expect coal prices to fall less than steel prices over the next 12-15 months on a tighter supply-demand balance for the former than the latter. What About The Iron Ore Market? The outlook for iron ore prices is becoming less downbeat. Iron ore prices may have limited downside and could outperform steel prices over the next 12-15 months - due to increasing shutdowns of mainland iron ore mines. Government data show that Chinese domestic iron ore output contracted 40% year-on-year in the first eight months of this year (Chart 9). About 60% of the decline was from Hebei - the province that has probably imposed the strictest environmental policies among all the provinces targeting ferrous- and coal- related industries - due to its proximity to the capital, Beijing. Chart 9Significant Drop In Domestic Iron Ore Output
Significant Drop In Domestic Iron Ore Output
Significant Drop In Domestic Iron Ore Output
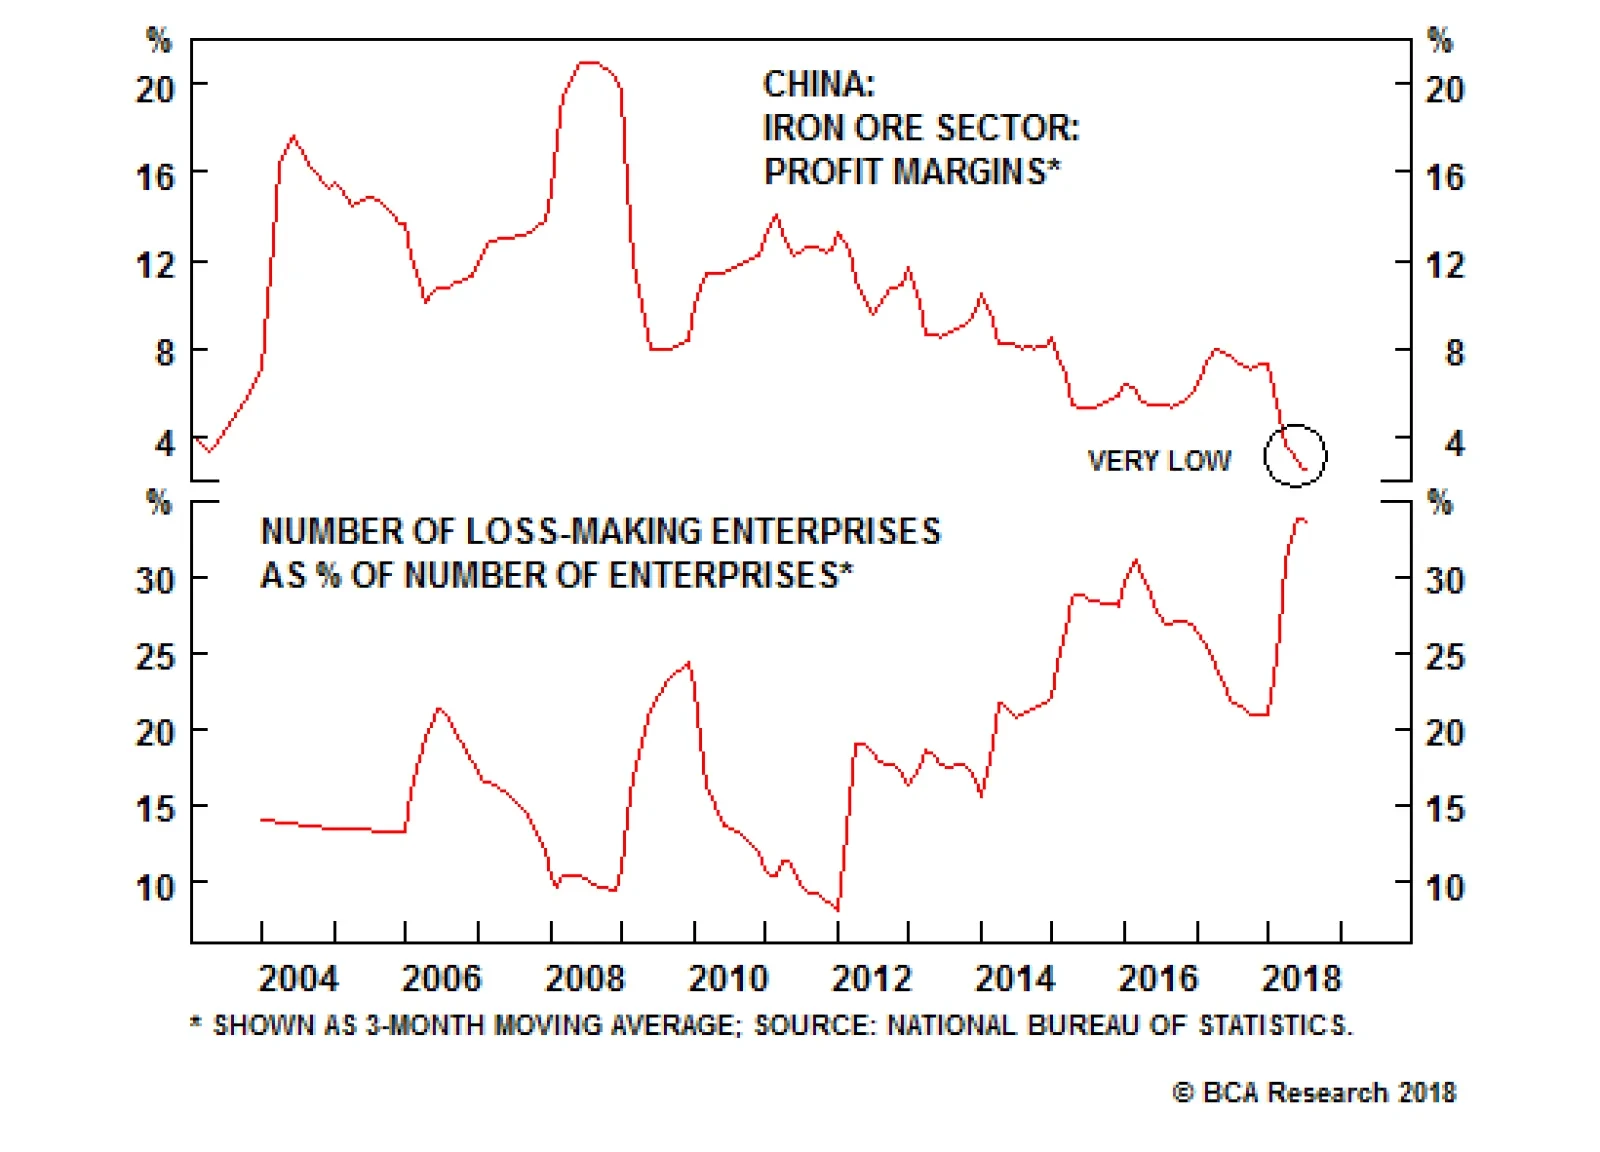
Profit margins for iron ore miners has tanked to a 15-year low due to rising production costs on environmental protections. The number of loss-making enterprises as a share of the total number of iron ore companies has reached a record high (Chart 10). Although EF steel capacity additions will contribute to most of the growth in crude steel output next year, non-EF crude steel capacity, which uses iron ore as its main input, will also increase to some extent. This will also lift iron ore demand, which will lead to further declines in port inventories and rising imports (Chart 11). Chart 10Iron Ore Producers' Profit Margin: At A 15-Year Low
Iron Ore Producers' Profit Margin: At A 15-Year Low
Iron Ore Producers' Profit Margin: At A 15-Year Low
Chart 11Chinese Iron Ore Imports Are Likely To Go Up
Chinese Iron Ore Imports Are Likely To Go Up
Chinese Iron Ore Imports Are Likely To Go Up
Bottom Line: We are less bearish on iron ore prices and expect them to outperform steel prices. Chinese iron ore imports will likely grow again. Investment Implications Three main investment implications can be drawn from our analysis. Price ratios of thermal coal/steel rebar and iron ore/steel rebar have fallen to record low levels (Chart 12). As we expect thermal coal and iron ore prices to outperform steel, we recommend going long September 2019 thermal coal futures/short September 2019 steel rebar futures and going long September 2019 iron ore futures/short September 2019 steel rebar futures on Chinese exchanges in RMB. Chinese coal imports including both thermal coal and coking coal could remain strong, which would at a margin be positive news for Chinese major coal importers Australia, Indonesia, Russia and Mongolia. In the meantime, Chinese iron ore imports are likely to rebound in 2019 as well. This will be positive news for producers in Australia, Brazil and South Africa. Chart 12Both Thermal Coal And Iron Ore Will Likely Outperform Steel
Both Thermal Coal And Iron Ore Will Likely Outperform Steel
Both Thermal Coal And Iron Ore Will Likely Outperform Steel
Chart 13Coal Producers' Shares May Outperform Steel Producers' Stocks
Coal Producers' Shares May Outperform Steel Producers' Stocks
Coal Producers' Shares May Outperform Steel Producers' Stocks
Despite stubbornly high coal and steel prices, Chinese share prices of coal producers and steel producers have still plunged (Chart 13, top and middle panel). From a top-down standpoint, it is hard to explain such poor share price performance among Chinese steel and coal companies when their profits have been booming. Our hunch is that these companies have been forced by the government to shoulder the debt of their peer companies that were shut down. This is an example of how the government can force shareholders of profitable companies to bear losses from restructuring by merging zombie companies into profitable ones. Based on our analysis, Chinese steel producers' share prices are still at risk of falling steel prices, while coal-producing companies may benefit from rising production and limited downside in coal prices. Hence, Chinese coal producers' shares may continue to outperform steel producers' shares with the price ratio of the former versus the latter just rebounding from three-year lows (Chart 13, bottom panel). Ellen JingYuan He, Associate Vice President Emerging Markets Strategy EllenJ@bcaresearch.com 1 Pease see Emerging Markets Strategy Special Reports "China's 'De-Capacity' Reforms: Where Steel & Coal Prices Are Headed", dated November 22, 2017, and "Revisiting China's De-Capacity Reforms", dated April 26, 2018, available at ems.bcaresearch.com. 2 Ditiaogang" is low-quality steel made by melting scrap metal in cheap and easy-to-install induction furnaces. These steel products are of poor quality and also lead to environmental degradation. As "Ditiaogang" is illegal in China, it is not recorded in official crude steel production data. However, after it is converted into steel products, official steel products production data do include it. Consequently, last year's significant removal of "Ditiaogang" and statistical issues have caused the big divergence between crude steel production expansion and steel products output contraction since then. 3 Pease see China Investment Strategy Special Report "China's Property Market: Where Will It Go From Here?", dated September 13, 2018, available at cis.bcaresearch.com. Cyclical Investment Stance Equity Sector Recommendations
Highlights So What? The odds of the Democrats taking the Senate have fallen. Meanwhile China's policy easing will benefit China itself, or consumer goods exporters, more so than other EMs. Why? China is the fulcrum of global macro at the moment - only a sharp spike in credit growth will signal a total capitulation by President Xi Jinping. We are lowering the odds of a Democratic takeover of the House from 70% to 65%, while in the Senate the odds fall from 50% to 40%. Generational warfare is one of our new long-run investment themes - it will help define the 2020 election. Feature Amidst the market correction last week, it was easy for investors to take their eyes off the ball: Chinese policy. Chart 1U.S. Is In Rude Health...
U.S. Is In Rude Health...
U.S. Is In Rude Health...
The ongoing macro environment is one of policy divergence, with the U.S. economy in "rude health," (Chart 1) - to quote BCA's Chief U.S. Strategist Doug Peta - while Chinese growth disappointed under the pressure of macroprudential structural reforms (Chart 2). The dueling policies have converged to produce epic tailwinds for the U.S. dollar (Chart 3) and correspondingly headwinds for global risk assets. Chart 2...But China Still Struggling
...But China Still Struggling
...But China Still Struggling
Chart 3Epic Tailwinds For The Dollar
Epic Tailwinds For The Dollar
Epic Tailwinds For The Dollar
Amidst this backdrop, investors have finally come to terms with the first portion of our thesis: the Fed will respond to robust U.S. growth. Merely weeks ago, markets doubted that the Fed had the temerity to raise interest rates beyond a single hike in 2019. Today, despite President Trump's rhetoric, there is no doubt which way the Fed will guide interest rates next year (Chart 4). Chart 4The Fed Will Keep Hiking
The Fed Will Keep Hiking
The Fed Will Keep Hiking
A surge in expectations for hawkish Fed policy beyond 2018 should be detrimental for global risk assets. A determined Fed, racing to meet the rising U.S. neutral rate, may tighten global monetary policy too much given that the global neutral rate is likely lower. That view would support remaining overweight U.S. assets and underweight EM well into 2019. Chart 5Signs That China Is Stimulating
Signs That China Is Stimulating
Signs That China Is Stimulating
China is the fulcrum upon which this view will balance. Beijing continues to signal policy easing. BCA Foreign Exchange Strategy's "China Play Index" has perked up, suggesting that global assets are sniffing out the bottoming of restrictive policy (Chart 5). Our own checklist, which would falsify our thesis that Chinese policymakers will avoid a stimulus "overshoot," is starting to see some movement (Table 1). Table 1Will China's Policy Easing Produce A Stimulus Overshoot?
The U.S. Midterms And China's Stimulus
The U.S. Midterms And China's Stimulus
If China ramps up stimulus to keep pace with U.S. growth - itself a product of pro-cyclical fiscal stimulus - global risk assets may rally significantly. Our recommendation that investors buy the China Play Index as a portfolio hedge to our bearish view of global risk assets has only returned 0.7% since August 8. China: Credit Data Holds The Key Is it time to ditch the safety of U.S. stocks and embrace ROW? Chart 6What Will September Credit Data Bring?
What Will September Credit Data Bring?
What Will September Credit Data Bring?
No, at least not yet. It is true that China is clearly shifting towards stimulus. As we go to press, the credit data for September has not yet appeared, but a sharp reversal in credit growth will be necessary to convince global markets that Xi Jinping has fully abandoned his efforts to impose more discipline on China's banks, shadow banks, local governments, and local government financing vehicles (Chart 6). It will be crucial to watch for a reversal in non-bank credit growth, which would suggest that Xi is capitulating on shadow banking, which would then imply a larger reflationary push overall (Chart 7). Chart 7Shadow Bank Crackdown To Lighten Up?
Shadow Bank Crackdown To Lighten Up?
Shadow Bank Crackdown To Lighten Up?
The monetary policy setting is currently as easy as in 2016, although there has been no substantive change since July and People's Bank of China chief Yi Gang has signaled that while more can be done, his policy remains "prudent and neutral" (Chart 8). So far this year there have been four cuts to banks' required reserve ratios - it will take additional cuts to signify policy easing beyond expectations as of July (Chart 9). Easier monetary policy implies additional currency depreciation, which could have a reflationary effect. Chart 8Lending Rates Will Decline Substantially If Repo Rates Don't Rise
Lending Rates Will Decline Substantially If Repo Rates Don't Rise
Lending Rates Will Decline Substantially If Repo Rates Don't Rise
Chart 9RRR Cuts Can Continue
RRR Cuts Can Continue
RRR Cuts Can Continue
Local government brand new bond issuance is catching up to the previous two years', despite a late start. We expect this indicator to be abnormally strong in the closing months of the year, making for an overall increase year-on-year (Chart 10). Local governments are responding to the central government's encouragement to borrow and spend more. Chart 10Local Governments Borrowing More
The U.S. Midterms And China's Stimulus
The U.S. Midterms And China's Stimulus
Further, global trade war concerns may abate in the coming months. There is still no guarantee that U.S. President Donald Trump will meet his Chinese counterpart Xi Jinping at the G20 leaders' summit in Argentina at the end of November. Both sides are expected to bring negotiating teams to this meeting if it goes forward. While no formal talks have taken place since August 23, Treasury Secretary Steven Mnuchin did meet with China's central bank Governor Yi Gang on the sidelines of the World Bank Annual Meeting in Bali, Indonesia. They discussed China's foreign exchange policy and the potential meeting between Trump and Xi. Our structural view is that the Sino-American tensions are hurtling towards a modern version of a Cold War. However, that structural view can have cyclical deviations. A pause in U.S.-China acrimony - though not a reversion to status quo ante - could manifest by the end of the year. Chart 11U.S. Is Winning The Trade War...
U.S. Is Winning The Trade War...
U.S. Is Winning The Trade War...
Trade policy uncertainty has greatly favored U.S. assets relative to global, both in terms of equities (Chart 11) and the U.S. dollar (Chart 12). Even a temporary truce, if combined with further Chinese stimulus, could reverse the trend. Chart 12...And So Is The U.S. Dollar
...And So Is The U.S. Dollar
...And So Is The U.S. Dollar
As such, we can see a temporary pullback in our central thesis of policy divergence, one that benefits global risk assets in the immediate term. However, we caution investors from believing that a structural shift is in place that favors EM and high-beta assets. Put simply, we doubt that China will stimulate as aggressively as it did in 2016, 2012, or 2009 (Chart 13). There is just too much political capital already sunk into macroprudential reforms. Beijing policymakers are therefore sending mixed signals, both looking to stabilize growth rates and contain leverage. Chart 13Expect A Weaker Jolt This Time
Expect A Weaker Jolt This Time
Expect A Weaker Jolt This Time
Several clients have pointed out that the pace and intensity of stimulus is not important. Even a modest turn in Chinese policy will be a strong catalyst for global risk assets at the moment given that the context of 2018-2019 is much more favorable than 2015-2016. In other words, the world is not facing a global manufacturing recession precipitated by a historic decline in commodity prices as it was in 2015. Today, the world needs a lot less from China to spark a cyclical recovery. We are not so sure. First, the big difference between 2015-2016 and today is not the health of the global economy but the health of the U.S. economy and the fact that the Fed is much further along in its tightening cycle. In 2016, the Fed took a 12-month vacation after hiking rates in December 2015, as the amount of slack in the U.S. economy was much larger (Chart 14). Today, the market has begun to price in expectations of further rate hikes in 2019. Chart 14Output Gap Is Closed
Output Gap Is Closed
Output Gap Is Closed
Second, China's foreign exchange policy could still prove globally deflationary. China faces an exogenous risk today - the trade war - that it did not face in 2015-16. At that time the currency fell amidst financial turmoil, capital outflows, and policy devaluation. But it bottomed in late 2016 after the PBoC defended it robustly, the government imposed strict capital controls, and stimulus stabilized growth. Today the CNY has come under downward pressure again from slower growth, easing monetary policy, and manipulation to retaliate against U.S. tariffs. Despite capital controls, the one year swap-rate differential between China and the U.S. appears to be leading CNY/USD further downward (Chart 15). Given that China's current policy easing is heavily reliant on monetary easing, CNY/USD has more downside. Chart 15Interest Rate Differentials And CNY-USD: A Tight Link
Interest Rate Differentials And CNY-USD: A Tight Link
Interest Rate Differentials And CNY-USD: A Tight Link
Chinese currency trajectory is therefore an important gauge for global investors. Downside beyond the psychological barrier of 6.9-7.0 CNY/USD will at some point have a deflationary rather than reflationary global impact. The PBoC may hold the line and prevent further depreciation, in which case any additional stimulus measures will reinforce this line. But if China adopts more aggressive fiscal and credit stimulus and yet the currency still depreciates due to the U.S. conflict, then China's import demand will not rise by as much as the stimulus would imply. Domestic sentiment will worsen, causing capital outflow pressure to rise, and EM currencies and global growth expectations will suffer. As such, we prefer to play Chinese stimulus through exposure to Chinese equities (ex-tech) relative to other EM equities. Chinese stimulus, we argue, will stay in China, rather than rescue global risk assets. Within EM ex-China, we generally prefer equity indices that are exposed to the Chinese consumer over those exposed to resource-oriented "old China." A key point about China's current policy easing is the use of tax cuts more so than credit-fueled infrastructure construction: the goal of the reform agenda is to boost the consumption share of the economy. As such, we have been recommending that clients overweight South Korea and Malaysia relative to EM benchmarks. Bottom Line: Chinese policy is the fulcrum upon which global policy divergence will turn. If Chinese stimulus overshoots, investors should expand beyond the safety of U.S. assets and spring for global risk assets. At the moment, our view is that Chinese stimulus will not cause global economies to re-converge. Instead, it will benefit Chinese equities relative to other EM plays, and EM markets that export consumer goods to China. Overall, however, we remain cautious on global risk assets. Midterm Update: Did Trump Declare A Generational War? Chart 16GOP Improves In Key Senate Races
The U.S. Midterms And China's Stimulus
The U.S. Midterms And China's Stimulus
The Democratic Party's midterm election strategy of opposing Supreme Court Justice Brett Kavanaugh's nomination has failed to work in key Senate races, where President Trump has rallied his base in reaction to the contentious nomination hearings. Polls now indicate that several Republican Senate candidates are in the lead, including the three that we are watching most closely: Tennessee, Arizona, and Nevada (Chart 16). Our own Senate model, which has been generous to Democrats, now sees Arizona, Tennessee, and Missouri as likely going to the Republican Party (Chart 17). Nevada is still projected to flip to the Democratic Party, but the GOP retains the current 51-49 Senate makeup. Chart 17Our Model Suggests Senate Race Will Be A Wash
The U.S. Midterms And China's Stimulus
The U.S. Midterms And China's Stimulus
Political betting markets have sniffed out the shift in Senate polls, with the probability of the GOP maintaining control of the Senate now soaring to above 80%. However, the odds of retaining the House have actually reversed after initial gains in October (Chart 18). Why? Chart 18Republican Odds Surge For Senate
Republican Odds Surge For Senate
Republican Odds Surge For Senate
First, because President Trump remains unpopular despite the surge of support for GOP Senate candidates in some states (Chart 19). Second, the generic ballot continues to give Democrats a robust lead of 7.3% (Chart 20). The lead has narrowed from a high of 9.5% in early September, but does not suggest that Republicans will benefit in the House as much as in the Senate. Chart 19Trump Still Has Popularity Deficit
Trump Still Has Popularity Deficit
Trump Still Has Popularity Deficit
Chart 20Democrats' Robust Lead In Generic Polls
Democrats' Robust Lead In Generic Polls
Democrats' Robust Lead In Generic Polls
Third, Justice Kavanaugh is now sitting on the Supreme Court! Had his nomination been stalled or outright rejected, the anger of the GOP base would have been more sustainable and broad-based going into the voting booth. The paradox for President Trump is that by winning the Supreme Court battle, the shot of adrenaline to the GOP base has been expended. Nonetheless, the fight itself shows yet again that anger works as an election strategy. After all, as counterintuitive as it may seem, there is no evidence that economic performance helps win midterm elections. Our research actually suggests that there is a mildly negative correlation between economic performance and congressional election performance (Chart 21). Voters only vote with their stomachs when they are hungry. Chart 21Strong Economy Won't Save The GOP In The House Of Representatives
The U.S. Midterms And China's Stimulus
The U.S. Midterms And China's Stimulus
Midterm voters tend to be motivated by non-economic issues. With the Supreme Court settled in favor of the GOP base, the question arises: Is Trump out of ways to motivate his base with anger? Maybe not (there is still a Wall to be built!), but it may be too late to rally the GOP base sufficiently by November 6. The House appears to be lost, especially if GOP polling momentum stalls at its current level. However, the two parties have given us a glimpse into their strategies for 2020 - outrage versus outrage. President Trump, in an op-ed for USA Today, blasted the Democratic Party as a party of "open border socialism" that seeks to "model America's economy after Venezuela."1 Specifically, he cited plans by the Democratic Party to reform healthcare in such a way as to transfer the benefits that seniors currently enjoy under Medicare to the rest of the population, ending Medicare benefits in the process. The veracity of President Trump's claims is beyond the scope of this report - and has been covered extensively by the media. What is important is that President Trump may have revealed his strategy for 2020: Generational Warfare. Chart 22Here Comes Generational Warfare
Here Comes Generational Warfare
Here Comes Generational Warfare
Investors caught glimpses of this strategy in 2016, when Vermont Senator Bernie Sanders appealed directly to Millennial voters in his surprisingly robust battle against Secretary Hillary Clinton. For Democrats, appealing to Millennials is a no brainer. First, they are the largest voting bloc in the country (Chart 22). Their numbers relative to Baby Boomers will necessarily grow. Chart 23Beware The Crisis Of Expectations
Beware The Crisis Of Expectations
Beware The Crisis Of Expectations
Second, the share of 30-year-olds earning more than their parents at a similar age has fallen by nearly half (Chart 23). Despite the poor economic situation of today's youth, government spending continues to accrue mainly to the elderly (Chart 24). Chart 24Get Grandma!
The U.S. Midterms And China's Stimulus
The U.S. Midterms And China's Stimulus
The problem for Democrats is that the more they appeal to the youth, the more likely that President Trump's charges of socialism will ring true. After all, the 18-29 age cohort has more favorable views of socialism than capitalism (Chart 25). Yes, even in America! Chart 25Uh-Oh...
The U.S. Midterms And China's Stimulus
The U.S. Midterms And China's Stimulus
Where does this leave investors? First, American politics is no longer merely ideologically polarized. In 2020, we expect generational polarization to emerge as a major theme. Second, the kind of Generational Warfare practised by President Trump leaves no room for cuts to public services. Trump is not opposing Democratic "open border socialism" with traditional, centrist, Republican calls for entitlement reform. Instead, he is casting himself as a champion and defender of Baby Boomer entitlements, which, as Chart 24 clearly illustrates, leave spending on the youth in the dust. The point is that President Trump is not preaching fiscal conservativism. There is no room for entitlement reform in the new GOP. Generational Warfare will simply seek to prevent Democrats from shifting more benefits to the non-Baby Boomer share of the population by preserving the already unsustainable Baby Boomer entitlements. BCA Research's House View sees 2020 as the likeliest date for the next U.S. recession. At the end of 2020, The Congressional Budget Office projects that the U.S. budget deficit will be around 5% (Chart 26). Given that the last four recessions raised the U.S. budget deficit by an average of 5% of GDP, it is safe to say that the U.S. budget deficit may rise to 2010 levels after the next downturn. Chart 26U.S. Deficits Will Be Extremely Large For A Non-Recessionary Period
U.S. Deficits Will Be Extremely Large For A Non-Recessionary Period
U.S. Deficits Will Be Extremely Large For A Non-Recessionary Period
Given President Trump's and the Democratic Party's focus on Generational Warfare, it is unlikely that entitlement reform will occur proactively either before or after the next recession. This suggests that bond yields could rise significantly after the next downturn. Bottom Line: Our baseline odds for the midterm recession are due for an adjustment. We are lowering the odds of a Democratic House takeover to 65% (from 70%) and of a Senate takeover to 40% (from 50%). President Trump's USA Today op-ed signals a turn towards Generational Warfare. Neither the GOP nor the Democratic Party are interested in entitlement reform. The former, under Trump, seeks to preserve the already unsustainable Baby Boomer benefits, while the latter seeks to expand them to the rest of the population. The 2020 election may be fought along the lines of who is more profligate toward their base. Marko Papic, Senior Vice President Chief Geopolitical Strategist marko@bcaresearch.com Matt Gertken, Vice President Geopolitical Strategy mattg@bcaresearch.com 1 Please see "Donald Trump: Democrats Medicare for All plan will demolish promises to seniors," published by USA Today, dated October 12, 2018.
What was initially an uncertain rise in U.S.-China trade tension has now become much more significant in both the depth and breadth of the economic battle between these two nations. Since President Trump went forward with his second round of tariffs - 10%…
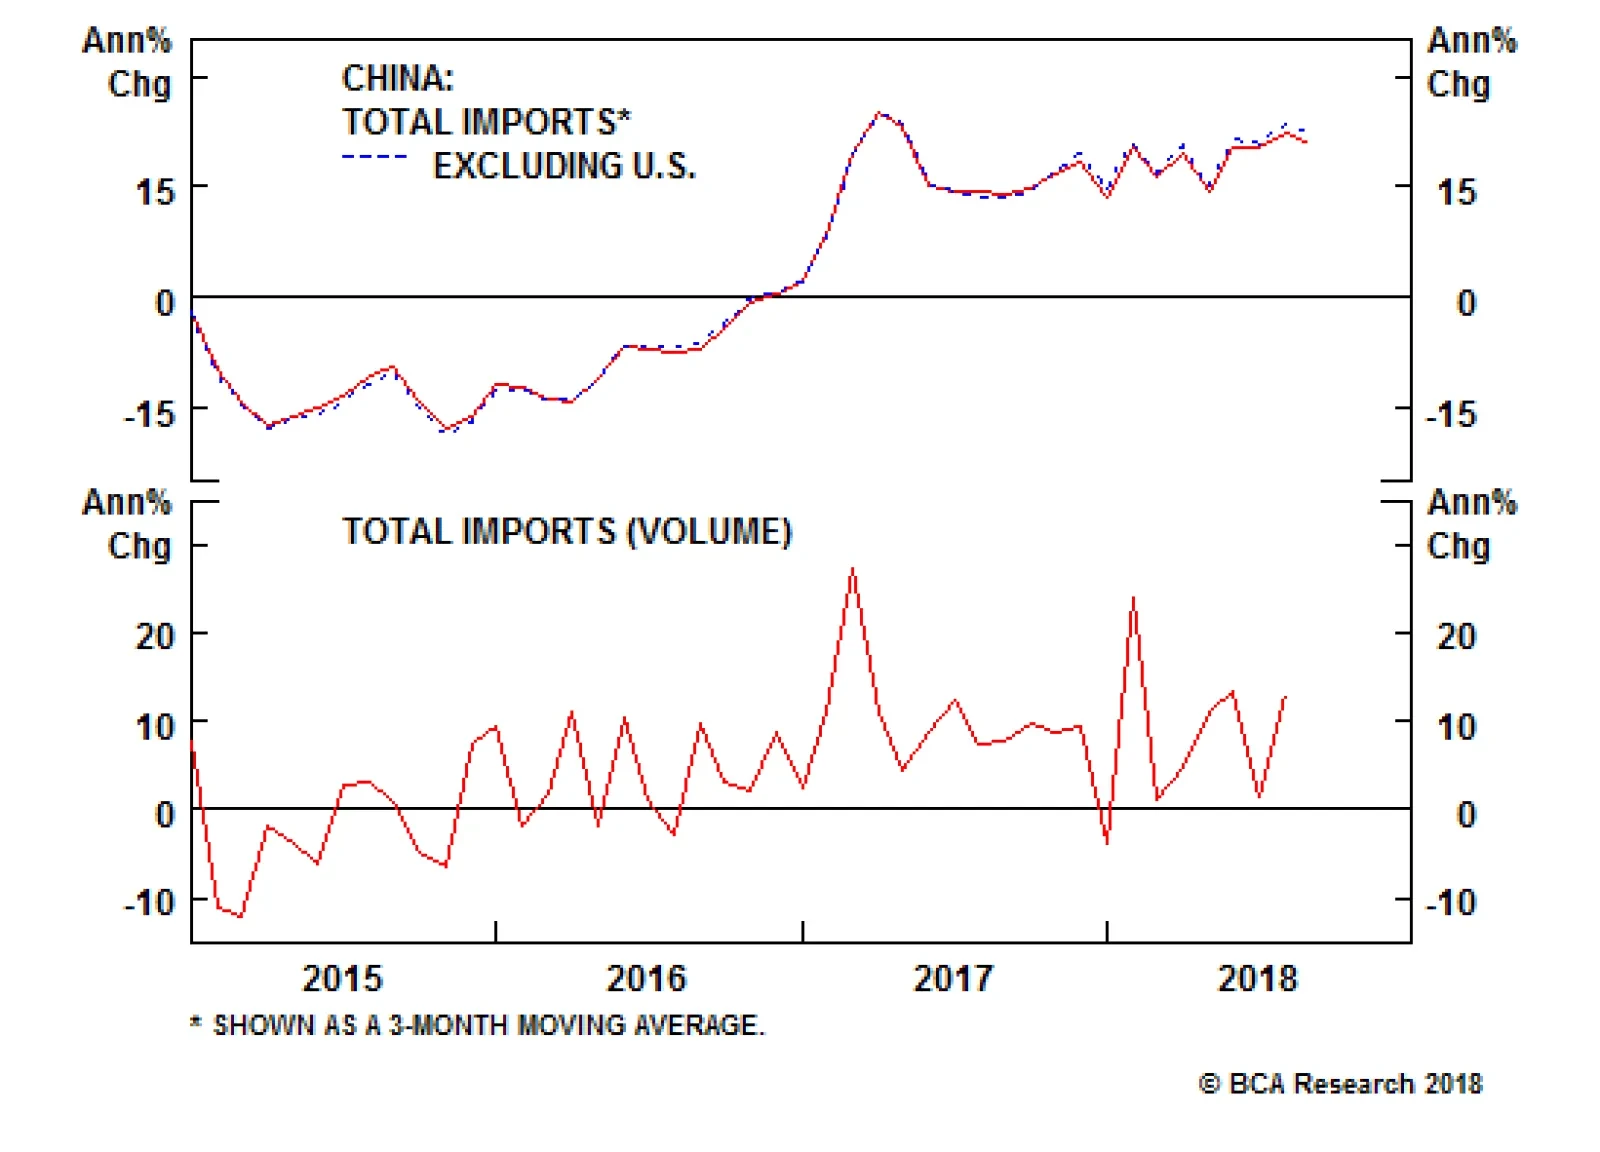
China's greatest strength in winning friends is that its domestic demand remains relatively robust. China can substitute away from the U.S. by shifting to other developed markets. Emerging markets are becoming more connected with China and less so with the…
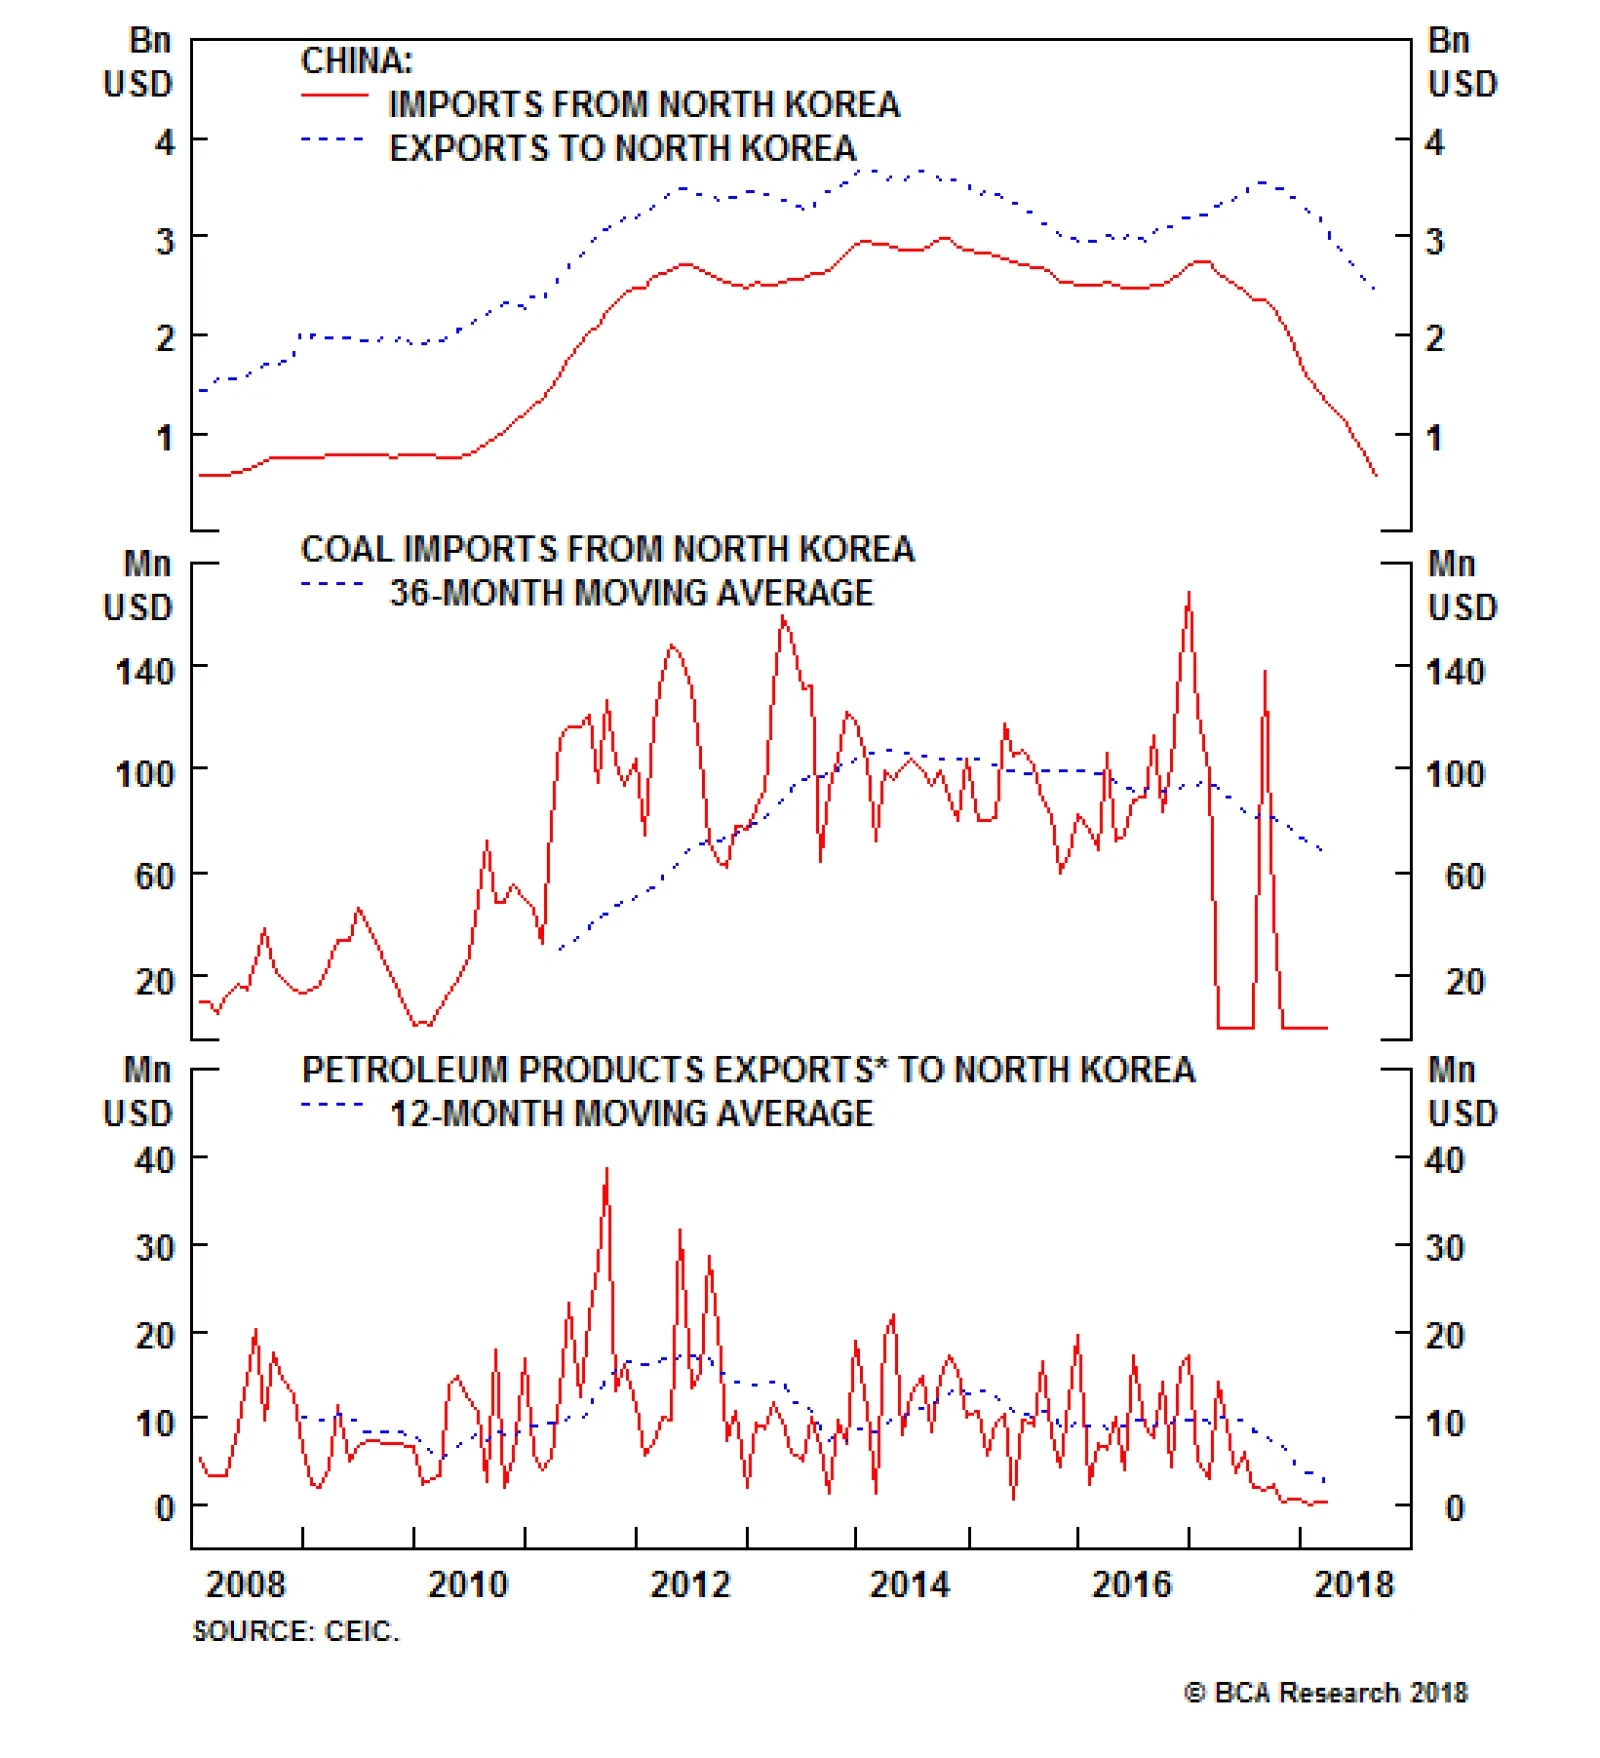
Our Geopolitical Strategy service thinks China could respond to the U.S. “show of force” in two ways: directly or through proxies. The direct response would involve confronting the U.S. military openly and forcefully. Our geopolitical strategists believe…
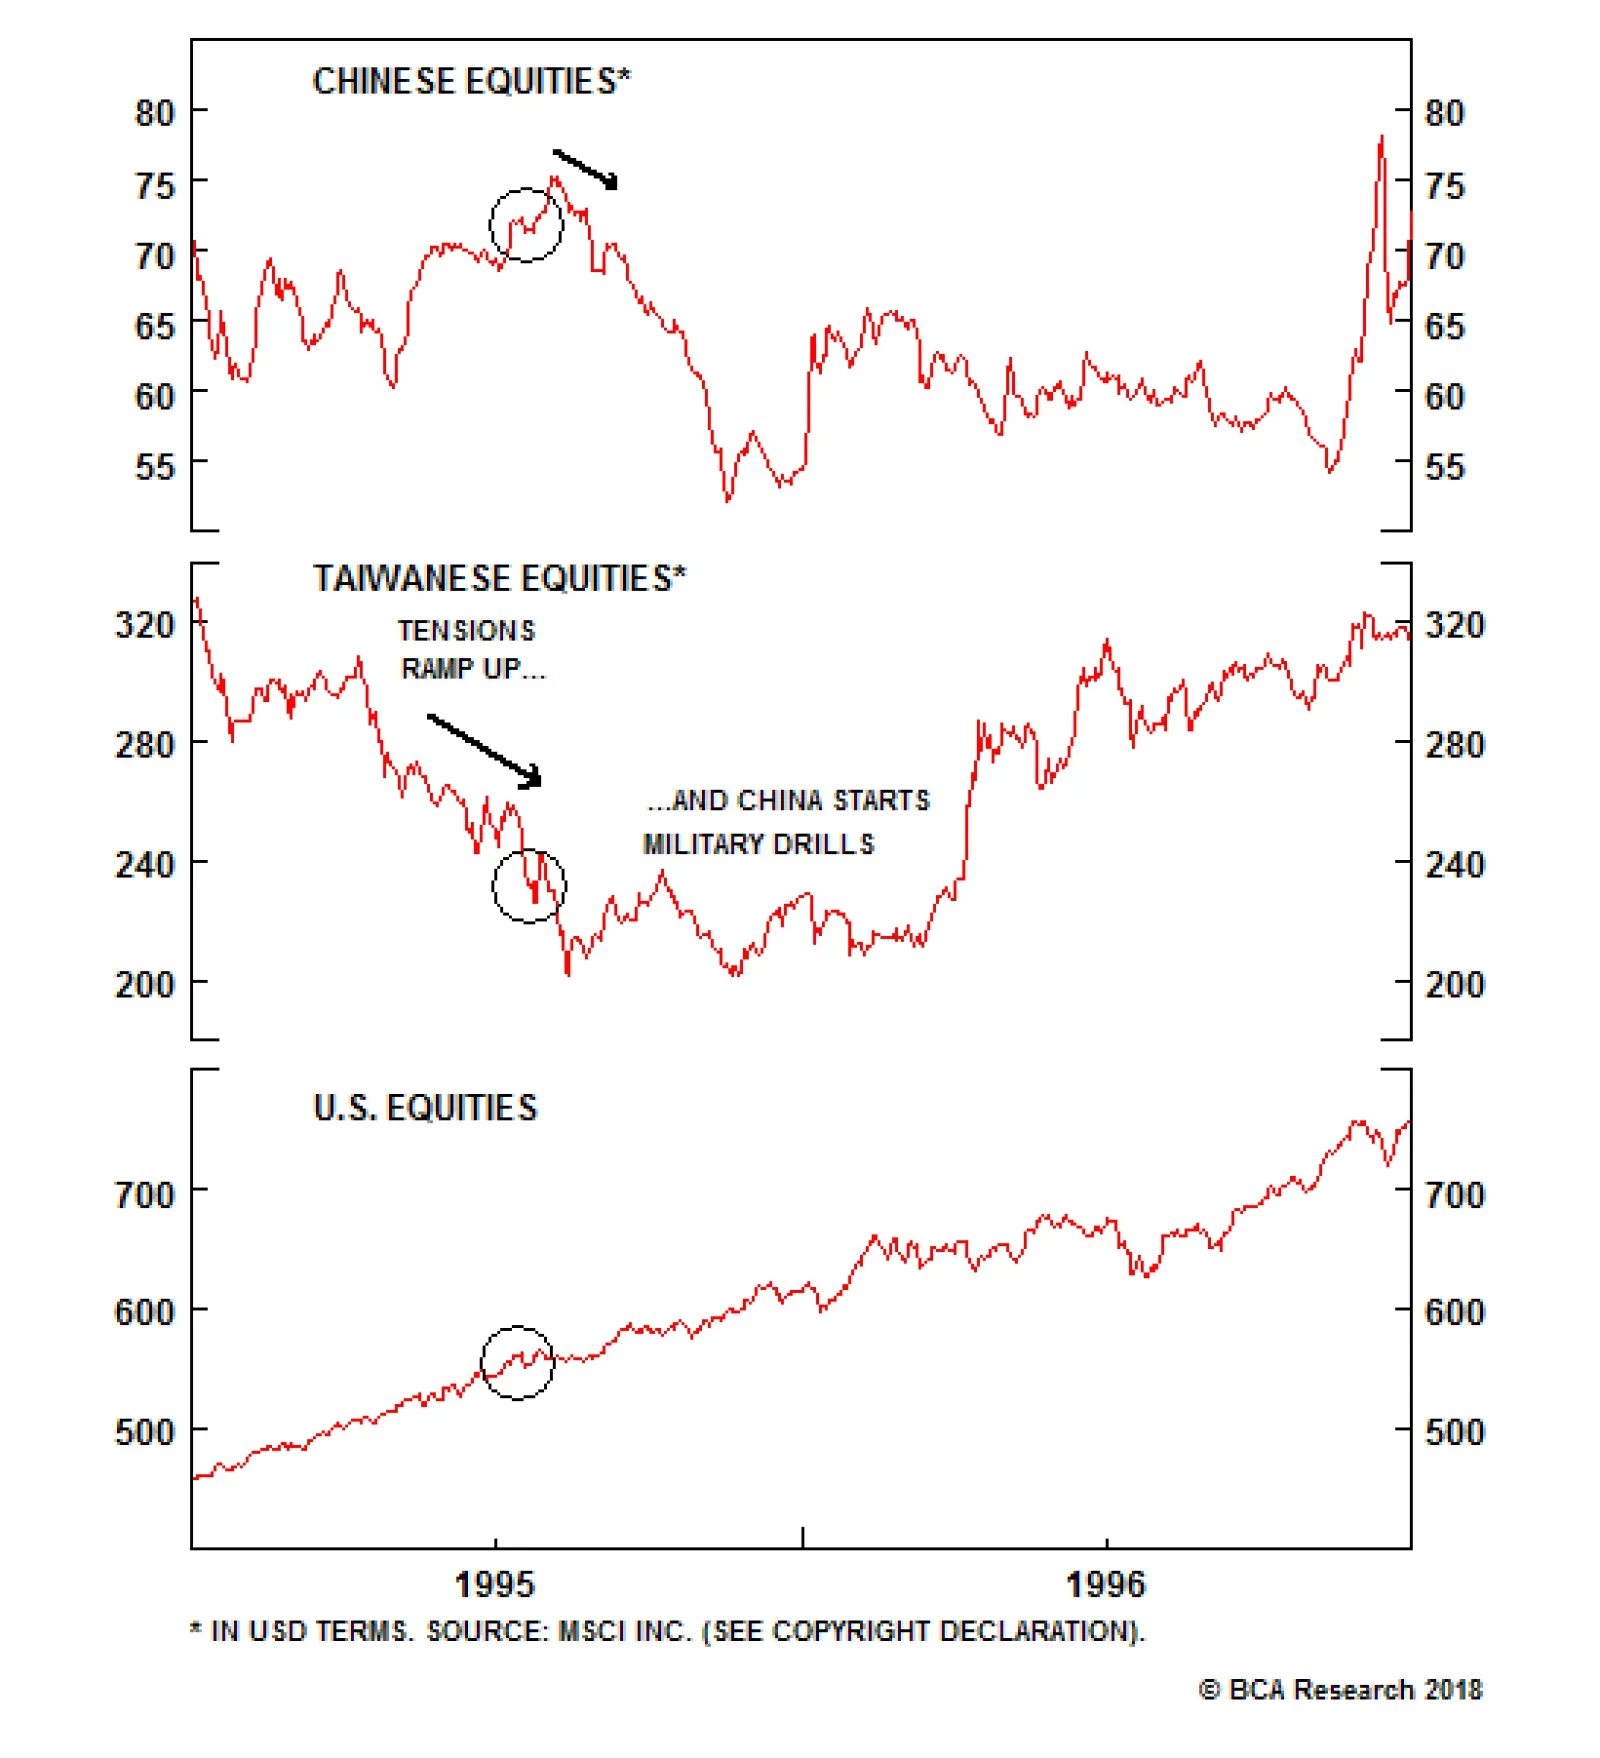
The U.S. holds shows of force fairly frequently. Over recent decades it has been the third most common type of operation for the U.S. military. However, for most of the past several decades, the U.S. conducted very few operations in the Asia Pacific that did…