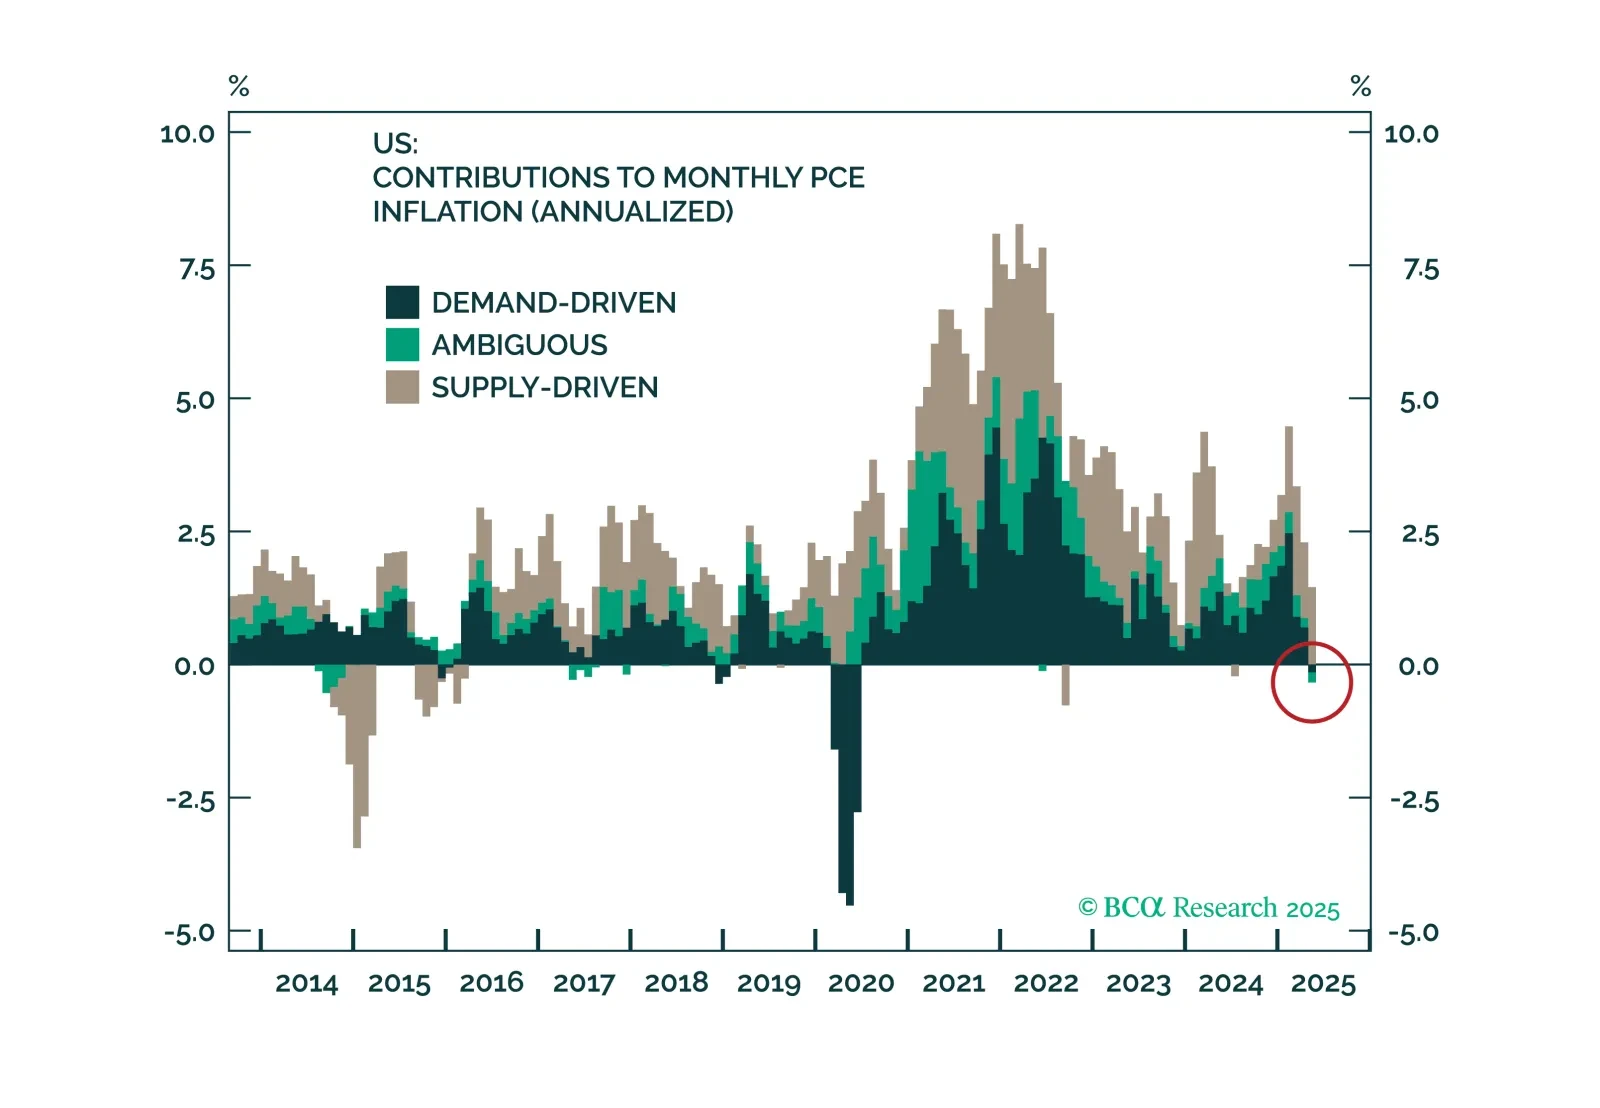
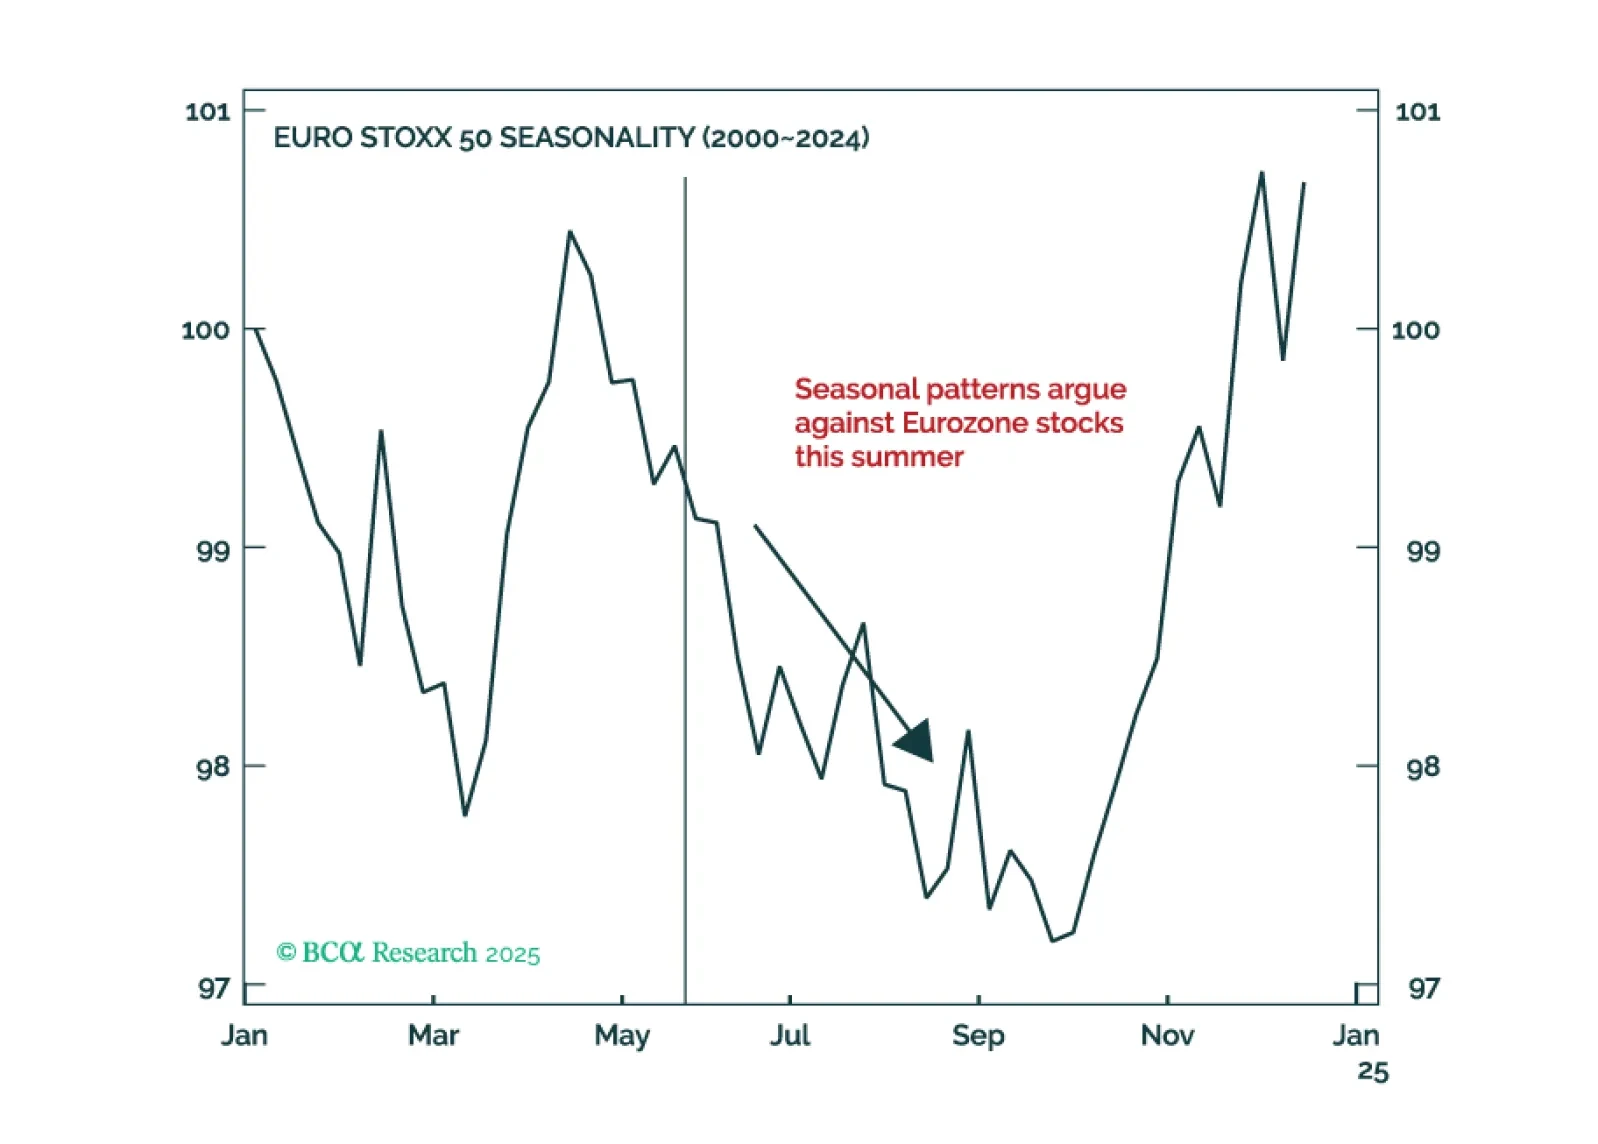
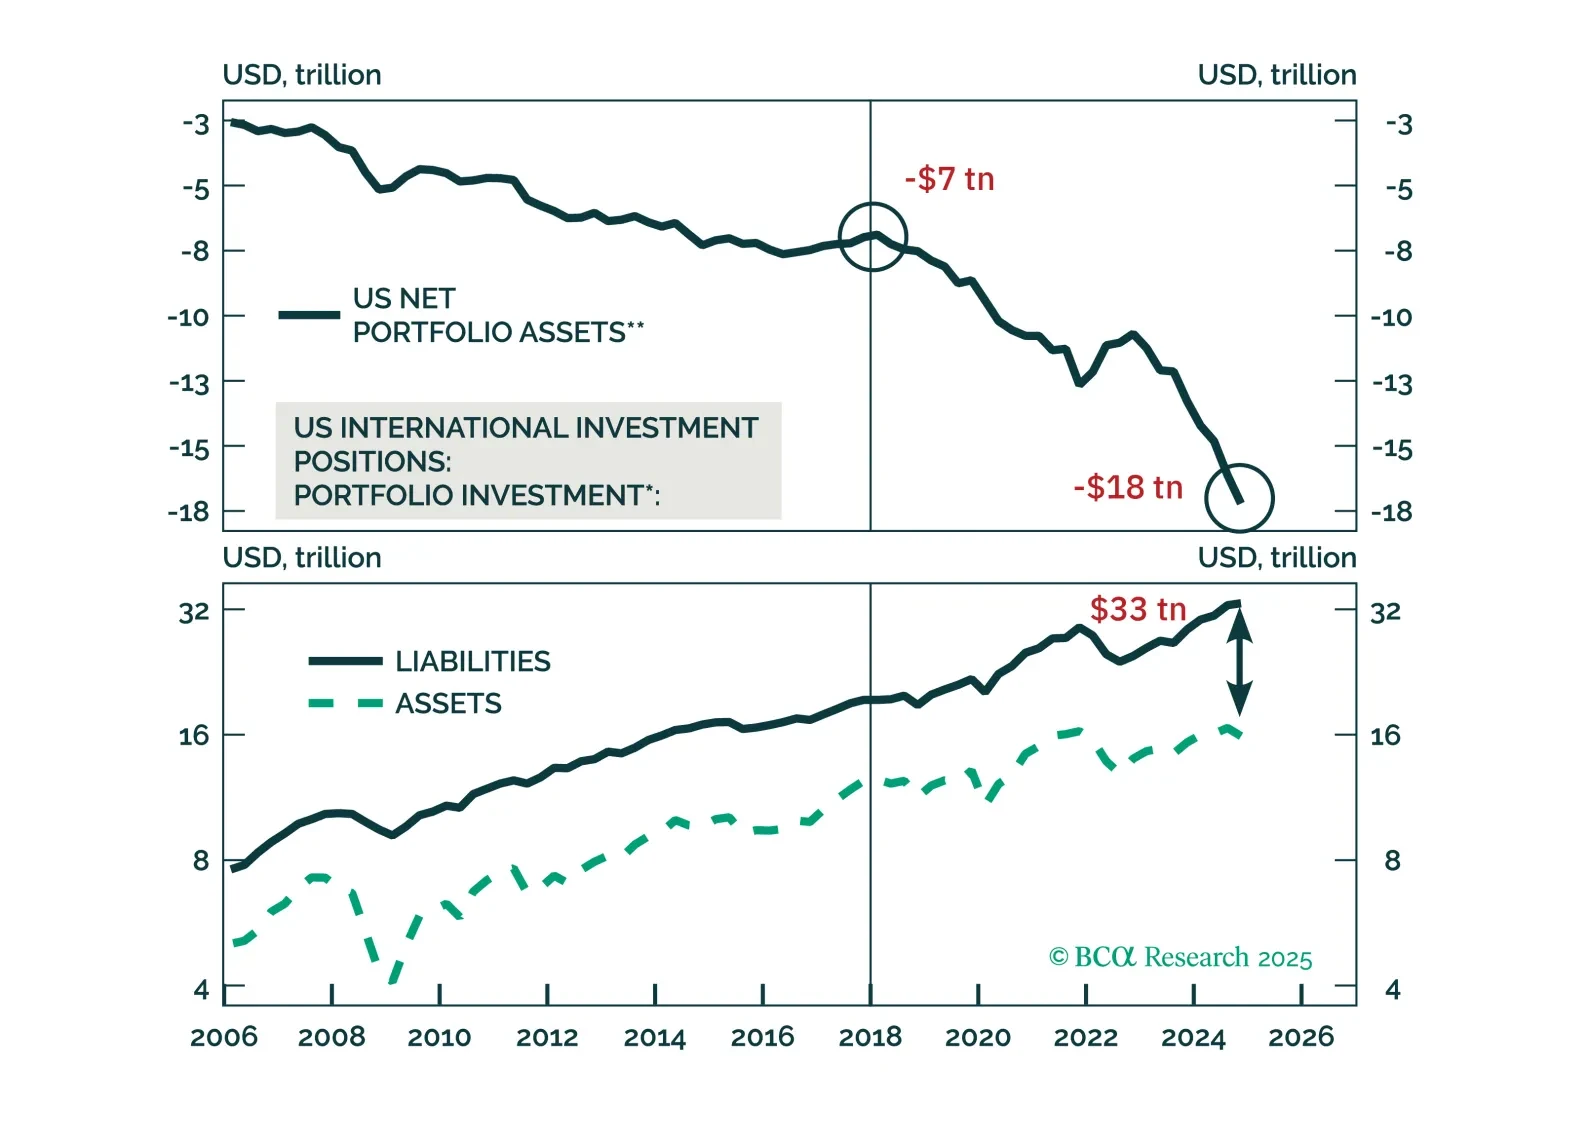
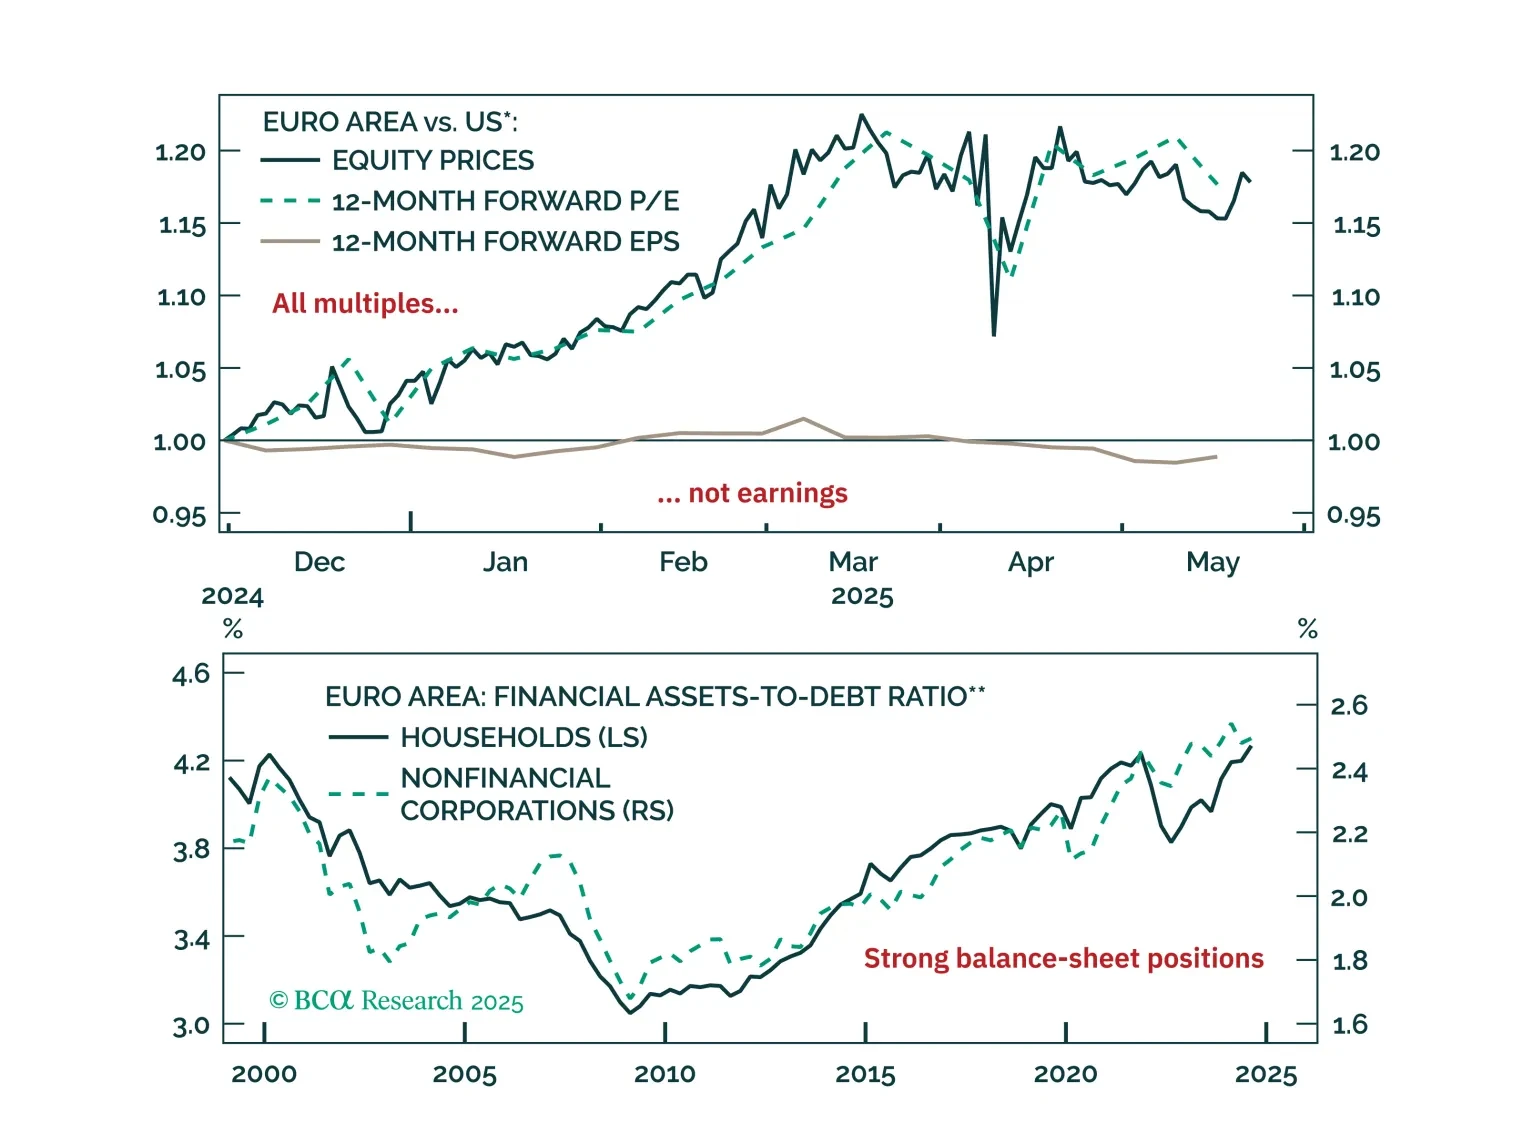
European equities will face a clash of powerful forces this summer. Expect sharp swings and false breaks, creating an ideal terrain for nimble traders but a minefield for buy-and-hold investors seeking steady gains.Within this backdrop, our stance remains unchanged: stay long value, short growth. Pair it with long core markets against the periphery and overweight domestically oriented names relative to exporters.EURO STOXX 50: Summer Range, Tactical Risks HighEuropean equities are boxed in: Powerful but evenly matched forces should trap the EURO STOXX 50 between 4750 and 5500 through the summer, creating near-term tactical risks.TailwindsTrade war pause. The White House’s recent climbdown shows that the administration is constrained. Once its actions endanger growth (and the odds of GOP victories), it will retreat. Extreme left tail risks have therefore narrowed. Because 22% of European corporate sales come from the US, lower recession odds there lift the expected value of Euro Area profits. Earnings revisions were already at panic levels that usually mark an interim EURO STOXX 50 trough, so the trade ceasefire supports prices in the coming months (Chart 1).End of US exceptionalism. Fiscal stimulus in the United States is ebbing. The average primary deficit ran at roughly 3.7% of GDP from 2005 to 2015 and 4.5% from 2016 to 2024, creating an average fiscal thrust of 0.8% of GDP during the last decade. The Big Beautiful Budget Bill will result in an average primary deficit of 4.2% of GDP over the next ten years. As a result, the average fiscal thrust will fall to 0.25%, which will result in weaker US growth conditions. Tariffs, if they remain in place long-term, could even depress the thrust further as they constitute a tax on households. Europe, meanwhile, has put austerity behind it, and private sector deleveraging is over. The narrowing fiscal gap raises the expected return on the European capital stock relative to the US, a scenario that has often lifted Eurozone equities (Chart 2). Investors understand this change, and they are diversifying away from the US into Europe, which remains attractively priced in relative terms (Chart 3).HeadwindsValuations. Compared to Wall Street, Europe is inexpensive, but relative to its own history, it is rich. The MSCI Euro Area trades near the top of its forward P/E range at 13.6. Consensus also projects a solid 12 month EPS growth, leaving little valuation cushion (Chart 4).Margin risk. Forward margins sit near record levels at 8.7% (Chart 5). EU bound US tariffs have already risen to 25%, and an elevated EUR/CNY hands Chinese firms a competitive edge over European ones. Pricing power should weaken over the rest of 2025, pressuring margins lower.Rates. The latest FOMC minutes show a central bank fixated on the dangerous mix of elevated household inflation expectations and the threat of tariff driven inflation despite deteriorating US soft data (Chart 6). By refusing to ease, the Fed is falling behind the growth curve, which heightens the odds of a hard landing. Long yields are also a threat to European equities. BCA’s fixed income team shows that heavier net issuance and heightened inflation uncertainty are driving 10 and 30 year rates higher worldwide. A fatter term premium drags on growth and endangers inflated multiples. The pinch is sharpest in the US, however, European stocks sport a high beta that will echo any global equity pullback sparked by a skittish bond market (Chart 7).Balancing these forces, the EURO STOXX 50 should oscillate between 4750 and 5500 through the summer. At today’s 5367 level, the index is a tactical sell, and seasonal patterns point in the same direction (Chart 8).Bottom Line: European equities will chop sideways until the push and pull between growing earnings risks and the trade war respite resolves. With the EURO STOXX 50 hovering near the top of its 4750–5500 corridor, trim exposure and lean on relative trades. Wait for margins to reset and global yields to settle before adding directional risk.Relative Value Playbook for a Range Bound MarketIn a directionless but volatile market, alpha lives in relative value. For the summer, we prefer three pair trades: long core equities against the periphery, long value against growth, and long domestically focused names against exporters.Long Core/Short PeripheryPeripheral equities have been all the rage lately, beating core markets by 29% since early 2024. Yet in 2025, their price surge has outpaced earnings, and the gap between relative performance and relative EPS growth is now extreme (Chart 9). PMIs in the periphery are also sliding versus the core (Chart 10). The set up argues for a rotation back into core benchmarks.Long Value/Growth StocksEuropean value stocks still sell at an abnormal discount of 50% to growth stocks, compared to a median discount of 34% since 2003 (Chart 11). Year to date, value has been the strongest-performing factor in Europe, rising by 17%. Meanwhile, growth has been the worst-performing factor in Europe, rising by only 6%. Attractive valuations, combined with improving momentum, should keep the bid under value stocks during policy driven volatility. For national markets, the UK is in the sweet spot: it trades at a record discount to global equities (Chart 12) and offers defensive exposure.Long Domestic Firms/Short ExportersDomestic firms face less tariff risk and less price pressure from China than exporters. They also capture a greater share of the upside from Europe’s completed private sector deleveraging, a key driver of the region’s improving medium term growth outlook. Their appeal is not yet fully reflected in their valuations. Despite a recent bounce, domestic stocks still trade slightly below their twenty year median forward P/E relative to exporters (Chart 13). A firmer euro and the rebound in small cap leadership add tailwinds to this trade. Mathieu Savary,Chief European StrategistMathieu@bcaresearch.com