Commodities & Energy Sector

Executive Summary Investors Think The Fed Will Not Be Able To Raise Rates Much Above 2%
Is A Higher Neutral Rate Good Or Bad For Stocks?
Is A Higher Neutral Rate Good Or Bad For Stocks?
The neutral rate of interest is 3%-to-4% in the United States. This is substantially higher than the market estimate of around 2%. It is also higher than the central tendency range for the Fed’s terminal interest rate dot, which remained at 2.3%-to-2.5% following this week’s FOMC meeting. If the neutral rate turns out to be higher than expected, this is arguably good news for stocks over the short-to-medium term because it lowers the risk that the Fed will accidentally induce a recession this year by bringing rates into restrictive territory. Over a longer-term horizon of 2-to-5 years, however, a higher neutral rate is bad news for stocks because it means that investors will eventually need to value equities using a higher discount rate. It also means that the Fed could find itself woefully behind the curve in normalizing monetary policy. Bottom Line: Global equities will rise over the next 12 months as the situation in Ukraine stabilizes, commodity prices recede, and inflation temporarily declines. Stocks will peak in the second half of 2023 in advance of a second, and currently unexpected, round of Fed tightening beginning in late-2023 or 2024. Dear Client, Instead of our regular report next week, we will be sending you a Special Report written by Matt Gertken, BCA Research’s Chief Geopolitical Strategist, discussing the geopolitical implications of the war in Ukraine. We will be back the following week with the GIS Quarterly Strategy Outlook, where we will explore the major trends that are set to drive financial markets in the rest of 2022 and beyond. As always, I will hold a webcast discussing the outlook the week after, on Thursday, April 7th. Best regards, Peter Berezin Chief Global Strategist https://www.linkedin.com/in/peter-berezin-1289b87/ https://twitter.com/BerezinPeter A Two-Stage Fed Tightening Cycle The FOMC raised rates by 25 basis points this week, the first of seven rate hikes that the Federal Reserve has telegraphed in its Summary of Economic Projections for the remainder of 2022. We expect the Fed to follow through on its planned rate hikes this year, but then go on pause in early-2023, as inflation temporarily comes down. However, the Fed will resume raising rates in late-2023 or 2024 once inflation begins to reaccelerate and it becomes clear that monetary policy is still too easy. This second round of monetary tightening is currently not anticipated by market participants. If anything, investors think the Fed is more likely to cut rates than raise rates towards the end of next year (Chart 1). The Fed’s own views are not that different from the markets’: The central tendency range for the Fed’s terminal interest rate dot remained at 2.3%-to-2.5% following this week’s FOMC meeting, with the median dot actually ticking lower to 2.4% from 2.5% (Chart 2).
Image
Chart 2The Fed Is Still In The Secular Stagnation Camp
The Fed Is Still In The Secular Stagnation Camp
The Fed Is Still In The Secular Stagnation Camp
A Higher Neutral Rate
Image
Our higher-than-consensus view of where US rates will eventually end up reflects our conviction that the neutral rate of interest is somewhere between 3% and 4%. One can think of the neutral rate as the interest rate that equates the amount of investment a country wants to undertake at full employment with the amount of savings that it has at its disposal.1 Anything that reduces savings or increases investment would raise the neutral rate (Chart 3). As we discussed last month, a number of factors are likely to lower desired savings in the US over the next few years: Households will spend down their accumulated pandemic savings. US households are sitting on $2.3 trillion (10% of GDP) in excess savings, the result of both decreased spending on services during the pandemic and the receipt of generous government transfer payments (Chart 4). Household wealth has soared since the start of the pandemic (Chart 5). Conservatively assuming that households spend three cents of every additional dollar in wealth, the resulting wealth effect could boost consumption by nearly 4% of GDP.
Image
Chart 5Net Worth Has Soared Since The Pandemic
Net Worth Has Soared Since The Pandemic
Net Worth Has Soared Since The Pandemic
The household deleveraging cycle has ended (Chart 6). Household balance sheets are in good shape. After falling during the initial stages of the pandemic, consumer credit has begun to rebound. Banks are easing lending standards on consumer loans across the board. Baby boomers are retiring. They hold over half of US household wealth, considerably more than younger generations (Chart 7). As baby boomers transition from savers to dissavers, national savings will decline. Chart 6US Household Deleveraging Pressures Have Abated
US Household Deleveraging Pressures Have Abated
US Household Deleveraging Pressures Have Abated
Chart 7Baby Boomers Have Amassed A Lot Of Wealth
Is A Higher Neutral Rate Good Or Bad For Stocks?
Is A Higher Neutral Rate Good Or Bad For Stocks?
Government budget deficits will stay elevated. Fiscal deficits subtract from national savings. While the US budget deficit will come down over the next few years, the IMF estimates that the structural budget deficit will still average 4.9% of GDP between 2022 and 2026 compared to 2.0% of GDP between 2014 and 2019 (Chart 8). On the investment front: The deceleration in trend GDP growth, which depressed investment spending, has largely run its course.2 According to the Congressional Budget Office, real potential GDP growth fell from over 3% in the early 1980s to about 1.9% today. The CBO expects potential growth to edge down only slightly to 1.7% over the next few decades (Chart 9). Chart 8Fiscal Policy: Tighter But Not Tight
Is A Higher Neutral Rate Good Or Bad For Stocks?
Is A Higher Neutral Rate Good Or Bad For Stocks?
Chart 9Much Of The Deceleration In Potential Growth Has Already Happened
Much Of The Deceleration In Potential Growth Has Already Happened
Much Of The Deceleration In Potential Growth Has Already Happened
After moving broadly sideways for two decades, core capital goods orders – a leading indicator for capital spending – have broken out to the upside (Chart 10). Capex intention surveys remain upbeat (Chart 11). The average age of the nonresidential capital stock currently stands at 16.3 years, the highest since 1965 (Chart 12). Chart 10Positive Signs For Capex (I)
Positive Signs For Capex (I)
Positive Signs For Capex (I)
Similar to nonresidential investment, the US has been underinvesting in residential real estate (Chart 13). The average age of the housing stock has risen to a 71-year high of 31 years. The homeowner vacancy rate has plunged to the lowest level on record. The number of newly finished homes for sale is half of what it was prior to the pandemic. Chart 11Positive Signs For Capex (II)
Positive Signs For Capex (II)
Positive Signs For Capex (II)
Chart 12An Aging Capital Stock
An Aging Capital Stock
An Aging Capital Stock
Chart 13Housing Is In Short Supply
Housing Is In Short Supply
Housing Is In Short Supply
The New ESG: Energy Security and Guns The war in Ukraine will put further pressure on the neutral rate, especially outside of the United States. Chart 14European Capex Should Recover
European Capex Should Recover
European Capex Should Recover
After staging a plodding recovery following the euro debt crisis, European capital spending received a sizable boost from the launch of the NextGenerationEU Recovery Fund (Chart 14). Capital spending will rise further in the years ahead as European governments accelerate efforts to make their economies less reliant on Russian energy. Meanwhile, European governments are trying to ease the burden from rising energy costs. France has introduced a rebate on fuel starting on April 1st. It is part of a EUR 20 billion package aimed at cutting heating and electricity bills. Other countries are considering similar measures. European military spending will also rise. Germany has already announced that it will spend EUR 100 billion more on defense. European governments will also need to boost spending to accommodate potentially several million Ukrainian refugees. A Smaller Chinese Current Account Surplus? Chart 15Will China Be A Source Of Excess Savings?
Will China Be A Source Of Excess Savings?
Will China Be A Source Of Excess Savings?
The difference between what a country saves and invests equals its current account balance. Historically, China has been a major exporter of savings, which has helped depress interest rates abroad. While China’s current account surplus has declined as a share of its own GDP, it has remained very large as a share of global ex-China GDP, reflecting China’s growing weight in the global economy (Chart 15). Many analysts assume that China will double down on efforts to boost exports in order to offset the drag from falling property investment. However, there is a major geopolitical snag with that thesis: A country that runs a current account surplus must, by definition, accumulate assets from the rest of the world. As the freezing of Russia’s foreign exchange reserves demonstrates, that is a risky proposition for a country such as China. Rather than increasing its current account surplus, China may seek to bolster its economy by raising domestic demand. This could be achieved by either boosting domestic investment on infrastructure and/or consumption. Notably, the IMF’s latest projections foresee China’s current account surplus falling by more than half between 2021 and 2026 as a share of global ex-China GDP. If this were to happen, the neutral rate in China and elsewhere would rise. The Path to Neutral: The Role of Inflation If one accepts the premise that the neutral rate in the US is higher than widely believed, what will the path to this higher rate look like?
Image
The answer hinges critically on the trajectory of inflation. If inflation remains stubbornly high, the Fed will be forced to hike rates by more than expected over the next 12 months. In contrast, if inflation comes down rapidly, then the Fed will be able to raise rates at a more leisurely pace. As late as early February, one could have made a strong case that US inflation was set to fall. The demand for goods was beginning to moderate as spending shifted back towards services. On the supply side, the bottlenecks that had impaired goods production were starting to ease. Chart 16 shows that the number of ships anchored off the coast of Los Angeles and Long Beach has been trending lower while the supplier delivery components of both the ISM manufacturing and nonmanufacturing indices had come off their highs. Since then, the outlook for inflation has become a lot murkier. As we discussed last week, the war in Ukraine is putting upward pressure on commodity prices, ranging from energy, to metals, to agriculture. BCA’s geopolitical team, led by Matt Gertken, expects the war to worsen before a truce of sorts is reached in a month or two. Meanwhile, a new Covid wave is gaining momentum. New daily cases are rising across Europe and have exploded higher in parts of Asia (Chart 17). In China, the number of new cases has reached a two-year high. The government has already locked down parts of the country encompassing 37 million people, including Shenzhen, a major high-tech hub adjoining Hong Kong. Chart 17Covid Cases Are On The Rise Again In Some Countries
Is A Higher Neutral Rate Good Or Bad For Stocks?
Is A Higher Neutral Rate Good Or Bad For Stocks?
Most new cases in China and elsewhere stem from the BA.2 subvariant of Omicron, which appears to be at least 50% more contagious than Omicron Classic. Given its extreme contagiousness, China may be forced to rely on massive nationwide lockdowns in order to maintain its zero-Covid strategy. While such lockdowns may provide some relief in the form of lower oil prices, the overall effect will be to worsen supply-chain disruptions. Watch For Signs of a Wage-Price Spiral As the experience of the 1960s demonstrates, the relationship between inflation and unemployment is inherently non-linear: The labor market can tighten for a long time with little impact on prices and wages, only for a wage-price spiral to suddenly develop once unemployment falls below a certain threshold (Chart 18). Chart 18A Wage-Price Spiral Was Ignited By Very Low Unemployment Levels In The 1960s
Is A Higher Neutral Rate Good Or Bad For Stocks?
Is A Higher Neutral Rate Good Or Bad For Stocks?
Chart 19Wage Growth Has Picked Up, But Mostly At The Bottom End Of The Income Distribution
Wage Growth Has Picked Up, But Mostly At The Bottom End Of The Income Distribution
Wage Growth Has Picked Up, But Mostly At The Bottom End Of The Income Distribution
For the time being, a wage-price spiral does not appear imminent. While wage growth has picked up, most of the increase in wages has occurred at the bottom end of the income distribution (Chart 19). Chart 20More Low-Wage Employees Should Return To Work
More Low-Wage Employees Should Return To Work
More Low-Wage Employees Should Return To Work
Low-wage workers have not returned to the labor force to the same extent as higher-wage workers (Chart 20). However, now that extended unemployment benefits have lapsed and savings deposits are being drawn down, the incentive to resume work will strengthen. An influx of workers back into the labor market will cap wage growth, at least for this year. Long-Term Inflation Expectations Still Contained A sudden increase in long-term inflation expectations can be a precursor to a wage-price spiral because the expectation of higher prices can induce consumers to shop now before prices rise further, while also incentivizing workers to demand higher wages. Reassuringly, long-term inflation expectations have not risen that much. Expected inflation 5-to-10 years out in the University of Michigan survey registered 3.0% in March, down a notch from 3.1% in February (Chart 21). While the widely followed 5-year, 5-year forward TIPS inflation breakeven rate has climbed to 2.32%, it is still at the bottom of the Fed’s comfort zone of 2.3%-to-2.5% (Chart 22).3 Chart 21Long-Term Inflation Expectations Remain Contained (I)
Long-Term Inflation Expectations Remain Contained (I)
Long-Term Inflation Expectations Remain Contained (I)
Chart 22Long-Term Inflation Expectations Remain Contained (II)
Long-Term Inflation Expectations Remain Contained (II)
Long-Term Inflation Expectations Remain Contained (II)
Chart 23The Magnitude Of Damage Depends On How Long The Commodity Price Shock Lasts
Is A Higher Neutral Rate Good Or Bad For Stocks?
Is A Higher Neutral Rate Good Or Bad For Stocks?
Moreover, the jump in market-based inflation expectations since the start of the war in Ukraine has been fueled by rising oil prices. The forwards are pointing to a fairly pronounced decline in the price of crude and most other commodity prices over the next 12 months (Chart 23). If that happens, inflation expectations will dip anew. Investment Implications The neutral rate of interest is higher in the United States than widely believed. A higher neutral rate is arguably good for stocks over the short-to-medium term because it lowers the risk that the Fed will accidentally induce a recession this year by bringing rates into restrictive territory. Over a longer-term horizon of 2-to-5 years, however, a higher neutral rate is bad news for stocks because it means that investors will eventually need to value stocks using a higher discount rate. It also means that the Fed could find itself woefully behind the curve in normalizing monetary policy. While the war in Ukraine and yet another Covid wave could continue to unsettle markets for the next month or two, global equities will be higher in 12 months than they are now. With inflation in the US likely to temporarily come down in the second half of the year, bond yields probably will not rise much more this year. However, yields will start moving higher in the second half of next year as it becomes clear that policy rates still have further to rise. The bull market in stocks will end at that point. Peter Berezin Chief Global Strategist peterb@bcaresearch.com Footnotes 1 These savings can either by generated domestically or imported from abroad via a current account deficit. 2 Theoretically, there is a close relationship between trend growth and the equilibrium investment-to-GDP ratio. For example, if real trend growth is 3% and the capital stock-to-GDP ratio is 200%, a country would need to invest 6% of GDP net of depreciation to maintain the existing capital stock-to-GDP ratio. In contrast, if trend growth were to fall to 2%, the country would only need to invest 4% of GDP. 3 The Federal Reserve targets an average inflation rate of 2% for the personal consumption expenditures (PCE) index. The TIPS breakeven is based on the CPI index. Due to compositional differences between the two indices, CPI inflation has historically averaged 30-to-50 basis points higher than PCE inflation. This is why the Fed effectively targets a CPI inflation rate of about 2.3%-to-2.5%. View Matrix
Is A Higher Neutral Rate Good Or Bad For Stocks?
Is A Higher Neutral Rate Good Or Bad For Stocks?
Special Trade Recommendations Current MacroQuant Model Scores
Is A Higher Neutral Rate Good Or Bad For Stocks?
Is A Higher Neutral Rate Good Or Bad For Stocks?
Executive Summary Higher Prices Expected
Higher Prices Expected
Higher Prices Expected
Global oil supply will move lower for a few months, until shipping can be re-routed and re-priced in response to sanctions against Russian oil producers and refiners. In the wake of another outbreak of COVID-19 in China, oil demand will likely move marginally lower in the near term. Chinese fiscal stimulus to support demand and Chinese equity markets will be bullish for oil, natgas and metals. Work-arounds by China and India to circumvent Western sanctions likely will keep the hit to Russian oil production contained to March and April. However, longer term – 2024 and beyond – sanctions will put Russia's oil output on a downward trajectory. Saudi Arabia will launch an experiment this year to be paid in yuan for oil exports to China. As a risk-management strategy, KSA needs USD alternatives for storing wealth and retaining access to its foreign reserves, given the success of sanctions in restricting Russia's access to its foreign reserves following its invasion of Ukraine. Our Brent forecast is higher, averaging $93/bbl for this year and in 2023. Bottom Line: We recommend buying the dip in any oil-and-gas equity sell-off. We remain long the XOP ETF. We also remain long the S&P GSCI and COMT ETF – long commodity-index based vehicles that benefit from higher commodity prices and increasing backwardation in these markets, particularly oil. Feature Shipping delays in the wake of sanctions – official and self-imposed – against Russian oil and gas exports will stretch out global hydrocarbon supply chains in 1H22. This will have the effect of reducing actual supply, as these vessels are re-routed, and work-arounds are found to get oil to ports accepting Russian material.1 Related Report Commodity & Energy Strategy2022 Key Views: Past As Prelude For Commodities So far, China and India appear to be moving quickly to develop sanctions work-arounds. Both have long-term trading relationships with Russia, and, in the case of India, the capacity to revive a treaty covering rupee-invoicing of trade in commodities and arms. Estimates of the total hit to Russian oil production resulting from export sanctions imposed by the West following its invasion of Ukraine last month range as high as 5mm b/d in output losses, but we do not share that view.2 There is a strong desire for discounted oil in China and India, and to find alternatives to USD-denominated trade. This has been catalyzed by the sanctions on Russia's central bank and the shutdown of access to its foreign reserves. Payment-messaging systems competitive with the Brussels-based SWIFT network have been stood up already. These will be refined in the wake of the Ukraine war by states with a long-standing desire to diversify payment systems away from the world's reserve currency (i.e., the USD). Among these states, the Kingdom of Saudi Arabia (KSA) is reported to be exploring alternatives for diversifying away from USD-based payment systems, and foreign-reserves custodial relationships dependent on Western central-bank oversight – particularly the US Fed.3 In addition, as ties between China and GCC states have strengthened, the Kingdom might also be looking to diversify its defense partnerships, particularly given the open hostility between the Biden administration in the US and KSA's leadership. Monitoring Chinese state media coverage of this will provide a good indication of the extent of such cooperation. Assessing Highly Uncertain Supply In our base case, Russian output likely falls by ~ 1mm b/d over the March-April period because of shipping delays that force production to be throttled back at the margin due to storage constraints. In its magnitude, this is a similar assumption to the reference case considered by the Oxford Institute for Energy Studies (OIES) but is extended for two months (Table 1).4 We expect shipping delays and payment work-arounds to be sorted out in a couple of months, which, given the incentives of all involved, does not seem unreasonable. Table 1BCA Global Oil Supply - Demand Balances (MMb/d, Base Case Balances) To Dec23
Uncertainty Tightens Oil Supply
Uncertainty Tightens Oil Supply
In our base case modeling, supply changes by core-OPEC 2.0 in 2022 are required to meet physical deficits brought about by less-than-expected volumes returned to the market by the entire coalition from August 2021 to now. This amounts to ~ 1.2mm b/d by our reckoning. For all of 2022, we assume core-OPEC 2.0 will lift supply by 1.3mm b/d, with most of this being provided to markets beginning in May 2022. In 2023, supplies from KSA, UAE and Kuwait are assumed to increase by roughly 0.2mm b/d, led by KSA (Chart 1). This is higher relative to our previous estimates, given our expectation, this core group will have to lift output to compensate not only for reduced Russian output and supply-chain delays this year and next, but falling output within the producer coalition's other non-core states. Outside OPEC 2.0, stronger WTI futures prices in spot markets and along the entire forward curve drive our estimate of US shale output (L48 ex-GoM) to 9.89mm b/d in 2022 (0.86mm b/d above 2021 levels) and 10.58mm b/d in 2023 (0.69mm above our 2022 levels). Supply-chain disruptions and cost inflation showing up in US shale producers' operations likely will dampen output increases.5 For the US, we expect 2022 average US production of 12.1mm b/d, or 900k b/d higher than 2021 output, and 12.8mm b/d in 2023, which is 700k b/d higher than 2022 levels (Chart 2). Chart 1Still Expecting Core-OPEC 2.0 Production Increases
Uncertainty Tightens Oil Supply
Uncertainty Tightens Oil Supply
Chart 2US Oil Output Slightly Higher
US Oil Output Slightly Higher
US Oil Output Slightly Higher
Higher Brent prices will encourage short-term production increases from North Sea producers and others. However, it is not clear whether this will incentivize the years-long projects that will be needed to offset the lack of capex in the sector over the past decade or so. One of our high-conviction views resulting from the dearth of capex in oil and gas production is increasingly tighter markets by mid-decade – likely apparent by 2024 – which will require higher prices to reverse the lack of investment in new production. In line with our House view, we are not restoring the return of up to 1.3mm b/d of Iranian production to markets, given the guidance from this source proved unreliable earlier this month when it suspended talks with the US on its nuclear deal. We also are not assuming ceasefire talks between Ukraine and Russia will end to the Ukraine war, given the unreliability of the source (Russia) in these reports. Softer Demand Near Term Over the next few months, we expect the recent upsurge in COVID-19 cases in China to reduce Asian demand, but not tank it relative to our existing assumptions.6 Even though this was expected in our balances estimates, we are reducing our 2Q22 demand estimate by an additional 250k b/d, which is split evenly between DM and EM economies. This reflects the direct short-term hit to EM demand from China's lockdowns and a stronger USD, which raises the local-currency costs of oil, as well as the knock-on effects of additional supply-chain disruptions. Global consumption for 2022 is expected to be 4.4mm b/d higher on average vs 2021 levels, coming in at 101.54mm b/d, and 1.7mm b/d higher in 2023 vs. 2022 levels. We expect the Russian sanctions work-arounds being pursued by China and India – together accounting for a bit more than 20% of global oil demand – will be effective and will put overall EM demand back on trend in 2H22, assuming China's COVID-19 outbreak is brought under control (Chart 3). Chart 3COVID-19 Hits China Demand, But Does Not Tank EM Overall
COVID-19 Hits China Demand, But Does Not Tank EM Overall
COVID-19 Hits China Demand, But Does Not Tank EM Overall
While markets remain highly fluid – subject to sharp changes in perceptions of fundaments and their trajectories – these supply-demand estimates continue to point to relatively a balanced market this year and next (Chart 4). That said, the supply-demand fundamentals still leave inventories extremely tight, which means they will provide limited buffering against sudden shifts in supply, demand or both (Chart 5). This will, in our estimation, keep forward curves backwardated, which will support our long-term positions in long commodity-index exposure (i.e., the S&P GSCI and the COMT ETF). Chart 4Markets Remain Balanced...
Markets Remain Balanced...
Markets Remain Balanced...
Chart 5...And Inventories Remain Tight
...And Inventories Remain Tight
...And Inventories Remain Tight
Our base-case balances estimates translate into a 2022 Brent price forecast that averages $93/bbl, and a 2023 average estimate of $93/bbl, which are lower than our previous forecasts of $94/bbl and $98/bbl, respectively. For 1Q22, we now expect prices to average $98/bbl; 2Q22 to average $98.25/bbl; 3Q22 $88.45/bbl; and 4Q22 $87.30/bbl. Risks To Our View The supply side of our modeling remains exposed to exogenous political risks, chiefly: A failure on the part of core-OPEC 2.0 to increase production to offset lower-than-expected output outside the coalition's core; Lower-than-expected US oil output, given stronger-than-expected production discipline; and A return of up to 1.3mm b/d of Iranian barrels, which we no longer are assuming in our balances. We continue to believe core-OPEC 2.0 will increase production because it is in their interest not to allow inventory depletion to accelerate and for prices to move higher faster. The local-currency cost of oil in EM economies – the growth engine for oil demand – is high and going higher. In real terms – i.e., inflation-adjusted terms – it is even higher, as the real effective USD trade-weighted FX rate exceeds that of the nominal rate (Chart 6). This can be seen in the local-currency costs of oil in the world's largest consumers (Chart 7). We expect an announcement from core-OPEC 2.0 by the end of this month regarding a production increase. Chart 6High Real USD FX Rates Increase Local Oil Costs
Uncertainty Tightens Oil Supply
Uncertainty Tightens Oil Supply
Chart 7Local-Currency Oil Costs In Large Consuming States
Local-Currency Oil Costs In Large Consuming States
Local-Currency Oil Costs In Large Consuming States
Of course, KSA's diversification to USD alternatives as a risk-management strategy makes it less certain it will lead an output increase in exchange for an increased US commitment to its defense. Regarding US shale output, producers remain disciplined in their capital allocation. Even though we expect higher prices across the WTI forward curve will incentivize additional production, we could be over-estimating the extent of this increase in our modeling. Lastly, as noted above, Iran and Russia are indicating their trade concerns have been addressed by the US, which presumably will presumably will be followed by the return up to 1.3mm b/d of production to export markets. However, forward guidance from these producers has not been particularly reliable, and we could be wrong here as well. This would be a bearish fundamental on the supply side, which would pressure prices lower. Investment Implications Given the breakdown in talks between the US and Iran – presumably under pressure from Russia for guarantees the US would not sanction its trade with Iran – our Brent price forecast remains above $90/bbl (Chart 8). We expect the near-term price increase will dissipate as the sanctions work-arounds – particularly by China and India – re-route oil flows. Core OPEC 2.0 producers – KSA, the UAE and Kuwait – have sufficient surplus capacity to increase production to allow refiners to re-build inventories. This big question for markets now is will they bring it to market in the near term? KSA's interest in exploring yuan-linked oil trade with China adds an element of uncertainty to whether production will be increased. Perhaps that is a goal of this exercise: The US is being shown there are alternatives available to large oil exporters re terms of trade and providers of defense services. Chart 8Higher Prices Expected
Higher Prices Expected
Higher Prices Expected
There is sufficient spare capacity available at present to address the current physical deficits in global markets. Our analysis indicates markets are balanced but still tight, as can be seen in current and expected inventory levels. We remain long the XOP ETF and the S&P GSCI and COMT ETF. The latter ETFs provide long commodity-index based exposure that benefits from higher commodity prices and increasing backwardation in commodity markets generally, particularly oil. Robert P. Ryan Chief Commodity & Energy Strategist rryan@bcaresearch.com Ashwin Shyam Research Associate Commodity & Energy Strategy ashwin.shyam@bcaresearch.com Commodities Round-Up Precious Metals: Bullish Markets expected the Federal Reserve's rate hike of 25 basis points in the March and was not disappointed. Further rate hikes this year will occur against the backdrop of high geopolitical uncertainty and inflation, both of which are bullish for gold. The Russia-Ukraine crisis has added a new layer of complexity, and the Fed will need to proceed with caution to curb inflation but not over-tighten the economy. Footnotes 1 Please see All at sea: Russian-linked oil tanker seeks a port, published by straitstimes.com on March 10, 2022 for examples of shipping delays. 2 Please see Could Russia Look to China to Export More Oil and Natural Gas? published by naturalgasintell.com on March 9, and India says it’s in talks with Russia about increasing oil imports., published on March 15, for additional reporting. See also Besides China, Putin Has Another Potential De-dollarization Partner in Asia published by cfr.org, which discusses India-Russia trade agreements between 1953-92 with the signing of the 1953 Indo-Soviet Trade Agreement. 3 Please see Saudi considering China’s yuan for oil purchases published by al-monitor.com on March 16. 4 Please see the OIES Oil Monthly published on March 14. 5 Oil producers in a ‘dire situation’ and unable to ramp up output, says Oxy CEO published on March 8 by cnbc.com. 6 A resurgence of COVID-19 in China was not unexpected. It was one of our key views going into 2022. Please see 2022 Key Views: Past As Prelude For Commodities, which we published on December 16, 2021. In that report, we noted, "… China still is operating under a zero-tolerance COVID-19 policy, and has relied on less efficacious vaccines that appear to offer no protection against the omicron variant of the coronavirus. This also is a risk for EM economies that rely on these vaccines. However, the roll-out of mRNA vaccines globally via joint ventures will be gathering steam in 2H22, which is bullish for commodity demand." We continue to expect Chinese authorities to deploy mRNA vaccines or antivirals to combat this outbreak. Investment Views and Themes Strategic Recommendations Trades Closed in 2021
Image
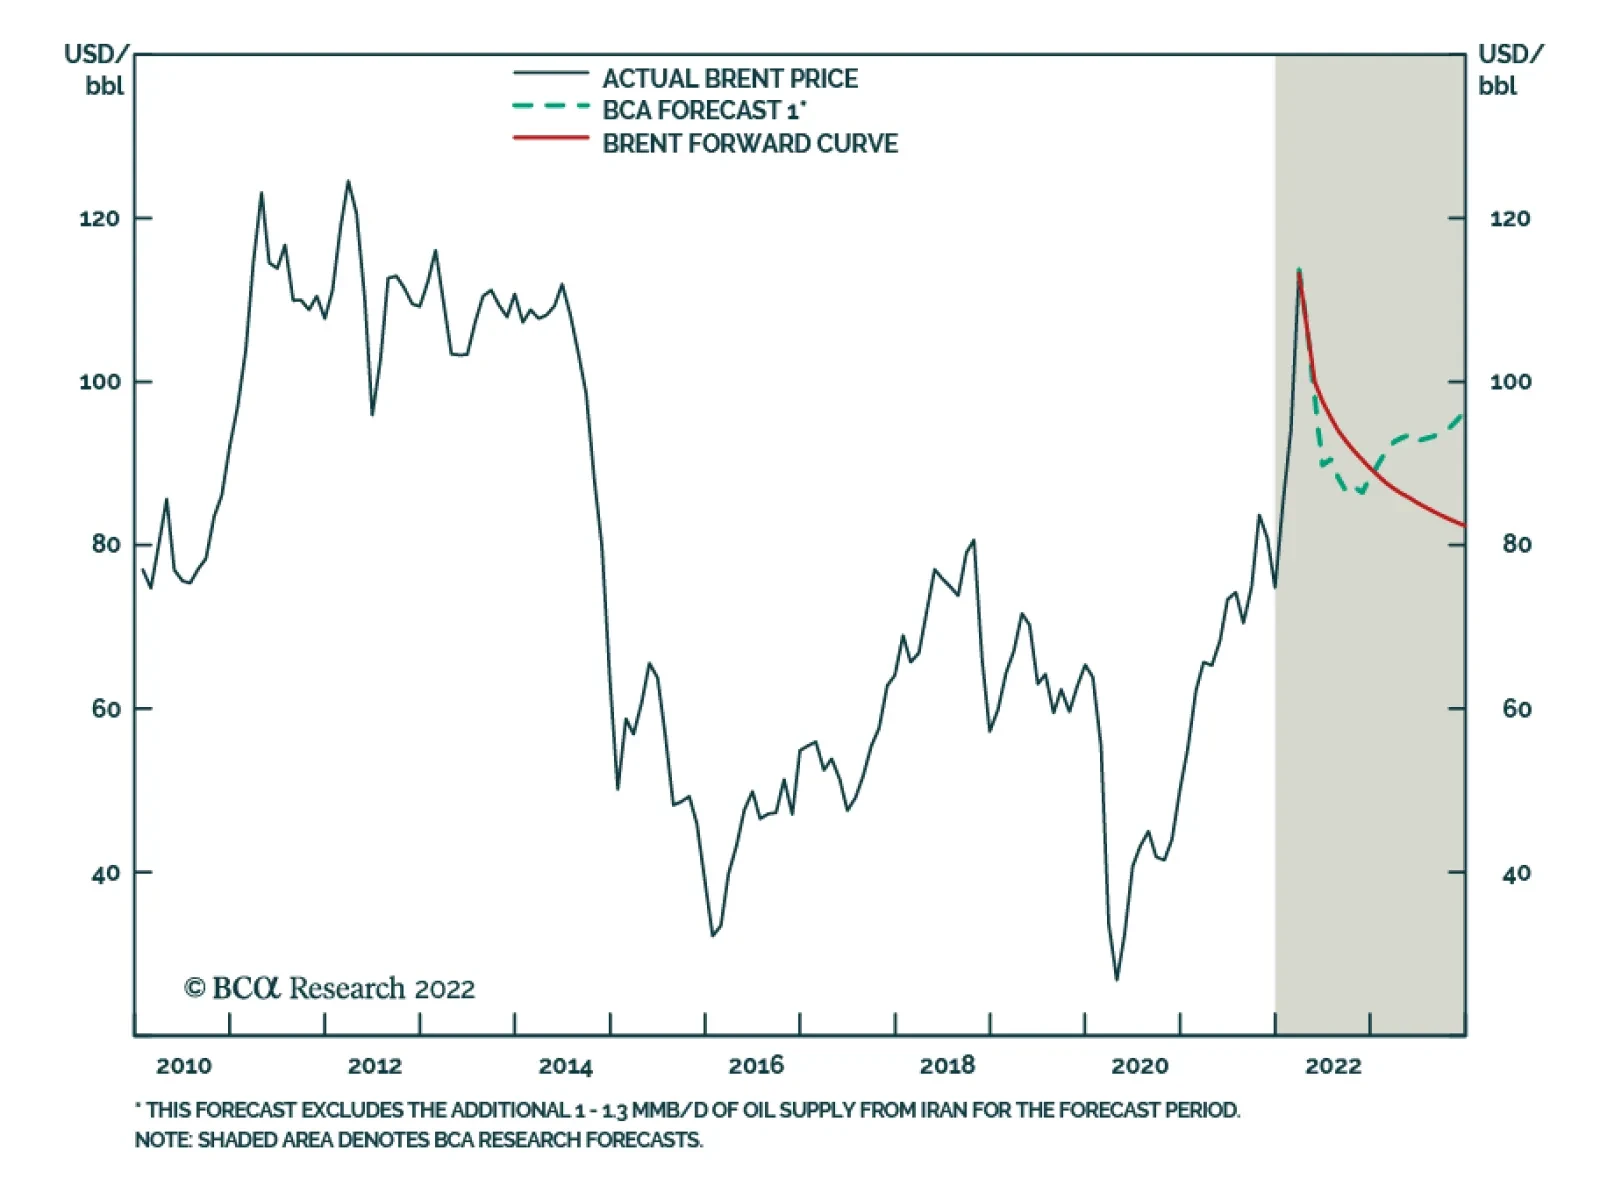
BCA Research’s Commodity & Energy Strategy service raised its Brent forecast to $93/bbl for this year and in 2023. The supply side remains exposed to exogenous political risks, chiefly: A failure on the part of core-OPEC 2.0 to increase…
Executive Summary For the Fed, maintaining its credibility with a long sequence of rate hikes that does not crash the economy, real estate market, and stock market is akin to the ‘Hail Mary’ move of (American) football. The likelihood that the Fed completes the straight sequence of eight rate hikes which the market is now pricing seems very low. Hence, today we are opening a new trade. Go long the September 2023 Eurodollar futures contract. Additionally, stay underweight Treasury Inflation Protected Securities (TIPS) versus T-bonds. And on a 12-month horizon, underweight the commodity complex, whose elevated prices are highly vulnerable to a near-certain upcoming demand destruction. Fractal trading watchlist: US interest rate futures, 3-year T-bond, Canada versus Japan, AUD/KRW, and EUR/CHF. Spending On Goods Looks Like An Earthquake On A Seismograph
Spending On Goods Looks Like An Earthquake On A Seismograph
Spending On Goods Looks Like An Earthquake On A Seismograph
Bottom Line: The likelihood that the Fed completes the straight sequence of eight rate hikes which the market is now pricing seems very low. Feature Amid the uncertainties of the Ukraine crisis, there is one certainty. The latest surge in energy and grain prices is a classic supply shock. Prices have spiked because vital supplies of Russian and Ukrainian energy and grains have been cut. This matters for central banks, because to the extent that they can bring down inflation, they can do so by depressing demand. They can do nothing to boost supply. In fact, depressing demand during a supply shock is a sure way to start a recession. But what about the inflation that came before the Ukraine crisis, wasn’t that due to excess demand? No, that inflation came not from a demand shock, but from a displacement of demand shock – as consumers displaced their firepower from services to goods on a massive scale. This matters because central banks are also ill placed to fix such a misallocation of demand. Chart I-1 looks like a seismograph after a huge earthquake, and in a sense that is exactly what it is. The chart shows the growth in spending on durable goods, which has just suffered an earthquake unlike any in history. Zooming in, we can see the clear causality between the surges in spending on durables and the surges in core inflation. The important corollary being that when the binge on durables ends – as it surely must – or worse, when durable spending goes into recession, inflation will plummet (Chart I-2). Chart I-1Spending On Goods Looks Like An Earthquake On A Seismograph
Spending On Goods Looks Like An Earthquake On A Seismograph
Spending On Goods Looks Like An Earthquake On A Seismograph
Chart I-2The Goods Binges Caused The Core Inflation Spikes
The Goods Binges Caused The Core Inflation Spikes
The Goods Binges Caused The Core Inflation Spikes
But, argue the detractors, what about the uncomfortably high price inflation in services? What about the uncomfortably high inflation expectations? Most worrying, what about the recent surge in wage inflation? Let’s address these questions. Underlying US Inflation Is Running At Around 3 Percent In the US, the dominant component of services inflation is housing rent, which comprises 40 percent of the core consumer price index. Housing rent combines actual rent for those that rent their home, with the near-identically behaving owners’ equivalent rent (OER) for those that own their home. Given the state of the jobs market, there is nothing unusual in the current level of rent inflation. Housing rent inflation closely tracks the tightness of the jobs market, because you need a job to pay the rent. With the unemployment rate today at the same low as it was in 2006, rent inflation is at the same high as it was in 2006: 4.3 percent. In other words, given the state of the jobs market, there is nothing unusual in the current level of rent inflation (Chart I-3). Chart I-3Given The Jobs Market, Rent Inflation Is Where It Should Be
Given The Jobs Market, Rent Inflation Is Where It Should Be
Given The Jobs Market, Rent Inflation Is Where It Should Be
Given its dominance in core inflation, rent inflation running at 4.3 percent would usually be associated with core inflation running at around 3 percent – modestly above the Fed’s target, rather than the current 6.5 percent (Chart I-4). Confirming that it is the outsized displacement of spending into goods, and its associated inflation, that is giving the Fed and other central banks a massive headache. Yet, to repeat, monetary policy is ill placed to fix such a misallocation of demand. Chart I-4Given Rent Inflation, Core Inflation Should Be 3 Percent
Given Rent Inflation, Core Inflation Should Be 3 Percent
Given Rent Inflation, Core Inflation Should Be 3 Percent
Still, what about the surging expectations for inflation? Many people believe that these are an independent and forward-looking assessment of how inflation will evolve. Yet nothing could be further from the truth. The bond market’s expected inflation is just the result of an algorithm that uses historic inflation. And at that, an extremely short period of historic inflation, just six months.1 The upshot is that when the backward-looking six month inflation rate is low, like it was in the depths of the global financial crisis in late 2008 or the pandemic recession in early 2020, the market assumes that the forward-looking ten year inflation rate will be low. And when the backward-looking six-month inflation rate is high, like early-2008 or now, the bond market assumes that the forward-looking ten year inflation rate will be high. In other words: Inflation expectations are nothing more than a reflection of the last six months’ inflation rate (Chart I-5). Chart I-5Inflation Expectations Are Just A Reflection Of The Last Six Months' Inflation Rate
Inflation Expectations Are Just A Reflection Of The Last Six Months' Inflation Rate
Inflation Expectations Are Just A Reflection Of The Last Six Months' Inflation Rate
Turning to wage inflation, with US average hourly earnings inflation running close to 6 percent, it would appear to be game, set, and match to ‘Team Inflation.’ Except that this is a flawed argument. To the extent that wages contribute to inflation, it must come from the inflation in unit labour costs, meaning the ratio of hourly compensation to labour productivity. After all, if you get paid 6 percent more but produce 6 percent more, then it is not inflationary (Chart I-6). Chart I-6If You Get Paid 6 Percent More But Produce 6 Percent More, Then It Is Not Inflationary
If You Get Paid 6 Percent More But Produce 6 Percent More, Then It Is Not Inflationary
If You Get Paid 6 Percent More But Produce 6 Percent More, Then It Is Not Inflationary
In this regard, US unit labour costs increased by 3.5 percent through 2021, and slowed to just a 0.9 percent (annualised) increase in the fourth quarter.2 Still, 3.5 percent, and slowing, is modestly above the Fed’s inflation target, and could justify a slight nudging up of the Fed funds rate. But it could not justify the straight sequence of eight rate hikes which the market is now pricing. The Fed Is Praying For A ‘Hail Mary’ Fortunately, the bond market understands all of this. How else could you say 7 percent inflation and 2 percent long bond yield in the same breath?! This is crucial, because it is the long bond yield that drives rate-sensitive parts of the economy, such as housing and construction. And it is the long bond yield that sets the level of all asset prices, including real estate and stocks. Although the Fed cannot admit it, the central bank also understands all of this and hopes that the bond market continues to ‘get it.’ Meaning that it hopes that the long end of the interest rate curve does not lift too far and crash the economy, real estate market, and stock market. So why is the Fed hiking the policy interest rate? The answer is that there will be a time in the future when it does need to lift the entire interest rate curve, and for that it will need its credibility intact. Not hiking now could potentially shred the credibility that is the lifeblood of any central bank. Still, to maintain its credibility without crashing the economy the Fed will have to make the ‘Hail Mary’ move of (American) football. For our non-American readers, the Hail Mary is a high-risk desperate move with little hope of completion. Go long the September 2023 Eurodollar futures contract. To sum up, the likelihood that the Fed completes the straight sequence of eight rate hikes which the market is now pricing seems very low. Hence, today we are opening a new trade. Go long the September 2023 Eurodollar futures contract (Chart I-7). Chart I-7The Likelihood That The Fed Completes A Straight Sequence Of Eight Rate Hikes Seems Low
The Likelihood That The Fed Completes A Straight Sequence Of Eight Rate Hikes Seems Low
The Likelihood That The Fed Completes A Straight Sequence Of Eight Rate Hikes Seems Low
Additionally, stay underweight Treasury Inflation Protected Securities (TIPS) versus T-bonds (Chart I-8). Chart I-8Underweight TIPS Versus T-Bonds
Underweight TIPS Versus T-Bonds
Underweight TIPS Versus T-Bonds
And on a 12-month horizon, underweight the commodity complex, whose elevated prices are highly vulnerable to a near-certain upcoming demand destruction. Fractal Trading Watchlist Confirming the fundamental analysis in the preceding sections, the strong trend in both the 18 month out US interest rate future and the equivalent 3 year T-bond has reached the point of fragility that has identified previous turning-points in 2018 and 2021 (Chart I-9 and Chart I-10). This week we are also adding to our watchlist the commodity plays Canada versus Japan and AUD/KRW, whose outperformances are vulnerable to reversal. From next week you will be able to see the full watchlist of investments that are vulnerable to reversal on our website. Stay tuned. Finally, the underperformance of EUR/CHF has reached the point of fragility on its 260-day fractal structure that has identified the previous major turning-points in 2018 and 2020 (Chart I-11). Accordingly, this week’s recommended trade is long EUR/CHF, setting a profit target and symmetrical stop-loss at 3.6 percent. Chart I-9The Strong Trend In The 18-Month-Out US Interest Rate Future Is Fragile
The Strong Trend In The 18-Month-Out US Interest Rate Future Is Fragile
The Strong Trend In The 18-Month-Out US Interest Rate Future Is Fragile
Chart I-10The Strong Trend In The 3 Year T-Bond Is Fragile
The Strong Trend In The 3 Year T-Bond Is Fragile
The Strong Trend In The 3 Year T-Bond Is Fragile
Chart I-11Go Long EUR/CHF
Go Long EUR/CHF
Go Long EUR/CHF
Canada Versus Japan Is Vulnerable To Reversal
Canada Versus Japan Is Vulnerable To Reversal
Canada Versus Japan Is Vulnerable To Reversal
AUD/KRW Is Vulnerable To Reversal
AUD/KRW Is Vulnerable To Reversal
AUD/KRW Is Vulnerable To Reversal
Dhaval Joshi Chief Strategist dhaval@bcaresearch.com Footnotes 1 The expected 10-year inflation rate = (deviation of 6-month annualized inflation from 1.6)*0.2 + 1.6. 2 Source: Bureau of Labor Statistics Fractal Trading System Fractal Trades
The Fed Needs A ‘Hail Mary’ To Maintain Credibility Without Crashing The Economy
The Fed Needs A ‘Hail Mary’ To Maintain Credibility Without Crashing The Economy
The Fed Needs A ‘Hail Mary’ To Maintain Credibility Without Crashing The Economy
The Fed Needs A ‘Hail Mary’ To Maintain Credibility Without Crashing The Economy
6-Month Recommendations Structural Recommendations Closed Fractal Trades Indicators To Watch - Bond Yields Chart II-1Indicators To Watch - Bond Yields - Euro Area
Indicators To Watch - Bond Yields - Euro Area
Indicators To Watch - Bond Yields - Euro Area
Chart II-2Indicators To Watch - Bond Yields - Europe Ex Euro Area
Indicators To Watch - Bond Yields - Europe Ex Euro Area
Indicators To Watch - Bond Yields - Europe Ex Euro Area
Chart II-3Indicators To Watch - Bond Yields - Asia
Indicators To Watch - Bond Yields - Asia
Indicators To Watch - Bond Yields - Asia
Chart II-4Indicators To Watch - Bond Yields - Other Developed
Indicators To Watch - Bond Yields - Other Developed
Indicators To Watch - Bond Yields - Other Developed
Indicators To Watch - Interest Rate Expectations Chart II-5Indicators To Watch - Interest Rate Expectations
Indicators To Watch - Interest Rate Expectations
Indicators To Watch - Interest Rate Expectations
Chart II-6Indicators To Watch - Interest Rate Expectations
Indicators To Watch - Interest Rate Expectations
Indicators To Watch - Interest Rate Expectations
Chart II-7Indicators To Watch - Interest Rate Expectations
Indicators To Watch - Interest Rate Expectations
Indicators To Watch - Interest Rate Expectations
Chart II-8Indicators To Watch - Interest Rate Expectations
Indicators To Watch - Interest Rate Expectations
Indicators To Watch - Interest Rate Expectations
Executive Summary Global Oil Price Pushes Up Inflation Expectations
Global Oil Price Pushes Up Inflation Expectations
Global Oil Price Pushes Up Inflation Expectations
The US cut off of Russian energy exports has limited immediate impact because EU trade with Russia continues. Russia is unlikely to embargo the EU as it needs revenues to wage war. However, the EU will diversify away from Russia over time, which means that Russia will intensify its efforts to replace the government in Ukraine. The Biden administration began with an adversarial posture toward the energy sector, both US producers and Gulf Arab petro-states. Now it is adjusting its stance as prices surge. The OPEC states do not favor Biden but have an interest in calibrating production to avoid global recession and prolong their profit windfall. Even if the US restores the 2015 nuclear deal with Iran, which we doubt, investors should fade the oil price implications and stay focused on OPEC. Recommendation (Tactical) Inception Level Inception Date Return Long DXY (Dollar Index) 96.19 Feb 23, 2022 2.9% Bottom Line: Stagflation is the likeliest economic outcome of today’s global supply constraints. Feature Biden’s Oil Policy: Implications Will the Ukraine crisis lead to a US recession? The probability of a recession is 7.7% today, according to the bond market, but the oil price shock suggests that the probability will only increase from here. Stagflation, at least, is now highly likely. Short-term interest rates are rising faster than long-term rates, causing the 2-year/10-year Treasury slope to slide toward inversion, though it is not there yet. That would be a telltale sign of a looming recession (Chart 1). The 3-mo/10-year Treasury yield slope is nowhere near inverting and has a better record of predicting recessions than the 2-year/10-year. The Federal Reserve’s interest rate hikes are expected to cause the 10-year yield to rise and the yield curve to steepen. But exogenous shocks may push short rates even higher. When the oil price doubles, a recession often ensues. Out of the past seven recessions, five of them witnessed an oil spike beforehand. True, not every spike causes a recession. But the causality is clear. Today’s spike is large enough to be recessionary (Chart 2). The critical question is where will the price settle? If it settles above $90-$100 per barrel then it will erode global demand. Chart 1An End-Of-Cycle Crisis?
An End-Of-Cycle Crisis?
An End-Of-Cycle Crisis?
Chart 2Oil Price Often Doubles Before Recessions
Oil Price Often Doubles Before Recessions
Oil Price Often Doubles Before Recessions
Most likely the price will settle at around $85 per barrel by the end of 2022, and average $85 in 2023, according to our Commodity & Energy Strategy. High prices will discourage consumption and incentivize new production, leading to a price drop and new equilibrium. The OPEC cartel will increase production because they want to prolong the business cycle. Non-OPEC producers like US shale oil companies will also increase production. It is not likely that the US will significantly lift sanctions on Iran and Venezuela, though that would free up 1.3 million barrels per day and 700,000 barrels per day respectively. More on this below. Even so, this year’s energy spike will feed into a larger bout of inflation that is eroding real incomes. Headline consumer price inflation is running at 7.9% as of February, the highest in four decades. Core inflation is running at 6.4%. The Ukraine war did not prevent the European Central Bank from delivering a hawkish surprise in its fight against inflation on March 10, so it is even less likely to prevent the Fed from delivering a hawkish surprise on March 16. The Fed has a history of hiking rates even during geopolitical crises (as during the Arab oil embargo of 1973), which implies that the war in Ukraine will not prevent the Fed from hiking rates four times or more this year. There is a close relationship between the global oil price and the financial market’s long-term inflation expectations (Chart 3). When the costs of production and transportation go up, investors start to expect higher prices. Expectations are already rising because of the global pandemic, stimulus, supply constraints, wage pressure, and tardy policy normalization. Gasoline prices at the pump will shape consumer expectations (Chart 4). Chart 3Global Oil Price Pushes Up Inflation Expectations
Global Oil Price Pushes Up Inflation Expectations
Global Oil Price Pushes Up Inflation Expectations
Chart 4Geopolitics Compound Inflation
Geopolitics Compound Inflation
Geopolitics Compound Inflation
Yet high commodity prices are not coinciding with strong global growth and a weak dollar, as one might suspect. Global growth is falling and the dollar is strengthening. The energy shock from Russia will rattle importing countries like Europe, China, and India and thus enhance the dollar’s rise (Chart 5). Investor sentiment will suffer as the war in Ukraine reinforces the secular rise in geopolitical risk. Global policy uncertainty is also rising sharply, which will reinforce the dollar, weighing on global economic activity. Chart 5Dollar Strengthens on Weak Global Growth
Dollar Strengthens on Weak Global Growth
Dollar Strengthens on Weak Global Growth
Bottom Line: A stagflationary dynamic is taking shape. Moreover the risk of recession is underrated by the bond market’s measure of recession probability. Investors should maintain tactically bearish trades and cut losses on cyclically bullish trades that suffer from higher rates and persistent inflation. US Boycotts Russia And Begs OPEC The Biden administration’s decision to ban Russian oil exports – and to encourage private sector boycotts of the Russian energy trade – raises the potential for the Russian conflict to escalate beyond Ukraine’s borders. While a total boycott of Russian oil exports is unlikely, it would be one of the larger oil shocks in modern history (Chart 6). Unlike the Iranian attack on the Saudi oil refinery in 2019, the Russian shock would come amid an existing energy shortage. Chart 6Worst Case Oil Risk in Historical Context
Biden's Oil Shock
Biden's Oil Shock
There are two critical questions about US policy at this stage: Will the US foist its energy boycott on Europe, triggering a Russian retaliation? This could plunge Europe into recession and further upset the global economy. Will the US convince the OPEC cartel to increase oil production? A production boost would reduce prices and help to rebalance the economy, salvaging the business cycle. The next two sections discuss these options. US Boycotts Russia The first question is how Russia will respond to the US boycott and whether the Biden administration will try to force Europe to adopt the boycott. The US is comfortable boycotting Russian energy because oil and gas imports only account for 0.6% of GDP and those from Russia only 0.04%. Europe cannot make the same decision. While O&G imports are only 2.21% of GDP, and Russian O&G imports at 0.4%, these numbers will spike to near 2008 levels as a result of the price shock (Charts 7A & 7B). Major European countries, notably Germany, have already rejected the US boycott, and any EU direct sanctions require unanimity. The EU is instead outlining a plan to diversify away from Russia more gradually. This is a medium-term threat to Russia and hence a major concern for global stability but it is not an instant cutoff, which would cause an immediate recession in Europe. Chart 7AThe US Is Energy Independent...
Biden's Oil Shock
Biden's Oil Shock
Chart 7B...The EU Is Not
Biden's Oil Shock
Biden's Oil Shock
The EU’s plan would theoretically reduce its dependency on Russian energy by 66% by the end of the year. But that is easier said than done. Also, Europe cannot simply swap the US for Russia. American exports to the rest of the world could be redirected to Europe, but the switch requires an overhaul of supply chains. A total switch of US exports to Europe is impracticable in the short run and would leave other US allies dependent on Russian exports (Charts 8A & 8B). Chart 8AUS Will Not Replace Russian Energy Anytime Soon
Biden's Oil Shock
Biden's Oil Shock
Chart 8BUS Will Not Replace Russian Energy Anytime Soon
Biden's Oil Shock
Biden's Oil Shock
US shale producers are only starting to increase production. With WTI crude oil at $100, and Henry Hub natural gas spot price at $4.6 per million BTU, American production will speed up. But US companies are more focused on profitability and returns to shareholders than they were at the beginning of the shale boom, which has restrained oil production (Charts 9A & (9B). Chart 9AUS Production And Exports Increase After Pandemic Lull
US Production And Exports Increase After Pandemic Lull
US Production And Exports Increase After Pandemic Lull
Chart 9BUS Production And Exports Increase After Pandemic Lull
US Production And Exports Increase After Pandemic Lull
US Production And Exports Increase After Pandemic Lull
The Biden administration has not yet fully adopted the tactics necessary: promoting the domestic fossil fuel industry and coordinating it for purposes of national strategy. American oil executives complain that while the Biden administration courts foreign energy producers and contemplates arbitrarily lifting sanctions on Iran and Venezuela, it has not approached domestic producers about facilitating production.1 Meanwhile there is a risk that Russia will retaliate against western sanctions by cutting off natural gas to the EU, for instance via the Nord Stream I pipeline. This is a risk, rather than a base case, because Moscow would prefer to sell energy as long as Europe is buying – and even increase the amount it produces at today’s high prices. Russian energy exports to the EU account for 5% of Russian GDP and thus provide an important lifeline at a time when the country is suffering heavily under banking, technology, and trade sanctions (Chart 10). Russian natural resource exports on average provide 43% of government revenue, which is essential for Moscow to carry on its war effort (Chart 11). Chart 10Russia Will Not Punish EU For US Boycott
Biden's Oil Shock
Biden's Oil Shock
Chart 11Russia Needs EU Energy Imports
Biden's Oil Shock
Biden's Oil Shock
And yet Russians are now slapping an embargo on agricultural exports, constricting global food supply and pushing up food prices. The implication is that a reduction in energy exports to the EU is not out of the question, especially an incremental reduction aimed at increasing Russian diplomatic pressure on Europe. If the Russians cut off Europe, it will fall into a severe recession and the energy shock will risk a global recession. While US direct trade exposure to Europe is limited, at about 3.8% of GDP (Chart 12A), nevertheless the US would suffer from price pressures. The US is already seeing import prices rise toward 2008 levels (Chart 12B). Chart 12AUS Exposure To The EU Is Limited...
US Exposure To The EU Is Limited...
US Exposure To The EU Is Limited...
Chart 12B...But Its Import Prices Will Rise
...But Its Import Prices Will Rise
...But Its Import Prices Will Rise
Bottom Line: The US is boycotting Russian oil but not forcing the EU to join the boycott. Europe is pursuing gradual diversification but Russia is unlikely to cut off Europe’s supply. However, this dynamic is showing signs of faltering, which means investors are justified in taking further risk off the table. US Begs OPEC The Biden administration started off on the wrong foot with the Gulf Arab states by criticizing them for autocratic government and human rights abuses, threatening to withhold arms sales, and trying to restore the 2015 nuclear deal and détente with Iran. Now, with a global energy shock unfolding, Biden is going back to Saudi Arabia and the UAE and imploring them to increase oil production and ease the supply pressure. The Arab states are reportedly giving him the cold shoulder, ignoring his phone calls while answering Russian President Vladimir Putin’s calls.2 These states never have an interest in producing oil at any US president’s beck and call. The US and Iran have also reached a critical stage in nuclear negotiations. So it is only fitting that the Arab states play hard to get. While the UAE ambassador to the US suggested that his country supporting increasing production on March 9, the country’s energy minister said the opposite. However, the core OPEC states are even less likely to do Russia’s bidding. Moscow propped up the Syrian regime, arms and subsidizes Iran, and aspires to gain ever greater control over Middle East exports to Europe. The Gulf states also know that the Russians will produce as much energy as they can since they need the revenues to sustain their war (Chart 13). Chart 13Core OPEC Countries Have An Interest In Increasing Oil Supply
Core OPEC Countries Have An Interest In Increasing Oil Supply
Core OPEC Countries Have An Interest In Increasing Oil Supply
The Gulf states rely on the US military for national security, they fear that US-Iran détente will lead to US abandonment and Iranian regional ascendancy, and they seek to sustain their centrality to the global oil market. They want to prolong their export revenues in the context of a growing global economy for the sake of their own delicate internal stability and reforms. They do not aim to incentivize non-OPEC oil production and renewable energy transition with excessive prices, or to trigger a global recession (Chart 14). Hence the Saudi and UAE strategy will be to lower the oil price closer to their fiscal breakeven rate of $82.3 and $62.8 (oil price consistent with a balanced budget) and prolong the business cycle (Chart 15). Chart 14Core OPEC Does Not Want To Threaten Their Fiscal Future
Biden's Oil Shock
Biden's Oil Shock
Chart 15Current Oil Price Comfortably Supports Fiscal Spending In OPEC
Biden's Oil Shock
Biden's Oil Shock
The critical factor in the negotiation with the Biden administration will be Iran, their chief rival. Biden is trying to rejoin the 2015 nuclear deal, which would require removing sanctions in exchange for Iran’s halting its nuclear progress. A deal would bring 1.3 million barrels per day online, at least for the next two years or so. It could also prompt the Saudis or others to increase production to prevent Iran from stealing market share, as occurred in 2014 (Chart 16). Any deal would reduce the risk of military conflict in the short term and as such would remove some risk premium from oil prices. If Biden agrees to walk away from the Iran deal, then perhaps the Saudis and UAE will oblige him with a larger and quicker production boost. They know the Democratic Party is doomed in this year’s midterm elections anyway. Sanctions are not preventing the Iranians from exporting oil today and there is very little chance that they will truly abandon their quest for nuclear weapons (Chart 17). Chart 16Production Ramped Up Ahead Of The Iran Deal In 2015
Production Ramped Up Ahead Of The Iran Deal In 2015
Production Ramped Up Ahead Of The Iran Deal In 2015
Chart 17Production May Ramp Up Again As Iran Managed To Evade Sanction
Production May Ramp Up Again As Iran Managed To Evade Sanction
Production May Ramp Up Again As Iran Managed To Evade Sanction
Either way the core OPEC members need to adjust the oil supply to maintain market share and prolong the business cycle. Taking it all together, investors should expect oil prices to remain volatile and for oil supply risks to remain elevated, meaning that oil prices will likely resume their rise after the expected OPEC intervention. Biden is also tinkering with the idea of easing sanctions on Venezuela. This would take a long time and require regime change to come to fruition. Venezuela produces about 700,000 barrels per day at present, down from about 2 million bpd in 2017.Given the lack of capital, investment, and engineering expertise, the Venezuelans probably cannot increase production beyond 1 million bpd over the next year or so. Of that, maybe 600,000 barrels could be sent to export markets, according to our Commodity & Energy Strategist Bob Ryan. The US cannot remove all sanctions from Venezuela as it does not recognize the legitimacy of President Nicolas Maduro’s regime. The Department of Justice indicted Maduro in 2020. Accommodating Maduro will create even more bad blood between the Democrats and the Cuban-American voters in electorally critical Florida. US companies will be reluctant to get involved in oil production in Venezuela on such a flimsy basis, as they will fear future sanctions if Republicans win in 2024. So investment in Venezuela, and hence oil production, will remain limited even if Biden waives some sanctions. Bottom Line: Biden’s attempts to ease sanctions on Iran and Venezuela are unlikely to have a lasting impact on oil prices. But it is possible that he will convince the OPEC states to increase production, as their own interests support such a move. Investment Takeaways Comparing Russia’s 2022 invasion of Ukraine to the original invasion in 2014, the major trends are parallel: stocks are falling relative to bonds, cyclical sectors are underperforming defensives, and small caps are outperforming large caps (Chart 18A). Chart 18AMarket Response 2022 Versus 2014
Market Response 2022 Versus 2014
Market Response 2022 Versus 2014
Chart 18BMarket Response 2022 Versus 2014
Market Response 2022 Versus 2014
Market Response 2022 Versus 2014
If Russia imposes an energy embargo or OPEC refuses to increase production, then there will be an even larger global energy shock and a European recession that will weigh on global growth. The dollar will stay well bid in the near term. Value stocks are far outpacing growth stocks in the 2022 crisis, in keeping with high inflation and rising bond yields (Chart 18B). While we favor value over growth on a structural basis, we took the opposite stance as a tactical trade at the beginning of this year in expectation of falling bond yields, which has backfired. We are closing this trade for a loss of 7.7%. Matt Gertken Senior Vice President Chief US Political Strategist mattg@bcaresearch.com Footnotes 1 See Shannon Pettypiece, “White House, oil industry spar anew over drilling as gas prices surge”, NBC News, March 12, nbcnews.com. 2 See Holman Jenkins, “The Putin Endgame,” The Wall Street Journal, March 1, 2022, wsj.com Strategic View Open Tactical Positions (0-6 Months) Open Cyclical Recommendations (6-18 Months) Table A2Political Risk Matrix
Biden's Oil Shock
Biden's Oil Shock
Table A3US Political Capital Index
Biden's Oil Shock
Biden's Oil Shock
Chart A1Presidential Election Model
Biden's Oil Shock
Biden's Oil Shock
Chart A2Senate Election Model
Biden's Oil Shock
Biden's Oil Shock
Table A4APolitical Capital: White House And Congress
Biden's Oil Shock
Biden's Oil Shock
Table A4BPolitical Capital: Household And Business Sentiment
Biden's Oil Shock
Biden's Oil Shock
Table A4CPolitical Capital: The Economy And Markets
Biden's Oil Shock
Biden's Oil Shock
Executive Summary Failure Of Iran Deal Tightens Oil Supply
Failure Of Iran Deal Tights Oil Supply
Failure Of Iran Deal Tights Oil Supply
The US and Iran suspended their attempt to negotiate a nuclear deal on March 11. Countries often get cold feet before major agreements but there are good reasons to believe this suspension will be permanent. A confirmed failure to restore the US-Iran strategic détente will lead to Middle Eastern instability. Iran will be on a trajectory to achieve nuclear weapons in a few years while Israel and the US will have to underscore their red lines against weaponization. The Strait of Hormuz will come under threat again. The immediate impact on oil prices should be positive: sanctions will continue to hinder Iran’s exports, while Iranian conflict with its neighbors will sharply increase the odds of oil disruptions caused by militant actions. Not to mention the Russia-induced energy supply shock. However, a decisive move by the Gulf Arab states to boost crude production would counteract the effect of Iranian sanctions and drive oil down. The Gulf Arabs will be more inclined to coordinate with the Biden administration as long as the Iran deal is ruled out. Thus oil volatility is the main implication beyond any short term oil spike. Trade Recommendation Inception Date Return Long Gold (Strategic) 2019-12-06 36.8% Bottom Line: Go long US equities relative to global; long US and Canadian stocks versus Saudi and UAE stocks. Stay long XOP ETF, S&P GSCI index, and COMT ETF for exposure to oil prices and backwardation in oil forward curves. Feature The current Iran talks would have restored Joint Comprehensive Plan of Action (JCPA), which created a strategic détente between the US and Iran. Iran froze its nuclear program while the US lifted sanctions. President Barack Obama negotiated the deal in 2015, without congressional approval, while President Donald Trump nullified it in 2018, arguing that it did not restrict Iran’s ballistic missile development or support for regional militant groups. Chart 1Bull Market In Iran Tensions Will Be Super-Charged
Bull Market In Iran Tensions Will Be Super-Charged
Bull Market In Iran Tensions Will Be Super-Charged
Since then there has been a bull market in Iran tensions (Chart 1), a secret war in which sporadic militant attacks, assassinations, and acts of sabotage occurred but neither side pursued open confrontation. These attacks can be significant, as with the Iran-backed attack on the Abqaiq refinery in Saudi Arabia, which took 6mm b/d of oil-processing capacity offline briefly in September 2019. The implication of this trend is energy supply disruption. Now the trend will be super-charged in the context of a global energy shortage. If no US-Iran détente is achieved, the Middle East will be set on a new trajectory of conflict, or at least a nuclear arms race and aggressive containment strategy. Since Trump turned away from the US-Iran détente and reimposed sanctions on Iran we have given a 40% chance of large-scale military conflict, according to our June 2019 decision tree (Diagram 1). The basis for such a conflict is Iran’s likelihood of obtaining nuclear arms and the need of Israel, its Arab neighbors, and the US to prevent that from happening. Diagram 1US-Iran Conflict: Critical Juncture In Our Decision Tree
US-Iran Talks Break Down
US-Iran Talks Break Down
Between now and then, tit-for-tat military exchanges will increase, posing risks to oil supply in the short and medium run. Without a major diplomatic breakthrough that halts Iran’s nuclear weaponization, a bombing campaign against Iran will be the likeliest long-term consequence, due to the fateful logic of Israel’s strategic predicament (Diagram 2). Diagram 2Over Medium Term, Unilateral Israeli Military Action Is Possible
US-Iran Talks Break Down
US-Iran Talks Break Down
Why Rejoining The US-Iran Deal Was Unlikely Under the Biden administration’s new plan, Iran would have frozen its nuclear program once again while Biden would have relaxed US “maximum pressure” sanctions on Iran, opening the way for foreign investment and the development of Iran’s energy sector and economy. The basis for a deal was the belief among some US policymakers that engagement with Iran would open up its economy, reducing regional war risks (especially in Iraq), expanding global energy supply, and fomenting pro-democratic sentiment in Iran. Also the Washington military-industrial complex wanted to reduce the US’s commitment to the Middle East and arrange a grand strategic “pivot to Asia” so as to counter the rise of China. Up till August 2021, we viewed a deal as likely, but that view changed when Iran’s hawkish or hardline faction came back into the presidency. Biden had a very small window of opportunity to negotiate with outgoing Iranian President Hassan Rouhani, who negotiated the original 2015 deal and whose administration fell apart after President Trump withdrew from the deal. When the hawkish Iranian faction took back power, this opportunity slipped. Iran’s hawks were vindicated for having opposed détente with the US in the first place. Since then we have argued that strategic tensions would escalate, for the following reasons: The Iranians could not trust the Americans, since they knew that any new deal could be torn up as early as January 20, 2025 if the Republican Party took back the White House. Indeed, former Vice President Mike Pence recently confirmed this view explicitly. The Iranians were not compelled to agree to the deal because high oil prices ensured that they could export oil regardless of US sanctions (Chart 2). The US no longer has the diplomatic credibility to galvanize a coalition that includes the Russians and Chinese to isolate Iran, like it did back in 2014-15. Chart 2Iranians Not Compelled To A Deal, Can Circumvent Sanctions
Iranians Not Compelled To A Deal, Can Circumvent Sanctions
Iranians Not Compelled To A Deal, Can Circumvent Sanctions
As for Iran’s weak economy spurring social unrest and forcing Supreme Leader Ayatollah Ali Khamenei to agree to a deal, the US has had maximum pressure sanctions in place since 2019 and it has not produced that effect. Yes, Iran is ripe for social unrest, but the regime is consolidating power under the hardliners rather than taking any risky course of opening up and reform that could foment pro-democratic and pro-western demands for change. With oil revenues flowing in, the regime will be more capable of suppressing domestic opposition. The Americans could not trust the Iranians because they knew that they would ultimately pursue nuclear weapons regardless of any short-term revival of the 2015 deal. The Iranians have a stark choice between North Korea, which achieved nuclear weaponization and now has a powerful guarantee of future regime survival, and countries like Ukraine and Libya, which gave up nuclear weapons or programs only to be invaded by foreign armies. Moreover the Iranian nuclear deal lacked popular support, even among Obama Democrats back in 2015, not to mention today in the wake of the deal’s cancellation. The deal’s provisions would have begun expiring in 2025 under any conditions. The Israelis and Gulf Arabs opposed the deal. The Russians also switched to opposing the deal and made new demands at the last minute as a result of the US sanctions imposed on Russia in the wake of its invasion of Ukraine. The Russians do not have an interest in Iran obtaining a nuclear weapon and they supported the 2015 deal and the 2021-22 renegotiation while demanding their pound of flesh in the form of Ukraine. But they also know that Israel and the US will use military force to prevent Iran from getting the bomb, so they are not compelled to join any agreement. Crippling US sanctions over Ukraine likely caused them to interfere with the deal. Our pessimistic view is now confirmed, with the suspension of talks. True, informal talks will continue, diplomacy could somehow revive, and it is still possible for a deal to come together. But given our fundamental points above, we would give any durable diplomatic solution a low probability, say 5%. That means that the US and Iran will not engage, which means Iran will re-activate its regional militant proxies and begin pursuing nuclear weaponization. Iran has a powerful incentive to increase regime security before the dangerous leadership succession that looms over the nearly 83 year-old Khamenei and the threatening possibility of a Republican’s reelection in 2024. At present, it is unknown which side of the Iran nuclear deal talks suspended them. While the Iranians were not compelled by an international coalition to join the deal as they were in 2015, we cannot ignore the possibility the suspension in talks arises from a deal being reached between the US and core OPEC 2.0 producers (Saudi Arabia, the UAE, and Kuwait). Very simply, such a deal would entail that the Arab states increase output, to ease the global shortage, in return for the US walking away from the flawed Iran deal and pledging to work with Israel and the Gulf Arabs to contain Iran. Israel and the Gulf Arabs are increasingly aligned in their goal of countering Iran under the Abraham Accords, negotiated in 2020 by the Trump administration. If the US and Gulf states agreed, then the Gulf states are likely to increase production to ease the global shortage and prolong the business cycle, meaning that oil prices could fall rather than rise as their next move. Either way they will remain volatile as a result of global developments. What Next? Escalation In The Middle East The Iranians have made substantial nuclear progress since 2018, despite Israeli attempts at sabotaging critical facilities. Today Iran stands on the brink of achieving “breakout” levels of highly enriched uranium – levels at which it is possible to construct a nuclear device (Table 1). Table 1Iran Will Reach ‘Breakout’ Nuclear Capability
US-Iran Talks Break Down
US-Iran Talks Break Down
The suspension of talks means the Iranians will soon reach breakout capacity, which will splash across global headlines. This news will rattle global financial markets as it will point to a nuclear arms race in the most volatile of regions. There is a gap of one-to-two years between breakout uranium enrichment and deliverable nuclear weapon, according to most experts.1 However, it is much easier to monitor nuclear programs than missile programs, which means western intelligence will lose visibility when it comes to knowing precisely when Iran will obtain a functional nuclear warhead that it can mount on a ballistic missile. The Iranians are skillful at ballistic missiles. The clock will start ticking once nuclear breakout is achieved and the Israelis and Americans will be forced to respond by underscoring their red line against weaponization. Starting right away, Israel and the US will need to demonstrate publicly that they have a “military option” to prevent Iran from achieving nuclear weaponization. They will refrain from immediate military action but will seek to re-establish a credible threat through shows of force. They will also redouble their efforts to use special operations and cyber attacks to set back the Iranian programs. The Iranians will seek to deter them from attacking and will want to highlight the negative consequences. The US-Iran talks were not only about the nuclear program but also about a broader strategic détente. The Iranians will no longer rein in their regional militant proxies, whether the militias in Iraq or the Houthis in Yemen or Hezbollah in Lebanon. In effect we are now looking at a major escalation of militant attacks in the Middle East at a time when oil is already soaring. In many cases the express intent of the Iran-backed groups will be to threaten oil supply to demonstrate the leverage that they have to intimidate the US and its allies and discourage them from applying too much pressure too quickly. Bottom Line: On top of the current oil shock, we are about to have a higher risk premium injected into oil from Middle Eastern proxy conflict involving Iran. If OPEC does not act quickly to boost production then financial markets face additional commodity price pressures, on top of the existing Russia-induced supply shock. Commodity And Energy Implications Our Commodity & Energy Strategist, Bob Ryan, outlines the following implications for the oil market: In BCA Research's oil supply-demand balances, while we recognized the Geopolitical Strategy view that the US-Iran deal would not materialize, nevertheless we assumed that Iran would return up to 1.3mm b/d of production by 2H22, which would have been available for export markets. This would have given a significant boost to oil supply as the market continues to tighten. Chart 3Failure Of Iran Deal Tights Oil Supply
Failure Of Iran Deal Tights Oil Supply
Failure Of Iran Deal Tights Oil Supply
The failure of these barrels to return to the market will result in an oil-price increase of about $15/bbl in 2023, based on our modeling (Chart 3). We can expect backwardations to increase in Brent and WTI, as demand for precautionary inventories increases. The modelled prices include the oil risk premium of ~USD 9/bbl in H2 2022 and USD 5/bbl in 2023. Relative to 2021, we expect core- OPEC - KSA, UAE and Kuwait – and total US crude supply to increase by 1.7 mmb/d and 0.65 mmb/d respectively in 2022. Compared to 2022, core-OPEC supply will level off in 2023, and will increase by 0.6 mmb/d for total US. If the US has a deal with core OPEC, then, based on the reference production levels agreed by OPEC 2.0 in July 2021, core OPEC’s production capacity could cover a large bit of the volumes markets are short (Table 2). This is due to lower monthly additions of output that was supposed to be returned to markets – now above 1mm b/d – and the lost Iranian output (Table 2). Table 2OPEC 2.0 Reference Production Levels
US-Iran Talks Break Down
US-Iran Talks Break Down
Per the OPEC 2.0 reference production schedule released following the July 2021 meeting in Vienna, Saudi Arabia’s output is free to go to 11.5mm b/d by May, the UAE's to 3.5mm b/d, and Kuwait's to just under 3mm b/d. Iraq also could raise output, but its output is variable and it will lie at the center of the new escalation in military tensions, so we do not count it as core OPEC 2.0 production. Assuming these numbers are consistent with actual capacity for core OPEC 2.0, that means Saudi Arabia could lift production by ~ 1.1mm b/d, UAE by ~ 0.5m b/d, and Kuwait by close to 0.3mm b/d. That’s almost 2mm b/d. These reference-production levels might be on the high side of what core OPEC 2.0 is able or willing to do. But they would be close to covering most of the deficit resulting from less-than-anticipated return of 400k b/d from OPEC 2.0 producers beginning last August ( ~ 1.2mm b/d). Most of Iran’s lost output also would be covered. More than likely, these barrels will find their way to market "under the radar" (i.e., smuggled out of Iran) over the next year or so. This was one reason our geopolitical strategists did not view Iran as sufficiently pressured to sign a deal. US shale-oil output will be increasing above the 0.9 mm b/d that we forecast last month for 2022, and the 0.5mm b/d we expect next year, given the sharp price rally prompted by the Russian invasion of Ukraine. Our Commodity & Energy Strategy service will be updating our estimate next week when we publish new supply-demand balances and price forecasts. Releases from the Strategic Petroleum Reserves of the US and OECD are available to tide the market over for brief periods due to Middle East shocks or sanctions on Russian oil. Releases from the Strategic Petroleum Reserves of the US and OECD are available to tide the market over for brief periods due to Middle East shocks or sanctions on Russian oil. Over time, a significant share of these displaced Russian barrels will find their way to China, and the volumes being displaced will be re-routed to other Asian and western buyers. Investment Takeaways One of our key geopolitical views for 2022 is that oil producers have enormous strategic leverage, specifically Russia and Iran. The Ukraine war and now the suspension of US-Iran détente bears out this view. It is highly destabilizing for global politics and economy. One of our five black swans for 2022 is that Israel could attack Iran – this is a black swan because it is highly unlikely on such a short time frame. However, if the US-Iran deal cannot be salvaged, then the clock is ticking to a time when Israel and/or the US will have to decide whether to prevent Iran from going nuclear or instead choose containment strategy as with North Korea. Yet the Iran dilemma is less stable than the Korean dilemma because the Israelis are committed to preventing weaponization. The Israelis will not act unilaterally until the last possible moment, when all other options to prevent weaponization are exhausted, as the operation would be extremely difficult and they need American military assistance. If diplomacy fails on Iran, the two options for the future are a major war or a nuclear arms race in the Middle East. The latter would involve an aggressive containment strategy. The global economy faces a major new risk to energy supply as a result of this material increase in Middle East tensions. A stagflationary outcome is much more likely. Europe’s energy security will be far more vulnerable now as it tries to diversify away from Russia but faces a more volatile Middle East (Chart 4). Undoubtedly Russia and Iran recognize their tremendous leverage. China, India, and other resource imports face a larger energy shock if the Gulf Arabs do not boost production promptly. They certainly face greater volatility. China’s policy support for the economy will remain lackluster in an environment in which inflation continues to threaten economic stability. China’s internal stability was already at risk and now it will have to scramble to secure energy supplies amid a global price shock and looming Middle Eastern instability. China has no choice but to accept Russia’s decision to cut ties with the West and lash itself to China as a strategic ally for the foreseeable future (Chart 5). Chart 4The EU’s Two-Pronged Energy Insecurity
US-Iran Talks Break Down
US-Iran Talks Break Down
Chart 5China's Energy Insecurity
China's Energy Insecurity
China's Energy Insecurity
Chart 6AGo Long US And Canada / Short Saudi And UAE
Go Long US And Canada / Short Saudi And UAE
Go Long US And Canada / Short Saudi And UAE
Chart 6BGo Long US And Canada / Short Saudi And UAE
Go Long US And Canada / Short Saudi And UAE
Go Long US And Canada / Short Saudi And UAE
Geopolitical Strategy recommends investors go long US equities relative to global equities on a strategic basis. We also recommend long US / short UAE equities and long Canadian / short Saudi equities (Charts 6A and 6B). Chart 7Worst Case Oil Risk In Historical Context
US-Iran Talks Break Down
US-Iran Talks Break Down
Unlike Ukraine, the onset of a new Middle East crisis may not come with “shock and awe.” Weeks or months may pass before Iran reaches nuclear breakout. But make no mistake, if diplomacy fails, Iran will ignite a nuclear race and activate its militant proxies, while its enemies will increase sabotage, rattle sabers, and review military options. The Iranians will not be afraid to threaten the Strait of Hormuz, their other nuclear option (Chart 7). A total blockage of Hormuz is not by any means imminent. But war becomes more likely if Iran achieves nuclear breakout and diplomacy continues to fail. Matt Gertken Chief Geopolitical Strategist mattg@bcaresearch.com Robert P. Ryan Chief Commodity & Energy Strategist rryan@bcaresearch.com Footnotes 1 See Ariel Eli Levite, “Can a Credible Nuclear Breakout Time With Iran Be Restored?” Carnegie Endowment for International Peace, June 24, 2021, carnegieendowment.org. See also Simon Henderson, “Iranian Nuclear Breakout: What It Is and How to Calculate It,” Washington Institute for Near East Policy, Policy Watch 3457, March 24, 2021, washingtoninstitute.org. Strategic Themes Open Tactical Positions (0-6 Months) Open Cyclical Recommendations (6-18 Months) Regional Geopolitical Risk Matrix
Executive Summary Tight Inventories Spike Metals
Commodities' Watershed Moment
Commodities' Watershed Moment
Russia's war against Ukraine is a watershed moment, which will realign production, distribution and consumption of commodities globally. The development of new sources of the critical metals desperately needed to build out renewable energy grids and the drive to secure access to oil, gas and coal will intensify along political lines. China, reinforced by Russia, will lead the East, while the US and its allies will lead the West, in a redux of the Cold War. Local politics will intrude on this process, as left-of-center governments in important commodity-producing states secure their electoral victories and claim greater shares of commodity revenues. The rebuilding of defense systems, particularly in Europe, will compete with the renewable-energy transition. This will stress already-tight metals markets, where low inventories will predispose markets to higher volatility a la this week's oil, natgas and nickel price spikes. This will retard economic growth. In the short term, CO2 emissions will surge. Longer term, the transition to net-zero carbon emissions by 2050 will be pushed back years, as states compete for access to commodities. East-West trade restrictions and hoarding of commodities secured via trade within these respective blocs, as is occurring presently, will increase. Bottom Line: Russia's war against Ukraine is a watershed moment. The development of new sources of the critical metals desperately needed to build out renewable energy grids, and the drive to secure access to oil, gas and coal will intensify. China, reinforced by Russia, will lead the East, while the US and its allies will lead the West, in a redux of the Cold War. Feature Russia's war with Ukraine provoked a watershed moment for Europe: Leaders suddenly realized they had to reverse decades of energy dependence on Russia, rebuild their militaries, and sustain a massive buildout of the continent's renewable-energy generation and grid. This occurred as inventories of the basic commodities required to achieve all of these objectives were stretched so tight that the mere threat of the cutoff of pipeline natural gas was enough to send benchmark EU natgas prices to a record $113/MMBtu, up nearly 80% from the previous day's close before it settled back to still-elevated levels (Chart 1). Oil inventories also were stretched extremely thin even before Russia launched its invasion of Ukraine 24 February (Chart 2). The situation is not improving, since, in the wake of the Ukraine war, numerous refiners and trading companies now are observing self-imposed sanctions against taking any Russian oil or refined products. It is worthwhile remembering this began before the US and UK announced they would ban all imports of Russian material this week.1 This will stretch supply chains by unknow durations – the movement of crude from Russia to a refiner could take months instead of weeks, until new trade patterns are established. Chart 1Little Flex In EU Gas Inventories
Commodities' Watershed Moment
Commodities' Watershed Moment
Chart 2Little Flex In EU Gas Inventories
Little Flex In EU Gas Inventories
Little Flex In EU Gas Inventories
Global economic and policy uncertainty is massively elevated, with percent changes in oil and gas prices swinging on a double-digit basis daily. This makes it extremely difficult to bid or offer oil cargoes in the physical market or make markets (i.e., bid or offer) in the futures markets, which has the effect of compounding uncertainty and volatility. Fundamentals – supply, demand and inventories – take a back seat to fear and uncertainty in such markets. This makes it virtually impossible to assign a probability to any price outcomes based on supply and demand – the true definition of uncertainty in the Frank Knight sense – and to make long-term capex decisions over the long term.2 We raised our 2022 and 2023 Brent forecasts on the back of the massive uncertainty in the markets to $90/bbl and $85/bbl, respectively, right after Russia's invasion of Ukraine. We assume 1Q22 Brent will average $100/bbl. We expect core OPEC 2.0 producers – Saudi Arabia, UAE and Kuwait – will increase production beginning in 2Q22; US shale-oil output will rise, and ~ 1.2mm b/d of Iranian production will return to market in 2H22. Among the risks to our forecasts are a failure by core OPEC 2.0 to lift output (we expect an announcement at the end of this month when the producer coalition meets); lower-than-expected US shale output, and a failure to resolve the Iran nuclear deal with the US. Our modeling indicated these outcomes could lift Brent to between $120/bbl and $140/bbl by 2023 (Chart 3). We will be updating our forecasts next week.3 Chart 3Brent Forwards Lift
Brent Forwards Lift
Brent Forwards Lift
EU's Watershed Metals Moment EU leadership is setting out to reverse decades of energy dependence on Russia, rebuild their militaries, and sustain a massive buildout of the continent's renewable-energy grid, all a result of the Ukraine war. This will require massive investment in metals mining and refining, along with steel-making capacity. Already, Germany is pledging to increase LNG import capacity and measures to reduce its dependence on Russian natural gas by 75% this year.4 The EU is looking to restore its natgas inventories to 90% of capacity before next winter, and has pledged to double down on renewables, in order to remove member-state dependence on Russian energy exports.5 These ambitious goals are up against the hard reality of scarce base metals supply globally. This will be exacerbated going forward by actions taken by and against Russia. The Russia-Ukraine crisis will destabilize metal markets, given supply uncertainty from Russia and its contribution to global supply. The commodities heavyweight constitutes 6%, 5% and 4% of global primary aluminum, refined nickel and copper production. Against the backdrop of very low global inventories in these metals (Chart 4), the prices of all three hit record highs over the last few days due to uncertain supply (Chart 5). LME nickel prices more than quadrupled on Tuesday as traders rushed to cover short positions and margin calls. Chart 4Low Inventories...
Low Inventories...
Low Inventories...
Chart 5...Lead To Price Volatility
...Lead To Price Volatility
...Lead To Price Volatility
Uncertainty has engulfed metal markets, with a Western ban on Russian metal imports still a possibility. Putin’s announcement regarding raw material export restrictions will further fuel supply uncertainty.6 As in the case of oil, private entities’ self-sanctioning, sanctions on the Russian financial system, and war-related supply chain disruptions are causing current Russian metal export disruptions.7 So far, Western sanctions on commodities have not directly interfered with metal flows from Russia. But markets are taking it day to day. Supply disruptions and sanctions force the formation of new trade patterns, as private entities aim to maximize arbitrage opportunities. For example, high European aluminum price spreads incentivized shipments from China, the world’s largest producer and consumer of refined aluminum. Normally, Europe relies on Russia for aluminum supplies. Rising European physical premiums for delivered metal, caused by Russian export disruptions, will see trading companies take advantage of arbitrage opportunities in other commodities as well. Europe's Risk Profile Rising Since the Ukraine war began, rising European physical premiums in commodities ranging from metals to natgas indicate the continent – more so than others – is particularly vulnerable to Russian export disruptions. Europe’s reliance on Russian energy and its supply disruptions will raise operating costs for smelters and refiners on the continent, threatening smelter shutdowns similar to those we saw this past winter. Markets were expecting power price relief over the warmer months and higher smelting activity. Elevated fuel and power prices, however, will constrain metals refining in Europe, and could shut or close even more smelters, keeping refined metals supply scarce and prices high. Rebuilding Europe's Defenses EU leaders are scheduled to take up a new energy and defense funding proposal today, which media reports are describing as "massive" (no detail provided ahead of the meeting, of course). This program reportedly will be akin to the EU's $2 trillion COVID-relief fund.8 The EU's fast response to defense shortfalls comes against the backdrop discussed above regarding super-tight metals markets, which now face a further complication of unpredictable local politics in metals-producing states. Some of these states have voted left-of-center governments into office, which now appear to be intent on nationalizing mining operations.9 Chile, e.g., accounts for ~ 30% of global copper ore output, and is in the process of re-writing its constitution, which will change tax and royalty law, and could pave the way for nationalization of copper and lithium mines. This political risk compounds any long-term planning operations by consumers like the EU and producers. Investment Implications Energy markets – broadly defined to include oil, gas and coal along with the base metals required for renewables and their supporting grids and electric vehicles – are being rocked by Russia's war with Ukraine. Base metals, in particular, will have to find price levels that destroy demand among competing uses, if the EU's dual-track plan to build out its renewables generation and restore a military capability is approved. A "massive" funding effort in Europe, coupled with equally massive efforts in the US and China – both intent on building out their renewable generation and grids, as well as expanding their defensive capabilities – will be extremely difficult to pull off. Critical base metals inventories remain low, and prices are high because demand exceeds supply for the foreseeable future (Chart 6). Chart 6Tight Inventories Spike Metals
Commodities' Watershed Moment
Commodities' Watershed Moment
The EU will join a world in which the other two great economic centers – the US and China – will engage in a geopolitical competition over access to and control of scarce base metals, oil, gas and coal resources. Russia will remain aggressive toward the West, at least until the Putin regime falls, and will play an ancillary role to China. Fossil fuels and base metals have been starved for capex for more than a decade. Governmental pronouncements will not reverse this. These markets will remain tight, and will get tighter in order to allocate increasingly scarce supply with rapidly growing demand. As such, we remain long commodity-index exposure (S&P GSCI and the COMT ETF), along with equity exposure to oil and gas producers via the XOP ETF, and the XME and PICK ETFs to retain exposure to base metals and bulks producers and traders. Robert P. Ryan Chief Commodity & Energy Strategist rryan@bcaresearch.com Ashwin Shyam Research Associate Commodity & Energy Strategy ashwin.shyam@bcaresearch.com Footnotes 1 Please see Russian tankers at sea despite ‘big unknown’ over who will buy oil, published by ft.com on March 7, 2022. 2 Please see Explained: Knightian uncertainty, published by mit.edu for discussion. 3 Please see Oil Risk Premium Abates, But Still Remains, which we published on February 25, 2022. 4 Please see Germany Revives LNG Import Plans to Cut Reliance on Russian Natural Gas in Marked Policy Shift, published by naturalgasintel.com on March 1, 2022. 5 Please see Climate change: EU unveils plan to end reliance on Russian gas, published by bbc.co.uk on March 8, 2022, and The EU plan to drastically ramp renewables to replace Russian gas, published by pv-magazine.com on March 9, 2022. 6 Please see Russia to Omit Raw Material Exports but Omits Details, published by Bloomberg on March 9, 2022. 7 Please see here for Which companies have stopped doing business with Russia? 8 Please see Ukraine: ECB governing council to meet as crisis intensifies, published on March 8, 2022 by greencentralbanking.com. 9 Please see Chile a step closer to nationalizing copper and lithium, published by mining.com on March 7, 2022, and Add Local Politics To Copper Supply Risks, which we published on November 25, 2021. Investment Views and Themes Recommendations Strategic Recommendations
Feature We are closing our overweight of the Energy sector, bringing the allocation back to neutral in the face of a great geopolitical uncertainty. We have outperformed the S&P 500 by 60% since we initiated the trade on the 22 of November 2021. The recent war in Ukraine has upended the energy market, lifting the geopolitical risk premium. With oil surging 45% since the beginning of the year, and 20% since the beginning of the war, the trade has turned into a geopolitical gamble, held hostage by the immediate actions of OPEC. The BCA Commodity & Energy strategy expects to see an increase in the oil supply by the US shale producers, Saudi Arabia, and Gulf states, which will bring Brent crude back to $85 by the second half of 2022. This is a consensus position in the market, which is reflected in the extremely backwardated energy futures curve. It is important to note, that while OPEC members can open the oil spigots immediately, it takes the US shale producers roughly six months to ramp up production. To do so, they need to increase their Capex. In our recent Special Report on the Energy sector, we posited that the industry is in the early innings of the new Capex cycle. To reflect this structural theme in our portfolio, we will remain overweight Energy Equipment & Services (E&S) sub-industry. Chart 1
CHART 1
CHART 1
Chart 2
CHART 2
CHART 2
Bottom Line: We close overweight in the Energy industry, bringing the weight back to the benchmark. We have locked in a 60% gain since the position’s inception. We remain overweight the Energy Equipment & Services industry, as a leveraged play on the energy Capex revival. We will revisit the sector once the fog of war dissipates.
Executive Summary On a tactical (3-month) horizon, the inflationary impulse from soaring energy and food prices combined with the choke on growth from sanctions will weigh on both the global economy and the global stock market. As such, bond yields could nudge higher, the global stock market has yet to reach its crisis bottom, and the US dollar will rally. But on a cyclical (12-month) horizon, the short-term inflationary impulse combined with sanctions will be massively demand-destructive, at which point the cavalry of lower bond yields will charge to the rescue. Therefore: Overweight the 30-year T-bond and the 30-year Chinese bond, both in absolute terms and relative to other 30-year sovereign bonds. Overweight equities. Overweight long-duration US equities versus short-duration non-US equities. Fractal trading watchlist: Brent crude oil, and oil equities versus banks equities. The DAX Has Sold Off ##br##Because It Expects Profits To Plunge…
The DAX Has Sold Off Because It Expects Profits To Plunge...
The DAX Has Sold Off Because It Expects Profits To Plunge...
…But The S&P 500 Has Sold Off ##br##Because The Long Bond Has Sold Off
...But The S&P 500 Has Sold Off Because The Long Bond Has Sold Off
...But The S&P 500 Has Sold Off Because The Long Bond Has Sold Off
Bottom Line: In the Ukraine crisis, the protection from lower bond yields and fiscal loosening will not come as quickly and as powerfully as it did during the pandemic. If anything, the fixation on inflation and sanctions may increase short-term pain for both the economy and the stock market, before the cavalry of lower bond yields ultimately charges to the rescue. Feature Given the onset of the largest military conflict in Europe since the Second World War, with the potential to escalate to nuclear conflict, you would have thought that the global stock market would have crashed. Yet since Russia’s full-scale invasion of Ukraine on February 24 to the time of writing, the world stock market is down a modest 4 percent, while the US stock market is barely down at all. Is this the stock market’s ‘Wile E Coyote’ moment, in which it pedals hopelessly in thin air before plunging down the chasm? Is this the stock market’s ‘Wile E Coyote’ moment, in which it pedals hopelessly in thin air before plunging down the chasm? Admittedly, since the invasion, European bourses have fallen – for example, Germany’s DAX by 10 percent. And stock markets were already falling before the invasion, meaning that this year the DAX is down 20 percent while the S&P 500 is down 12 percent. But there is a crucial difference. While the DAX year-to-date plunge is due to an expected full-blooded profits recession that the Ukraine crisis will unleash, the S&P 500 year-to-date decline is due to the sell-off in the long-duration bond (Chart I-1 and Chart I-2). This difference in drivers will also explain the fate of these markets as the crisis evolves, just as in the pandemic. Chart I-1The DAX Has Sold Off Because It Expects Profits To Plunge...
The DAX Has Sold Off Because It Expects Profits To Plunge...
The DAX Has Sold Off Because It Expects Profits To Plunge...
Chart I-2...But The S&P 500 Has Sold Off Because The Long Bond Has Sold Off
...But The S&P 500 Has Sold Off Because The Long Bond Has Sold Off
...But The S&P 500 Has Sold Off Because The Long Bond Has Sold Off
During The Pandemic, Central Banks And Governments Saved The Day… We can think of a stock market as a real-time calculator of the profits ‘run-rate.’ In this regard, the real-time stock market is several weeks ahead of analysts, whose profits estimates take time to collect, collate, and record. For example, during the pandemic, the stock market had already discounted a collapse in profits six weeks before analysts’ official estimates (Chart I-3 and Chart I-4). Chart I-3The German Stock Market Is Several Weeks Ahead Of Analysts
The German Stock Market Is Several Weeks Ahead Of Analysts
The German Stock Market Is Several Weeks Ahead Of Analysts
Chart I-4The US Stock Market Is Several Weeks Ahead ##br##Of Analysts
The US Stock Market Is Several Weeks Ahead Of Analysts
The US Stock Market Is Several Weeks Ahead Of Analysts
We can also think of a stock market as a bond with a variable rather than a fixed income. Just as with a bond, every stock market has a ‘duration’ which establishes which bond it most behaves like when bond yields change. It turns out that the long-duration US stock market has the same duration as a 30-year bond, while the shorter-duration German stock market has the same duration as a 7-year bond. Pulling this together, and assuming no change to the very long-term structural growth story, we can say that: The US stock market = US profits multiplied by the 30-year bond price (Chart I-5 and Chart I-6). The German stock market = German profits multiplied by the 7-year bond price (Chart I-7 and Chart I-8). Chart I-5US Profits Multiplied By The 30-Year Bond Price...
US Profits Multiplied By The 30-Year Bond Price...
US Profits Multiplied By The 30-Year Bond Price...
Chart I-6...Equals The US Stock Market
...Equals The US Stock Market
...Equals The US Stock Market
Chart I-7German Profits Multiplied By The 7-Year Bond Price...
German Profits Multiplied By The 7-Year Bond Price...
German Profits Multiplied By The 7-Year Bond Price...
Chart I-8...Equals The German Stock Market
...Equals The German Stock Market
...Equals The German Stock Market
When bond yields rise – as happened through December and January – the greater scope for a price decline in the long-duration 30-year bond will hurt the US stock market both absolutely and relatively. But when bond yields decline – as happened at the start of the pandemic – this same high leverage to the 30-year bond price can protect the US stock market. When bond yields decline, the high leverage to the 30-year bond price can protect the US stock market. During the pandemic, the 30-year T-bond price surged by 35 percent, which more than neutralised the decline in US profits. Supported by this surge in the 30-year bond price combined with massive fiscal stimulus that underpinned demand, the pandemic bear market lasted barely a month. What’s more, the US stock market was back at an all-time high just four months later, much quicker than the German stock market. …But This Time The Cavalry May Take Longer To Arrive Unfortunately, this time the rescue act may take longer. One important difference is that during the pandemic, governments quickly unleashed tax cuts and stimulus payments to shore up demand. Whereas now, they are unleashing sanctions on Russia. This will choke Russia, but will also choke demand in the sanctioning economy. Another crucial difference is that as the pandemic took hold in March 2020, the Federal Reserve slashed the Fed funds rate by 1.5 percent. But at its March 2022 meeting, the Fed will almost certainly raise the interest rate (Chart I-9). Chart I-9As The Pandemic Took Hold, The Fed Could Slash Rates. Not Now.
As The Pandemic Took Hold, The Fed Could Slash Rates. Not Now.
As The Pandemic Took Hold, The Fed Could Slash Rates. Not Now.
As the pandemic was unequivocally a deflationary shock at its outset, it was countered with a massive stimulatory response from both central banks and governments. In contrast, the Ukraine crisis has unleashed a new inflationary shock from soaring energy and food prices. And this on top of the pandemic’s second-round inflationary effects which have already dislocated inflation into uncomfortable territory. Our high conviction view is that this inflationary impulse combined with sanctions will be massively demand-destructive, and thereby ultimately morph into a deflationary shock. Yet the danger is that myopic policymakers and markets are not chess players who think several moves ahead. Instead, by fixating on the immediate inflationary impulse from soaring energy and food prices, they will make the wrong move. In the Ukraine crisis, the big risk is that the protection from lower bond yields and fiscal loosening will not come as quickly and as powerfully as it did during the pandemic. If anything, the fixation on inflation and sanctions may increase short-term pain for both the economy and the stock market. Compared with the pandemic, both the sell-off and the recovery will take longer to play out. In the Ukraine crisis, the big risk is that the protection from lower bond yields and fiscal loosening will not come as quickly and as powerfully as it did during the pandemic. One further thought. The Ukraine crisis has ‘cancelled’ Covid from the news and our fears, as if it were just a bad dream. Yet the virus has not disappeared and will continue to replicate and mutate freely. Probably even more so, now that we have dismissed it, and Europe’s largest refugee crisis in decades has given it a happy hunting ground. Hence, do not dismiss another wave of infections later this year. The Investment Conclusions Continuing our chess metaphor, a tactical investment should consider only the next one or two moves, a cyclical investment should be based on the next five moves, while a long-term structural investment (which we will not cover in this report) should visualise the board after twenty moves. All of which leads to several investment conclusions: On a tactical (3-month) horizon, the inflationary impulse from soaring energy and food prices combined with the choke on growth from sanctions will weigh on both the global economy and the global stock market. As such, bond yields could nudge higher, the global stock market has yet to reach its crisis bottom, and the US dollar will rally (Chart I-10). Chart I-10When Stock Markets Sell Off, The Dollar Rallies
When Stock Markets Sell Off, The Dollar Rallies
When Stock Markets Sell Off, The Dollar Rallies
But on a cyclical (12-month) horizon, the short-term inflationary impulse combined with sanctions will be massively demand-destructive, at which point the cavalry of lower bond yields will charge to the rescue. Therefore: Overweight the 30-year T-bond and the 30-year Chinese bond, both in absolute terms and relative to other 30-year sovereign bonds. Overweight equities. Overweight long-duration US equities versus short-duration non-US equities. How Can Fractal Analysis Help In A Crisis? When prices are being driven by fundamentals, events and catalysts, as they are now, how can fractal analysis help investors? The answer is that it can identify when a small event or catalyst can have a massive effect in reversing a trend. In this regard, the extreme rally in crude oil has reached fragility on both its 65-day and 130-day fractal structures. Meaning that any event or catalyst that reduces fears of a supply constraint will cause an outsized reversal (Chart I-11). Chart I-11The Extreme Rally In Crude Oil Is Fractally Fragile
The Extreme Rally In Crude Oil Is Fractally Fragile
The Extreme Rally In Crude Oil Is Fractally Fragile
Equally interesting, the huge outperformance of oil equities versus bank equities is reaching the point of fragility on its 260-day fractal structure that has reliably signalled major switching points between the sectors (Chart I-12). Given the fast-moving developments in the crisis, we are not initiating any new trades this week, but stay tuned. Chart I-12The Huge Outperformance Of Oil Equities Versus Banks Equities Is Approaching A Reversal
The Huge Outperformance Of Oil Equities Versus Banks Equities Is Approaching A Reversal
The Huge Outperformance Of Oil Equities Versus Banks Equities Is Approaching A Reversal
Fractal Trading Watchlist Biotech To Rebound
Biotech Is Starting To Reverse
Biotech Is Starting To Reverse
US Healthcare Vs. Software Approaching A Reversal
US Healthcare Vs. Software Approaching A Reversal
US Healthcare Vs. Software Approaching A Reversal
Norway's Outperformance Could End
Norway's Outperformance Could End
Norway's Outperformance Could End
Greece’s Brief Outperformance To End
Greece Is Snapping Back
Greece Is Snapping Back
Dhaval Joshi Chief Strategist dhaval@bcaresearch.com Fractal Trading System Fractal Trades
Are We In A Slow-Motion Crash?
Are We In A Slow-Motion Crash?
Are We In A Slow-Motion Crash?
Are We In A Slow-Motion Crash?
6-Month Recommendations Structural Recommendations Closed Fractal Trades Indicators To Watch - Bond Yields Chart II-1Indicators To Watch - Bond Yields ##br##- Euro Area
Indicators To Watch - Bond Yields - Euro Area
Indicators To Watch - Bond Yields - Euro Area
Chart II-2Indicators To Watch - Bond Yields ##br##- Europe Ex Euro Area
Indicators To Watch - Bond Yields - Europe Ex Euro Area
Indicators To Watch - Bond Yields - Europe Ex Euro Area
Chart II-3Indicators To Watch - Bond Yields ##br##- Asia
Indicators To Watch - Bond Yields - Asia
Indicators To Watch - Bond Yields - Asia
Chart II-4Indicators To Watch - Bond Yields ##br##- Other Developed
Indicators To Watch - Bond Yields - Other Developed
Indicators To Watch - Bond Yields - Other Developed
Indicators To Watch - Interest Rate Expectations Chart II-5Indicators To Watch - Interest Rate Expectations
Indicators To Watch - Interest Rate Expectations
Indicators To Watch - Interest Rate Expectations
Chart II-6Indicators To Watch - Interest Rate Expectations
Indicators To Watch - Interest Rate Expectations
Indicators To Watch - Interest Rate Expectations
Chart II-7Indicators To Watch - Interest Rate Expectations
Indicators To Watch - Interest Rate Expectations
Indicators To Watch - Interest Rate Expectations
Chart II-8Indicators To Watch - Interest Rate Expectations
Indicators To Watch - Interest Rate Expectations
Indicators To Watch - Interest Rate Expectations
Executive Summary US Equity Drawdowns During Geopolitical Crises/Commodity Shocks
US Equity Drawdowns During Geopolitical Crises/Commodity Shocks
US Equity Drawdowns During Geopolitical Crises/Commodity Shocks
The most recent examples of geopolitical and commodity price shocks similar the current one include the Cuban missile crisis in 1962, the oil embargo of 1973 in response to the Yom Kippur War as well as the Gulf War of 1990. The magnitude of the S&P 500 selloff was 28% in 1962, 23% in 1973 and 20% in 1990 (Chart of the week). Neither of our capitulation indicators for the S&P 500 or for EM stocks have reached their previous lows. As for commodity prices, the only thing that is certain in the next couple of months is that volatility will remain very elevated. Having incurred considerable costs, Russia will push to maximize its gains and secure a new, more favorable agreement with NATO. This will keep geopolitical tension elevated. Bottom Line: The drawdown in global and EM stocks in not over yet. The US dollar has more upside in the near term. This is consistent with the S&P500 outperforming and EM stocks underperforming. A rising US dollar bodes ill for EM fixed-income markets. Feature Chart 1US Equity Drawdowns During Geopolitical Crises/Commodity Shocks
US Equity Drawdowns During Geopolitical Crises/Commodity Shocks
US Equity Drawdowns During Geopolitical Crises/Commodity Shocks
The world is experiencing geopolitical and commodity price shocks that have not been seen in over a generation. The most recent examples of this kind of shock include the Cuban missile crisis in 1962, the oil embargo of 1973 in response to the Yom Kippur War as well as the Gulf War of 1990. Chart 1 illustrates the current trajectory of the S&P 500 with selloffs that occurred during those three episodes. The magnitude of the S&P 500 selloff was 28% in 1962, 23% in 1973 and 20% in 1990. The S&P 500 is down only 11% from its peak. Based on the above three profiles, the current selloff in US stocks has further to go. This also means that non-US equities, including EM, will continue to suffer. What are the conditions needed for global stocks to bottom? In our opinion, a durable bottom in share prices will occur when measures of capitulation in equity markets reach their previous lows, commodity prices (particularly crude prices) decline and geopolitical tensions peak. We elaborate on each below. Equity Capitulation Neither of our capitulation indicators for the S&P 500 or for EM stocks have reached their previous lows. Chart 2 displays our capitulation indicator for US equities. Its construction is based on four equal-weighted components: the composite momentum indicator, the US equity sentiment indicator, industry group breadth and the advance-decline line (shown individually in Chart 7-8 below). Chart 2US Stocks Have Not Reached Their Selling Climax
US Stocks Have Not Reached Their Selling Climax
US Stocks Have Not Reached Their Selling Climax
This indicator has not reached its lows of 2010, 2011, 2018 and 2020. In 2011 and 2018, the S&P500 selloffs were 19.5% and 19.8%, respectively. Hence, our best guess for the magnitude of an equity drawdown in this selloff is about 20%. This puts the potential S&P500 low at 3600-3700. The latter is consistent with the technical support (3-year moving average) that held up in 2011, 2016 and 2018 (Chart 2, top panel). Chart 3 illustrates our EM equity capitulation indicator. Its four equal-weighted components are the composite momentum indicator, EM equity sentiment, industry group breadth and net EPS revisions (shown individually in Chart 9-10 below). We believe that EM share prices will drop until this capitulation indicator comes to the levels reached in the 2011, 2013 and 2018 selloffs. Chart 3The EM Equity Capitulation Has Further To Run
The EM Equity Capitulation Has Further To Run
The EM Equity Capitulation Has Further To Run
Concerning the magnitude of further EM equity selloff, the next technical defense line for the MSCI EM stock index in USD is 10%, or in the worst-case scenario, 25% below current levels (Chart 3, top panel). The Commodity Shock Global share prices have become negatively correlated with commodity (primarily oil) prices and such an inverse relationship will likely persist for now. In fact, an important signal of the bottom in the S&P 500 during the 1990 oil spike was the peak in crude prices (the latter is shown inverted in Chart 4). In the case of the oil embargo of 1973-74, the oil market was not developed, and US share prices were negatively correlated with US 10-year Treasury yields (Chart 5). Chart 4The 1990 Oil Shock
The 1990 Oil Shock
The 1990 Oil Shock
Chart 5The 1973 Oil Shock
The 1973 Oil Shock
The 1973 Oil Shock
Presently, given that US stocks were reacting negatively to rising US bond yields prior to the Ukraine crisis, it is reasonable to expect American share prices to bottom only when two conditions are satisfied: (1) oil prices start falling on a sustainable basis and (2) US bond yields do not rise much. How much will oil and other commodity prices rise? It is hard to know because multiple forces are in play. First, Russia is the second largest commodity exporter in the world (after the US). Russia’s crude oil exports account for 8.4% of global crude consumption, natural gas exports for 5.9% of global consumption and 3.4% for coal (Table 1). Across metals, Russia is a large producer too – 35.6% for palladium, 4.4% for nickel and 4.2% for copper (Table 1). In turn, Russia and Ukraine production together accounts for 14% of global wheat consumption. Table 1Russia’s Global Share In Various Commodities
Equity Capitulation, A Commodity Shock And Geopolitics
Equity Capitulation, A Commodity Shock And Geopolitics
The West’s official sanctions affect Russian exports of certain commodities but there is also a reluctance on the part of private companies to buy or ship Russian exports. This latter factor makes it nearly impossible to gauge just how much supply of each individual commodity will be curtailed. Assuming in the near term that a considerable share of Russia’s commodity exports will be blocked from global markets, the largest impact will be on oil, palladium, copper, nickel and fertilizer. While ratcheting sales of resources to China is a saving grace for Russia, it might take some time until shipments can be rerouted and reorganized. Second, the US is pressuring allied nations in the Gulf as well as other countries like Venezuela to produce and bring more oil to the market. Finally, the surge in commodity prices is probably already destroying demand. Oil and wheat prices have risen to record highs in many EM currencies (Chart 36 and 37 below). This will push inflation higher and herald more rate hikes from central banks. High interest rates along with tight fiscal policy and eroding discretionary spending (due to high energy and food prices) entail weak demand in developing economies. Bottom Line: In the very short run, risks to many commodity prices are skewed to the upside due to supply constraints. Yet, enormous uncertainty over factors driving their demand and supply makes prices over the next three months impossible to forecast. During this period, individual commodity prices might be driven by idiosyncratic factors. The only thing that is certain in the next couple of months is that volatility in commodity prices will remain very elevated. Price surges might be followed by large drawdowns and vice versa. Geopolitical Tensions The Kremlin will continue its military assault until it establishes firm control over Kyiv and the Black Sea coast, including the city of Odessa. As we wrote in our March 2 report, Putin’s objective is to install a very loyal government in Kyiv and to control the territory east of the Dniepr river. It is not clear to us whether the Kremlin has the appetite to control the Ukraine territory west of the Dniepr river. Western Ukraine has always been very anti-Russian and Putin might realize that it will be too costly to capture and control it. We do not think Putin has ambitions to go beyond Ukraine (Moldova being an exception). That said, there is no doubt that the Kremlin will be presenting more demands to NATO and threatening if those demands are not met. Having incurred considerable costs, Russia will push to maximize its gains and secure a new, more favorable agreement with NATO. It is not clear how many geopolitical concessions or what security guarantees the US is willing to provide to Russia. On the whole, geopolitical tensions between Russia and NATO/the US will continue until there is a new deal between the parties. Investment Strategy Chart 6No Trend Change In EM And US Relative Equity Performance
No Trend Change In EM And US Relative Equity Performance
No Trend Change In EM And US Relative Equity Performance
The drawdown in global and EM stocks in not over yet. Within a global equity portfolio, we continue to recommend underweighting EM and Europe and overweighting the US. Interestingly, the EM relative equity performance versus the global stock index has rolled over at its 200-day moving average, while the US’s relative performance has found a support at its 200-day moving average (Chart 6). Such a technical configuration suggests that EM stocks will continue underperforming for now while US equities will have another upleg in relative terms. The US dollar has more upside in the near term. This is consistent with the S&P500 outperforming and EM stocks underperforming. A rising US dollar bodes ill for EM fixed-income markets. Arthur Budaghyan Chief Emerging Markets Strategist arthurb@bcaresearch.com Components Of Our US Equity Capitulation Indicator Not all components of our US Equity Capitulation Indicator have reached their previous lows. Given the backdrop of still expensive US equity valuations, heightened geopolitical risks, very elevated inflation and high inflation expectations as well as the little maneuvering room that the Fed has, odds are that US share prices will drop further. Chart 7Components Of Our US Equity Capitulation Indicator
Components Of Our US Equity Capitulation Indicator
Components Of Our US Equity Capitulation Indicator
Chart 8Components Of Our US Equity Capitulation Indicator
Components Of Our US Equity Capitulation Indicator
Components Of Our US Equity Capitulation Indicator
Components Of Our EM Equity Capitulation Indicator Not all components of our EM Equity Capitulation Indicator have reached their previous lows either. The share of industry groups above their 200-day moving average, analysts’ net EPS revisions as well as the momentum and equity sentiment indicators remain above their lows. Further downside in EM share prices is likely. Chart 9Components Of Our EM Equity Capitulation Indicator
Components Of Our EM Equity Capitulation Indicator
Components Of Our EM Equity Capitulation Indicator
Chart 10Components Of Our EM Equity Capitulation Indicator
Components Of Our EM Equity Capitulation Indicator
Components Of Our EM Equity Capitulation Indicator
US Stocks Have Not Yet Reached Their Selling Climax The NYSE’s advance/decline line has broken down and is dropping, signifying a broadening equity rout. Yet, we doubt the US equity indexes will bottom when 35% of NYSE listed stocks are above their 200-day moving average. Finally, the US median stock has broken below its 200-day moving average. Given the fundamental backdrop, all of these technical signposts point to a larger than 10% correction in the S&P 500. Chart 11US Stocks Have Not Yet Reached Their Selling Climax
US Stocks Have Not Yet Reached Their Selling Climax
US Stocks Have Not Yet Reached Their Selling Climax
Chart 12US Stocks Have Not Yet Reached Their Selling Climax
US Stocks Have Not Yet Reached Their Selling Climax
US Stocks Have Not Yet Reached Their Selling Climax
Chart 13US Stocks Have Not Yet Reached Their Selling Climax
US Stocks Have Not Yet Reached Their Selling Climax
US Stocks Have Not Yet Reached Their Selling Climax
Chart 14US Stocks Have Not Yet Reached Their Selling Climax
US Stocks Have Not Yet Reached Their Selling Climax
US Stocks Have Not Yet Reached Their Selling Climax
Global Overall And Global ex-US Equities Although Global ex-US stocks are much more oversold than US stocks, their growth and profit backdrops are worse. As we argued in the front section of this report (Chart 6 above), odds are that US stocks will continue outperforming non-US stocks in the near term. Despite crashing, European stocks might not have found a support yet. Chart 15Global Overall And Global ex-US Equities
Global Overall And Global ex-US Equities
Global Overall And Global ex-US Equities
Chart 16Global Overall And Global ex-US Equities
Global Overall And Global ex-US Equities
Global Overall And Global ex-US Equities
Chart 17Global Overall And Global ex-US Equities
Global Overall And Global ex-US Equities
Global Overall And Global ex-US Equities
Chart 18Global Overall And Global ex-US Equities
Global Overall And Global ex-US Equities
Global Overall And Global ex-US Equities
European Stocks: Is A Support At Hand? Investor sentiment on European stocks has become depressed. Yet, European economies will decelerate due to the energy shock (natural gas prices have shot up two-fold since October 1) as well as falling consumer and business confidence. A bottom for euro area stocks might be lower than current prices. Chart 19European Stocks: Is A Support At Hand?
European Stocks: Is A Support At Hand?
European Stocks: Is A Support At Hand?
Chart 20European Stocks: Is A Support At Hand?
European Stocks: Is A Support At Hand?
European Stocks: Is A Support At Hand?
Chart 21European Stocks: Is A Support At Hand?
European Stocks: Is A Support At Hand?
European Stocks: Is A Support At Hand?
EM Equities: Cheap But Mind The Profit Outlook According to our cyclically adjusted P/E ratio, EM stocks are slightly cheap in absolute terms and are very attractive versus US equities. However, this valuation indicator should be used by long-term investors. In the short run and even from a cyclical perspective, this valuation indicator is not very useful. Besides, investor sentiment on EM equities was neutral in the middle of February. It might take more weakness before bad news get priced in EM share prices. Chart 22EM Equities: Cheap But Mind The Profit Outlook
EM Equities: Cheap But Mind The Profit Outlook
EM Equities: Cheap But Mind The Profit Outlook
Chart 23EM Equities: Cheap But Mind The Profit Outlook
EM Equities: Cheap But Mind The Profit Outlook
EM Equities: Cheap But Mind The Profit Outlook
Chart 24EM Equities: Cheap But Mind The Profit Outlook
EM Equities: Cheap But Mind The Profit Outlook
EM Equities: Cheap But Mind The Profit Outlook
EM Profits In A Soft Spot As projected by our EM narrow money (M1) aggregate, EM corporate earnings will continue to disappoint. This is the key risk to EM share prices. In fact, EM EPS has been broadly flat over the past 15 years. That is why EM stocks appear cheap. Plus, EM ex-TMT stocks have not yet fallen much and downside risks remain. Chart 25EM Profits In A Soft Spot
EM Profits In A Soft Spot
EM Profits In A Soft Spot
Chart 26EM Profits In A Soft Spot
EM Profits In A Soft Spot
EM Profits In A Soft Spot
Chart 27EM Profits In A Soft Spot
EM Profits In A Soft Spot
EM Profits In A Soft Spot
Chinese Investable Stocks Are At Their March 2020 Lows Offshore and onshore Chinese shares prices have been falling hard. Not only have Chinese corporate profit expectations been downshifting but also Chinese Investable stocks have been derating (their multiples have been compressing). This has been due to foreign investors projecting/extrapolating the US-Russia confrontation to a possible future US-China geopolitical standoff, and therefore possible sanctions the West can impose on China. Chart 28Chinese Investable Stocks Are At Their March 2020 Lows
Chinese Investable Stocks Are At Their March 2020 Lows
Chinese Investable Stocks Are At Their March 2020 Lows
Chart 29Chinese Investable Stocks Are At Their March 2020 Lows
Chinese Investable Stocks Are At Their March 2020 Lows
Chinese Investable Stocks Are At Their March 2020 Lows
Chart 30Chinese Investable Stocks Are At Their March 2020 Lows
Chinese Investable Stocks Are At Their March 2020 Lows
Chinese Investable Stocks Are At Their March 2020 Lows
Chart 31Chinese Investable Stocks Are At Their March 2020 Lows
Chinese Investable Stocks Are At Their March 2020 Lows
Chinese Investable Stocks Are At Their March 2020 Lows
China: No "All-In" Stimulus Yet The improvement in China’s total social financing has been entirely due to local government bond issuance. Corporate and household credit have not improved at all. Consistently, traditional infrastructure investment has probably bottomed. Yet, outside this sector the outlook is uninspiring. Property construction remains at risk, consumer spending is very sluggish and private business sentiment is downbeat. Chart 32China: No "All-In" Stimulus Yet
China: No "All-In" Stimulus Yet
China: No "All-In" Stimulus Yet
Chart 33China: No "All-In" Stimulus Yet
China: No "All-In" Stimulus Yet
China: No "All-In" Stimulus Yet
Chart 34China: No "All-In" Stimulus Yet
China: No "All-In" Stimulus Yet
China: No "All-In" Stimulus Yet
Chart 35China: No "All-In" Stimulus Yet
China: No "All-In" Stimulus Yet
China: No "All-In" Stimulus Yet
EM Woes: Energy And Food Prices Many low-income developing countries will be suffering from elevated food and energy prices. Oil and wheat prices in EM currencies have surged to all-time highs. This will lift headline inflation in many emerging economies, lead to monetary tightening and reduce household income available for discretionary spending. All of these and the lack of fiscal easing in many developing countries entail growth disappointments this year. Chart 36EM Woes: Energy And Food Prices
EM Woes: Energy And Food Prices
EM Woes: Energy And Food Prices
Chart 37EM Woes: Energy And Food Prices
EM Woes: Energy And Food Prices
EM Woes: Energy And Food Prices
Chart 38EM Woes: Energy And Food Prices
EM Woes: Energy And Food Prices
EM Woes: Energy And Food Prices
Chart 39EM Woes: Energy And Food Prices
EM Woes: Energy And Food Prices
EM Woes: Energy And Food Prices
EM Credit Spreads Are Widening Rapidly EM sovereign and corporate spreads have broken out. Such spread widening is not simply due to Russian credit. The pace of spread widening differs among countries. However, directionally, credit spreads seem to have embarked on a widening path. In a nutshell, Chinese USD corporate in general and property bond prices in particular are tanking (see below). This foreshadows the poor outlook for Chinese housing. Chart 40EM Credit Spreads Are Widening Rapidly
EM Credit Spreads Are Widening Rapidly
EM Credit Spreads Are Widening Rapidly
Chart 41EM Credit Spreads Are Widening Rapidly
EM Credit Spreads Are Widening Rapidly
EM Credit Spreads Are Widening Rapidly
Chart 42EM Credit Spreads Are Widening Rapidly
EM Credit Spreads Are Widening Rapidly
EM Credit Spreads Are Widening Rapidly
Chart 43EM Credit Spreads Are Widening Rapidly
EM Credit Spreads Are Widening Rapidly
EM Credit Spreads Are Widening Rapidly
EM Credit Markets And EM Equities Historically, rising EM corporate USD bond yields led to a selloff in EM share prices. This is the cost of capital that matters for EM equities. Unless EM sovereign and corporate bonds yields start falling on a sustainable basis, EM equities will continue to struggle. Chart 44EM Credit Markets And EM Equities
EM Credit Markets And EM Equities
EM Credit Markets And EM Equities
Chart 45EM Credit Markets And EM Equities
EM Credit Markets And EM Equities
EM Credit Markets And EM Equities
Chart 46EM Credit Markets And EM Equities
EM Credit Markets And EM Equities
EM Credit Markets And EM Equities
Global Resource Stocks The relative performance of global energy and basic materials versus the global equity index has bottomed. In the medium term, odds are that TMT stocks will underperform while resource companies outperform. Yet, the outlook for energy stocks and basic materials in absolute terms is complicated (in line with the elevated volatility in commodity prices we discussed in the front section). Notably, even though commodity prices have skyrocketed, basic materials and energy share prices have not yet broken out. It seems the market is doubting the sustainability of high commodity prices. Chart 47Global Resource Stocks
Global Resource Stocks
Global Resource Stocks
Equity Capitulation, A Commodity Shock And Geopolitics
Equity Capitulation, A Commodity Shock And Geopolitics
Equity Capitulation, A Commodity Shock And Geopolitics
Equity Capitulation, A Commodity Shock And Geopolitics
Footnotes