Commodities & Energy Sector

Executive Summary Earnings Growth Outpacing Multiple Expansion
Energy: After Seven Lean Years (Part II)
Energy: After Seven Lean Years (Part II)
The US Energy sector is in a good place right now: Rising demand and faltering supply from OPEC 2.0 translate into a price of oil anchored at around $80 to $85/bbl. This price is twice the breakeven production cost for the majority of US producers. High prices have also created an opening for US Energy producers to restart Capex to increase production. Further, the Energy sector tends to outperform in an environment of high inflation and rising rates. As a real asset, oil is also a good inflation hedge, a quality that extends to Energy-related equities. The favorable macro backdrop is also complimented by bombed-out valuation. Meanwhile, technicals are overbought signaling that a near-term pause is needed for prices to reset. Bottom Line: We reiterate our cyclical overweight in the Energy sector, despite the rising probability or a near-term pullback. Within Energy, we recommend a cyclical overweight of the upstream and equipment & services segments, underweight midstream, and equal weight downstream and integrated stocks. Feature Dear client, In lieu of the February 28th publication, we will be sending you a Special Report on Wednesday, February 23rd written by our US Political Strategy service colleagues. Our regular weekly publication will resume Monday, March 7th. Kind Regards, Irene Tunkel Chief Strategist, US Equity Strategy Part I Recap Last week, in Part I of this Special Report, we described the structure of the Energy sector, its value chain, key industry drivers, and supply/demand/oil price dynamics. The Energy value chain consists of four distinct segments, with each segment corresponding to a section of the oil production value chain. The GICS classifies them as Oil & Gas Exploration and Production (Upstream or E&P), Oil & Gas Equipment and Services (E&S), Storage and Transportation (Midstream or S&T), and Refining and Marketing (Downstream or R&M). Integrated Oil & Gas straddles the entire supply chain (Integrated). Demand exceeds supply: We concluded that crude oil demand is expected to return to trend, driven by strong economic growth and the receding pandemic. In the meantime, production remains suppressed because of curtailments by OPEC 2.0 members, investment restraint from US producers, and multiple supply disruptions. Sizzling tensions with Iran, Russia, and a possible new market share war with the Saudis exacerbate supply problems and lead to heightened volatility in crude oil prices. The US Energy producers are ramping up supply: To meet the increasing oil demand, US shale oil producers are now perfectly positioned to pick up the slack in supply. To ramp up production, the US oil companies will have to invest in new and existing wells, starting a new Capex cycle, after “seven lean years” of Capex (Chart 1). There are early signs that the US Energy sector is in the early innings of new Capex and production. This week, we rely on our investment process, i.e., analysis of the macroeconomic backdrop, fundamentals, valuations, and technicals to shape our view on each segment of the Energy value chain. We are currently overweight the Energy sector and are ahead of the benchmark by 35%. Chart 1The Energy Industry Is In The Early Innings Of New Capex Cycle
The Energy Industry Is In The Early Innings Of New Capex Cycle
The Energy Industry Is In The Early Innings Of New Capex Cycle
Macroeconomic Backdrop Can Withstand Rising Rates And High Inflation The Energy sector tends to outperform in the environment of high inflation and rising rates (Chart 2). As a real asset, oil is also a good inflation hedge, a quality that extends to Energy-related equities. Appreciating Dollar Is A Temporary Phenomenon There is a tight inverse relationship between the USD and energy prices due to the simple fact that commodity prices are quoted in dollars. Over the past seven years, the nominal WTI oil price has been over 70% inversely correlated with the strength of the USD trade-weighted index (TWI), with a beta of oil to USD of -1.6. That is, a 1% change in the TWI would be expected to translate into a $1.60/barrel change in the price of WTI (Chart 3). Chart 2The Energy Sector Is Resilient To Rising Rates
Energy: After Seven Lean Years (Part II)
Energy: After Seven Lean Years (Part II)
Chart 3Price Of Oil And USD Are Inversely Correlated
Price Of Oil And USD Are Inversely Correlated
Price Of Oil And USD Are Inversely Correlated
According to the BCA Research FX Strategy team, the recent dollar strengthening is a temporary phenomenon, catalyzed by the rising interest-rate differential with the rest of the world. However, historically, equity portfolio flows have been more important than other factors in explaining dollar moves. Rising rates undermine the performance of US equities and are likely to lead to a reversal in cross-border equity flows, damaging the key pillar of support for the dollar. Hence, risks to the dollar are on the downside. Fundamentals And Valuations The Energy Sector Is Enjoying Strong Sales EIA reports that “global oil consumption outpaced oil production for the six consecutive quarters, ending with the fourth quarter of 2021 (4Q21), which has led to persistent withdrawals from global oil inventories and significant increases in crude oil prices”.1 As a result of higher production, and WTI prices increasing from $52 to $85 over 2021, energy company sales have soared (Chart 4). Looking ahead, we expect sales growth to remain robust, albeit lower than in 2021: Not only are comparables more challenging, but economic growth is also decelerating. What can bring the strong sales growth to a halt? The answer is that it may be either higher prices or higher volumes: Surging prices destroy demand while surging volumes suppress oil prices, which, eventually, weigh on Capex and production. At the moment, both production levels and price are in a sweet spot: All segments of the value chain are benefiting from high but not excessive prices and volumes. Chart 4Energy Sales Surged In 2021
Energy Sales Surged In 2021
Energy Sales Surged In 2021
Chart 5Sector Profitability Is Tied To The Price Of Oil
Sector Profitability Is Tied To The Price Of Oil
Sector Profitability Is Tied To The Price Of Oil
Profit Recovery Continues The overall profitability of the Energy sector is also tightly linked to the price of oil (Chart 5). The BCA Research house view is WTI centered around $80-85, with substantial volatility triggered by geopolitical tensions. With oil prices likely peaking, barring any negative geopolitical developments, earnings growth normalization off the high levels is expected (Chart 6). However, even if they are slowing, Energy sector earnings are expected to grow by 26% over the next 12 months, exceeding S&P 500 earnings by 17%. Further, over the next five years, energy earnings growth is expected to re-accelerate towards the 26% range. Chart 6Energy Sector's Earnings Growth To Exceed The Market's
Energy Sector's Earnings Growth To Exceed The Market's
Energy Sector's Earnings Growth To Exceed The Market's
Chart 7Margins To Continue To Expand
Margins To Continue To Expand
Margins To Continue To Expand
Importantly, sector operating margins are expected to expand towards 10% (Chart 7), which is quite a feat considering the broad-based margin contraction of the other S&P 500 sectors and industries. Our verdict? Earnings growth expectations look darn good! Despite Recent Outperformance, Valuations Are Still Attractive The BCA valuation indicator, which is a composite of P/B, P/S, and DY relative to the S&P 500, standardized relative to its own history, shows that the sector is still undervalued (Chart 8), despite a recent run of performance – earnings growth still outpaces multiple expansion (Chart 9). The energy sector is currently trading with a nearly 40% discount to the S&P 500 (Table 1) on a forward earnings basis (12.4x vs 20.3x). Chart 8Still Undervalued…
Still Undervalued…
Still Undervalued…
Chart 9Earnings Growth Outpacing Multiple Expansion
Energy: After Seven Lean Years (Part II)
Energy: After Seven Lean Years (Part II)
Table 1Valuation Summary
Energy: After Seven Lean Years (Part II)
Energy: After Seven Lean Years (Part II)
Cheap But Overbought! Curiously, despite modest valuations, from a technical standpoint the sector appears overbought (Chart 10). Worse yet, our Energy Sentiment Composite is outright in the bullish zone (Chart 11) with a reading last achieved in 2009. This is certainly concerning, as euphoria is inevitably followed by panic and disappointment. However, we need to keep in mind that the technical indicators are short term in scope by design, and their main use is to help refine the position entry and exit timing. Chart 10...But Overbought!
...But Overbought!
...But Overbought!
Chart 11Sentiment Is Extended
Sentiment Is Extended
Sentiment Is Extended
Why such a pronounced dichotomy with valuations? Technical indicators are based on returns, which have been rather outstanding for the sector, while valuations take into account earnings growth, which explains and justifies the surging returns. Too Much Cash Our analysis would be amiss if we did not bring energy companies’ free cash flow (FCF) into the discussion. With a curtailed supply of energy and rising prices, these companies have been awash in cash (Chart 12) – their FCF has increased by nearly 80% year over year, and profits have surged. What will companies do with this windfall? Well, first and foremost, during the seven lean years of extreme Capex discipline, these companies have gotten their commitment to returning cash to shareholders embedded in the corporate psyche, which is something that is unlikely to change fast. Energy continues to be the highest-yielding sector in the S&P 500 (Chart 13). However, having learned the lesson the hard way, many companies are adopting variable dividends to avoid potential disappointment if the oil price collapses. In addition to disbursing cash, the energy companies are paying off debt and are investing in expanding production. Chart 12Windfall Of Cash
Windfall Of Cash
Windfall Of Cash
Chart 13Energy Is The Highest Yielding Sector
Energy: After Seven Lean Years (Part II)
Energy: After Seven Lean Years (Part II)
Investment Outlook By Segments Of The Energy Value Chain The macroeconomic backdrop for Energy appears benign, with rates rising, inflation elevated, and the dollar likely contained. The sector also appears attractive from both a profitability and a valuation standpoint. However, a near-term pullback is likely as the sentiment around the sector is overly bullish – but that is likely to be short-lived. While we like the sector overall, we aim to provide granular industry group recommendations. To do so, we will zoom in on each segment of the value chain. Oil And Gas Exploration & Production (Upstream) Strong demand recovery and OPEC 2.0 oil production shortages bode well for the US E&P companies, which are cautiously starting to restart capital investment and ramp up production. We expect the E&P, especially shale oil production, companies to be one of the best performing energy subsectors, with WTI anchored around a consensus of $80-85/bbl. The upstream segment is highly dependent on the price of oil, which is currently in a sweet spot: High but not high enough to cause demand destruction (Chart 14). With oil prices peaking, E&P sales growth is decelerating (Chart 15). However, upstream also benefits from the sustainable cost reductions achieved through improved experience in well siting, drilling, and completion techniques. Chart 14Upstream Earnings Depend On The Price Oil
Upstream Earnings Depend On The Price Oil
Upstream Earnings Depend On The Price Oil
Chart 15Sales Growth Is Normalizing
Sales Growth Is Normalizing
Sales Growth Is Normalizing
As a result of growing, albeit decelerating, sales and effective cost management, E&P is one of the most profitable segments of the energy complex: Operating margins are currently at 22% and are expected to expand to 27% (Chart 16). From a valuation standpoint, the industry is trading at 10 times forward earnings, which represents an 50% discount to the S&P 500. The BCA valuation indicator for the industry group is also in the undervalued territory (Chart 17). Chart 16Margins To Continue To Expand
Margins To Continue To Expand
Margins To Continue To Expand
Chart 17E&P Is Still Cheap
E&P Is Still Cheap
E&P Is Still Cheap
Overweight Oil and Gas Exploration & Production industry Equipment And Services Is A High Octane Play On The New Capex Cycle Upstream Capex is revenue for E&S companies. After “seven lean years” of the Capex cycle, the fortunes of E&S companies are finally turning, with a rising price of oil finally enticing upstream companies to expand production by reopening existing and drilling new wells (Chart 18). According to CFRA, upstream Capex is expected to increase by 25% in 2022, and 7% in 2023. With the new energy Capex cycle in sight, Oil Services is the only energy segment for which sales growth is expected to accelerate over the coming year (Chart 19). In fact, sales will continue to grow at a healthy clip until the cycle matures – a time period measured in years. Chart 18Capex Has Restarted
Capex Has Restarted
Capex Has Restarted
Chart 19Sales Growth Is Rebounding Sharply
Sales Growth Is Rebounding Sharply
Sales Growth Is Rebounding Sharply
The profitability of the sector is also normalizing after a pandemic slump, and margins are expected to stay flat (Chart 20) despite industry labor costs rising sharply to 8% year over year (Chart 21). Earnings are expected to rise by a third in 2022, albeit off very low levels. Chart 20Profit Margins Will Stabilize
Profit Margins Will Stabilize
Profit Margins Will Stabilize
Chart 21Rising Wages Are Cutting Into Profitability
Rising Wages Are Cutting Into Profitability
Rising Wages Are Cutting Into Profitability
In terms of valuations, the E&S industry is one of the cheapest in the sector, with the BCA Valuations Indicator standing at -1.5 standard deviations below a long-term average. We are positive on the Energy Equipment and Services space, which we consider a high octane play on the upcoming production increases and the new energy cycle. Overweight Energy Equipment and Services Storage And Transportation Will Benefit From Rising Production Volumes The midstream segment is one of the most profitable in the energy supply chain. This industry has high fixed costs, and its profitability is a function of production volume, not oil price. (Chart 22). From that standpoint, the industry is in a good place: US production volume, especially of shale oil, is poised to increase, filling the pipelines and driving sales growth. However, there are also challenges: Pipelines installed in older shales start to see original contractual commitments expiring, resulting in lower cash flows as the pipelines try to re-commit suppliers within a market that has an abundance of pipeline capacity. On the cost side, the S&T segment is seeing an increase in labor costs, with average hourly earnings (AHE) rising close to 10%. Chart 22Production Volume Is A Driver Of Midstream Segment's Profitability
Production Volume Is A Driver Of Midstream Segment's Profitability
Production Volume Is A Driver Of Midstream Segment's Profitability
With challenges on the sales side and rising costs, it is not surprising that the market expects earnings in the S&T industry to stay flat over the next year or so (Chart 23). Operating profit margins will contract over the next year from the 19% the industry is enjoying now to roughly 14% (Chart 24). Chart 23Midstream Earnings Are To Stay Flat
Midstream Earnings Are To Stay Flat
Midstream Earnings Are To Stay Flat
Chart 24Industry Is Highly Profitable But Margins Are Contracting
Industry Is Highly Profitable But Margins Are Contracting
Industry Is Highly Profitable But Margins Are Contracting
In addition, it is important to note that pipelines run through public land. The recent tightening of EPA regulations and an administration hostile to fossil fuel may halt or slow down pipeline build-out. This may be a short-term negative as some companies may have to forego some of their investments. Over the long run, this may limit pipeline availability and lead to higher energy transportation and storage costs. Underweight Energy Storage and Transportation Industry Energy Refining And Marketing– Favorable Backdrop But No Oomph Similar to the midstream segment, refiners are a high fixed cost operation, and their business is only loosely dependent on the price of oil. Profitability of downstream companies is a function of capacity utilization of the refining facilities, and the crack spread or price differential between the price of crude and refined oil. Thanks to rising demand for oil, and rising volumes, capacity utilization stands at nearly 90% and is approaching pre-pandemic levels (Chart 25, bottom panel). Crack spreads are also high in absolute terms thanks to low inventories (Chart 25, top panel). Chart 25High Capacity Utilization and Wide Crack Spreads Are A Boon For Downstream…
High Capacity Utilization and Wide Crack Spreads Are A Boon For Downstream…
High Capacity Utilization and Wide Crack Spreads Are A Boon For Downstream…
Chart 26...But Razor-Thin Margins Make The Industry Vulnerable
...But Razor-Thin Margins Make The Industry Vulnerable
...But Razor-Thin Margins Make The Industry Vulnerable
With the upstream segment ramping up production, refining volumes should increase, further improving capacity utilization. And while margins are razor-thin, they are projected to increase over the next year (Chart 26). The key concern about the industry is that, with margins this narrow, there is little or no buffer to absorb changes in crack spreads or capacity utilization should oil prices rise or volumes decline. And yet, downstream, while cheap, is more expensive than Oil Services, midstream, or Integrated Oil. Equal-weight Energy Refining and Marketing industry Integrated Oil & Gas Is A Safe Bet Integrated Oil is an industry that is diversified across all the segments of the value chain. The characteristics that allowed Integrated Companies to maintain their stock prices better during the downturn – less financial leverage, less reinvestment volatility, stronger dividend support, and counter-cyclical improvement of downstream operations – will work against these stocks during an oil price recovery. As such, while Integrated stocks should benefit from higher prices and production volumes, this is a lower beta proposition: It is better to own Integrated Oil on the way down, but riskier and higher beta E&P or Oil Services stocks during the up leg of the energy cycle. Equal-Weight Integrated Oil & Gas Investment Implications The US Energy sector is in a good place right now: Rising demand and faltering supply from OPEC 2.0, translates into a price of oil anchored around $80 to $85/bbl. This price is twice the breakeven production cost for the majority of the US producers. Rising oil prices had resulted in windfall profits and surging free cash flow, which the Energy companies are dutifully returning to shareholders. High prices have also created an opening for US Energy producers to restart their Capex to increase production. This positive stance of upstream companies is benefiting the entire supply chain. Energy Equipment and Services providers are enjoying accelerated sales growth as E&P increases Capex. Transportation and storage companies are benefiting from higher volumes. And last, the downstream segment benefits from high-capacity utilization of its refineries and wide crack spreads thanks to low refined oil inventories. We are cyclically positive on the Energy sector, the fundamentals of which are solid, and for which valuations are modest. However, overextended technicals indicate that a near-term correction after a strong run is highly likely. We won’t sell to avoid the pullback but will use it as an opportunity to add to the existing positions. Within the Energy Sector, we are constructive on the upstream and E&S segments, both of which benefit from the high price of oil. We are less keen on the midstream segment, which, despite the benefits of increased production volume, is handicapped by rising labor costs, and expiring transportation contracts. And lastly, we are equal-weight the downstream segment, which, despite rising volumes and wide crack spreads, has razor-thin margins. Integrated Oil is the most diversified segment, which is more resilient during the down leg of the energy cycle, but too tame during the upcycle. Bottom Line We recommend a cyclical overweight to the Energy sector as it is in the early innings of the new energy cycle, thanks to surging demand and constrained production capacity out of the US. It is also the highest yielding sector in the S&P 500. However, a near-term pullback after a strong run is likely – we will leverage it to add to our existing overweight. We also recommend a cyclical overweight of the upstream and Oil Equipment & Services segment, underweight midstream, and equal weight downstream. Irene Tunkel Chief Strategist, US Equity Strategy irene.tunkel@bcaresearch.com Footnotes 1 https://www.eia.gov/outlooks/steo/ Recommended Allocation
Executive Summary A Swedish Warning
A Swedish Warning
A Swedish Warning
Stocks are oversold but downside risks persist. The Fed is on the verge of beginning a tightening cycle, which creates a process often linked to deeper and longer equity corrections around the world. Global economic activity is decelerating, as growth transitions away from splurging on consumer goods to a return to trend in the service sector. Equities are more levered to industrial than services activity, which creates a risk window. Ukraine remains another near-term hurdle. Equity risk premia are not elevated enough to compensate for these threats. Despite near-term risks, the equity bull market will recover and Europe stocks will ultimately outperform. Bottom Line: Investors need to continue to hold portfolio hedges as the near-term outlook remains treacherous for equities. Nonetheless, a wholesale portfolio liquidation is unwarranted as we face a mid-cycle slowdown, not a recession. Feature Last week’s pattern of relaxation and renewed tensions in Ukraine is an acute reminder that markets remain fragile in the near-term. Investors must still contend with an imminent monetary tightening cycle in the US. Additionally, a few cracks are emerging on the global growth picture as a transition from spending on goods to services takes place. Under this light, we worry that risk premia remain too low, and that equities are still vulnerable to further near-term pullbacks. The situation is particularly complex for Europe, which is most exposed to the Ukrainian problems and to the global manufacturing cycle. We thus continue to recommend investors exposed to Europe hold protections. Oversold Enough? Many commentators argue that following the January equity sell-off, the mood of investors soured enough to warrant buying equities anew and closing our eyes. Most famously, the AAII Bull/Bear ratio is once again flirting with its 2018 and 2020 lows, two periods that, in hindsight, proved to be selling climaxes (Chart 1). The picture is complex. BCA’s Equity Capitulation Index is indeed becoming oversold (Chart 2). However, its reading is murky. It can either decline further, which would imply greater weaknesses in stocks, or rebound. Our first instinct is to look at the indicator’s behavior at the onset of Fed tightening cycles, which constitute close historical analogues: Chart 2... But Maybe Not Enough
... But Maybe Not Enough
... But Maybe Not Enough
Chart 1Stocks Are Oversold...
Stocks Are Oversold...
Stocks Are Oversold...
In late 2015, when the last Fed tightening cycle began, the Capitulation Index plunged to much lower levels as stocks collapsed. In the background, the global economy was weakened by EM countries hammered by China’s slowdown and balance of payments crises. Around the hiking cycle that begun in June 2004, the Capitulation Index never plunged considerably, but the S&P 500 fell more than 8% between March and August 2004, in a volatile pattern. Back then, both US and global growth was very robust. In 1999, once the Fed resumed hiking rates after the 75bps of cuts following the LTCM debacle, the Capitulation Index and equities were very resilient. This strength persisted until the Nasdaq peaked in March 2000. The S&P 500 formed a complex top between March and August before starting a relentless collapse that September. Following the onset of the 1994-1995 tightening cycle, the Capitulation Index collapsed to much more oversold readings than current ones and equities entered a range-bound volatile episode that lasted until Q1 1995, as the Fed stopped hiking rates. The economy was replete with inflation fears and a mid-cycle slowdown was descending upon the US. The hiking cycle that started in 1988 did not witness significant downside in the Capitulation Index and stocks, but it took place soon after the 1987 crash when equities had become exceptionally oversold. Black Monday itself happened as inflation fear rose as a result of a weak dollar and as the Fed hiked rates through 1987. In 1984, the rate hike cycle was accompanied by a collapse in the Capitulation Index. The tightening in financial conditions caused by the Fed was exacerbated by the surge in the dollar that hurt US profitability and increased EM borrowing costs tremendously. After the 1981 hiking cycle, the Capitulation Index plunged as the US economy entered the second leg of the early 1980s double-dip recession. The latter was an economic crisis prompted by Federal Chairman Paul Volcker’s willingness to put an end to the inflation mentality of the 1970s. These historical experiences highlight one thing: Economic conditions were key to periods when the beginning of a tightening cycle caused a deeper correction in stocks than the one witnessed until now. Economic Clouds Today, the big question shaping the investment world is inflation. BCA expects inflation to peak over the coming months, whether in the US or in Europe. However, this process will take more time. CPI will not crest until after the Fed has begun to hike rates. In the meantime, there are plenty of factors that could easily fan inflation worries and, consequently, a continued upward repricing of the Fed’s interest rate path in the next few weeks. As Arthur Budaghyan highlighted in the most recent Emerging Market Strategy Report, US labor costs are rapidly rising, with the Atlanta Fed Median Wage growth measure up 5.1% annually and the Employment Cost Index (ECI) expanding at a 4.5% annual rate. Of particular worry, this surge in wages does not reflect underlying productivity and unit labor costs, which are up 3.2% annually (Chart 3), their highest rate since 2001, when the Fed funds rate was 4% and 10-year Treasurys yielded 5.4%. Chart 3US Wage-Price Spiral?
US Wage-Price Spiral?
US Wage-Price Spiral?
Elevated unit labor costs are a powerful inducement for inflation and, thus, are likely to continue to fan inflation fears among market participants. Of particular concern today, the rise in unit labor costs is not counterbalanced by a decline in US import prices and foreign deflationary pressures. Inflation fears remain a major risk for the market. As our BCA Monetary Indicator highlights, the liquidity backdrop is not supportive of equities anymore (Chart 4). Moreover, the technical picture is deteriorating, while speculation remains elevated. With investors fretting about the threat of inflation, the danger is that they start to anticipate a greater deterioration in monetary conditions. The problem is not unique to the US. At the global level, 75% of central banks are tightening policy and those that have not yet done so are gearing up to remove monetary accommodation. Adding to inflation fears are signs of a slowdown in the global goods sector. This slowdown reflects a natural transition from the spending binge on goods that took place during the pandemic, which is ebbing, to service spending, which is accelerating (Chart 5). This pattern is particularly evident for US consumers, the largest spenders in the world. Chart 5Transitioning From Goods To Services
Transitioning From Goods To Services
Transitioning From Goods To Services
Chart 4Deteriorating Liquidity Conditions
Deteriorating Liquidity Conditions
Deteriorating Liquidity Conditions
One of the world’s most sensitive economies to the global industrial cycle is already feeling the pinch from this adjustment: Sweden. Swedish economic numbers have been weakening and Swedish assets are particularly soft (Chart 6), which heralds poorly for the global manufacturing sector. This deceleration in goods spending and industrial activity is a problem for equities because stock market profits are more geared toward the evolution of the industrial cycle than the service sector (Chart 7). Chart 6A Swedish Warning
A Swedish Warning
A Swedish Warning
Chart 7Manufacturing, Not Services, Drives Profits
Manufacturing, Not Services, Drives Profits
Manufacturing, Not Services, Drives Profits
Investment Conclusions In this context, it is prudent to maintain hedges to protect stock holdings. It is commonly argued that stocks are expensive, but if one considers the low level of bond yields, these valuations can be justified. Chart 8 challenges this notion. Yes, the earnings yield is still very elevated relative to 30-year Treasury bond yields; however, it is at its lowest in 42 years against core inflation. Why would core inflation be relevant? In a context in which investors are worried about the impact of inflation on both profit margins (higher labor costs) and the direction of policy, they are unlikely to remain unmoved by inflation fears, especially as the perception of higher policy rates may lift rates higher. Moreover, with many investors anxious that the Fed is falling far behind the curve, the marginal market players could easily become the individuals concerned that a catch up by the Fed will lead the economy into a recession. Considering the risks linked to Ukraine, the potentially negative impact on profitability of slowing goods spending, the growing policy uncertainty globally and in the US, and the inversion of many segments of the yield curve, prudence remains appropriate (Chart 9). Chart 8Value Is In The Eye Of The Beholder
Value Is In The Eye Of The Beholder
Value Is In The Eye Of The Beholder
Chart 9Rising Policy Uncertainty
Rising Policy Uncertainty
Rising Policy Uncertainty
Chart 10The Importance Of Manufacturing To Europe
The Importance Of Manufacturing To Europe
The Importance Of Manufacturing To Europe
The problem for European equities is their elevated beta and pro-cyclicality. A pullback in US stocks will automatically drag down European stocks. Moreover, the region’s heavy reliance on manufacturing activity is reflected in the sectoral tilt of European benchmarks. As a result, the performance of European stocks is particularly sensitive to the evolution of the global industrial cycle (Chart 10). Add the fact that European economies are much more exposed to potential energy market disruptions emanating from Ukraine and the recent rebound in Europe’s relative equity performance becomes tenuous at best. Why would these dynamics be temporary and only warrant hedges, not a cyclical underweight in stocks and Europe? First, the inflation fear will recede in the second half of 2022. Our Global Supply Disruption Index has peaked and suggests that inflation surprises will soon ebb. Moreover, a measure of suppliers’ constraints based on the ISM Supplier Delivery Times, Backlog of Orders, Prices Paid, and Inventories is also rolling over (Chart 11). Second, a deepening of the stock market correction will tighten financial conditions and push credit spreads higher. This is a deflationary process that will cause inflation fears to recede and, thus, the pricing of expected Fed rate hikes to lessen. Third, the slowdown in the goods sector is concentrated among consumer goods. Capex will firm up. Capex intentions are elevated in Europe and the US, and global capital goods orders remain robust, despite having decelerated from their extraordinary rebound following the Q1 2020 shutdowns (Chart 12). Moreover, the political and corporate demand to build greater redundancy in global supply chains following the disruptions caused by the Sino-US trade war and COVID-19 will also boost corporate investments for a few more years. This means that many industrial sectors will recover globally and propel industrial equities higher. Chart 11Apex Bottlenecks?
Apex Bottlenecks?
Apex Bottlenecks?
Chart 12Capex Will Stay Strong
Capex Will Stay Strong
Capex Will Stay Strong
Fourth, Matt Gertken, BCA’s geopolitical strategist, continues to see a limited Ukrainian conflict as the most likely outcome of the current tensions. As a result, any dislocation to global stocks and European assets caused by a conflict will be transitory. Finally, the business cycle has further to run. In 1994/95 and in 2015/16, the Fed tightening cycle materialized around the time of a mid-cycle slowdown. The economy recovered and profit firmed up anew, which allowed stocks to rebound. The Fed Funds rate is rising but remains below the neutral rate. Interest rates in Europe also have ample scope to rise before monetary policy becomes tight. Simultaneously, the recovering service sector will continue to support employment and, thus, final demand. Equity bear markets rarely materialize outside of recessions (Chart 13). Chart 13Bear Markets Demand A Recession
Bear Markets Demand A Recession
Bear Markets Demand A Recession
Bottom Line: Global equities are oversold, but the combination of rising inflation, Fed tightening, Ukrainian risks, and a transition from a goods-driven recovery to a service sector-led economy means that stocks risk becoming even more oversold in the near term. European equities are not immune to these threats. While rising rates are a lesser problem for Europe than the US, the developments in Ukraine and a manufacturing transition represent greater hurdles. Ultimately, the difficulties faced by stocks reflect a mid-cycle slowdown taking place alongside a period of policy tightening. It will be, therefore, temporary. Consequently, investors should not abandon stocks, but rather continue to hold protections. Mathieu Savary, Chief European Strategist Mathieu@bcaresearch.com Tactical Recommendations Cyclical Recommendations Structural Recommendations Closed Trades
Executive Summary Oil-Price Risk Skewed Upward
Scenarios For Oil Prices
Scenarios For Oil Prices
The $10-$15/bbl risk premium in Brent prices will dissipate over the next month. Russia's best outcome is to follow the off-ramp offered by the US. President Biden's call to KSA's King Salman last week will result in higher oil output from the Kingdom, the UAE and Kuwait, in return for deeper US defense commitments. The Biden administration and Iran are in a hurry to get a deal done: The US wants lower oil prices, and Iran needs the revenue. Our Brent forecasts for 2022 and 2023 are revised slightly to $81.50 and $79.75/bbl, respectively, reflecting supply-demand adjustments. Price risks are tilted to the upside: A miss on any of the above assumptions will keep prices above $90/bbl, and push them higher. Bottom Line: Oil demand will remain robust this year and next. To keep prices from surging from current levels into demand-destruction territory, additional supply is needed. Most of this will come from KSA, the UAE and the US shale-oil producers. We expect prices to fall from current prompt levels this year and next. This will support sovereign budgets and oil producers' free cashflow goals. We remain long the XOP ETF. Feature The $10-$15/bbl risk premium in Brent crude oil prices will dissipate, as the following supply-side events are ticked off: 1) Russia gets on the off-ramp offered by the US last week to de-escalate the threat of another invasion of Ukraine by withdrawing its troops from the border;1 2) OPEC 2.0's core producers – the Kingdom of Saudi Arabia (KSA), the United Arab Emirates (UAE), and Kuwait – increase supply in return for deeper US security commitments; 3) Iran restores its remaining 1.0 – 1.2mm b/d of production to the market, following the restoration of its nuclear deal with Western powers; and 4) US shale-oil producers step up production in response to higher WTI prices. Politics, Then Economics The first three assumptions above are political in nature, requiring a bargain be struck among contending interests to resolve. We do not believe Russia's endgame is to jeopardize its future oil and gas exports to the West, particularly to the EU (Chart 1). The US is warning that another invasion of Ukraine will put the use of the Nord Stream 2 pipeline to deliver gas to Germany at risk.2 It also is worthwhile noting NATO is aligned with the US on this stance. Russia derived 40-50% of its budget revenues from oil and gas production, and ~ 67% of its export revenue from oil and gas over the decade ended in 2020.3 Of course, only President Putin can determine whether oil and gas sales can be diversified enough – e.g., via higher shipments to China – to offset whatever penalties the West imposes. But, in a game-theoretic sense, the stakes are very high, and taking the US off-ramp is rational. Chart 1Russia's Critical Exports: Oil + Gas
Lower Oil Prices On The Way
Lower Oil Prices On The Way
We expect the second assumption to play out in the near term, following US President Joe Biden's call to KSA's King Salman last week. The outreach stressed the US commitment to defend KSA and, presumably, its close allies in the Gulf (the UAE and Kuwait).4 KSA already has increased its production to 10.15mm b/d under the OPEC 2.0 agreement to restore 400k b/d beginning in August 2021. We estimate the coalition had fallen behind on this effort by ~ 1mm b/d, as only KSA, the UAE and Kuwait presently have the capacity to lift production and sustain it (Table 1). KSA's reference production level agreed at OPEC 2.0's July 2021 meeting will rise to 11.5mm b/d in June, up 500k b/d from its current level (Table 2). This means KSA could flex into another 850k b/d between now and the end of May; and another 500k b/d after that. The UAE's and Kuwait's reference production levels will rise 330k and 150k b/d in June to 3.5mm b/d and 3.0mm b/d, respectively. Markets will need these incremental volumes as demand continues to recover and non-core OPEC 2.0 production continues to fall (Chart 2). Table 1BCA Global Oil Supply - Demand Balances (MMb/d, Base Case Balances) To Dec23
Lower Oil Prices On The Way
Lower Oil Prices On The Way
Table 2Baseline Increases For Core OPEC 2.0
Lower Oil Prices On The Way
Lower Oil Prices On The Way
Our third assumption reflects our reading of the signaling by Iran over the past few weeks, which indicate growing confidence a deal with the US to restore the Joint Comprehensive Plan of Action (JCPOA) is in the offing.5 The politics here converge with the economics: the Biden Administration wants to increase oil supply ahead of mid-term elections in the US to keep gasoline prices under control; Iran needs to increase its revenues. Both sides get an immediate need satisfied. However, the risks to KSA and its Gulf allies will increase as Iran's revenues grow, because it will be able to fund proxy-war operations against the Gulf states. This is why deepening the US defense commitment to the region is critical to KSA and its allies. The last assumption reflects our view US E+P companies are being incentivized to lift production by high prompt and deferred prices. We continue to expect these companies – particularly those in the US shales, where the majority of the production increase will occur – to husband their capital resources closely, and to continue to prioritize shareholder interests. As capital availability declines – primarily due to reduced investor interest in investing in hydrocarbon production – these firms will have to focus on reducing operating costs and increasing productivity over the next decade to fund growth. Relative to 2021, we expect US oil production to increase 0.85mm b/d this year and by 0.53mm b/d in 2023 relative to this year, as producers respond to higher prices (Chart 3). Chart 2Increased Core OPEC 2.0 Production Becoming Critical
Lower Oil Prices On The Way
Lower Oil Prices On The Way
Chart 3US Oil Production Will See Another Up Leg
US Oil Production Will See Another Up Leg
US Oil Production Will See Another Up Leg
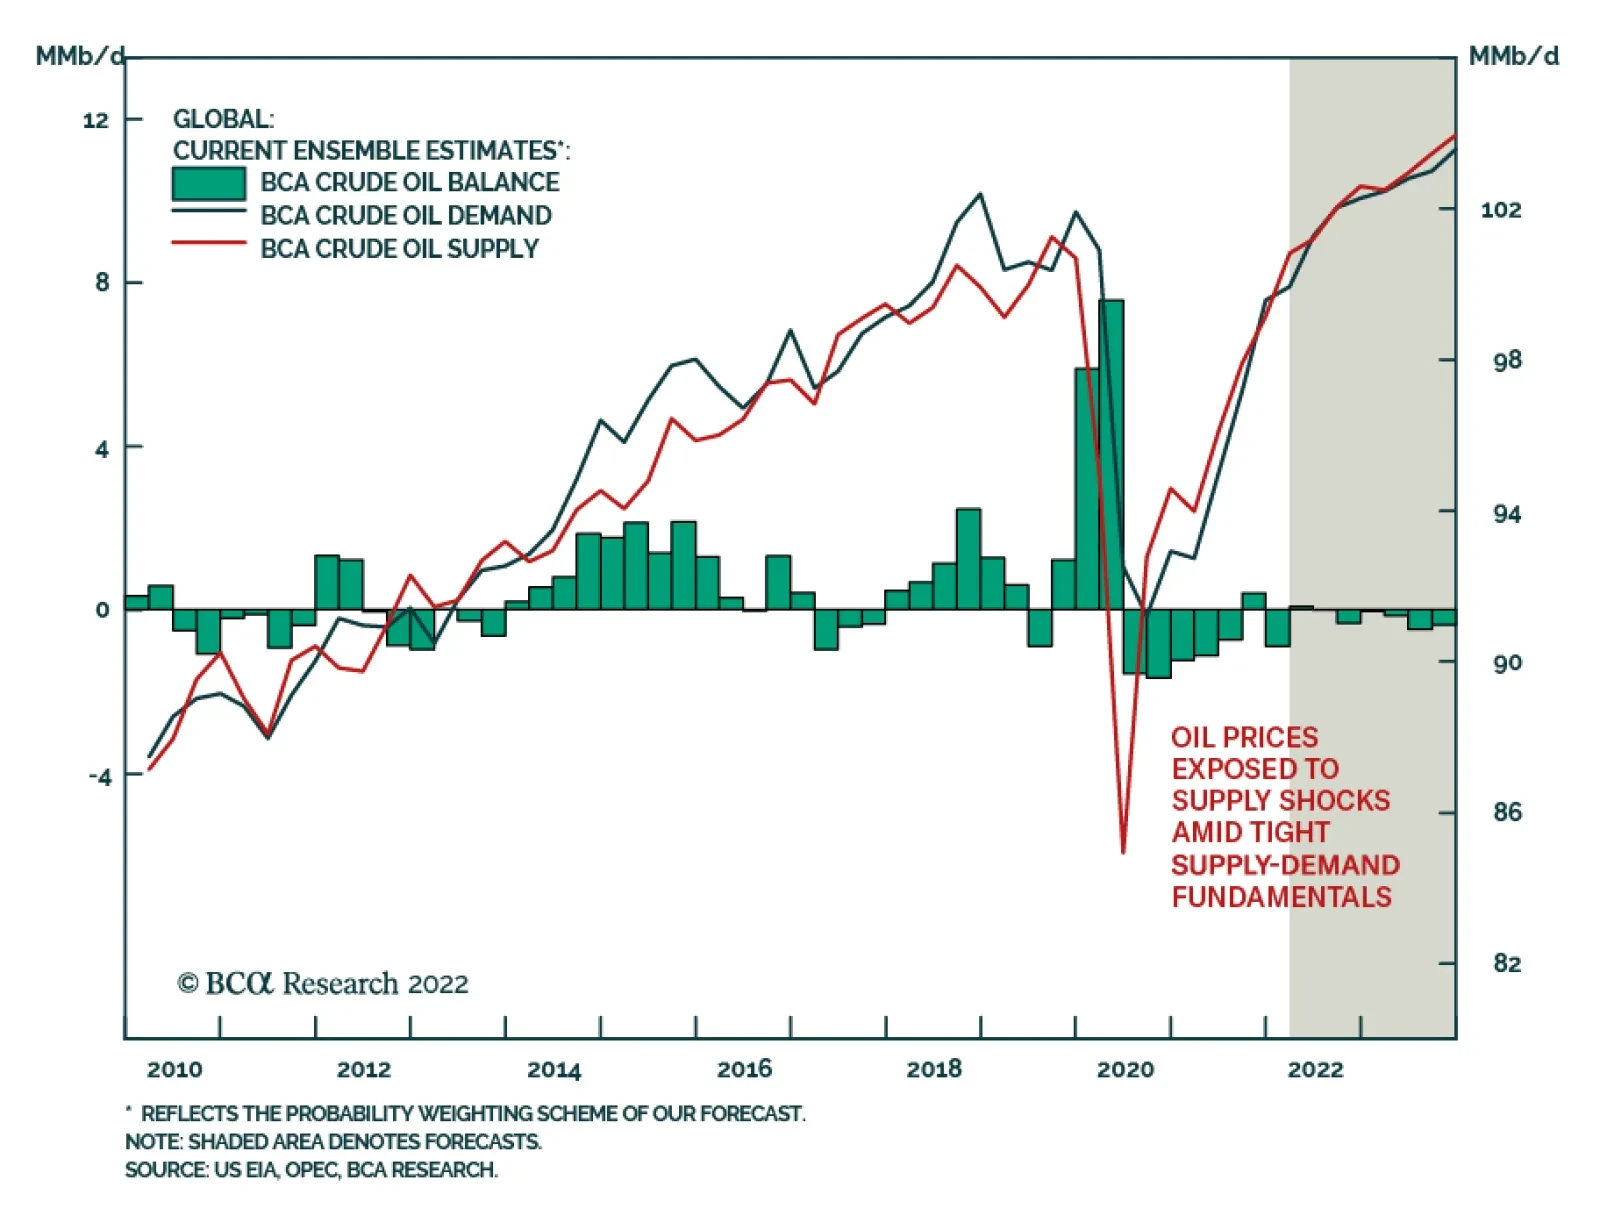
Supply-Demand Balances Are Tight Global oil demand growth this year is reduced slightly in our balances – going to 4.5mm b/d from 4.8mm b/d, mostly reflecting our assessment of slowing growth as central banks remove monetary accommodation. We lifted next year's growth estimate slightly, to 1.7mm b/d. These estimates still leave our growth expectations above the major data providers, the highest of which is OPEC's 4.2mm b/d estimate. We continue to expect DM demand to level off this year and next, and EM demand to retake its position as the global demand growth engine (Chart 4). The supply side remains tight, with average global crude oil and liquid fuels production estimated at 101.5mm b/d for 2022 and 102.8mm b/d for next year. With demand expected to average 101.5mm b/d this year and 103.2mm b/d next year, markets will remain balanced but tight (Chart 5). This means inventories will continue to be strained, leaving little in the way of a cushion to absorb unexpected supply losses (Chart 6). Chart 4EM Demand Retakes Growth-Engine Role
EM Demand Retakes Growth-Engine Role
EM Demand Retakes Growth-Engine Role
Chart 5Markets Remain Balanced But Tight...
Markets Remain Balanced But Tight...
Markets Remain Balanced But Tight...
Chart 6...Keeping Pressure On Inventories
...Keeping Pressure On Inventories
...Keeping Pressure On Inventories
Markets Remain Balanced But Tight Our supply-demand analysis indicates markets will remain balanced but tight, with inventories under pressure until supply increases. This will predispose markets to higher price volatility, as low inventories force prices to ration supply. This will increase the backwardation in the Brent and WTI curves, which will bolster the convenience yield in both of these markets (Chart 7).6 We expect implied volatility to remain elevated, as a result (Chart 8). Chart 7Backwardation Will Keep Convenience Yield Elevated
Lower Oil Prices On The Way
Lower Oil Prices On The Way
Chart 8High Volatility Will Persist
High Volatility Will Persist
High Volatility Will Persist
Because of these low inventory values, Brent prices for 2022 are higher than our previous estimate. By 2023, the effects of increased supply from KSA, UAE, Kuwait – albeit a marginal increase – and the US kick in to reduce prices. As supply increases, the risk premium currently embedded in Brent prices will decline, pushing them to our forecasted levels for 2022 and 2023 of $81.50/bbl and $79.75/bbl, respectively. For 1H22, we expect Brent prices to average $87.20/bbl, and in 2H22 we're forecasting a price of $75.80/bbl on the back of increased production. Next year, higher output will keep prices close to $80/bbl, with 1H23 Brent averaging $79.85 and 2H23 averaging $79.70/bbl. Word Of Caution Our analysis is predicated on strong assumptions regarding the incentives of oil producers taking a rational view of the need for stability and supply in markets. The bottom panel of Chart 9 provides an indication of how tenuous markets are if our assumptions are mistaken, and core OPEC 2.0 does not increase production, Iranian barrels are not returned to the market, or the US shale supply response is less vigorous than we expect. The highest price trajectory occurs when all of our assumptions prove wrong, which takes Brent prices above $140/bbl by the end of 2023. It goes without saying this is non-trivial. But we'll say it anyway: This is non-trivial. We can reasonably expect feedback loops in such a case – e.g., US and Canadian production kicks into high gear, and once-idled North Sea are brought back into service. However, this takes time, and will cause demand destruction on a global scale. Chart 9Scenarios For Oil Prices
Scenarios For Oil Prices
Scenarios For Oil Prices
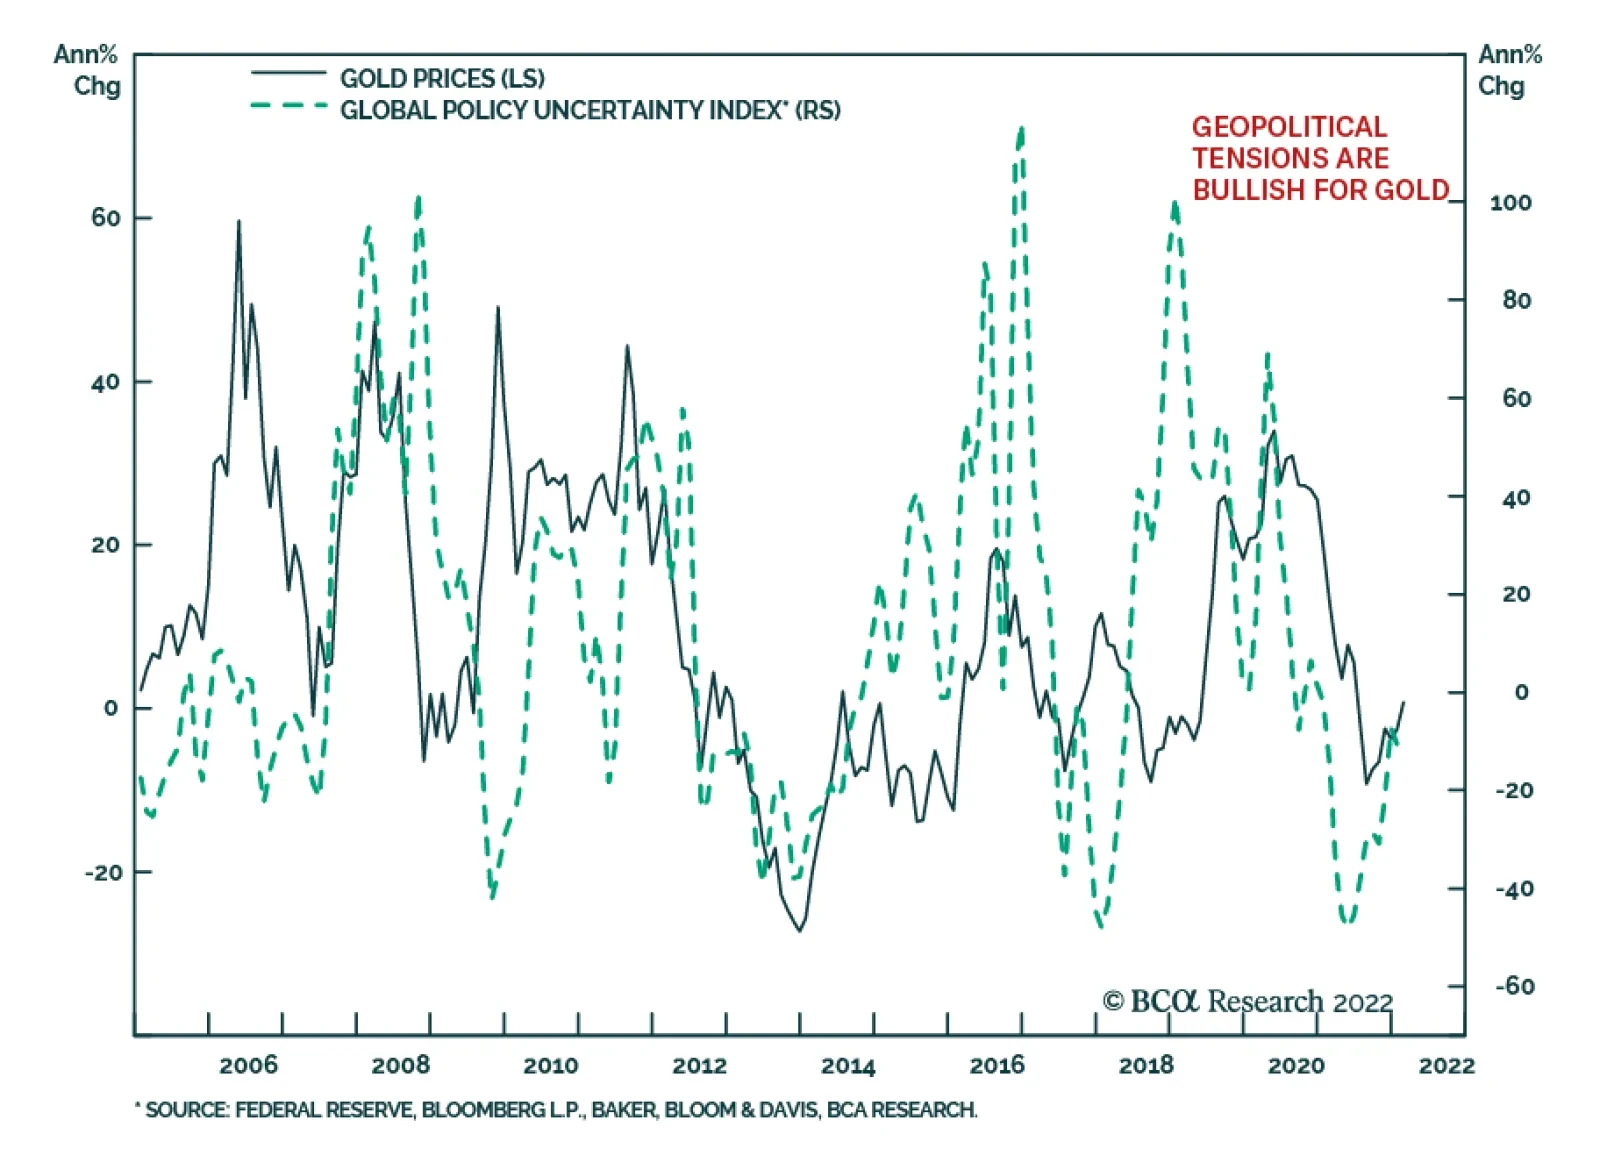
Investment Implications Oil markets will remain tight and volatile until additional supplies are forthcoming. We are expecting core OPEC 2.0 to lift output by 3.2mm b/d this year, and for the US Lower 48 production to average 9.8mm b/d. The US production increase will be led by higher shale-oil output, which we expect to average 7.4mm b/d this year and 7.8mm b/d in 2023. Given the tight markets we expect, we remain long the XOP ETF, and commodity index exposure in the form of the S&P GSCI and the COMT ETF, an optimized version of the S&P GSCI. Robert P. Ryan Chief Commodity & Energy Strategist rryan@bcaresearch.com Ashwin Shyam Research Associate Commodity & Energy Strategy ashwin.shyam@bcaresearch.com Commodities Round-Up Energy: Bullish Marketed volumes of US natural gas are expected to hit a record high of just under 107 Bcf/d next year as prices stabilize close to $4/MMBtu, in the EIA's latest estimate. This is up from just over 104 Bcf/d of marketed production this year, which itself was a 3 Bcf/d increase over 2021 levels. Almost all of this will come from the Lower 48 (97%). We expect US LNG exports to increase on the back of rising production and further investment in export terminals. Most of this will be shipped to Europe, in our estimation, as EU states seek to diversify LNG sources in the wake of the Russia-Ukraine standoff currently underway. LNG imports accounted for roughly one-fifth of all natural gas supplied to the UK and EU-27 in 2020, according to the EIA, which notes, "Growing volumes of flexible LNG supplies, primarily from the United States, contributed to the notable increases in LNG imports to Europe from 2019 to 2021." Wide price differentials can be expected to support the flow of LNG to Europe from the US (Chart 10). Base Metals: Bullish Iron ore prices took a hit after China’s National Development and Reform Commission (NDRC) stated its intentions to stabilize iron ore markets, crack down on speculation and false price disclosures after prices in 2022 rallied sharply last week. Authorities believe price strength is coming from speculation and hoarding, which is adding to inflationary pressures. However, fundamental factors have been, and likely will keep iron ore prices buoyed. Based on past steel inventory levels and seasonal patterns, steel production will increase and more than double current inventory levels by end-March. Monetary policy easing, and the push by China’s steel industry to become carbon-neutral over the next five years are additional fundamental factors supporting iron ore prices. Precious Metals: Bullish The January print for US CPI jumped 7.5% year-on-year, beating estimates as headline inflation rose to a 40-year high. Markets are expecting around five interest increases this year (Chart 11). BCA’s US Bond Strategy expects rate hikes will be around 100 – 125 bps this year. Gold prices initially fell on the possibility of increasing rate hikes and a hawkish Fed, but in the second half of last week settled at subsequently higher prices on each day. Apart from increased inflation demand, this was likely due to markets’ fear of the possibility of an ultra-hawkish Fed, which could tighten US financial conditions and see a rotation out of US equity markets into safe-haven assets or into other markets ex-US, both of which will be bullish for gold. Chart 10
Lower Oil Prices On The Way
Lower Oil Prices On The Way
Chart 11
US Policy Rate Expectations Going Up
US Policy Rate Expectations Going Up
Footnotes 1 Please see Background Press Call by a Senior Administration Official on the President’s Call with Russian President Vladimir Putin, released by the US White House on February 12, 2022. 2 Please see Long-Term EU Gas Volatility Will Increase, which we published on February 3, 2022 for further discussion. The EU is a huge market for Russia supplies Germany with 65% of its gas. Approximately 78% of total natural gas exports (pipeline + LNG) from Russia went to the EU in 2020. 3 Please see Russia’s Unsustainable Business Model: Going All In on Oil and Gas, published on January 19, 2021 by the Hague Centre for Strategic Studies (HCSS). 4 Please see Readout of President Joseph R. Biden, Jr.’s Call with King Salman bin Abdulaziz Al-Saud of Saudi Arabia, released on February 7, 2022. The readout noted, " issues of mutual concern, including Iranian-enabled attacks by the Houthis against civilian targets in Saudi Arabia." Energy security also was discussed, which we read as code for a deal to increase production in return for a deepening of US defense commitments. This line is followed closely by Gulf media – e.g., It took Biden a year to realize Saudi Arabia’s vital regional role, published by arabnews.com on February 13, 2022, which notes: "If Putin decides to invade Ukraine, the Saudis are the only ones who could help relieve the unsteady oil markets by pumping more crude, being the largest crude exporter in the OPEC oil production group. The White House emphasized that both leaders further reiterated the commitment of the US and Saudi Arabia in ensuring the stability of global energy supplies. 5 Please see Iran 'is in a hurry' to revive nuclear deal if its interests secured -foreign minister, published by reuters.com on February 14, 2022. 6 Please see our November 4, 2021 report entitled Despite Weaker Prices Crude Oil Backwardation Will Persist for additional discussion of convenience yields and volatility. Investment Views and Themes Strategic Recommendations Trades Closed in 2021
Image
Tensions between the West and Russia are intensifying. Although Russian Foreign Minister Sergei Lavrov stated in a televised meeting with President Vladimir Putin that there is still a possibility that diplomatic engagement will succeed, US National Security…
Iran nuclear deal talks have resumed in an attempt to salvage the 2015 agreement following former President Donald Trump’s 2018 withdrawal. US interests are aligned for a resumption of the pact. The original agreement intended to facilitate the US’s…

Executive Summary Energy Industry Is Driven By Multi-year Capex Cycles
Energy Industry Is Driven By Multi-year Capex Cycles
Energy Industry Is Driven By Multi-year Capex Cycles
Demand: Crude oil demand is expected to return to trend driven by strong economic growth and the receding pandemic. Supply: Production remains suppressed because of curtailments by OPEC 2.0 members, investment restraint from US producers, and multiple supply disruptions. To meet the increasing oil demand, the US shale oil producers are now perfectly positioned to pick up slack in supply. New Capex Cycle: The industry’s Capex is inherently cyclical – there are early signs of the new “up” leg. Geopolitics: Sizzling tensions with Iran, Russia, and a possible new market share war with the Saudis may lead to volatility in crude oil prices. Bottom Line: The US Energy sector is in the early innings of the new Capex and production cycle on the back of growing demand for oil and gas, and faltering supply from OPEC 2.0 members. Stay tuned for an upcoming Part II of the report where we will provide investment recommendations for the Energy sub-sectors. Feature This week, we start a “deep dive” into the Energy sector, aiming to make an educated decision regarding Energy sector allocations – is it time to take profits after a strong run, or does the rally still have legs? We are currently overweight Energy, with the position outperforming the S&P 500 by 32% since we initiated it in December 2021. This is a two-part report. In today’s publication, we will overview the industry landscape, and analyze global supply and demand for oil, price forecasts, and geopolitical undercurrents. Next week, we will cover the Energy sector’s macroeconomic backdrop, fundamentals, and valuations. We will use the analysis to provide investment recommendations for the sector, as well as offer a granular view on the prospects of each Energy industry group. Stay tuned! Performance All of a sudden, the Energy sector, a humble chronic underperformer, the weight of which in the S&P 500 has melted from 15% to 5% over the past 15 years, is hot again and is a focal point of investor attention. Indeed, Energy was the best performing sector in 2021 and is the only sector with positive absolute returns YTD, outperforming the S&P 500 by 30%. Despite a strong recent run, Energy is still 18% behind the S&P 500 since January 2020, and 72% since 2008 (Chart 1). Chart 1Energy Has Lagged The S&P 500 Since 2020
Energy Has Lagged The S&P 500 Since 2020
Energy Has Lagged The S&P 500 Since 2020
Table 1
Energy: After Seven Lean Years (Part I)
Energy: After Seven Lean Years (Part I)
The Early Innings Of A New Capex Cycle The energy industry is inherently cyclical, driven by multi-year Capex cycles. Supply shortages and high oil prices beget years of elevated capital spending, which boosts production to unsustainable levels. Once the market is flooded with oil, prices collapse, and “seven lean years” of underinvestment commence (Chart 2). Case in point: Energy industry Capex has been in a downcycle since 2014 when Saudi Arabia flooded the market with oil to protect its market share and confront Iran. Recent supply shortages have been further exacerbated by a broad push towards “green” energy, fortified by government incentives, regulations, and shareholder activism directed against fossil fuels. Just last year, a hedge fund called Engine No. 1, backed up by BlackRock, Vanguard, and State Street, installed three new directors on Exxon’s board with a declared effort to force the company to reduce its carbon footprint. Politicians’ and investors’ aversion to the “dirty sources of energy” translates into a higher cost of capital for oil producers and reluctance to invest despite rising prices. Ironically, “greenification” has led to a higher price of oil and constrained output – producing a profit windfall for the oil and gas producers. Chart 2Energy Industry Is Driven By Multi-year Capex Cycles
Energy Industry Is Driven By Multi-year Capex Cycles
Energy Industry Is Driven By Multi-year Capex Cycles
Further, not only were oil producers overly cautious and concerned about the sustainability of higher oil prices but also, once compelled to go ahead with multi-million-dollar investments, they could not react fast enough – it takes six to eight months to ramp up production. This explains the recent dichotomy between the WTI and the Energy sector return (Chart 3). Chart 3Dichotomy Between WTI And Energy Sector Returns
Dichotomy Between WTI And Energy Sector Returns
Dichotomy Between WTI And Energy Sector Returns
Chart 4Rig Count Is Rising Again
Rig Count Is Rising Again
Rig Count Is Rising Again
Now that the industry is flush with cash and gaining confidence in the sustainability of higher prices, it is cautiously increasing production and adding rigs. Capex is expected to rise by 25% year-over-year in 2022, and by 7% in 2023. Rig count increased by 11% in 2021 (Chart 4). Industry Structure Energy Sector Composition The energy sector consists of four distinct segments, with each segment corresponding to a section of the oil production value chain (Figure 1). The GICS sector classification classifies them as Oil & Gas Exploration and Production (aka E&P or Upstream segment), Oil & Gas Equipment and Services Companies, Storage and Transportation (Midstream), and Refining and Marketing (Downstream). Integrated Oil & Gas companies straddle the entire supply chain. Integrated Oil Companies constitute almost half of the S&P 500 Energy sector, with E&P at just over a quarter (Chart 5). The Energy sector is not as top heavy as some of its “new technology” brethren in the overall market index. Of all the segments, Midstream has the highest margins, as its fees are a function of output as opposed to the price of oil (Chart 6). Energy Services is most challenged as its revenue is a function of E&P Capex and is highly leveraged to the oil price. Figure 1The Energy Industry Supply Chain
Energy: After Seven Lean Years (Part I)
Energy: After Seven Lean Years (Part I)
Chart 5The Sector Is Dominated By E&P And Integrated Oil Companies
Energy: After Seven Lean Years (Part I)
Energy: After Seven Lean Years (Part I)
Chart 6Profitability Varies Across Segments
Energy: After Seven Lean Years (Part I)
Energy: After Seven Lean Years (Part I)
Upstream: E&P Segment This segment is the first step in the production process. E&P companies focus on exploration, discovery, and managing the production of new and established wells. The success of these companies is largely a function of their ability to find new profitable oil and gas deposit sites. Development of new rigs is a sophisticated technological process that requires hundreds of millions of dollars in capital outlays without much guarantee of success. In addition, tight oil (aka shale) wells have steep declines in the early years of their production, requiring continuous drilling of new wells to maintain production rates. The E&P companies also have to constantly look for and develop new extraction sites. This is the riskiest energy segment – the E&P companies must manage the dual uncertainty of the exploration process and of the price of crude, for which they are perfect price-takers. As a result, E&P stocks have the highest beta of all segments to the price of oil. In this business, economies of scale and diversification certainly help profitability – larger companies in the sector tend to have a higher RoE (Chart 7). The largest and most well-known upstream companies are ConocoPhilips (COP), EOG Resources (EOG), and Pioneer Natural Resources (PXD). The E&P ETF is XOP. Chart 7Larger Companies Tend To Have A Higher RoE
Energy: After Seven Lean Years (Part I)
Energy: After Seven Lean Years (Part I)
Energy Equipment And Services (E&S) Segment This segment supplies equipment and services, such as drilling, to the E&P companies. Once a new oil or gas discovery is vetted and gets the go-ahead, upstream companies allocate resources for the development of a new site. To put it simply, upstream companies’ Capex is E&S firms’ revenue. In addition, the E&S companies maintain existing wells, retire depleted ones, and complete unfinished wells (as is happening now). Consequently, this sub-sector is tightly linked to the well-being of exploration companies, and through them, to the crude oil and gas prices. Over the past seven “lean years”, upstream companies’ newly-found Capex discipline, and a push to return cash to shareholders, was quite a blow for the E&S companies. To survive, many had to look for new sources of revenue, such as servicing green energy projects. Recent oil and gas shortages and a rising rig count are a notable change of fortune for these companies. However, the E&P companies are still in a frugal and cautious mindset and are focusing on the completion of drilled-but-uncompleted wells (DUCs), whose number has decreased by 29% in 2021.1 This work is less lucrative for the E&S companies than drilling new wells. Some of the largest players in the industry are Baker Hughes (BKR), Halliburton (HAL), and Schlumberger (SLB). The ETF is XES. Midstream: Storage And Transportation (S&T) Segment S&T companies are involved in the transportation, storage, and trading of unrefined oil after it has been taken out of the ground by the upstream firms. There are several modes of oil transportation: Marine vessels, trucks, and pipes. While the first two modes are straightforward, it is pipelines that put the overall energy industry into political crosshairs. Since pipelines must go through someone’s land, midstream companies often get caught in land rights or related environmental battles. As a result, the industry is heavily regulated, and many projects are blocked and dropped after multi-year delays and millions in legal fees. But all in all, this segment faces less uncertainty than other segments as its sales are a function of production volume as opposed to the price of oil. It also requires more moderate capital outlays than the upstream segment. Kinder Morgan (KMI), ONEOK (OKE), and Williams (WMB) are the key players in this space. Downstream: Refining And Marketing (R&M) Segment Refining and marketing crude oil completes the energy industry value chain. Refining is a complex process that transforms raw crude that has little use into end-user products such as motor fuel, heating oil, or plastics. These products are then marketed for distribution on a wholesale basis to be sold to the consumer, business, and government sectors. Refiners run mostly high fixed cost operations and benefit from higher volumes. These companies are less sensitive to the price of crude as they make money on the crack spread, or the difference between the price of raw and refined oil. In 2021, utilization rates of refiners got back to 90% of pre-pandemic levels. Marathon Petroleum (MPC), Valero Energy (VLO), and Phillips 66 (PSX) are the three R&M companies in the S&P 500 Energy benchmark. Integrated Oil And Gas (Integrated) While most players in the industry typically specialize within their segment, Chevron (CVX), ExxonMobil (XOM), and Occidental Petroleum (OXY) are exceptions. These are vertically integrated companies that operate in every segment of the value chain, from upstream to downstream. These are the largest and most diversified industry players, less dependent on the price of oil or Capex cycle than companies in the other segments. Oil And Gas Consumption For many laymen, like myself, oil and gas stand for driving and cooking. However, the uses of energy products are diverse and touch nearly every sector of the global economy. According to EIA (Figure 2), in 2020, motor gasoline stood for 44%, jet fuel for 6%, and hydrocarbons for 18% of overall oil and gas output. In terms of sectors, 66% went to the Transportation sector, and 28% to the Industrial sector for example as plastics. In 2022, we expect a further pick-up in demand for fuel from the aviation industry, and from car drivers – as COVID-19 gradually morphs from a pandemic into an endemic illness, and demand for travel increases. Figure 2US Petroleum Products Consumption By Source And Sector, 2020
Energy: After Seven Lean Years (Part I)
Energy: After Seven Lean Years (Part I)
Supply And Demand Oil Demand Recovery To Continue EIA reports that “global oil consumption outpaced oil production for the six consecutive quarters, ending with the fourth quarter of 2021 (4Q21), which has led to persistent withdrawals from global oil inventories and significant increases in crude oil prices”.2 According to BCA Research’s Chief Commodity and Energy Strategist Bob Ryan, demand will continue to return to trend (Chart 8), barring too-high prices or another full-scale COVID-induced lockdown in a key market like China. He also emphasizes that increase in oil demand is being driven by economic growth, and consumers are likely to withstand higher prices, as long they don’t become entrenched at over $90/bbl. We concur. Chart 8Global Oil Demand Expected To Get Back On Track
Global Oil Demand Expected To Get Back On Track
Global Oil Demand Expected To Get Back On Track
Supply From OPEC 2.0 Is Faltering – US Shale To The Rescue! Crude oil production remained suppressed because of curtailments by OPEC 2.0 members, investment restraint from US oil producers, and other supply disruptions. To meet the increasing oil demand, the core OPEC 2.0 member states ex-Russia, i.e., Saudi Arabia, Iraq, the UAE, and Kuwait, need to restore production taken off the market in the wake of the pandemic. According to the Oxford Institute of Energy Studies (OIES), this year OPEC 2.0 "will struggle to return more than 2 mb/d of withheld supplies in 2022, compared to the headline target of 3.76 mb/d."3 In the face of ongoing downgrades in the inability of OPEC 2.0 member states, including Russia, to increase output, the US shale oil producers need to pick up slack in supply. BCA’s Commodity & Energy Strategy (CES) projects that, in 2023, US crude oil production will return to the pre-pandemic high (Chart 9). Chart 9US Oil Production Has To Increase
US Oil Production Has To Increase
US Oil Production Has To Increase
So far the increase in US output has been slow, mostly because it takes six to eight months after an oil price increase to assemble rigs and crews to significantly lift production from current levels.4 Supply And Demand – Mostly Balanced With oil demand normalizing, and US shale producers gearing up to make up shortfalls from OPEC 2.0 producers, markets are likely to remain balanced (Chart 10). The implication is price stability barring geopolitical shocks (which may be many). Chart 10Market Remains Tight But Mostly Balanced
Market Remains Tight But Mostly Balanced
Market Remains Tight But Mostly Balanced
Chart 11Brent Forecasts Center Around /bbl For 2022
Brent Forecasts Center Around $80/bbl For 2022
Brent Forecasts Center Around $80/bbl For 2022
Price Forecasts On the back of faltering oil supply from OPEC 2.0 and steady demand recovery, BCA’s CES forecasts the Brent oil price to average $80/bbl this year, and $81/bbl in 2023. This call is in line with market consensus, with most estimates clustered around the $80-$85/bbl range. EIS forecasts are more conservative – WTI is set to decline from the current price of $90 to $75 in 2022, and $68 in 2023 (Chart 11). To put these prices into context: $46/barrel is a breakeven cost of a well in the Permian Midland, and $64 is an average WTI price used by executives for planning their Capex in 2022.5 Geopolitical Tensions: Uncertainty Will Lead To Oil Price Volatility Supply shortages, due to OPEC 2.0’s inability to raise output, coupled with a time lag in restarting US shale rigs, are exacerbated by geopolitical tensions involving Iran and Russia. According to BCA Research’s Geopolitical Strategist Matt Gertken, we are to expect significant volatility in oil and gas prices due to uncertainty associated with Iran and Russia. The US is seeking to rejoin the 2015 nuclear deal, which would be a stop-gap solution to tensions with Iran. The Biden Administration wishes to avoid an energy shock in 2022 ahead of the midterm elections and may be willing to lift sanctions on Iran to that end. Iran may be willing to agree to the original deal to reduce sanctions, knowing that the deal begins to expire as early as 2025. However, the Iranian government does not have an incentive to halt progress on its nuclear and missile program, and it also fears another US change of ruling party in 2024-25. Therefore, any removal of US sanctions will be a temporary solution: It will boost oil supply in the short run but may not have a lasting impact as regional military threats to oil production will revive sooner than expected. However, Gertken thinks that the likelihood of a deal with Iran is less than 50/50. In that case, sanctions will stay in effect, Iran will achieve breakout uranium enrichment capacity, Israel will dial-up military threats, and the price of oil will see a rising risk premium, with higher odds of a major supply disruption. Russia invading Ukraine will also trigger sanctions and a cut-off of natural gas that flows through Ukraine to Europe, which will lead to a further supply squeeze and a potential shock that would weigh on European and global growth. In that case, from a geopolitical perspective, the Saudis and Americans will increase production to prevent demand destruction. Thus, the most likely outcome is heightened oil price volatility. However, in a way, this outcome is somewhat favorable to US producers as prices would be loosely anchored around the current level. This said, a key opposing geopolitical risk is a drastic move by OPEC, i.e., by the Saudis, who are capable of flooding the market with oil. This move would be aimed both at Iran and the US shale producers, to preempt loss of market share by lowering the price of oil and removing incentives for the other oil producers to ramp up production in response to growing global demand. The Saudis might do this if the US and Iran strike a new deal and the US is about to lift sanctions on Iran. The effect of such a potential move by OPEC will have a much more severe effect on the oil prices than if the US lifts sanctions on Iran. BCA’s Commodity & Energy Strategy argues that it is highly likely that OPEC 2.0 will increase output in response to strong global growth, but that the Saudis will not initiate a full-fledged market-share war as they did in 2014. Bottom Line The US Energy sector is in the early innings of the new Capex and production cycle. Strong and growing demand for oil and gas, and faltering supply from OPEC 2.0, exacerbated by the geopolitical tensions with Iran and Russia, put the US Energy sector into the driver’s seat to ramp up production and pick up slack in global supply. Irene Tunkel Chief Strategist, US Equity Strategy irene.tunkel@bcaresearch.com Footnotes 1 CFRA, Upstream & Downstream Energy Survey, January 2022. 2 https://www.eia.gov/outlooks/steo/ 3 Please see Key Themes for the Global Energy Economy in 2022 published by the Oxford Institute for Energy Studies on January 18, 2022. 4 Today, operators develop their acreage in a “manufacturing-style” process: First, 6-12 horizontal wells are drilled in succession on the same drilling pad, each well radiating out on a different path; then, after all the wells are drilled, the completion equipment is brought to the pad and the wells are fracked and put online in a similar assembly-line fashion. While this process is far more efficient in terms of both time and capital, allowing each active rig to drill more wells per year, it does mean that the average time lag between drilling a well and realizing production from that well takes six to eight months. 5 Federal Reserve Bank of Dallas, Survey of Executives of 122 oil and gas firms, December 8-16, 2021. Recommended Allocation
Executive Summary Inflation Expectations Likely Too Low
Inflation Expectations Likely Too Low
Inflation Expectations Likely Too Low
Inverted term structures for industrial commodities likely are being interpreted as forecasts of lower prices. This leads investors to assume the real economy will not be a source of persistent inflationary pressure. This is misguided: Backwardations (i.e., inverted forward curves) are evidence of tight markets facing severe upside price pressures, not lower prices ahead. Oil and base metals prices share a stronger relationship with US 5-year/5-year inflation expectations than gold, which is more correlated with short-term inflation expectations. Increases in US permanent unemployment are positively correlated with 5y5y inflation expectations. This suggests markets price in a more accommodative Fed as permanent unemployment increases, and vice versa. US PCEPI realized core inflation is negatively correlated with permanent unemployment levels, suggesting markets are pricing lower inflation as permanent unemployment rises, and vice versa. Bottom Line: Markets generally exhibit well-anchored inflation expectations. We believe these will be undone by profound backwardations in industrial commodities, which point to steadily increasing inflation pressures from the real economy to end-2023. Thereafter, oil and metals demand will continue to grow faster than supply, as the renewable-energy transition picks up steam. We remain long commodity-index exposure, and industrial-commodity producers' equity via ETFs. Feature Backwardated forward curves for industrial commodities – oil and base metals, in particular – are clear evidence these markets are pricing to severe physical supply deficits, which presently are being covered by drawing down inventories.1 These inverted term structures for industrial commodities likely are being interpreted as forecasts of lower prices, which leads investors to assume the real economy will not be a source of more permanent inflationary pressure. This is misguided, in our view: Profound inversions in the term structure of commodities (i.e., backwardations) are evidence of tight markets facing severe upside price pressures. Persistently tight supply-demand balances are keeping the forward curves of industrial commodities backwardated, as inventories are drawn down to cover physical supply deficits. These deficits are dramatically evident in oil markets (Chart 1) and copper markets (Chart 2), both of which are widely followed by investors and corporates alike. Chart 1Tight Oil Markets
Tight Oil Markets
Tight Oil Markets
Chart 2Coppers Physical Deficits Will Persist...
Coppers Physical Deficits Will Persist...
Coppers Physical Deficits Will Persist...
Higher Commodity Prices, Higher Inflation In Chart 3, we show the difference between the forecast outcome of US 5-year/5-year (US5y5y) CPI inflation expectations drawn from the CPI swap markets as a function of our internal oil-price forecasts and commodity forwards reflecting futures-contract settlements. These curves show the model based on the futures curve understates the expected path of inflation expectations versus our oil-price forecasts. When we used our higher oil price forecasts – based on the scenario where OPEC 2.0 and the US fail to increase oil supply in 2022 and 2023 – US5y5y rates tracked the increase in oil prices. The results of these forecasts show that oil prices, and more broadly, the real economy, feeds directly into inflation expectations. We modelled the US5y5y rates as a function of additional commodity prices as well – namely, copper and gold (Chart 4). The coefficients for commodity prices associated with the levels equation was always positive, irrespective of the commodity, implying that commodity prices and inflation expectations share a long-run equilibrium. We ran these regressions with nearer term forward inflation expectation rates as well, and found the direction of the relationship held.2 Chart 3Inflation Expectations Likely Too Low
Inflation Expectations Likely Too Low
Inflation Expectations Likely Too Low
Chart 4Consistent Relationships Between Commodities and Inflation Expectations
Consistent Relationships Between Commodities and Inflation Expectations
Consistent Relationships Between Commodities and Inflation Expectations
Gold Hedges Shorter-Term Inflation Expectations Gold prices had a stronger relationship to nearer-term forward inflation expectation rates than WTI and COMEX copper prices, in our modeling. On the other hand, WTI and COMEX copper prices had stronger relationships with longer-term forward inflation expectation rates than gold prices. These results suggest different commodities can be used to hedge different segments of the inflation-expectations term structure, which is a novel outcome to our modeling. This strongly suggests a portfolio of gold, copper and crude oil – using futures, commodity indices or physical assets – can hedge the inflation-expectations term structure. Labor Markets And Inflation Expectations We also modelled realized monthly inflation and US5y5y inflation expectations as a function of permanent job losses, a series maintained by the US Bureau of Labor Statistics (BLS). The coefficient associated with permanent job losses was positive (Chart 5). Increases in US permanent job losses are positively correlated with 5y5y inflation expectations. This suggests markets price in a more accommodative Fed in the future as permanent unemployment increases, and vice versa. This positive relationship holds even when WTI and copper prices are added as regressors to the equation. We also find that realized US PCEPI core inflation – the Fed's preferred gauge – is negatively correlated with permanent unemployment levels, suggesting markets are pricing lower inflation as permanent job losses increase (Chart 6). This also is intuitively appealing in the model, as it points toward the markets' assessments of Fed policy functions. Chart 5Labor Markets Also Effect Inflation Expectations
Labor Markets Also Effect Inflation Expectations
Labor Markets Also Effect Inflation Expectations
Chart 6Lower Inflation When Permanent Job Losses Rises
Lower Inflation When Permanent Job Losses Rises
Lower Inflation When Permanent Job Losses Rises
Investment Implications In earlier research, we showed commodity prices generally feed directly into realized inflation and inflation expectations (Chart 7).3 In the current report, we also showed that different commodities are better suited for hedging inflation expectations at different points along the inflation forward curve, which is a novel finding. We continue to expect the global energy transition to keep industrial commodities well bid for at least the next decade, as markets are forced to reconcile increasing demand for hydrocarbons and base metals with flat to declining supplies. On top of this, as we have noted in the past, there is a growing list of exogenous threats to the supply side. Among them are the election of left-of-center governments in important commodity-producing states, which have campaigned on redistributionist agendas; climate activism at the board level at major energy suppliers and in the courtroom, and mounting calls for still-undefined ESG compliance. Chart 7Commodity Indices Move Closely With Inflation Expectations
Commodity Indices Move Closely With Inflation Expectations
Commodity Indices Move Closely With Inflation Expectations
All of these threats – not to mention increasing geopolitical threats globally – add uncertainty to the evolution of commodity markets and increase the costs of producing commodities. As supply curves become more inelastic, higher prices for these commodities will be required to allocate capital and ration demand. We remain long commodity-index exposure, and industrial-commodity producers' equity via ETFs. Robert P. Ryan Chief Commodity & Energy Strategist rryan@bcaresearch.com Ashwin Shyam Research Associate Commodity & Energy Strategy ashwin.shyam@bcaresearch.com Commodities Round-Up Energy: Bullish US liquified natural gas (LNG) exports surged to an average of 11.2 Bcf/d last month, an 8% increase from the 10.4 Bcf/d shipped ex-US in 4Q21, according to the US EIA. Continued strength in Asia and Europe were responsible for the increase. The EIA cited the low level of European inventories for the sharp move higher. We have been expecting European demand to remain strong coming out of winter, as inventories are rebuilt (Chart 8). Exports are expected to average 11.3 Bcf/d this year, or 16% above 2021 levels. Base Metals: Bullish LME aluminum prices hit their highest since 2008, on the back of low inventory levels and supply disruptions (Chart 9). Industrial metals generally are facing tight markets, with nickel hitting a decade high earlier this year. Towards the end of last year, Zinc prices started rising and are now closing in on the decade high seen in October 2021. Low inventories of these metals in different parts of the world are backwardating forward curves and causing prices to rise. For example, according to data from World Bureau of Metal Statistics, Zinc LME stocks were only at 1,650 tons in December in Europe. Reduced supply and refining activity in Europe and China, have contributed to these markets’ tightness. In Europe, high power prices have caused smelters to stop production, while in China, refining activity has fallen due to the country’s zero-COVID tolerance policy. Precious Metals: Bullish According to the Australian Department of Industry, Science, Energy and Resources, the semiconductor chip shortage is expected to result in 7.7 million fewer vehicles being made in 2021. According to data from SFA Oxford via Heraeus, in 2021, automotive demand is forecast to constitute 80% of total palladium demand. The underperforming automotive sector, which makes up a significant chunk of palladium demand, led to Palladium being one of the worst performing commodities in 2021. The chip shortage will persist into 2022, pressuring automotive demand for platinum and palladium. Weak auto production will affect platinum to a lesser extent, since demand from automotive manufacturing constitutes just ~30% of total demand. Recently, however, palladium prices rose on geopolitical uncertainty arising from the escalating Russia-Ukraine conflict. Russia constitutes ~ 43% of global palladium production. Chart 8
Commodities Unmoor Inflation Expectations
Commodities Unmoor Inflation Expectations
Chart 9
Aluminum Hitting Highs
Aluminum Hitting Highs
Footnotes 1 Chart on p. 1 (Chart 3 below) shows the impact the backwardation in crude oil has on forecasted US 5-year/5-year inflation expectations in Model Output 2. The backwardation in Model Output 3 lowers the US5y5y estimate, while our forecast for higher prices raises the inflation expectation. We have written at length on this topic, most recently in our reports of on January 27, 2022, Short Squeezes In Copper, Nickel Highlight Tight Metals Markets, on January 6, 2022, Persistent Inflation Pressures From Commodities and on November 4, 2021, in a report entitled Despite Weaker Prices Crude Oil Backwardation Will Persist. These reports are available at ces.bcaresearch.com. 2 COMEX copper and WTI oil futures are stronger regressors in explaining US5y5y – i.e., their shared long-term trend (i.e., cointegration) is stronger (statistically speaking) than gold futures. This is particularly evident in the regressions of US5y5y employing realized CPI monthly inflation and US real exchange rates as additional explanatory variables in the equations using the industrial-commodity prices. It is worthwhile noting that the 3-year forward WTI futures contract as a lone regressor for US5y5y inflation expectations continues to produce some of the strongest results in our modelling exercise. Indeed, as a sole regressor, it dominates the other models. 3 Please see More Commodity-Led Inflation On The Way and Persistent Inflation Pressures From Commodities published on December 9, 2021 and on January 6, 2022, respectively. Both are available at ces.bcaresearch.com. Investment Views and Themes Strategic Recommendations Trades Closed in 2021
Image
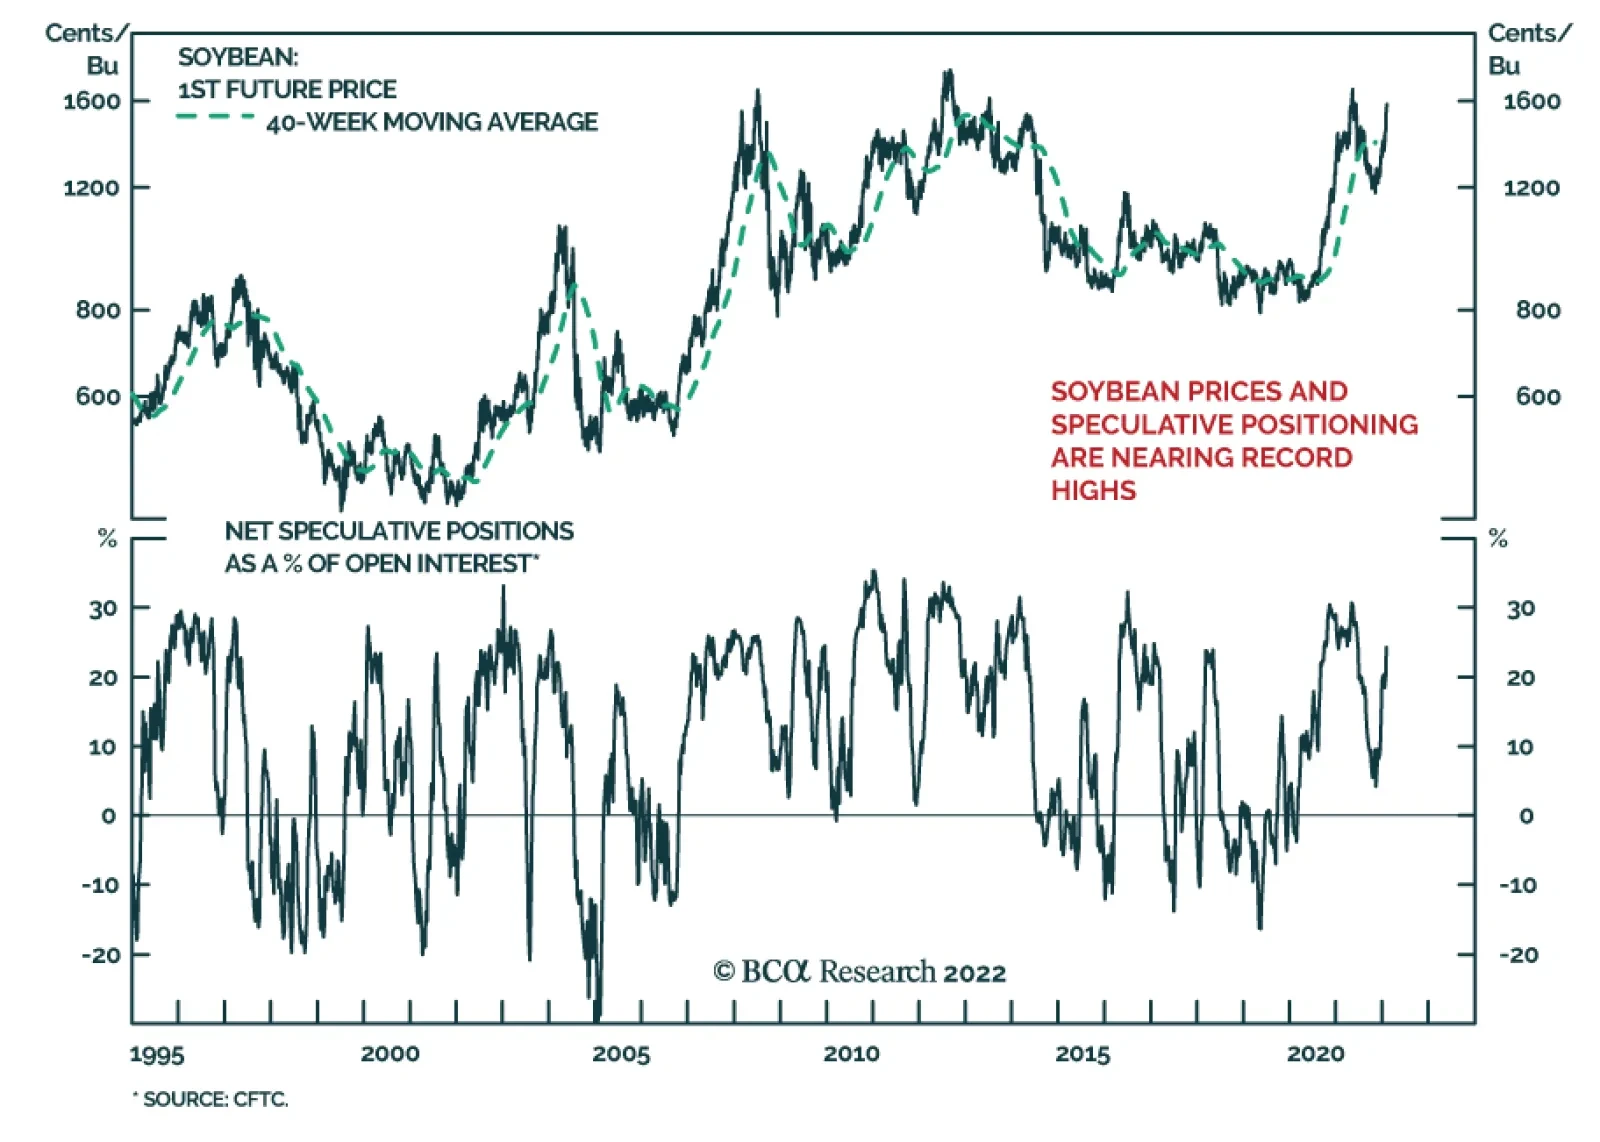
The price of soybean is once again surging. It is up 33% since early November, bringing it to less than 3% shy of last May’s peak and 11% below all-time highs of September 2012. The source of the latest rally is poor weather conditions in South America.…
BCA Research is proud to announce a new feature to help clients get the most out of our research: an Executive Summary cover page on each of the BCA Research Reports. We created these summaries to help you quickly capture the main points of each report through an at-a-glance read of key insights, chart of the day, investment recommendations and a bottom line. For a deeper analysis, you may refer to the full BCA Research Report. Executive Summary Risk Premium In EU Gas Prices
Long-Term EU Gas Volatility Will Increase
Long-Term EU Gas Volatility Will Increase
Regardless of whether Russia invades all, part of or none of Ukraine again, its current standoff with the West will force the EU to reconfigure its gas markets to assure reliability of supplies, and remove geopolitical supply disruptions. We expect the EU's renewable energy taxonomy scheduled for release Wednesday will include natgas as a sustainable fuel, which will help build more diversified sources of supply and deeper spot and term markets. Success here will increase market share of natgas in EU power generation. In the short run (1-2 years), neither the EU nor Russia can afford Gazprom's pipeline supplies to be significantly curtailed. Over the medium term (3-5 years), alternative supplies from US and Qatari LNG exports will be required to deepen EU gas-market liquidity and supply. Longer term (i.e., beyond 2025), EU energy markets will remain volatile as the renewable-energy transition progresses. High and volatile natgas prices will translate into persistent EU inflation – particularly food prices, because of higher fertilizer costs, and base metals' prices. Shortages in these markets will slow the energy transition, and raise its price tag. Bottom Line: The Russian standoff with the West over Ukraine puts a higher risk premium in EU gas prices. We remain long commodity-index exposure (S&P GSCI, and COMT ETF), and the XME ETF. We are getting long the SPDR S&P Oil & Gas Exploration & Production ETF (XOP) at tonight's close. Feature We expect the EU's financial taxonomy for renewable energy scheduled for release Wednesday will include natgas as a sustainable fuel. This will help in building out more diversified sources of supply and deeper spot and term markets. Success here will increase the market share of natgas in the EU's power generation (Chart of the Week). This coincides with natural gas supply uncertainty, arising from geopolitical tensions. On the back of already-low inventory levels, European natural gas markets are forced to handicap the odds of a major curtailment of Russian pipeline gas supplies resulting from another invasion of Ukraine (Chart 2). This is keeping a significantly increased risk premium embedded in natgas prices: Russian exports to the EU account for 40% of total gas supplies. Germany is particularly exposed, as ~65% of its gas comes from Russia (Chart 3). Chart of the WeekEU Natgas Generation Will Rise In Energy Transition
Long-Term EU Gas Volatility Will Increase
Long-Term EU Gas Volatility Will Increase
BCA’s Geopolitical Strategy desk upgraded the odds of Russia invading Ukraine to 75% from 50% in its latest research report.1 Our colleagues, however, keep the probability of Russia invading all of Ukraine low. Their analysis concludes Russia will only invade a part of Ukraine, so as to argue for lighter sanctions being imposed on it by the West, as opposed to having to incur the full wrath of US and EU sanctions. The other 25% of the probability space includes a diplomatic settlement between the West and Russia. Chart 2Risk Premium In EU Gas Prices
Long-Term EU Gas Volatility Will Increase
Long-Term EU Gas Volatility Will Increase
While Russia has been trying to diversify its customer base – by increasing natgas exports to China, e.g. – data from the BP Statistical Review of World Energy shows ~ 78% of total natural gas exports (pipeline + LNG) from Russia went to the EU in 2020.2 Chart 3EU Highly Dependent On Russian Gas
Long-Term EU Gas Volatility Will Increase
Long-Term EU Gas Volatility Will Increase
In light of the fact that Russia likely will face watered-down sanctions, and the EU’s gargantuan share of total Russian exports, we do not believe Europe’s largest natural gas exporter will stop all supply to the EU now or in the near future. In case Russia does go through with its invasion, it likely will cut off natural gas supply to Ukraine, implying Europe will loose slightly more than 6% of total natgas imports as opposed to 40% in the event of a halt to all natgas exports to Europe (Chart 4). Gas consumption of the EU-27 in 2021 was ~ 500 Bcm, according to the Oxford Institute For Energy Studies (OIES). Some 85% of EU gas consumption was met by imports. Chart 4Imports Cover Most EU Gas Consumption
Long-Term EU Gas Volatility Will Increase
Long-Term EU Gas Volatility Will Increase
Can The EU Mitigate The Loss Of Russian Gas? The EU and the US have entered discussions with other countries to plug the potential 6% reduction in imports from Russia. While in theory, there is enough spare pipeline capacity to import natural gas from existing and new sources (Chart 5), practical limitations may prevent this from occurring.3 The US is working with the EU to ensure energy supply security in case Russia cuts off natural gas supply. However, as can be seen in Chart 6, Panel 1, the US currently is and likely will continue to export nearly at capacity until end-2023. Panel 2 shows global liquefaction also is nearly at capacity. Chart 5EU Gas Import Capacity Exists, But Filling It Will Be Problematic
Long-Term EU Gas Volatility Will Increase
Long-Term EU Gas Volatility Will Increase
Chart 6US LNG Export Capacity Maxed Out
Long-Term EU Gas Volatility Will Increase
Long-Term EU Gas Volatility Will Increase
While an increase in gas production at the earthquake-prone Groningen field in the Netherlands is theoretically viable, it will induce a public backlash, as was evidenced when the Dutch government announced plans to double output from the field earlier this year. In the short run, facing few sources of alternate gas supply, the EU will need to focus on curtailing demand. Fossil fuels will need to be considered as an alternative for electricity and heating, since nuclear is not used in all EU countries. The depth of this crisis and the Dutch TTF price rise will be capped by the fact that we expect the EU to lose a relatively small fraction of total imports. Further, while we expect Dutch TTF prices to be volatile and face upward pressure, any price increases also will be capped by the fact that the colder-than-expected Northern Hemisphere winter has not yet materialized, and the warmer Spring and Summer months will be approaching soon. Medium-, Long-Term EU Gas Supply On the supply side, over the medium- and long-term, the EU will need to deepen and stabilize its gas supply, so that firms and households can rationally forecast and allocate spending and investment. This would include finding back-up or alternative supplies to Russian imports, which carry with them uncertain geopolitical risk. If Brussels includes natural gas as a sustainable fuel in its energy taxonomy, over the medium term (3-5 years), alternative supplies from US and Qatari LNG exports will be required to deepen EU gas-market liquidity and supply. Longer term (i.e., beyond 2025), EU energy markets will remain volatile as the renewable-energy transition progresses. Natgas will be a critical component of this transition, until utility-scale battery storage is able to support renewable generation and grid stability. We believe over the remainder of this decade, high and volatile natgas prices will translate into persistent EU inflation, as pricing pressures spill into oil and coal markets at the margin, as happened over the course of last year. This will work in the other direction as well – e.g., higher coal prices will spill over into gas and oil markets as price pressures incentivize fuel switching at the margin. Food prices will be right in the inflationary cross-hairs, given the fertilizer required to produce the grains and beans consumed globally consists mostly of natgas in urea and ammonia fertilizers (Chart 7). This will feed into higher food prices (Chart 8). Chart 7High Natgas Prices Will Show Up In High Fertilizer Prices
High Natgas Prices Will Show Up In High Fertilizer Prices
High Natgas Prices Will Show Up In High Fertilizer Prices
Chart 8… And Higher Food Prices
Long-Term EU Gas Volatility Will Increase
Long-Term EU Gas Volatility Will Increase
Base metals' prices also will be upwardly biased as natgas price volatility remains elevated. Supply shortages in natgas markets will, at the margin, slow the energy transition by reducing reliable energy supplies in the EU, forcing states to compete for back-up and replacement supply in the global LNG markets. Fuel-switching into oil, gas and coal will transmit EU gas volatility to markets globally. Tight energy and base metals markets also will feed directly into higher inflation and inflation expectations (Chart 9). Chart 9Higher Commodity Prices Will Pressure Inflation Higher
Higher Commodity Prices Will Pressure Inflation Higher
Higher Commodity Prices Will Pressure Inflation Higher
Investment Implications The standoff between the West and Russia over the latter's amassing of troops on the Ukraine border, plus the marked increase in the tempo of Russian naval operations, will keep the risk premium in EU natgas prices high. This is not a sustainable equilibrium over the medium- to long-term. We expect little if any curtailment of Russian natgas exports over the short term; however, prudence suggests EU member states will be forced to find back-up and alternative gas supplies over the medium- to longer-term, as the global renewable-energy transition gains traction. The knock-on effects from the current European geopolitical standoff are keeping EU natgas prices elevated via a higher risk premium to cover possible supply losses. This will feed into other markets – particularly metals and ags – which will feed directly into inflation and inflation expectations. We remain long commodity index exposure – the S&P GSCI and the COMT ETF – and metals producers via the XME ETF. At tonight's close, we will be getting long the SPDR S&P Oil & Gas Exploration & Production ETF (XOP). Robert P. Ryan Chief Commodity & Energy Strategist rryan@bcaresearch.com Ashwin Shyam Research Associate Commodity & Energy Strategy ashwin.shyam@bcaresearch.com Commodities Round-Up Energy: Bullish OPEC 2.0's decision to stay with its policy of returning 400k b/d every month appeared to be a foregone conclusion in the markets. In our January 2022 balances and price forecasts, we anticipated a larger increase, given the producer coalition led by Saudi Arabia and Russia has fallen significantly behind its goal of returning 400k b/d to the market monthly due to declining production among OPEC 2.0 member states ex-Gulf GCC member states, chiefly KSA, UAE and Kuwait (Iraq's exports fell in December and January; production data have not been released). In the past, KSA has said it will not make up for production shortfalls of OPEC 2.0 member states, and would abide by its production allocation. The upside risk to prices remains, in our estimation, and we continue to expect KSA and its GCC allies to increase output if production from the price-taking cohort led by the US shale-oil producers fails to materialize in over the coming months. Failure to cover production shortfalls among OPEC 2.0 member states would lift Brent prices by $6/bbl above our baseline forecast, which assumed higher production from the GCC states would be forthcoming at Wednesday's OPEC 2.0 meeting (Chart 10, brown curve). Base Metals: Bullish An environmental committee in Chile's Senate voted out a proposed bill that would, among other things, reportedly make it easier for the government to seize mines developed and operated by private companies. The proposed legislation still has a long road ahead of it, but copper prices rallied earlier in the week as this news broke. Even if the odds of the bill's passage are slim, a watered down version of the proposed legislation would markedly change the economic proposition of developing and maintaining copper mines in Chile (Chart 11). We continue to follow this closely. Chart 10
Brent Forecast Restored To $80/bbl For 2022
Brent Forecast Restored To $80/bbl For 2022
Chart 11
Bullish For Copper Prices
Bullish For Copper Prices
Footnotes 1 Please see All Bets Are Off ... Well, Some (A GeoRisk Update), published by BCA Research's Geopolitical Strategy service 27 January 2022. It is available at gps.bcaresearch.com. 2 Please see bp's Statistical Review of World Energy 2021 | 70th edition. 3 Norway, the EU’s second largest gas exporter after Russia stated that its natural gas production is at the limit. Apart from the issue of production, current LNG flows will need to be redirected from Asia and the Americas. Defaulting on long-term contracts to redirect fuel to Europe could mire exporters’ relationships with importing countries. Finally, infrastructure in the Eastern and Central section of the EU may not be equipped to receive supplies from the West, thus increasing costs and time associated with putting these systems in place. Investment Views and Themes Strategic Recommendations Trades Closed in 2021
Image
BCA Research is proud to announce a new feature to help clients get the most out of our research: an Executive Summary cover page on each of the BCA Research Reports. We created these summaries to help you quickly capture the main points of each report through an at-a-glance read of key insights, chart of the day, investment recommendations and a bottom line. For a deeper analysis, you may refer to the full BCA Research Report. In lieu of next week’s report, I will be presenting the quarterly Counterpoint webcast series ‘Where Is The Groupthink Wrong?' I do hope you can join. Executive Summary Spending on goods is in freefall while spending on services is struggling to regain its pre-pandemic trend. If spending on goods crashes to below its previous trend, then there will be a substantial shortfall in demand. The good news is that the freefall in goods spending is leading inflation. With spending on goods now crashing back to earth, inflation will also crash back to earth later this year. Underweight the goods-dominated consumer discretionary sector, and underweight semiconductors versus the broader technology sector. Sell Treasury Inflation Protected Securities (TIPS) and other overbought inflation hedges such as commodities that have not yet corrected. Overbought base metals are particularly vulnerable. Fractal trading watchlist: We focus on nickel versus silver, add tobacco versus cannabis, and update bitcoin, biotech, CAD/SEK, and EUR/CZK. As Spending On Goods Crashes Back To Earth, So Will Inflation
As Spending On Goods Crashes Back To Earth, So Will Inflation
As Spending On Goods Crashes Back To Earth, So Will Inflation
Bottom Line: As spending on goods crashes back to earth, so will inflation, consumer discretionary stocks, semiconductors, and overbought commodities. Feature The pandemic has unleashed a great experiment in our spending behaviour. After a binge on consumer goods, will there be a massive hangover? We are about to find out. The pandemic binge on consumer goods, peaking in the US at a 26 percent overspend, is unprecedented in modern economic history. Hence, we cannot be certain what happens next, but there are three possibilities: We sustain the binge on goods, at least partly. Spending on goods falls back to its pre-pandemic trend. There is a hangover, in which spending on goods crashes to below its previous trend. The answer to this question will have a huge bearing on growth and inflation in 2022-23. After The Binge Comes The Hangover… The pandemic’s constraints on socialising, movement, and in-person contact caused a slump in spending on many services: recreation, hospitality, travel, in-person shopping, and in-person healthcare. Nevertheless, with incomes propped up by massive stimulus, we displaced our spending to items that could be enjoyed within the pandemic’s confines; namely, goods – on which, we binged (Chart I-1). Chart I-1Spending On Goods Is In Freefall
Spending On Goods Is In Freefall
Spending On Goods Is In Freefall
Gradually, we learned to live with SARS-CoV-2, and spending on services bounced back. At the same time, we made some permanent changes to our lifestyles – for example, hybrid office/home working and more online shopping. Additionally, a significant minority of people changed their behaviour, shunning activities that require close contact with strangers – going to the cinema or to amusement parks, using public transport, or going to the dentist or in-person doctors’ appointments. The result is that spending on services is levelling off well short of its pre-pandemic trend (Charts I-2-Chart I-5). Chart I-2Spending On Recreation Services Is Far Below Its Pre-Pandemic Trend
Spending On Recreation Services Is Far Below Its Pre-Pandemic Trend
Spending On Recreation Services Is Far Below Its Pre-Pandemic Trend
Chart I-3Spending On Public Transport Is Far Below Its Pre-Pandemic Trend
Spending On Public Transport Is Far Below Its Pre-Pandemic Trend
Spending On Public Transport Is Far Below Its Pre-Pandemic Trend
Chart I-4Spending On Dental Services Is Far Below Its Pre-Pandemic Trend
Spending On Dental Services Is Far Below Its Pre-Pandemic Trend
Spending On Dental Services Is Far Below Its Pre-Pandemic Trend
Chart I-5Spending On Physician Services Is Far Below Its Pre-Pandemic Trend
Spending On Physician Services Is Far Below Its Pre-Pandemic Trend
Spending On Physician Services Is Far Below Its Pre-Pandemic Trend
Arithmetically therefore, to keep overall demand on trend, spending on goods must stay above its pre-pandemic trend. Yet spending on goods is crashing back to earth. The simple reason is that durables, by their very definition, are durable. Even nondurables such as clothes and shoes are in fact quite durable. Meaning that are only so many cars, iPhone 13s, gadgets, clothes and shoes that any person can binge on before reaching saturation. Indeed, to the extent that our bingeing has brought forward future purchases, the big risk is a period of underspending on goods. Countering The Counterarguments Let’s address some counterarguments to the hangover thesis. One counterargument is that some goods are a substitute for services: for example, eating-in (food at home) substitutes for eating-out; and recreational goods substitute for recreational services. So, if there is a shortfall in services spending, there will be an automatic substitution into goods spending. The problem is that the substitutes are not mirror-image substitutes. Spending on eating-in tends to be much less than on eating-out. And once you have bought your recreational goods, you don’t keep buying them! A second counterargument is that provided the savings rate does not rise, there will be no shortfall in spending. Yet this is a tautology. The savings rate is simply the residual of income less spending. So, to the extent that there is a structural shortfall in services spending combined with a hangover in goods spending, the savings rate must rise – as it has in the past two months. A third counterargument is that the war chest of savings accumulated during the pandemic will unleash a tsunami of spending. Well, it hasn’t. And, it won’t. Previous episodes of excess savings in 2004, 2008, and 2012 had no impact on the trend in spending (Chart I-6). Chart I-6Previous Episodes Of Excess Savings Had No Impact On Spending
Previous Episodes Of Excess Savings Had No Impact On Spending
Previous Episodes Of Excess Savings Had No Impact On Spending
The explanation comes from a theory known as Mental Accounting Bias. This points out that we segment our money into different ‘mental accounts’. And that the main factor that establishes whether we spend our money is which mental account it resides in. The moment we move money from our ‘income’ account into our ‘wealth’ account, our propensity to spend it collapses. Specifically, we will spend most of the money in our ‘income’ mental account, but we will spend little of the money in our ‘wealth’ mental account. Hence, the moment we move money from our income account into our wealth account, our propensity to spend it collapses. Still, this brings us to a fourth counterargument, which claims that even though the ‘wealth effect’ is small, it isn’t zero. Therefore, the recent boom in household wealth will bolster growth. Yet as we explained in The Wealth Impulse Has Peaked, the impact of your wealth on your spending growth does not come from your wealth change. It comes from your wealth impulse, which is fading fast (Chart I-7). Chart I-7The 'Wealth Impulse' Has Peaked
The 'Wealth Impulse' Has Peaked
The 'Wealth Impulse' Has Peaked
Analogous to the more widely-used credit impulse, the wealth impulse compares your capital gain in any year with your capital gain in the preceding year. It is this change in your capital gain – and not the capital gain per se – that establishes the growth in your ‘wealth effect’ spending. Unfortunately, the wealth impulse has peaked, meaning its impact on spending growth will not be a tailwind. It will be a headwind. As Spending On Goods Crashes Back To Earth, So Will Inflation, Consumer Discretionary Stocks, And Overbought Commodities In the fourth quarter of 2021, US consumer spending dipped to below its pre-pandemic trend and the savings rate increased. Begging the question, how did the US economy manage to grow at a stellar 6.7 percent (annualised) rate? The simple answer is that inventory restocking contributed almost 5 percent to the 6.7 percent growth rate. In fact, removing inventory restocking, US final demand came to a virtual standstill in the second half of 2021, growing at just a 1 percent (annualised) rate. Growth that is dependent on inventory restocking is a concern because inventory restocking averages to zero in the long run, and after a massive positive contribution there tends to come a symmetrical negative contribution. If, as we expect, spending on services fails to catch up to its pre-pandemic trend while spending on goods falls back to its pre-pandemic trend, then there will be a demand shortfall. And if there is a hangover, in which spending on goods crashes to below its previous trend, then the demand shortfall could be substantial. As inflation crashes back to earth, so will overbought commodities. The good news is that the freefall in durable goods spending is leading inflation. In this regard, you might be surprised to learn that the US core (6-month) inflation rate has already been declining for five consecutive months. With spending on goods now crashing back to earth, inflation will also crash back to earth later this year (Chart I-8). Chart I-8As Spending On Goods Crashes Back To Earth, So Will Inflation
As Spending On Goods Crashes Back To Earth, So Will Inflation
As Spending On Goods Crashes Back To Earth, So Will Inflation
Sell Treasury Inflation Protected Securities (TIPS) and other overbought inflation hedges such as commodities that have not yet corrected. Given that the level (rather than the inflation) of commodity prices is irrationally tracking the inflation rate, the likely explanation is that investors have piled into commodities as a hedge against inflation. Hence, as inflation crashes back to earth, so will overbought commodities (Chart I-9). Overbought base metals are particularly vulnerable. Chart I-9Overbought Commodities Are Particularly Vulnerable
Overbought Commodities Are Particularly Vulnerable
Overbought Commodities Are Particularly Vulnerable
Fractal Trading Watchlist This week we focus on nickel versus silver, add tobacco versus cannabis, and update bitcoin, biotech, CAD/SEK, and EUR/CZK. To reiterate, overbought base metals are vulnerable, and the 70 percent outperformance of nickel versus silver through the past year has reached the point of fractal fragility that signalled previous major turning-points in 2014, 2016, 2018, and 2020 (Chart I-10). Accordingly, this week’s recommended trade is to go short nickel versus silver, setting the profit target and symmetrical stop-loss at 20 percent. Chart I-10Short Nickel Versus Silver
Short Nickel Versus Silver
Short Nickel Versus Silver
A Potential Switching Point From Tobacco Into Cannabis
A Potential Switching Point From Tobacco Into Cannabis
A Potential Switching Point From Tobacco Into Cannabis
Bitcoin's 65-Day Fractal Support Is Holding For Now
Bitcoin's 65-Day Fractal Support Is Holding For Now
Bitcoin's 65-Day Fractal Support Is Holding For Now
Biotech Approaching A Major Buy
Biotech Approaching A Major Buy
Biotech Approaching A Major Buy
CAD/SEK Approaching A Sell
CAD/SEK Approaching A Sell
CAD/SEK Approaching A Sell
EUR/CZK At A Bottom
EUR/CZK At A Bottom
EUR/CZK At A Bottom
Dhaval Joshi Chief Strategist dhaval@bcaresearch.com Fractal Trading System
After The Pandemic Binge Comes The Pandemic Hangover...
After The Pandemic Binge Comes The Pandemic Hangover...
After The Pandemic Binge Comes The Pandemic Hangover...
After The Pandemic Binge Comes The Pandemic Hangover...
6-Month Recommendations Structural Recommendations Closed Fractal Trades Indicators To Watch - Bond Yields Chart II-1Indicators To Watch - Bond Yields ##br##- Euro Area
Indicators To Watch - Bond Yields - Euro Area
Indicators To Watch - Bond Yields - Euro Area
Chart II-2Indicators To Watch - Bond Yields ##br##- Europe Ex Euro Area
Indicators To Watch - Bond Yields - Europe Ex Euro Area
Indicators To Watch - Bond Yields - Europe Ex Euro Area
Chart II-3Indicators To Watch - Bond Yields ##br##- Asia
Indicators To Watch - Bond Yields - Asia
Indicators To Watch - Bond Yields - Asia
Chart II-4Indicators To Watch - Bond Yields ##br##- Other Developed
Indicators To Watch - Bond Yields - Other Developed
Indicators To Watch - Bond Yields - Other Developed
Indicators To Watch - Interest Rate Expectations Chart II-5Indicators To Watch - Interest Rate Expectations
Indicators To Watch - Interest Rate Expectations
Indicators To Watch - Interest Rate Expectations
Chart II-6Indicators To Watch - Interest Rate Expectations
Indicators To Watch - Interest Rate Expectations
Indicators To Watch - Interest Rate Expectations
Chart II-7Indicators To Watch - Interest Rate Expectations
Indicators To Watch - Interest Rate Expectations
Indicators To Watch - Interest Rate Expectations
Chart II-8Indicators To Watch - Interest Rate Expectations
Indicators To Watch - Interest Rate Expectations
Indicators To Watch - Interest Rate Expectations