Commodities & Energy Sector
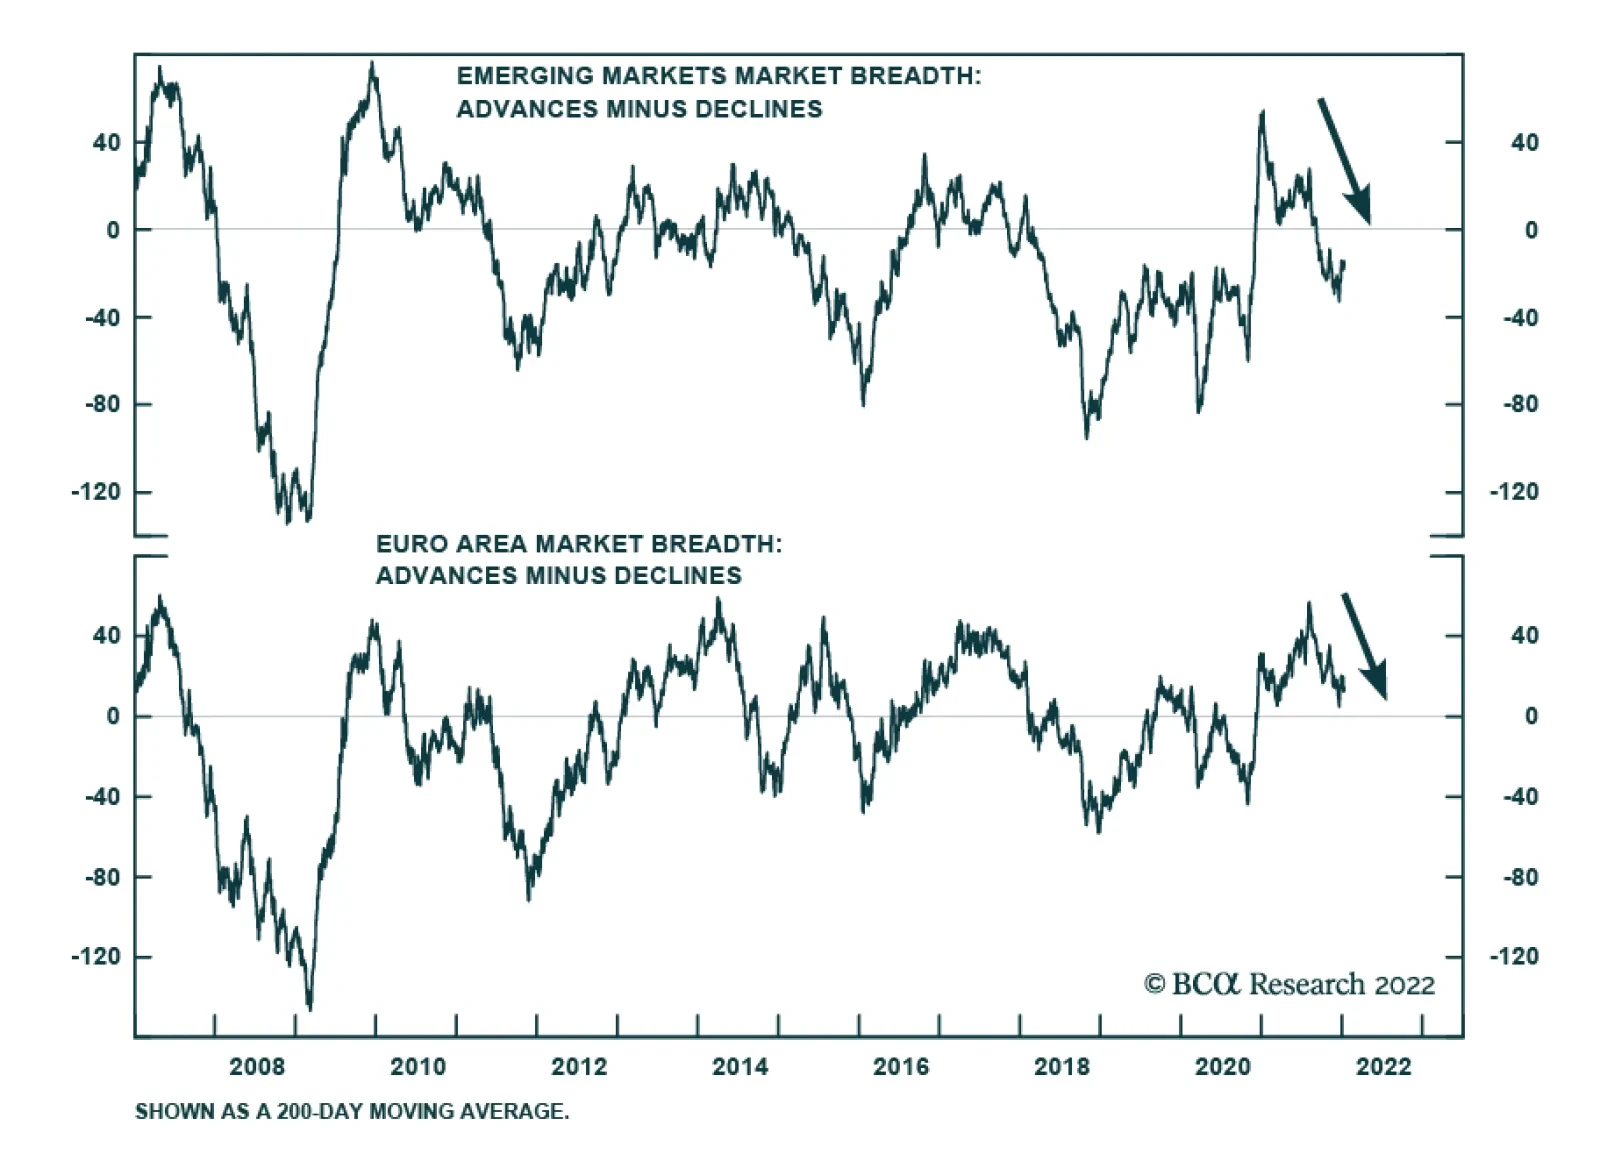
US stocks are not alone experiencing deteriorating market breadth. The chart above highlights that equity market performance has also narrowed among non-US stocks. Emerging market equities experienced a sharp drop in breadth over the course of last year.…

Highlights Data from the UK revealed it is tantalizingly close to declaring COVID-19 an endemic virus, indicating Britain likely will exit the pandemic ahead of other states soon. The UK is a bellwether market regarding its public-health response to the coronavirus. Some 95% of its population is estimated to carry COVID-19 antibodies (Chart of the Week). Other states – e.g., the US, the EU – have followed the UK with a lag, which we expect will continue. While the Fed's reassurance it will be able to hike rates without disrupting labor markets no doubt encourages markets – and boosted commodity prices – we believe the return to economic normalcy that would be ushed in by endemicity will release pent-up consumer demand for goods and services. This will spur commodity demand. If COVID-19 becomes endemic in enough economies globally, it also would fuel inflation, and inflation expectations.1 Given the tight supplies of industrial commodities – chiefly oil, natural gas and base metals – our assessment of upside price risk is higher now than it was at year-end 2021. We remain long broad-based commodity exposure via the COMT ETF, the PICK ETF, and the S&P GSCI index. Feature Fed Chair Powell's confidence that the US central bank will raise rates and keep inflation under control without destabilizing labor markets stole the show earlier this week. The media credited Powell's remarks for the burst of enthusiasm that lifted commodities as an asset class higher. While none would gainsay the Fed's importance to commodity markets, we would point out the approaching endemicity of COVID-19 in the UK – and the likely follow-on from the US and other large commodity-consuming states – is of equal, if not greater, moment. The UK has been out in front on its public-health response to the COVID-19 pandemic and has become a bellwether in the northern hemisphere; the US will follow.
Chart 1
This week, the UK's Office for National Statistics (ONS) reported ~ 95% of England's population tested positive for antibodies to COVID-19 via infection or vaccination in the week beginning 29 November 2021. Similar results were reported for Scotland, Wales and Northern Ireland. This is generally observed in all age cohorts tracked by ONS.2 According to David Heymann of the London School of Hygiene and Tropical Medicine, "population immunity seems to be keeping the virus and its variants at bay, not causing serious illness or death in countries where population immunity is high."3 In a briefing hosted by Chatham House this week, Heymann observed, “And probably, in the UK, it’s the closest to any country of being out of the pandemic if it isn’t already out of the pandemic and having the disease as endemic as the other four coronaviruses” currently in circulation, which are responsible for roughly a quarter of common colds.4 Based on UK government data, the ratios of hospitalizations and deaths to COVID-19 cases has been falling precipitously (Chart 2). This is encouraging, given the sharp increase in cases driven by the rapid spread of the omicron mutant, which appears to be rolling over. Medical experts in the UK suggest the data also point to a possible peaking in the omicron surge. This would lighten the load on hospitals, as well as reduce death rates attributed to the coronavirus (Chart 3).5
Chart 2
Chart 3
Return To Normal? Nothing will return commodity markets to economic normalcy faster than endemicity. If this stays on track over the next month or so, it will spur commodity demand sooner rather than later, as pent-up consumer demand for goods and services is discounted by trading markets. If, as the data appear to indicate, the UK's transition from pandemic to endemic COVID-19 is followed by other states like the US and EU a few months later, we would expect a renewed leg up in the post-pandemic commodities rally. This would be apparent in futures contracts, which already are pricing commodity deliveries a month or more hence. Such a turn of events would force us to accelerate our time table for oil-demand recovery, which we expect will come in 2H22. This could restore our $80/bbl forecast for 2022, and lift our 2023 expectation. We also would have to revisit our copper and base metals view, and bring forward the timing of the copper-price rally we expect will lift COMEX refined copper to $4.80/lb and $6.00/bbl in 2022 and 2023, respectively, on average.6 These industrial commodities would see demand increase amid extremely tight supply conditions. Oil markets are tightening on the back of OPEC 2.0's production discipline, and the inability of many member states to fully restore the 400k b/d every month it signed on for beginning in August of last year, owning to production shortfalls outside the core producers of the coalition (Chart 4). Copper, the base-metals bellwether, remains very tight, as seen in balances (Chart 5) and inventories (Chart 6). Chart 4OPEC 2.0s Strategy Works
OPEC 2.0s Strategy Works
OPEC 2.0s Strategy Works
Chart 5Coppers Physical Deficits Will Persist...
Coppers Physical Deficits Will Persist...
Coppers Physical Deficits Will Persist...
Chart 6Globally, Exchange Warehouses Tighten
Globally, Exchange Warehouses Tighten
Globally, Exchange Warehouses Tighten
China's zero-COVID-19 policy, which has resulted in numerous lock-downs at the local level, has yet to dent oil demand, which, for the time being, is hovering ~ 16mm b/d. We will be updating our oil balances and price forecasts next week, and will have a more extensive analysis of supply-demand balances then. Return Of Speculative Interest Expected With Endemicity Hedge funds have been reducing their exposure to the industrial commodities over the past year, which suggests they either have better alternatives for investing, or did not believe the rallies in commodities over the past year were durable, given the repeated demand shocks visited upon these markets by COVID-19 (Chart 7). We expect that once the pandemic becomes endemic, hedge funds will return to these markets. All the same, given the higher likelihood of price rallies in these markets, we would expect hedge funds to be cited as a cause of higher prices, as typically happens when markets take a sharp leg higher. Regular readers of our research are aware that this generally is not the case – hedge funds follow the news; they don't lead it. This past week we revisited earlier research to see if hedge-fund involvement in commodity markets causes the prices to go up or down to any meaningful degree. And, again, we found no relationship between hedge-fund positioning and the level of commodity prices.7
Chart 7
The presumed influence of hedge funds has been a persistent feature of futures markets in the post-GFC world, following the collapse of commodity prices along with financial markets in 2008. An entire literature has sprung up to explore the influence of these funds on commodity price formation. Below we highlight a few representative articles consistent with our results. Büyüksahin and Harris (2011) show hedge funds and other speculators follow prices – they do not lead them – based on the Granger-causality testing they performed on oil prices and speculative positioning.8 Brunetti et al (2016) argue hedge funds' trading stabilizes markets – i.e., they provide a bid when markets are selling off and an offer when markets are well bid – while swap-dealer trading is uncorrelated with price volatility.9 Knittel and Pindyck (2016) found speculation has reduced volatility in prices since 2004, including during the 2007-08 price run-up.10 Using a straightforward supply-demand-inventory model, they examined cash and storage markets to determine whether speculation had any effect on them or on convenience yields based on cash-vs-futures spreads. They concluded: "We found that although we cannot rule out that speculation had any effect on oil prices, we can indeed rule out speculation as an explanation for the sharp changes in prices beginning in 2004. Unless one believes that the price elasticities of both oil supply and demand are close to zero, the behavior of inventories and futures-spot spreads are simply inconsistent with the view that speculation has been a significant driver of spot prices. If anything, speculation had a slight stabilizing effect on prices." Investment Implications Assuming the UK remains a bellwether for DM economies with reasonably effective vaccine programs, or which have experienced an omicron surge, markets could be close to exiting the COVID-19 pandemic and entering a phase in which the coronavirus is endemic. This would be bullish for demand. And given the extended tightness on the supply side for industrial commodities in particular, it could presage another leg up in prices as economic normalcy returns. We continue to favor broad-based commodity exposure via the COMT ETF, the PICK ETF, and the S&P GSCI index. Robert P. Ryan Chief Commodity & Energy Strategist rryan@bcaresearch.com Ashwin Shyam Research Associate Commodity & Energy Strategy ashwin.shyam@bcaresearch.com Commodities Round-Up Energy: Bullish US LNG baseload and peak liquification capacity is expected to rise ~ 13% this year to 11.4 Bcf/d and 13.8 Bcf/d (on a December-to-December basis), based on the EIA's latest estimates. The agency's forecast for LNG exports is up 17.3% to 11.5 Bcf/d this year, and 12.1 Bcf/d in 2023. With these increases in baseload and peak export capacity, the US is set to become the largest exporter of LNG in the world this year, in the EIA's estimation. This will be integral to US foreign policy, particularly in markets where the US competes with Russia for export sales, in our estimation. Within North America, US pipeline gas exports to Mexico and Canada are expected to average just under 9 Bcf/d this year, a 5% increase vs. 2021, and 9.2 Bcf/d in 2023. Base Metals: Bullish In China, seasonally low production, as stainless-steel firms undergo maintenance, and the upcoming Winter Olympics in February are keeping steel production subdued. To compound this supply shortage, tight raw material markets, particularly that of iron ore and nickel are buoying steel prices. Heavy rainfall in southern-eastern Brazil is curtailing iron ore production in the region. After Australia, Brazil is the second largest iron ore exporter to China. Nickel prices hit a 10-year high on Tuesday on the back of falling inventories. An LME outage also precipitated the price rise. Dwindling inventories point to increasing demand for the metal as electric vehicle companies ramp-up production and sales this year, particularly in China, where the government stated it will remove EV subsidies by the end of 2022. According to The China Passenger Car Association, EV sales in the country will double to 6 million this year. Precious Metals: Bullish Based on the December FOMC minutes, the markets are now pricing in a more hawkish tilt from the Fed, and expect an initial rate hike by March. The Fed may also shrink its balance sheet soon after the initial rate hike, in line with its expectation the U.S. economy will recover faster this time around. While higher nominal interest rates and tighter monetary policy will increase the opportunity cost of holding gold (Chart 8), the commodity-driven inflation we expect this year – especially if COVID-19 becomes endemic across major economies – will buoy demand for the yellow metal as an inflation hedge. An endemic virus this year will also boost physical gold demand from China and India.
Chart 8
Footnotes 1 Please see More Commodity-Led Inflation On The Way, which we published on 9 December 2021. 2 Please see Coronavirus (COVID-19) latest insights: Antibodies, published by the ONS on December 23, 2021. 3 Please see Covid-19: UK ‘closest of any country in northern hemisphere to exiting pandemic’, published on January 11, 2022 by msn.com. 4 Please see What four coronaviruses from history can tell us about covid-19, published by newscientist.com on April 29, 2020. 5 Please see Omicron may be headed for a rapid drop in US and Britain, published by msn.com on January 11, 2022 published by msn.com. 6 Please see 2022 Key Views: Past As Prelude For Commodities, which we published on December 16, 2021. 7 We ran cointegrating regressions – using DOLS and ARDL models – to check for any equilibrium between prices and hedge fund positioning and found none. We looked at the post-GFC period from 2010 to now, since this is the data the US Commodity Futures Trading Commission (CFTC) provides for hedge funds and tested whether hedge-fund positions (in the form of open interest) explained prices vs. the alternative (i.e., prices explain hedge-fund positioning). We again found prices explain position (and not vice versa) for crude oil, natural gas, copper and gold. 8 Please see Büyüksahin, Bahattin and Jeffrey H. Harris (2011),"Do Speculators Drive Crude Oil Futures Prices?" The Energy Journal, 32:2, pp. 167-202. This paper used unique data sets provided by the CFTC. 9 Please see Brunetti, Celso, Bahattin Büyüksahin, and Jeffrey H. Harris (2016), "Speculators, Prices, and Market Volatility," Journal of Financial and Quantitative Analysis, 51:5, pp. 1545-74. 10 Please see Knittel, Christopher R. and Robert S. Pindyck (2016), "The Simple Economics of Commodity Price Speculation," American Economic Journal: Macroeconomics 8:2, pp. 85–110. Investment Views and Themes Strategic Recommendations Trades Closed In 2021
Image
Highlights This week we highlight key charts for US Political Strategy themes and views in the New Year. For H1 2022, we maintain a pro-cyclical, risk-on approach. We favor industrials, energy, infrastructure, and cyclicals. Foreign supply kinks will persist due to Omicron. The US Congress will pass one more spending bill as Democrats try to save their skin ahead of the midterm election. Yet other trends are not so inflationary: Fed rate hikes, an 8% of GDP fiscal drag, and a looming return to congressional gridlock. Midterm elections usually see defensive and growth stocks outperform cyclical and value stocks. This is a risk to our view and may require adjustments later this year. Feature This week we offer our updated US Political Strategy chart pack for the new year. Inflation and stagflation are the top concerns. But the Federal Reserve is kicking into gear, with the market now expecting three-to-four interest rate hikes in 2022 alone. We doubt that will come to pass but it is possible and there is no question that a 12-month core PCE print of 4.7% is forcing the Fed to move. Since the mega-stimulus of March 2020, markets have seen a 91% rally in the S&P 500 and a 114% rally in the tech sector. Ultra-low interest rates and stay-at-home policies created a paradise for tech stocks. But the 10-year Treasury yield surged from 1.45% in December, when Omicron emerged and the Fed turned hawkish, to 1.76% today. An inflation-induced pullback and rotation out of tech stocks was to be expected and has been our most consistent sectoral view. Long-term inflation expectations have not taken off, however. Many investors see secular stagnation over the long run – and even in the short run the resilient dollar should work against inflation. Not only will the Fed wind down asset purchases by $30bn a month starting January 2022 and start hiking rates in March, but also the budget deficit is contracting, making for an 8% of GDP fiscal drag in 2022. In addition the market no longer has any confidence that Congress will pass President Biden’s “Build Back Better” plan. We still think a reconciliation bill will pass, albeit in watered down form. But ultimately the looming midterm election will paralyze Congress, as we argued in our 2022 outlook report, “Gridlock Begins Before The Midterms.” Gridlock will ensure that whatever passes only modestly expands the long-term deficit and then that fiscal taps will be turned off in 2023. In the context of Fed hikes, this should reduce fears of inflation later in 2022, though we still see inflation as a persistent long-term problem. If history is any guide, stocks and bond yields will be flattish for most of the year due to election uncertainty. The difference between this year and other midterm years is that the US consumer is in better financial shape and yet foreign supply kinks will persist due to Omicron. The takeaway is to prefer industrials, energy, small caps, and cyclicals, even though we may not maintain these recommendations for the whole year. We are hedging by staying long health care stocks. Omicron: Less Relevant At Home, More Relevant Abroad American economic growth is declining but will likely settle at or above trend (Chart 1A). Money growth, a proxy for stimulus, is also coming off its peaks while credit growth is rising moderately. The long deleveraging of the American consumer since 2008 appears to have come to an end. But it is too soon to say how aggressively Americans will lever back up and whether a new private sector “debt super cycle” will begin (Chart 1B). Chart 1AEconomic Growth Peaked, Will Slow To Trend
Economic Growth Peaked, Will Slow To Trend
Economic Growth Peaked, Will Slow To Trend
Chart 1BEconomic Growth Peaked, Will Slow To Trend
Economic Growth Peaked, Will Slow To Trend
Economic Growth Peaked, Will Slow To Trend
The Omicron variant of COVID-19 will have a modest negative impact early in the year. Hospitalizations are picking up in the wake of a surge in new cases following Christmas gatherings. Only 61% of Americans are fully vaccinated and only 23% have received the booster shot that is most effective against Omicron (Chart 2A & Chart 2B). Yet new deaths from the disease remain subdued and only about a fifth of those hospitalized go to the intensive care unit today.
Chart 2
Chart 2BCOVID-19 Continues But Relevance Wanes
COVID-19 Continues But Relevance Wanes
COVID-19 Continues But Relevance Wanes
Pharmaceuticals, both vaccines and anti-viral medications, are saving the day and Americans are becoming resigned to the likelihood of getting the virus at some point. Social mobility has dropped off since summer 2021 but will boom in the springtime and consumer confidence is already picking back up (Chart 3A & Chart 3B). The Biden administration is not likely to impose unpopular social restrictions during an election year unless a variant is deadlier, more contagious, and resistant to vaccines, which is not the case with Omicron. Chart 3AOmicron Not A Major Setback For Recovery
Omicron Not A Major Setback For Recovery
Omicron Not A Major Setback For Recovery
The resilience of the US will come with persistent inflation in goods given that Omicron will still cause supply disruptions abroad. Not all countries have as effective vaccines when it comes to Omicron – if they maintain tighter social restrictions, prices of imported goods will continue to rise. The Fed cannot resolve foreign bottlenecks. While manufacturing surveys show bottlenecks easing from last year’s highs, foreign supply constraints will remain a problem throughout the year. Chart 3BOmicron Not A Major Setback For Recovery
Omicron Not A Major Setback For Recovery
Omicron Not A Major Setback For Recovery
Buy The Rumor, Sell The News Of “Build Back Better” The Biden administration and Democratic Party are still likely to pass one last blast of fiscal spending – the “Build Back Better” budget reconciliation act, a social welfare bill. The output gap is virtually closed and the economy does not need new demand stimulus. However, the Democratic Party needs a legislative win ahead of the midterm election. Thin majorities in both chambers of Congress enable a single senator to derail the bill. But the bill’s provisions are popular among political independents and especially the Democratic Party’s base, which is lacking in enthusiasm about the election as things stand (Charts 4A & 4B). Moderate Democrats in the Senate are still negotiating: their goal is to chop the plan down to size and pass only the most popular provisions, rather than to sink the president and their own party.
Chart 4
Chart 4
This means the bill’s top-line spending will be further reduced. The final size should fall from the earlier range of $2.5-$4.7 trillion to $2.3 trillion or less. Add a few tax hikes, like the minimum corporate tax, and the deficit impact will be around $600 billion (Table 1). Table 1"You’ve Gotta Pass It To See What’s In It"
Chart Pack: Gridlock Now
Chart Pack: Gridlock Now
Ultimately we cannot have high conviction on the BBB plan because we cannot predict what a single senator will do. That is a matter of intelligence, not macro analysis.
Chart 5
Chart 5
But subjectively we still give 65% odds that the Democratic Party will circle the wagons and pass the bill. The party views itself as surrounded by populism on both its right and left flanks – a failure to compromise will whet the appetites of both the Sanderistas (left-wing populists) and the Trumpists (right-wing populists) (Chart 5A). The Republicans still have a better position in the states, and the states have constitutional control of elections, so establishment Democrats are more terrified than usual of flopping in the midterm elections (Chart 5B). Otherwise the midterms – which are already likely to be bad for the Democrats – will deal a devastating blow. Republicans are recovering in party affiliation and tentatively surpassing Democrats among independent voters (Chart 6A). Biden and the Democrats lashed out at former President Trump and the Republican Party on the anniversary of the January 6, 2020 rebellion, but this tactic will not lift their popularity in polls. Their current polling is not much better than that of Republicans in 2018, when the latter suffered a bruising defeat in the midterms (Chart 6B). Chart 6ADemocrats Need A Win Before The Midterm
Democrats Need A Win Before The Midterm
Democrats Need A Win Before The Midterm
Chart 6
Biden’s legislation would reduce the fiscal drag marginally in fiscal year 2023 but overall the budget deficit will shrink and then lie flat over 2022-24 regardless of what Congress does (Chart 7). New spending would be marginally inflationary over the long run since the budget deficit is expected to expand again beyond fiscal year 2024.
Chart 7
Republicans will not be able to slash the budget until they control both Congress and the White House, but in that case they are likely to prove big spenders as in the past. Populism will persist on all sides: the political establishment will keep trying to use fiscal profligacy to peel voters away from populists, who are even more fiscally profligate. Only an inflation-induced recession will restore some fiscal discipline – and that is a way off. Ultimately the significance of the BBB bill is to verify whether establishment politicians – fiscal authorities – are capable of moderating their spending plans according to the threat of inflation, as Modern Monetary Theory maintains. Otherwise the implication is that polarization and populism will produce fiscal overshoots regardless of near-term inflation, even with the narrowest of possible majorities in Congress. The latter, a BBB fiscal overshoot, is what we expect. If it happens it will probably be received negatively by the equity market, fearing faster Fed rate hikes, and it would add credibility to long-term concerns about inflation, because it would reveal that fiscal authorities are not good at adjusting in real time. The former, a BBB failure and a halt to fiscal spending, would suggest that fiscal extravagance remains a crisis-era phenomenon and will be reined in by Congress after a crisis passes, which is probably positive for equities. It would at least suggest that fiscal authorities will adjust when the facts change. Of course, how investors respond to any legislative outcome will depend on a range of factors. But the takeaway is this: Inflation fears may or may not peak in the short run but they will persist over the long run. The Fed: Focus On The Framework In the wake of the Great Recession the Federal Reserve as an institution – both the Federal Open Market Committee and the Board of Governors – shifted in a more accommodative or dovish direction (Chart 8). The shift culminated in the review of monetary policy strategy in August 2020, which produced average inflation targeting.
Chart 8
In practice the dovish policy shift is apparent in a real Fed funds rate at -4%, the lowest level since the inflationary 1970s under Fed Chair Arthur Burns. But what is more remarkable is the simultaneous surge in the budget deficit, unlike anything since World War II, and unlike anything in peacetime (Chart 9). Chart 9Inflation And Stagflation Risks
Inflation And Stagflation Risks
Inflation And Stagflation Risks
The massive increase in federal debt, from 34% of GDP in 2000 to 75% before COVID-19 and 106% today, acts as a constraint on any future Fed hawkishness (Chart 10). A Fed chair who drives interest rates too high amid high debt levels will cause a recession and force the debt-to-GDP ratio up even higher. Yet the result of low rates is to stimulate indebtedness. While the private debt super cycle has subsided, a public debt super cycle is thriving. Chart 10A Major Check On Fed Hawkishness
A Major Check On Fed Hawkishness
A Major Check On Fed Hawkishness
This brings us to today’s predicament. The Fed’s criteria for raising interest rates have mostly been met: 12-month core PCE inflation is running at 4.7% while the inflation breakeven rate in the Treasury market suggests that inflation is well anchored and likely to persist above the 2% inflation target for some time (Chart 11A). The economy is virtually at “maximum employment” (Table 2) – the Fed has set aside concerns about low labor force participation to focus on the collapsing unemployment rate, which is now within the range at which it will feed inflation (Chart 11B). Chart 11AThe Fed's Criteria For Liftoff
The Fed's Criteria For Liftoff
The Fed's Criteria For Liftoff
Table 2The Fed’s Criteria For Liftoff
Chart Pack: Gridlock Now
Chart Pack: Gridlock Now
Chart 11BThe Fed's Criteria For Liftoff
The Fed's Criteria For Liftoff
The Fed's Criteria For Liftoff
The takeaway is that the Fed is suddenly restoring the credibility of its 2% inflation target, with headline PCE rapidly coming up on the trajectory established in the wake of the Great Recession (Chart 12), as our US bond strategist Ryan Swift has demonstrated. Chart 12Lo And Behold: Debt Monetization Generates Inflation
Lo And Behold: Debt Monetization Generates Inflation
Lo And Behold: Debt Monetization Generates Inflation
The explosion of fiscal spending played a critical role in generating this new trajectory. The combination of monetary and fiscal accommodation has worked wonders. Assuming the BBB passes, Chairman Powell will face even greater pressure to prevent this correction of the inflation trajectory from overshooting and turning into a wage-price spiral. The unexpected risk would be if the BBB bill fails, the Fed hikes aggressively, global growth sputters, the dollar surges, and Republicans retake Congress — then Powell may yet see disinflationary challenges in his term in office. Our sense is that the BBB will pass, reinforcing Powell’s less dovish pivot, and yet the Fed’s framework will not permit too hawkish of a stance, resulting in persistent inflation risks over the long run. Three Strategic Themes In our annual strategic outlook, we highlighted three structural or strategic themes that are not beholden to the 12-month forecasting period: 1. Rise Of Millennials And Generation Z: The sharp drop in labor force participation will gradually mend in the wake of the crisis but the aging of the population ensures that the general trend will decline over time as the dependency ratio rises (Chart 13A). Chart 13AStrategic Theme #1: Rise Of Millennials/Gen Z
Strategic Theme #1: Rise Of Millennials/Gen Z
Strategic Theme #1: Rise Of Millennials/Gen Z
Chart 13
Politically the millennials and younger generations are gaining clout over time, although their partisan identity will also evolve as they mature and gain a greater stake in the economy and become asset owners (Chart 13B). 2. Peak Polarization: US political polarization stands at historic highs and will likely remain so over the 2022-24 political cycle (Chart 14A). Polarization coincides with the transformation of society amid falling bond yields and technological revolution (Chart 14B). Chart 14AStrategic Theme #2: Peak Polarization
Strategic Theme #2: Peak Polarization
Strategic Theme #2: Peak Polarization
Chart 14BStrategic Theme #2: Peak Polarization
Strategic Theme #2: Peak Polarization
Strategic Theme #2: Peak Polarization
The pandemic era has been especially polarized due to the 2020 election and controversies over vaccination (Chart 15).
Chart 15
Domestic terrorism of whatever stripe is possible (Chart 16). But any historic incidents will generate a majority opposed to political violence. Chart 16Risk Of Domestic Terrorism
Risk Of Domestic Terrorism
Risk Of Domestic Terrorism
True, former President Trump is still likely to run on the Republican ticket, which will ensure that polarization remains elevated (Diagram 1). However, US elections hinge on structural factors, not individuals. Diagram 1GOP 2024 Is Up To Trump
Chart Pack: Gridlock Now
Chart Pack: Gridlock Now
So far structural factors point to policy continuity: not only are Democrats still slated to retain the White House, but President Biden has coopted many of Trump’s key policies, including infrastructure, protectionism, and big budget deficits (Chart 17). If Democrats falter, Trump’s policies will be reaffirmed. The implication is that a new national policy consensus is taking shape beneath the surface.
Chart 17
3. Limited “Big Government”: Americans have been turning away from “small government” and toward “big government” since the 1990s. Voters no longer worry so much about budget discipline and instead look for the “visible hand” of government to support the economy (Charts 18A & 18B).
Chart 18
Chart 18
Both domestic populism and geopolitical challenges encourage this shift. Industrial policy and domestic manufacturing are making a comeback (Table 3). Table 3Strategic Theme #3: Limited “Big Government”
Chart Pack: Gridlock Now
Chart Pack: Gridlock Now
With extremely robust fiscal policy, the US has avoided the policy mistake of the period after the Global Financial Crisis, when premature fiscal tightening undermined the economic recovery (Chart 19). Policy uncertainty will increase as gridlock returns to Congress and fiscal policy will be frozen. But investors need not fear a slide back into deflation. The Republican Party’s populist base may prevent more Democratic social spending but they will not be able to repeal what is done. Chart 19Even With Looming Gridlock, The US Is Far From Tightening Fiscal Policy Too Soon This Time
Even With Looming Gridlock, The US Is Far From Tightening Fiscal Policy Too Soon This Time
Even With Looming Gridlock, The US Is Far From Tightening Fiscal Policy Too Soon This Time
Three Key Views For 2022 The key views for the 12-month period are connected with the above but of a more short-term or cyclical duration: 1. From Single-Party Rule To Gridlock: Republicans are highly likely to win back control of the House of Representatives and likely the Senate (Charts 20A & 20B). President Biden’s approval rating suggests that Democrats could lose 40 seats in the House (Chart 21) and three in the Senate (Chart 22), whereas they only need to lose five and one to lose control. Our quantitative Senate election model shows an even split but the model’s trend favors Republicans, as does the political cycle and partisan enthusiasm (Chart 23).
Chart 20
Chart 20
Chart 21
Chart 22
Chart 23
2. From Legislative To Executive Power: Biden may still pass one more spending bill but otherwise the legislature will be frozen. Democrats will not succeed in ramming legislation through by abolishing the Senate filibuster. Biden will turn to executive decree, where he is already on track to make a historic increase in regulation, which will increase concerns among small business (Chart 24A & Chart 24B). Anti-trust laws are unlikely to be overhauled and Democrats will struggle to bring back the tough anti-trust posture of the 1900s-1950s without new legislation, meaning that Big Tech faces a bigger threat from inflation than regulation (Table 4). The green transition will continue but primarily in the form of any subsidies passed in the reconciliation bill, rather than new taxes or any carbon pricing scheme (Chart 25A & Chart 25B). Chart 24AKey View #2: From Legislative To Executive Power
Key View #2: From Legislative To Executive Power
Key View #2: From Legislative To Executive Power
Chart 24
Table 4Key View #2: From Legislative To Executive Power
Chart Pack: Gridlock Now
Chart Pack: Gridlock Now
Chart 25
Chart 25BGreen Energy: Subsidies But No Carbon Tax
Green Energy: Subsidies But No Carbon Tax
Green Energy: Subsidies But No Carbon Tax
3. From Domestic To Foreign Policy Risks: Biden faces a slew of foreign policy and external risks that could damage the Democrats in the midterms. The surge in illegal immigration on the southern border is truly historic and will have significant policy ramifications over the long run (Chart 26A & Chart 26B). The surge in inflation will force Biden to contend with foreign policy challenges with one hand tied behind his back, since energy supply disruptions could derail his party ahead of the midterm election (Chart 27). While Biden could ease some inflationary pressure via reduced trade tariffs, protectionist impulses will prevail during an election year (Chart 28). Chart 26AKey View #3: External Risks For Biden
Key View #3: External Risks For Biden
Key View #3: External Risks For Biden
Chart 26BKey View #3: External Risks For Biden
Key View #3: External Risks For Biden
Key View #3: External Risks For Biden
Chart 27Foreign Policy Could Hit Prices At Pump
Foreign Policy Could Hit Prices At Pump
Foreign Policy Could Hit Prices At Pump
Chart 28Tariff Relief In 2022? Don't Bet On It
Tariff Relief In 2022? Don't Bet On It
Tariff Relief In 2022? Don't Bet On It
Investment Takeaways The stock market tends to be flat, with risks skewed to the downside, during midterm election years due to policy uncertainty. The same is true for bond yields (Chart 29). Chart 29Stocks And Bond Yields Trend Lower Before Midterms ...
Stocks And Bond Yields Trend Lower Before Midterms ...
Stocks And Bond Yields Trend Lower Before Midterms ...
When united or single-party governments approach midterms, stocks tend to perform worse than for divided governments in midterm years, while bond yields tend to be a bit higher (Chart 30). This trend is supercharged in 2022 due to the inflationary effects of the pandemic. Chart 30... But United Govts See Higher Bond Yields And Weaker Stocks ...
... But United Govts See Higher Bond Yields And Weaker Stocks ...
... But United Govts See Higher Bond Yields And Weaker Stocks ...
Assuming Republicans regain at least the House, the US will transition from united to divided government (gridlock). In previous such transitions, stocks tend to perform in line with the average for a midterm election year, but bond yields skew higher – reinforcing the previous point (Chart 31). Chart 31... Shift From United To Divided Govt Implies Higher Bond Yields Than Otherwise
... Shift From United To Divided Govt Implies Higher Bond Yields Than Otherwise
... Shift From United To Divided Govt Implies Higher Bond Yields Than Otherwise
We will update our US Sector Political Risk Matrix to bring it better into line with our views, particularly in light of Table 5 below regarding sector relative performance during midterm election years. Normally defensives and growth stocks outperform in midterm years, Table 5ConDisc, Tech, Health Do Best During Midterms …But Waning Pandemic Makes An Exception
Chart Pack: Gridlock Now
Chart Pack: Gridlock Now
while cyclicals and value stocks underperform, but 2022 looks to be different due to inflation. Still over the course of the year we would expect the historic trend to reassert itself. Investors should favor cyclicals even though they probably cannot outperform defensives for much longer (Chart 32A). We recommend health care stocks as a hedge given that the dollar should still be resilient this year, Fed hikes should moderate inflation expectations, and midterm policy uncertainty will eventually weigh on risk appetite (Chart 32B). Chart 32AFavor Cyclicals, Though They May Not Outperform Defensives Much Longer
Favor Cyclicals, Though They May Not Outperform Defensives Much Longer
Favor Cyclicals, Though They May Not Outperform Defensives Much Longer
Chart 32BLong Health Care As Hedge
Long Health Care As Hedge
Long Health Care As Hedge
Value stocks are forming a bottom relative to growth stocks, although this trend is less clear in the US, especially among US large caps, than it is abroad (Chart 33). We favor value over growth on a cyclical basis but midterm election uncertainties will pull the other way, making for a choppy bottom. Chart 33Favor Value And Small Caps, Though Bottom Formation Remains Choppy
Favor Value And Small Caps, Though Bottom Formation Remains Choppy
Favor Value And Small Caps, Though Bottom Formation Remains Choppy
The same process is visible on a sector basis, where energy and materials continue to outperform tech (Chart 34A). We recommend staying long energy on a cyclical basis, though its outperformance against tech could abate later in 2022. Infrastructure stocks – such as building and construction materials – also continue to outperform. Since Biden’s honeymoon period ended, the outperformance is largely relative to tech rather than the S&P as a whole. We still favor infrastructure stocks as the fiscal policy theme will continue even beyond the current legislation, which will barely start to be implemented in 2022 (Chart 34B). Chart 34AFavor Energy, Materials, And Infrastructure Versus Tech
Favor Energy, Materials, And Infrastructure Versus Tech
Favor Energy, Materials, And Infrastructure Versus Tech
Chart 34BFavor Energy, Materials, And Infrastructure Versus Tech
Favor Energy, Materials, And Infrastructure Versus Tech
Favor Energy, Materials, And Infrastructure Versus Tech
Matt Gertken Vice President Geopolitical Strategy mattg@bcaresearch.com Strategic View Open Tactical Positions (0-6 Months) Open Cyclical Recommendations (6-18 Months)
Image
Image
Image
Image
Image
Image
Image
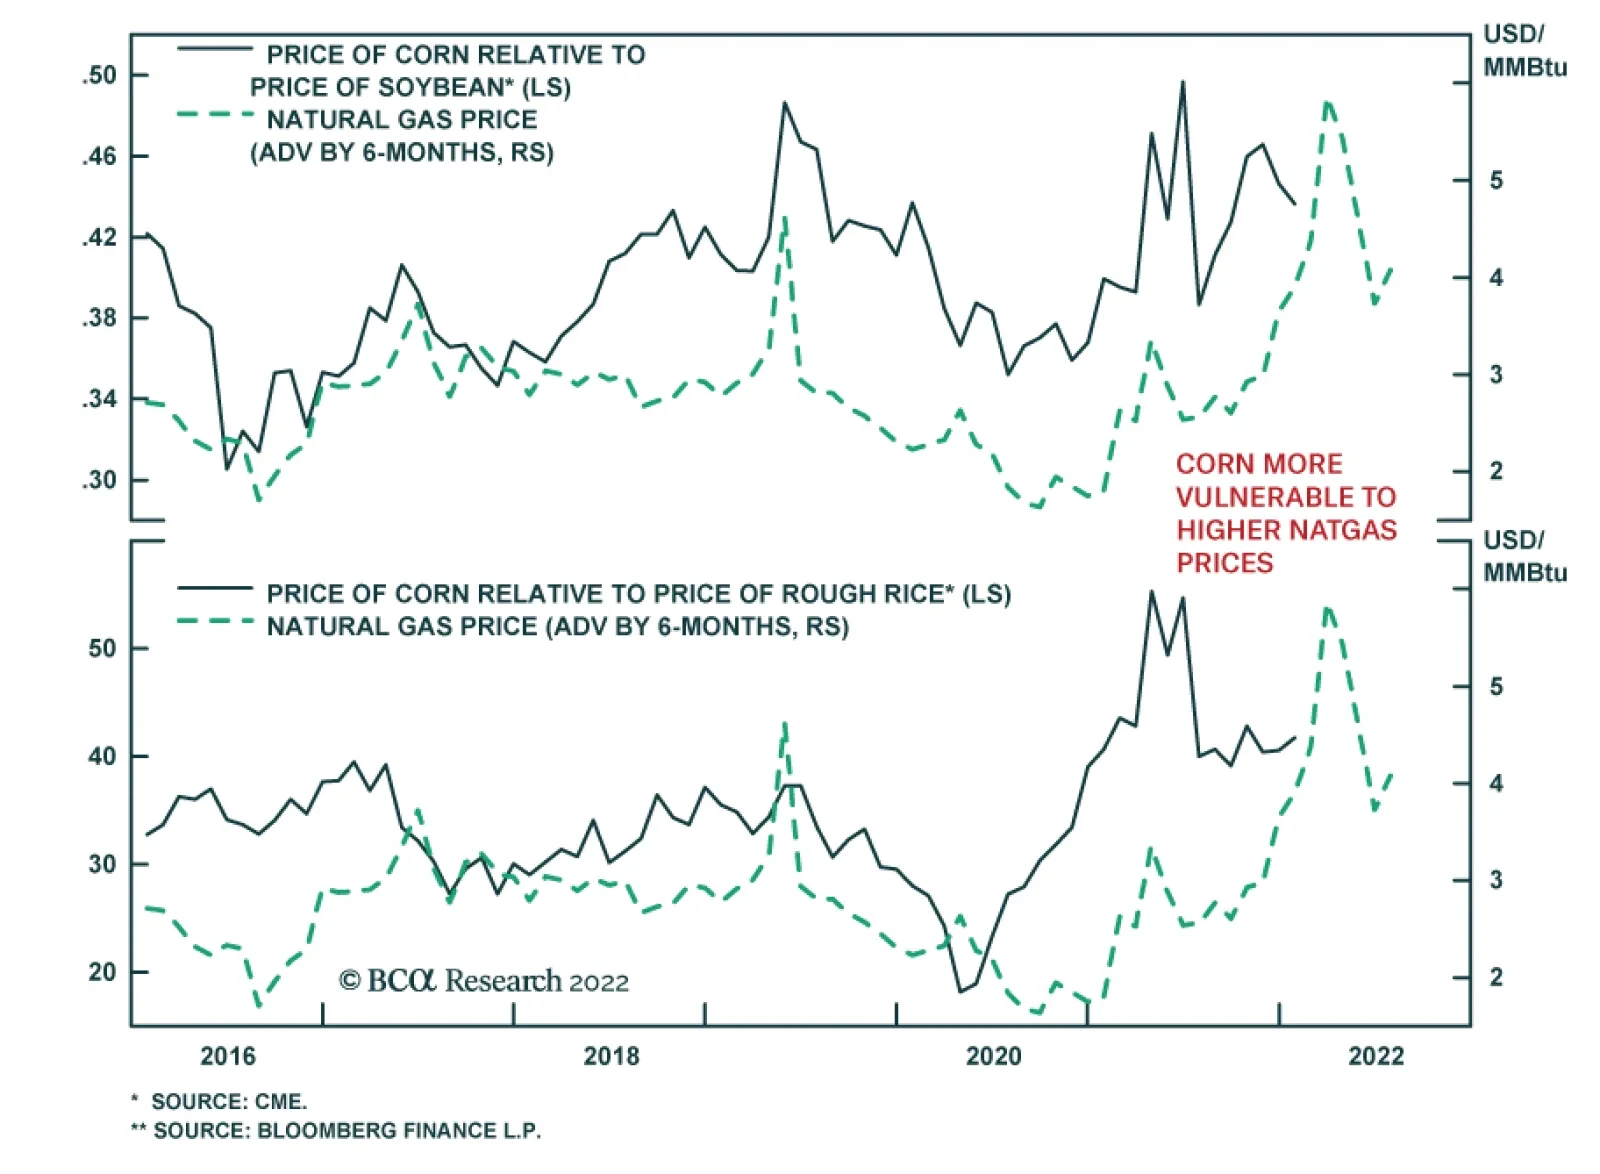
Our Commodity & Energy strategists recently highlighted that agricultural commodities are sensitive to dynamics in natural gas markets. They showed that the sharp natgas rally pushed up fertilizer prices last year. Given that fertilizer accounts for the…
Highlights European economic activity will suffer in Q1 from both the Omicron wave and elevated natural gas prices. The Omicron wave will fade quickly and its impact on growth will be short lived. The biggest economic risk related to Omicron is inflation. Inflation is being caused by supply disruptions, a function of China’s zero-tolerance policy toward COVID. An ebbing of COVID will allow cyclicals to breakout relative to defensive equities in the second quarter. Buy banks / sell tech. For the remainder of the winter, European electricity will remain expensive because of elevated natural gas prices. This process creates a drag on growth and prevents the euro from recovering. European PMIs have not yet bottomed; however, they will do so in Q2. While French and UK economic activity has led Europe in recent months, Germany and the Netherlands are likely to continue to lag as the Omicron variant is only starting there. Italian and Spanish spreads have limited upside under these circumstances. Feature At the end of 2021, the European economy was hit by a spike in COVID-19 infections and another surge in natural gas prices. These shocks will continue to affect activity in the first few months of 2022. Understanding the evolution of these shocks will help investors find attractive entry points for the dominant trend that will play out for the remainder of the year. Omicron Spikes Chart 1Omicron Is Different
Omicron Is Different
Omicron Is Different
COVID-19 cases are once again spiking across Europe because of the highly contagious Omicron variant. As Chart 1 shows, cases in the UK, France, Spain, and Italy have now eclipsed previous peaks. Cases in Germany and the Netherlands have declined recently, but this improvement reflects the ebbing Delta wave. These two countries are likely to follow the path of their European neighbors in relation to the Omicron variant. The Omicron wave will not have a lasting impact on European economic activity despite its frightening scale. Hospitalizations are rising, but they remain far from levels implied by the number of active cases in France, the UK, and Spain (Chart 1, third panel). Additionally, hospitalizations spans are shorter because the infection seems to be less virulent. Recent data out of France indicates that COVID-induced admissions in ICU are now around 18% with a median length of stay of three days, compared to roughly 30% and seven days in the previous waves. This more positive health outcome also reflects the benefit of elevated vaccination rates in the region. The evolution of the Omicron wave in South Africa also points toward a rapid turnaround of the COVID situation in Europe. Gauteng Province, where Omicron first became dominant, witnessed a sharp rise in new cases that declined less than four weeks after the outbreak began (Chart 1, bottom panel). The number of cases there thus seems to have reached its apex already. There are limited reasons to expect a different trajectory for the Omicron wave in Europe. This wave is also affecting individual behavior. Rules are now being developed to impose vaccinations on swath of the recalcitrant population in Italy and Austria, and the French president is openly defying anti-vaxxers by further limiting their daily lives. Vaccination rates are increasing and booster campaigns have rolled out successfully, as the UK illustrates. Finally, anti-viral drugs such as Pfizer Paxlovid will further limit the severity of infections of contaminated individuals. This background implies that the likelihood is low for long-lasting, severe lockdowns, such as those that prevailed in 2020 and in early 2021. As a result, the impact of the Omicron wave on economic activity and the labor market will be temporary and will wane before the end of Q1 2022. Chart 2Cyclicals Will Breakout... Eventually
Cyclicals Will Breakout... Eventually
Cyclicals Will Breakout... Eventually
Financial markets have already adopted this view, as evidenced by European equities that rallied smartly through December—until the release of the Fed’s minutes last week spooked investors. We are inclined to agree with investors and look beyond the impact of COVID at the index level. Nonetheless, as long as the wave remains in place and economic activity bears its footprint, cyclicals will not break out relative to defensives (Chart 2). Omicron, however, is not without risks. China’s commitment to its zero-tolerance policy toward COVID-19 remains firmly in place, which may prove inflationary for the global economy. Entire cities such as Xi’an and Yuzhou have been pushed into lockdowns, and, if Omicron spreads further, more cities will suffer the same fate. If it is sufficiently widespread, then this process will produce global supply-chain bottlenecks again and renew pricing pressures, especially if it expands to Chinese port cities. Investment Implications The first relevant market implication of a transitory Omicron shock is that, despite its violence and breadth, global markets will avoid a severe sell-off caused by plunging economic activity. As a corollary, cyclical stocks may continue to consolidate in the near-term against their defensive counterparts, but a breakout by the middle of 2022 remains highly likely. Chart 3Utilities Hate Ebbing Waves
Utilities Hate Ebbing Waves
Utilities Hate Ebbing Waves
Tactical traders will also soon benefit from a short-term investment opportunity. Utilities have been outperforming in recent weeks as investors bid up defensive plays. However, the pattern of previous waves indicates that, as soon as this wave of cases peaks, utilities stocks will suffer a significant period of underperformance (Chart 3). Thus, short-term investors should sell European utilities once the seven days moving average of new cases peaks in the UK. Chart 4Banks To Outperform Tech
Banks To Outperform Tech
Banks To Outperform Tech
The environment is also likely to remain favorable for banks relative to tech stocks in Europe. The recently released Fed minutes revealed that the FOMC has a strong hawkish bias and that the March meeting will be a live one. It also showed that, if Omicron proved to be inflationary because of its impact on supply chains, the Fed might be even more inclined to raise interest rates and cut its balance sheet size. Thus, a transitory Omicron shock to growth that is likely to have inflationary effects will contribute to higher yields. This will hurt tech stocks relative to banks, especially as European banks forward earnings are rising relative to the tech sector and their relative valuations are extremely favorable (Chart 4). Bottom Line: The number of COVID-19 cases in Europe is spiking rapidly, but we do not expect lengthy lockdowns to become the norm. As a result, the shock to growth caused by the Omicron variant will be ephemeral. Nonetheless, China’s health policy response points to some inflationary risks caused by supply bottlenecks. Investors should expect European markets to continue to take Omicron in stride and cyclicals to breakout later this year. Utilities are soon to be sold relative to the broad market and European banks will benefit at the expense of tech stocks. Natural Gas Remains The Euro’s Foe Chart 5Natural Gas Prices Are High And Volatile
Natural Gas Prices Are High And Volatile
Natural Gas Prices Are High And Volatile
Dynamics in the European natural gas market remain a major risk for European economic activity and European currencies over the course of the first quarter of 2022. Natural gas prices on the Title Transfer Facility in the Netherlands spiked to a record close of EUR181/MWh on December 21, 2021, as tensions with Russia rose in Ukraine. Since then, Dutch natural gas prices—the continental European benchmark—have declined by 46% (Chart 5). The following combination of factors explains this sharp retrenchment: Europe, France, and Germany in particular have enjoyed exceptionally clement weather in recent days, stifling demand for heat and electricity. 11 LNG tankers from the US have been rerouted toward Europe, accounting for 800,000 tonnes of natural gas. Tensions between Russia and the West have eased somewhat. Despite this recent decline in the price of natural gas, it remains at elevated levels. BCA’s commodity and energy strategy team expects its volatility to stay high over the remaining winter months. First, Asia is not sitting on its hands as LNG shipments shift toward Europe. Instead, a bidding war is starting in order to attract liquefied gas to the East. Second, Europe’s winter is far from over, which means that demand-boosting cold fronts are still likely. Finally, Russia is sending gas back to its territory to fulfil its own domestic needs (and probably to continue to put pressure on European nations). Chart 6European Electricity Is Dear
European Electricity Is Dear
European Electricity Is Dear
The continuation of elevated European natural gas prices and the potential for further upsides of volatility remain headwinds to European economic activity this winter, ones we deem comparable to Omicron. The main impact is via electricity prices. As Chart 6 highlights, they are still extremely high in France, Germany, and Spain. The continued surge in the price of CO2 emission quotas is increasing the pressure on electricity prices, as will the upcoming maintenance of many nuclear power plants in France. Gas consumption is contracting on a year-on-year basis in major European markets (Chart 7). This development indicates that elevated natural gas prices are already creating a supply shock to activity and sapping discretionary disposable income from households. The recent decline in European consumer confidence, despite strong employment numbers and growing net worth, confirms that households are feeling the pinch from elevated electricity and natural gas prices (Chart 8). Chart 8Consumers Feel The Pinch
Consumers Feel The Pinch
Consumers Feel The Pinch
Chart 7Gap Consumption Is Slowing
Gap Consumption Is Slowing
Gap Consumption Is Slowing
High natural gas and electricity prices also create further inflation risks for Europe. The recent spikes to 23.7% in PPI inflation and to 5% for headline CPI inflation show the effect of high-energy costs. Instead, a genuine threat would emerge if household inflation expectations followed energy prices, which could in turn trigger a wage-price spiral in Europe. We are not there yet, but the longer natural gas and electricity prices rise, the greater the likelihood of this scenario. Investment Implications The principal consequence of the strength of the European natural gas market is its euro-bearish impact. The tax on European growth is high, which delays the willingness of the ECB to remove monetary accommodation in a meaningful way. On the western shore of the Atlantic, the Fed is poised to pull the trigger soon and is now discussing a decrease in the size of its balance sheet, something the ECB is nowhere near ready to do. Consequently, although EUR/USD may be cheap and oversold on a cyclical basis, a turnaround is unlikely as long as electricity prices remain this elevated. Chart 9EUR/USD near An Existential Level
EUR/USD near An Existential Level
EUR/USD near An Existential Level
Bottom Line: European natural gas prices may have come off their Christmas boil, but they remain elevated and will likely experience major bouts of upside volatility over the remainder of the winter. Hence, the drag on growth stemming from demanding electricity prices remains intact, which negatively affects consumer confidence. The euro cannot rally meaningfully until natural gas prices mean-revert, especially as the Fed ramps up its hawkishness. A re-test of EUR/USD long-term trendline around 1.10 is likely before the end of Q1 (Chart 9). The Evolution Of European PMIs European manufacturing activity remains below its June peak, but it has surprised many observers by how well it is withstanding the various shocks hitting the continent. Despite this encouraging behavior, it may take a few more months before the PMIs find a floor. The following three factors best explain why European manufacturing activity will decelerate further: The Chinese economic slowdown is not over. Credit growth is improving, but much of this comes from increasing purchases of banker’s acceptances by financial institutions, which does not in turn provide credit to the economy. Thus, European exports to China and EM will remain on the backfoot. The Omicron crisis remains intact and natural gas remains a drag, as previously discussed. Chart 10Manufacturing Deceleration Will End In Q2
Manufacturing Deceleration Will End In Q2
Manufacturing Deceleration Will End In Q2
The evolution of the Sentix Global Investor Survey and the ZEW survey, which are a very reliable forecaster of the Manufacturing PMI, points to more economic weakness in Q1 2022 (Chart 10). While these forces will hurt growth in the near term, they also suggest that this deceleration is long in the tooth and that activity will firm anew during the second quarter of the year. The gap between the expectation and current activity components of the Sentix Global Index Survey and the ZEW survey have already bottomed. Moreover, both Omicron and natural gas crises will ebb as winter passes. Finally, Chinese authorities will not let growth collapse and will likely generate a small pickup in activity after the Chinese New Year. Already, the PBoC has ramped up its liquidity injections and Premier Li Keqiang recently highlighted potential tax cuts and support for the corporate sector to help Q1 and Q2 domestic activity. Looking at European countries individually shows that current economic conditions are disparate and largely reflect the different impacts of both Omicron and natural gas prices. To judge economic conditions, we expand the Rotation Methodology introduced two months ago.1 Instead of analyzing financial assets, we examine manufacturing PMIs through this lens, looking at the evolution of the level and momentum of each country’s manufacturing PMIs compared to the overall European level. This approach reveals the following over the past six months (Chart 11):
Chart 11
France experienced the greatest relative improvement, moving from a Lagging economy to the Leading economy in Europe. France benefits from limited lockdowns, from the large role of nuclear power in electricity generation, and from its diminished exposure to China’s slowdown compared to Germany. This economic performance explains why French equities have recently performed so much better than sectoral biases would have justified. The UK economy remains in the Leading quadrant despite the ferocity with which the Omicron wave has overtaken the nation. This paradox reflects the health policy chosen by Downing Street, emphasizing voluntary isolation and investing heavily in booster shots. Relative to that of the rest of Europe, Italy’s and Spain’s PMIs are still elevated, but they are losing momentum, which is pulling these two countries into the Weakening quadrant. The Netherlands suffered the greatest decrease in activity, dropping from the Leading quadrant to the Lagging one. The Netherlands is under a severe lockdown to combat the Delta wave. The situation is unlikely to improve meaningfully any time soon as the Omicron wave is starting there. Germany is trying to stage a recovery, moving from the Lagging quadrant into the Improving one. However, we worry that this will not work out and that Germany will shift back into the Lagging quadrant as the government prepares to crackdown further on COVID because the Omicron variant is starting to hit the country. Investment Implications Chart 12Peripheral Spreads To Stay Contained
Peripheral Spreads To Stay Contained
Peripheral Spreads To Stay Contained
The continuation of the weakness observed in Germany and the Netherlands will force the ECB to remain more dovish than implied by the inflation rate. As a result, Spanish and Italian bond spreads are unlikely to move anywhere close to the levels recorded in the spring of 2020 (Chart 12), especially as their respective economies outperform those of Germany and the Netherlands. Mathieu Savary, Chief European Strategist Mathieu@bcaresearch.com Footnotes 1 The “Leading” (“Lagging”) quadrant denotes countries with PMIs performing better (worse) than the benchmark, the European manufacturing PMI, with strengthening (weakening) momentum. The “Improving” (“Weakening”) quadrant denotes countries with PMIs that are performing worse (better) than the benchmark, with strengthening (weakening) momentum. Tactical Recommendations Cyclical Recommendations Structural Recommendations Closed Trades Currency Performance Fixed Income Performance Equity Performance
Highlights Global equities are poised to deliver mid-to-high single-digit returns this year, with the outlook turning bleaker in 2023 and beyond. Non-US markets are likely to outperform. We examine the four pillars that have historically underpinned stock market performance. Pillar 1: Technically, the outlook for equities is modestly bullish, as investor sentiment is nowhere near as optimistic as it usually gets near market tops. Pillar 2: The outlook for economic growth and corporate earnings is modestly bullish as well. While global growth is slowing, it will remain solidly above trend in 2022. Pillar 3: Monetary and financial conditions are neutral. The Fed and a number of other central banks are set to raise rates and begin unwinding asset purchases this year. However, monetary policy will remain highly accommodative well into 2023. Pillar 4: Valuations are bearish in the US and neutral elsewhere. Investors should avoid tech stocks in 2022, focusing instead on banks and deep cyclicals, which are more attractively priced. The Bedrock For Equities In assessing the outlook for the stock market, our research has focused on four pillars: 1) Sentiment and other technical factors, which are most pertinent for stocks over short-term horizons of about three months; 2) cyclical fluctuations in economic growth and corporate earnings, which tend to dictate the path for stocks over medium-term horizons of about 12 months; 3) monetary and financial conditions, which are also most relevant over medium-term horizons; and finally 4) valuations, which tend to drive stocks over the long run. In this report, we examine all four pillars, concluding that global equities are likely to deliver mid-to-high single-digit returns this year, with the outlook turning bleaker in 2023 and beyond. Pillar 1: Sentiment And Other Technical Factors (Modestly Bullish) Chart 1US Equities: Breadth Is A Concern
US Equities: Breadth Is A Concern
US Equities: Breadth Is A Concern
Scaling The Wall Of Worry Stocks started the year on a high note, before tumbling on Wednesday following the release of the Fed minutes. Market breadth going into the year was quite poor. Even as the S&P 500 hit a record high on Tuesday, only 57% of NYSE stocks and 38% of NASDAQ stocks were trading above their 200-day moving averages compared to over 90% at the start of 2021 (Chart 1). The US stock market had become increasingly supported by a handful of mega-cap tech stocks, a potentially dangerous situation in an environment where bond yields are rising and stay-at-home restrictions are apt to ease (more on this later). That said, market tops often occur when sentiment reaches euphoric levels. That was not the case going into 2022 and it is certainly not the case after this week's sell-off. The number of bears exceeded the number of bulls in the AAII survey this week and in six of the past seven weeks (Chart 2). The share of financial advisors registering a bullish bias declined by 25 percentage points over the course of 2021 in the Investors Intelligence poll. Option pricing is far from complacent. The VIX stands at 19.6, above its post-GFC median of 16.7. According to the Minneapolis Fed’s market-based probabilities model, the market was discounting a slightly negative 12-month return for the S&P 500 as of end-2021, with a 3.6 percentage-point larger chance of a 20% decline in the index than a 20% increase (Chart 3). Chart 3Option Pricing Is Not Pointing To Elevated Complacency
Option Pricing Is Not Pointing To Elevated Complacency
Option Pricing Is Not Pointing To Elevated Complacency
Chart 2Sentiment Is Not Exceptionally Bullish, Despite The S&P 500 Trading Close To All-Time Highs
Sentiment Is Not Exceptionally Bullish, Despite The S&P 500 Trading Close To All-Time Highs
Sentiment Is Not Exceptionally Bullish, Despite The S&P 500 Trading Close To All-Time Highs
Equities do best when sentiment is bearish but improving (Chart 4). With bulls in short supply, stocks can continue to climb the proverbial wall of worry. Whither The January Effect? Historically, stocks have fared better between October and April than between May and September (Chart 5). One caveat is that the January effect, which often saw stocks rally at the start of the year, has disappeared. In fact, the S&P 500 has fallen in January by an average annualized rate of 5.2% since 2000 (Table 1). Other less well-known calendar effects – such as the tendency for stocks to underperform on Mondays but outperform on the first trading day of each month – have persisted, however.
Chart 4
Chart 5
Table 1Calendar Effects
The Four Pillars Of The Stock Market
The Four Pillars Of The Stock Market
Bottom Line: January trading may be choppy, but stocks should rise over the next few months as more bears join the bullish camp. Last year’s losers are likely to outperform last year’s winners. Pillar 2: Economic Growth And Corporate Earnings (Modestly Bullish) Economic Growth And Earnings: Joined At The Hip The business cycle is the most important driver of stocks over medium-term horizons of about 12 months. The reason is evident in Chart 6: Corporate earnings tend to track key business cycle indicators such as the ISM manufacturing index, industrial production, business sales, and global trade. Chart 6The Business Cycle Is The Most Important Driver Of Stocks Over Medium-Term Horizons
The Business Cycle Is The Most Important Driver Of Stocks Over Medium-Term Horizons
The Business Cycle Is The Most Important Driver Of Stocks Over Medium-Term Horizons
Chart 7PMIs Signaling Above-Trend Growth
PMIs Signaling Above-Trend Growth
PMIs Signaling Above-Trend Growth
Global growth peaked in 2021 but should stay solidly above trend in 2022. Both the service and manufacturing PMIs remain in expansionary territory (Chart 7). The forward-looking new orders component of the ISM exceeded 60 for the second straight month in December. The Bloomberg consensus is for real GDP to rise by 3.9% in the G7 in 2022, well above the OECD’s estimate of trend G7 growth of 1.4% (Chart 8). Global earnings are expected to increase by 7.1%, rising 7.5% in the US and 6.7% abroad (Chart 9). Our sense is that both economic growth and earnings will surprise to the upside in 2022. Chart 9Analysts Expect Single-Digit Earnings Growth
Analysts Expect Single-Digit Earnings Growth
Analysts Expect Single-Digit Earnings Growth
Chart 8
Plenty Of Pent-Up Demand For Both Consumer And Capital Goods US households are sitting on $2.3 trillion in excess savings (Chart 10). Around half of these savings will be spent over the next few years, helping to drive demand. Households in the other major advanced economies have also buttressed their balance sheets. Chart 10Plenty Of Pent-Up Demand
Plenty Of Pent-Up Demand
Plenty Of Pent-Up Demand
After two decades of subdued corporate investment, capital goods orders have soared. This bodes well for capex in 2022. Inventories remain at rock-bottom levels, which implies that output will need to exceed spending for the foreseeable future (Chart 11). On the residential housing side, both the US homeowner vacancy rate and the inventory of homes for sale are near multi-decade lows. Building permits are 11% above pre-pandemic levels (Chart 12). Chart 11Business Investment Should Be Strong In 2022
Business Investment Should Be Strong In 2022
Business Investment Should Be Strong In 2022
Chart 12Residential Construction Will Remain Well Supported
Residential Construction Will Remain Well Supported
Residential Construction Will Remain Well Supported
Chart 13China's Credit Impulse Has Bottomed
China's Credit Impulse Has Bottomed
China's Credit Impulse Has Bottomed
Chinese Growth To Rebound, Europe To Benefit From Lower Natural Gas Prices Chinese credit growth decelerated last year. However, the 6-month credit impulse has bottomed, and the 12-month impulse is sure to follow (Chart 13). Chinese coal prices have collapsed following the government’s decision to instruct 170 mines to expand capacity (Chart 14). China generates 63% of its electricity from coal. Lower energy prices and increased stimulus should support Chinese industrial activity in 2022. Like China, Europe will benefit from lower energy costs. Natural gas prices have fallen by nearly 50% from their peak on December 21st. A shrinking energy bill will support the euro (Chart 15). Chart 14Coal Prices Are Renormalizing In China
Coal Prices Are Renormalizing In China
Coal Prices Are Renormalizing In China
Chart 15A Shrinking Energy Bill Will Support The Euro
A Shrinking Energy Bill Will Support The Euro
A Shrinking Energy Bill Will Support The Euro
Chart 16
Omicron Or Omicold? While the Omicron wave has led to an unprecedented spike in new cases across many countries, the economic fallout will be limited. The new variant is more contagious but significantly less lethal than previous ones. In South Africa, it blew through the population without triggering a major increase in mortality (Chart 16). Preliminary data suggest that exposure to Omicron confers at least partial immunity against Delta. The general tendency is for viral strains to become less lethal over time. After all, a virus that kills its host also kills itself. Given that Omicron is crowding out more dangerous strains such as Delta, any future variant is likely to emanate from Omicron; and odds are this new variant will be even milder than Omicron. Meanwhile, new antiviral drugs are starting to hit the market. Pfizer claims that its new drug, Paxlovid, cuts the risk of hospitalization by almost 90% if taken within five days from the onset of symptoms. Bottom Line: While global growth has peaked and the pandemic remains a risk, growth should stay well above trend in the major economies in 2022, fueling further gains in corporate earnings and equity prices. Pillar 3: Monetary And Financial Factors (Neutral) Chart 17The Overall Stance Of Monetary Policy Will Not Return To Pre-Pandemic Levels For At Least Another 12 Months
The Overall Stance Of Monetary Policy Will Not Return To Pre-Pandemic Levels For At Least Another 12 Months
The Overall Stance Of Monetary Policy Will Not Return To Pre-Pandemic Levels For At Least Another 12 Months
Tighter But Not Tight Monetary and financial factors help govern the direction of equity prices both because they influence economic growth and also because they affect the earnings multiple at which stocks trade. There is little doubt that a number of central banks, including the Federal Reserve, are looking to dial back monetary stimulus. However, there is a big difference between tighter monetary policy and tight policy. Even if the FOMC were to raise rates three times in 2022, as the market is currently discounting, the fed funds rate would still be half of what it was on the eve of the pandemic (Chart 17). Likewise, even if the Fed were to allow maturing assets to run off in the middle of this year, as the minutes of the December FOMC meeting suggest is likely, the size of the Fed’s balance sheet will probably not return to pre-pandemic levels until the second half of this decade. A Higher Neutral Rate We have argued in the past that the neutral rate of interest in the US is higher than widely believed. This implies that the overall stance of monetary policy remains exceptionally stimulative. Historically, stocks have shrugged off rising bond yields, as long as yields did not increase to prohibitively high levels (Table 2). Table 2As Long As Bond Yields Don’t Rise Into Restrictive Territory, Stocks Will Recover
The Four Pillars Of The Stock Market
The Four Pillars Of The Stock Market
If the neutral rate ends up being higher than the Fed supposes, the danger is that monetary policy will stay too loose for too long. The question is one of timing. The good news is that inflation should recede in the US in 2022, as supply-chain bottlenecks ease and spending shifts back from goods to services. The bad news is that the respite from inflation will not last. As discussed in Section II of our recently-published 2022 Strategy Outlook, inflation will resume its upward trajectory in mid-2023 on the back of a tightening labor market and a budding price-wage spiral. This second inflationary wave could force the Fed to turn much more aggressive, spelling the end of the equity bull market. Bottom Line: While the Fed is gearing up to raise rates and trim the size of its balance sheet, monetary policy in the US and in other major economies will remain highly accommodative in 2022. US policy could turn more restrictive in 2023 as a second wave of inflation forces a more aggressive response from the Fed. Pillar 4: Valuations (Bearish In The US; Neutral Elsewhere) US Stocks Are Looking Pricey… While valuations are a poor timing tool in the short run, they are an excellent forecaster of stock prices in the long run. Chart 18 shows that the Shiller PE ratio has reliably predicted the 10-year return on equities. Today, the Shiller PE is consistent with total real returns of close to zero over the next decade.
Chart 18
Investors’ allocation to stocks has also predicted the direction of equity prices (Chart 19). According to the Federal Reserve, US households held a record high 41% of their financial assets in equities as of the third quarter of 2021. If history is any guide, this would also correspond to near-zero long-term returns on stocks. Chart 19Valuations Matter For Long-Term Returns (II)
Valuations Matter For Long-Term Returns (II)
Valuations Matter For Long-Term Returns (II)
… But There Is More Value Abroad Valuations outside the US are more reasonable. Whereas US stocks trade at a Shiller PE ratio of 37, non-US stocks trade at 20-times their 10-year average earnings. Other valuation measures such as price-to-book, price-to-sales, and dividend yield tell a similar story (Chart 20). Chart 20AUS Stocks Are Trading At A Significant Premium To Their Non-US Peers (I)
US Stocks Are Trading At A Significant Premium To Their Non-US Peers (I)
US Stocks Are Trading At A Significant Premium To Their Non-US Peers (I)
Chart 20BUS Stocks Are Trading At A Significant Premium To Their Non-US Peers (II)
US Stocks Are Trading At A Significant Premium To Their Non-US Peers (II)
US Stocks Are Trading At A Significant Premium To Their Non-US Peers (II)
Cyclicals And Banks Overrepresented Abroad Our preferred sector skew for 2022 favors non-US equities. Increased capital spending in developed economies and incremental Chinese stimulus should boost industrial stocks and other deep cyclicals, which are overrepresented outside the US (Table 3). Banks are also heavily weighted in overseas markets; they should also do well in response to faster-than-expected growth and rising bond yields (Chart 21). Table 3Deep Cyclicals And Financials Are Overrepresented Outside The US
The Four Pillars Of The Stock Market
The Four Pillars Of The Stock Market
Chart 21Rising Bond Yields Will Help Bank Shares
Rising Bond Yields Will Help Bank Shares
Rising Bond Yields Will Help Bank Shares
Bottom Line: Valuations are more appealing outside the US, and with deep cyclicals and banks set to outperform tech over the coming months, overseas markets are the place to be in 2022. Peter Berezin Chief Global Strategist peterb@bcaresearch.com Global Investment Strategy View Matrix
Image
Special Trade Recommendations
Image
Current MacroQuant Model Scores
Image
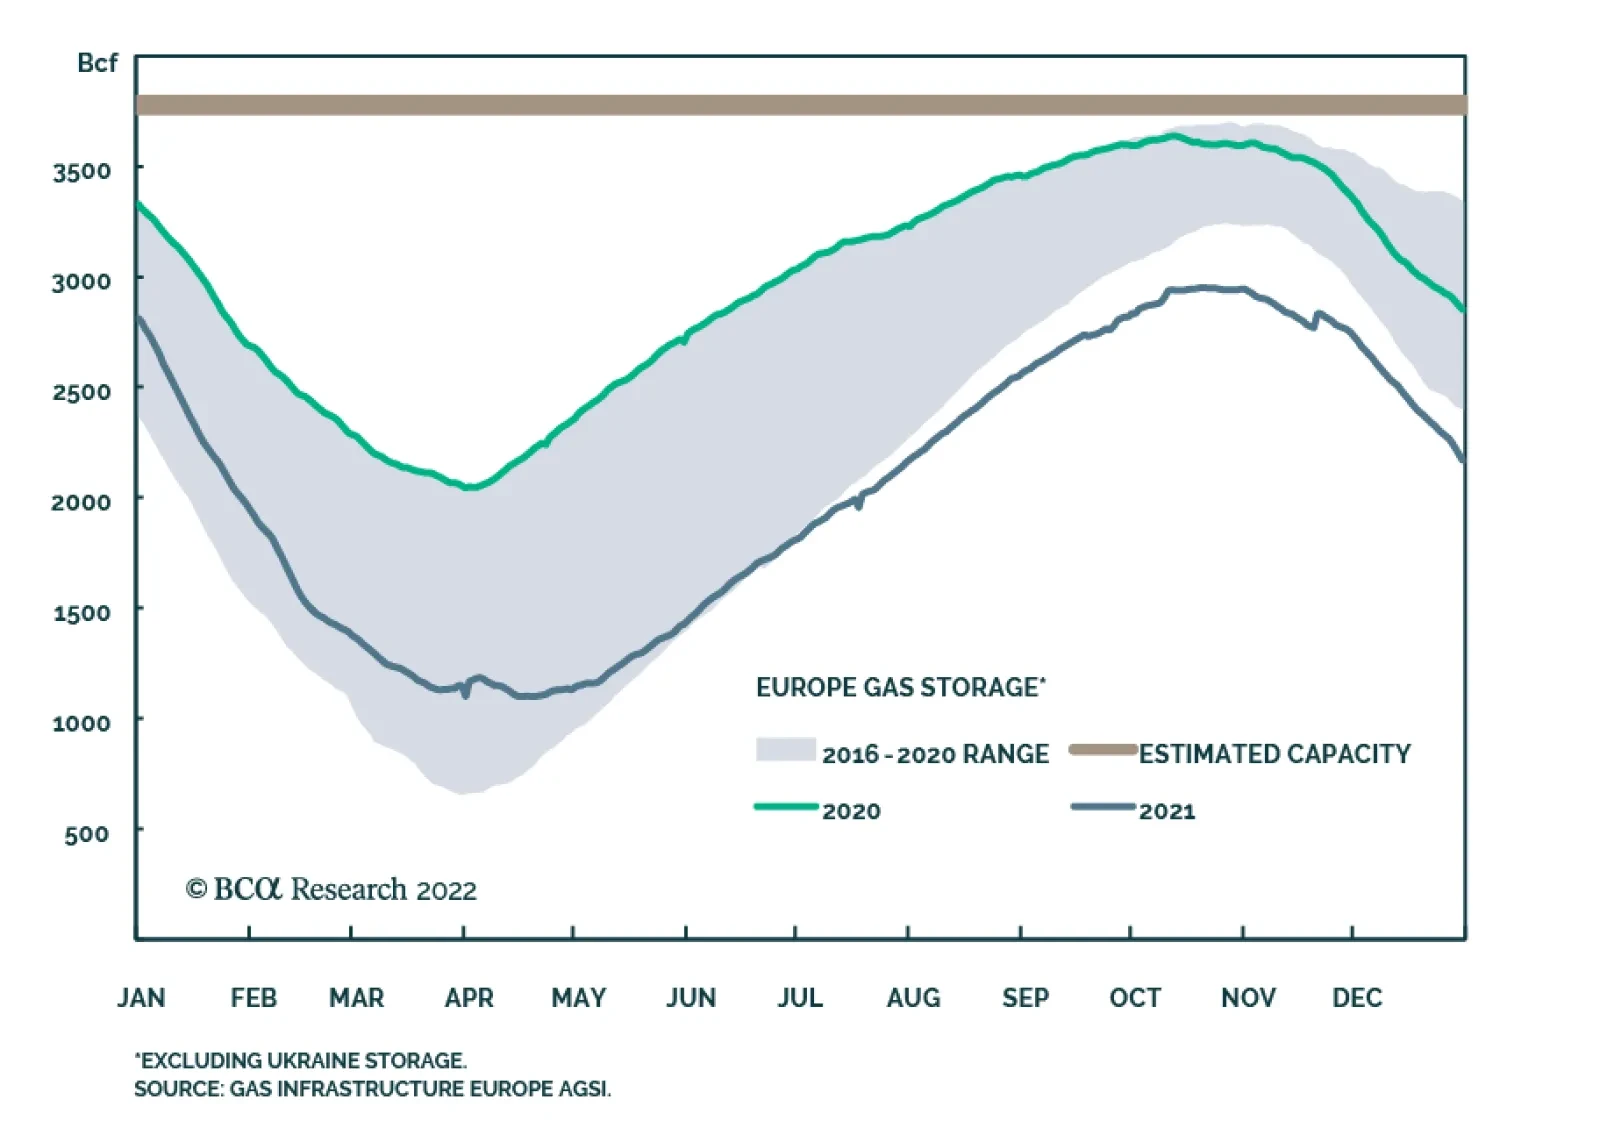
The sharp rally in natural gas prices fizzled in the second half of December, with the European benchmark collapsing nearly 60% in the last two weeks of 2021. Several factors contributed to this decline including mild weather and LNG shipments from the US…
Highlights Industrial commodity and ag markets will continue to pull widely followed inflation gauges higher, as global fuel and fertilizer prices remain well bid (Chart of the Week). Unplanned production outages in Libya, faltering supply growth within OPEC 2.0 and a bullish read-through on demand in the wake of relatively mild public-health effects due to the omicron variant will keep oil prices well supported over the short term. Base metals prices will be pulled higher by the ongoing energy crises in Europe and China, which are forcing refiners to shutter capacity as fuels are re-directed to human needs. This is compounded by lockdowns in China – home to ~ 50% of global refining capacity – due to its zero-tolerance COVID-19 policy. These energy crises also are pulling grains higher, as farmers deal with soaring fertilizer costs – driven by soaring natgas prices – this year. Longer term – 2024 and beyond – industrial-commodity production will be concentrated in the hands of a few large producers. More explicit carbon pricing and ESG-induced cost increases will have to be recovered in higher wholesale prices for oil and metals. Grains will remain subject to volatile input costs, and erratic weather. We continue to favor broad-based exposure to commodities vis the S&P GSCI and the COMT ETF. Feature Fundamental supply-demand conditions in commodity markets – largely out of the control of fiscal- and monetary-policymakers – will continue to pull inflation gauges higher this year and for the rest of the 2020s. Oil markets are tight and getting tighter, owing to a dearth of capex since the price collapse triggered by OPEC's market-share war in 2014 (Chart 2). The same is true for base metals, where capex also has languished.1 Chart of the WeekCommodities Continue To Contribute To Global Inflationary Pressures
Commodities Continue To Contribute To Global Inflationary Pressures
Commodities Continue To Contribute To Global Inflationary Pressures
Chart 2
Ag markets are confronting massive cost increases brought about by natgas shortages that first surfaced in 2021 and will continue to dog European and Asian fertilizer markets this year (Chart 3). These tight conditions leave markets vulnerable to unexpected supply and demand shocks, no matter how short-lived they might be. This is easily seen in oil markets: A force majeure declaration by Libya's national oil company following unplanned production shutdowns and pipeline maintenance pulled output below 800k b/d, or 30% lower than November 2021 levels, and almost completely neutralized a supply increase agreed by OPEC 2.0 earlier this week. Combined with what appears to be a relatively sanguine read-through on the impact of surging omicron infections in major consuming markets, these developments took prompt Brent back above $80/bbl.2 Chart 3Tight Natgas Markets Drive Fertilizer/Grain Prices Higher
Tight Natgas Markets Drive Fertilizer/Grain Prices Higher
Tight Natgas Markets Drive Fertilizer/Grain Prices Higher
Oil Price Strength Will Persist Longer term – 2024 and beyond – OPEC 2.0's capacity to increase oil supply will be concentrated in the hands of a few large producers, while US shale-oil producers will face tougher ESG hurdles, which will raise their costs. More explicit carbon pricing also will raise costs. These cost increases will have to be recovered in higher prices. OPEC 2.0’s raison d'être at its inception in 2016 was to regain control over the level of global oil inventories. It has been remarkably successful in this endeavour, despite massive geopolitical uncertainty and a global pandemic (Chart 4). We do not expect any course changes over the coming years. What will change, however, are the fortunes of states in this coalition capable of increasing supply as global demand increases. At present, the Kingdom of Saudi Arabia (KSA) and Russia are the putative leaders of OPEC 2.0, and are two of the five states that can increase production at present (Iraq, the UAE and Kuwait also are in that group). By the end of this decade, the leadership of the coalition could come down to KSA and the UAE. While not certain, the US EIA expects Russia's output to level off and then gradually decline over the course of this decade. (Chart 5).3 Russia will remain a significant producer in the coalition, but it likely will be managing declining output as opposed to fighting for higher market share. Chart 4OPEC 2.0s Strategy Works
OPEC 2.0s Strategy Works
OPEC 2.0s Strategy Works
Chart 5
Producers outside the OPEC 2.0 coalition – i.e., the price-taking cohort – have gone to great lengths to improve the attractiveness of their equity, and to maintain access to debt markets to fund their growth. These goals will not support any effort to increase production at the risk of reducing ROEs, as this would set efforts to regain investors' and lenders' favor back years. Going forward, capital markets, climate activists in board rooms and courtrooms, and an increasing load of ESG-related measures – most not yet even defined – will become central to the price-taking cohort's operations and returns. These will impose additional costs on the production of hydrocarbons, with explicit carbon pricing only one of many costs that will have to be recovered in higher prices. Base Metals Again Hit By Gas Shortages Shortages of natural gas continue to plague Europe: According to Gazprom, the Russian state-owned gas company, the continent has withdrawn more than 45% of total gas injected into storage this year, with peak winter in the Northern Hemisphere still to come.4 Just over 20% of power generation in Europe is gas-fired, which means tight gas markets drive gas prices and power prices higher. This power crunch is hitting the continent’s supply of refined aluminum and zinc particularly hard, which means global supplies also are being hit hard. Europe is responsible for ~ 12.5% and ~ 18% of global primary aluminum and zinc slab production, respectively. Low inventories at the start of winter, and cold weather is forcing European natgas to be directed to human needs at the expense of power generation. This has resulted in shutdowns of aluminum smelters in Europe – e.g., Aluminium Dunkerque Industries France was forced to curb production in the second half of December. Around the same time, Trafigura’s Nyrstar – which has the capacity to produce ~ 5.2% of global refined zinc – also announced plans to shut its zinc operations in France beginning January, citing high power prices. While power rationing has helped stabilize an earlier crisis in the world’s largest refined copper, aluminum, and zinc producer, the odds China’s power crisis will worsen has increased, following Indonesia's coal export ban in January to preserve the fuel for domestic energy security. China’s plans to curb air pollution ahead of the Winter Olympics next month will also dampen refining activity. Base metals also are contending with a new fundamental supply risk: Political uncertainty in the critically important producing states of Chile and Peru, the world’s largest producers of the red metal. Gabriel Boric, the new Chilean president, supports higher taxes on copper mining firms, as does his Peruvian counterpart Pedro Castillo. Boric’s election also signals more scrutiny on ore miners’ environmental practices – putting additional ESG-induced costs into wholesale copper prices. The uncertainty surrounding Peru’s constitutional rewrite, with the possibility for a change in mining rules to favor wealth redistribution and the environment will deter mining investments, according to Diego Hernandez, head of Sonami, the Chilean mining society. In Peru, the motion to and failure to impeach Castillo last month will increase political uncertainty, potentially reducing investors’ faith in the country’s mining sector. All of this has a chilling effect on investment in markets that are starved for capex.5 The lack of stable supply and low inventories have caused major price surges over the last year for industrial metals (Chart 6). We expect prices to rise and maintain higher levels over the course of this decade. Base metals production likely will fall short of demand as the world undertakes the green energy transition. Chart 6Copper Inventories Drawing Hard
Copper Inventories Drawing Hard
Copper Inventories Drawing Hard
Investment Implications Industrial commodity markets are tightening over the short term and are on course to tighten further as the current decade progresses. This will raise the cost of the energy transition, as higher prices will be required to spur new supply investments in base metals, which are the sine qua non for this transition. This also will spur additional investment in oil and natgas supply, since these already have the infrastructure in place to move supply to market in order to meet the rising demand for energy we expect going forward. We will be exploring these themes throughout the year, particularly the implications for policy around the development of carbon-capture technologies – especially in natgas markets – and nuclear power, both of which may be the most "shovel ready" sources of incremental energy supply this decade. Robert P. Ryan Chief Commodity & Energy Strategist rryan@bcaresearch.com Ashwin Shyam Research Associate Commodity & Energy Strategy ashwin.shyam@bcaresearch.com Commodities Round-Up Energy: Bullish European natgas prices are once again rallying as inventories continue to be drawn down hard due to cold weather, reduced gas supplies from Russia, and higher demand generally (Chart 7). By the end of 2021, European natgas inventories were 57% full, vs the seasonal norm of 72%. At the end of December, close to 50 LNG tankers from the US were sailing to European destinations. As 2022 opens, the European TTF price for natural gas rose 30% to €94/MWh off their recent lows. Cargoes now will be bid in Asia, particularly in China, due to a halt in coal exports during January from Indonesia announced by the government at year end. China had replaced Australian coal imports with Indonesian-sourced material last year. Base Metals: Bullish MMG Ltd’s Las Bambas mine in Apurímac, Peru will restart operations after suspending production in late December. The mine's owner enacted the suspension following a month-long blockade at one of its key roads by the Chumbivilcas community. Prime Minister, Mirtha Vasquez travelled to the region to ensure the conflicting parties reached an agreement. Las Bambas mine makes up ~2% of global mined copper supply and its tax payments are a significant source of government revenue. While an agreement was reached to lift the blockade, it did not address the Chumbivilcas’ primary concerns. The community wants the mine to employ more locals and provide higher cash contributions to support local infrastructure. This elevates the likelihood of further blockades and supply disruptions this year. Since it commenced operations in 2016, the Las Bambas mine has dealt with blockades over key roads on and off for over 400 days. Ags/Softs:Neutral Global fertilizer markets will remain tight as natgas prices resume their rally and drive input costs higher. This will contribute to rising food price inflation and may result in global food shortages in 2022. High fertilizer prices might encourage farmers to delay planting this year, in the hope prices will fall. This risks increasing price volatility if too many farmers wait too long to apply fertilizers for their spring crops.
Chart 7
Footnotes 1 Please see our most recent update on these factors in 2022 Key Views: Past As Prelude For Commodities, which we published on December 16, 2021. It is available at ces.bcaresearch.com. 2 Please see Libyan crude output falls below 800,000 b/d published by argusmedia.com on January 4, 2022, and Oil futures: Prices steady after OPEC+ hike, Brent close to $80/b published by qcintel.com on January 5, 2022. 3 In its December 2021 assessment of Russia's oil-production potential, the US EIA noted: "… declining output from Russia’s more mature fields (primarily in Western Siberia, Russia’s largest oil producing region) may offset the production growth coming from greenfield development, which may result in Russia’s crude oil production declining by the end of the 2020s decade. In addition to greenfield development, companies are increasing drilling at some existing mature oil fields and are tying in smaller fields to existing infrastructure at larger fields to help increase recovery rates and mitigate some of the production decline. However, brownfield development efforts in Russia are unlikely to reverse the decline in production in the longer term." Please see Country Analysis Executive Summary: Russia, published by the EIA on December 13, 2021. 4 Please refer to Hoping for cheaper gas to come, Europe reverses Russian link to tap storage, published by Reuters on December 30, 2021. 5 Please see Add Local Politics To Copper Supply Risks, which we published on November 25, 2021 for additional discussion Investment Views and Themes Strategic Recommendations Trades Closed in 2021
Image
Highlights For the time being, US core inflation will not drop anywhere close to the Fed’s target range. The Fed will continue tightening until something breaks. US bond yields and the US dollar are heading higher. The S&P500 will need to drop meaningfully for the Fed to stop tightening. The Fed’s tightening and the US dollar’s persistent strength amid the lack of recovery in the Chinese business cycle will eventually produce a drawdown in commodity prices in the coming months. Absolute-return investors should stay defensive on EM risk assets and asset allocators should continue to underweight EM versus DM in global equity and credit portfolios. Feature We are starting the year with a review of a few macro pillars of our view that will shape global financial markets in the coming months. US Core Inflation Will Prove Sticky… Chart 1Average Of All Core US Inflation Measures
Average Of All Core US Inflation Measures
Average Of All Core US Inflation Measures
The average of seven various US core inflation measures – core CPI, core PCE, trimmed-mean CPI, median CPI, sticky core CPI, trimmed-mean PCE and market-based core PCE – has surged to 4% (Chart 1). Although the core inflation rate could decline in 2022 as supply bottlenecks ease and base effects become more favorable, it is unlikely to drop below 3%. Instead, it will remain well above the Fed’s inflation target. If the Fed adheres to its mandate, it will have to hike rates until inflation heads toward 2%. US core inflation will not drop toward 2% unless the economy slows materially. Consumer and business inflation expectations have risen substantially. US consumer inflation expectations for one and three years ahead have risen to 4-6%, and US non-farm businesses have been able to raise prices by 4.5% y/y in Q3 (Chart 2). We can say the genie – inflation and inflation expectations – is out of bottle and it will be hard to put it back in. Importantly, labor market shortages will persist, and employee wage demand will be strong. Employees’ current wage growth expectations are based on their inflation expectations in the next one to three years, not the next decade. Even though longer term inflation expectations remain somewhat muted, they will not prevent high wage growth. Critically, inflation has “eaten” into employee income: real wage growth – adjusted for headline consumer price inflation – has been negative in 2021 (Chart 3). Consistently, employees know their compensation has lagged inflation and will be demanding significant wage hikes in 2022. Chart 3Inflation Is "Eating" Into Wages In The US
Inflation Is "Eating" Into Wages In The US
Inflation Is "Eating" Into Wages In The US
Chart 2US Inflation Expectations Have Risen Sharply
US Inflation Expectations Have Risen Sharply
US Inflation Expectations Have Risen Sharply
In short, a wage-price spiral of moderate proportions is unfolding. Given tight labor market conditions, businesses will have no choice but raise wages considerably and then try to pass the higher costs on to their consumers. … Prompting Higher US Bond Yields … Despite the surge in core inflation to a 30-plus year high, US bond yields have remained low. The long end of the US yield curve has continued to be suppressed even as the market participants raised their rate hike expectations. Not only has the expected terminal Fed funds target rate not risen much, but also the bond term premium has remained negative. The bond term premium is akin to the equity risk premium. Pronounced uncertainty about the US inflation outlook as well as elevated bond volatility warrant a higher bond term premium (Chart 4). … Which Will Push The US Dollar Higher… Rising US interest rate expectations will lead to a stronger greenback. Our US Dollar Liquidity Indicator points to continued firmness in the broad trade-weighted US dollar ( the latter is shown inverted in this chart) (Chart 5). Chart 5US Dollar Liquidity And The US Dollar
US Dollar Liquidity And The US Dollar
US Dollar Liquidity And The US Dollar
Chart 4Inflation Uncertainty And High Bond Volitility Herald A Higher Term Premium
Inflation Uncertainty And High Bond Volitility Herald A Higher Term Premium
Inflation Uncertainty And High Bond Volitility Herald A Higher Term Premium
Our framework for the relationship between currencies and their interest rates is as follows: Scenario 1: When inflation is high or rising fast, the central bank is willing to hike rates and the economy can withstand higher borrowing costs, the currency will appreciate. Scenario 2: When inflation is high or rising fast and the central bank is unwilling to hike rates, the currency will depreciate. This is the case when the central bank falls behind the curve. Scenario 3: When the central bank is tightening but the economy cannot handle higher borrowing costs, the currency will depreciate. The US economy is presently able to handle higher interest rates. Hence, the US dollar is currently driven by the dynamics described in Scenario 1, i.e., rising interest rates will support the greenback. Chart 6US Household Finances Are Healthy
US Household Finances Are Healthy
US Household Finances Are Healthy
Our rationale is that US interest rate sensitive sectors like housing and car sales have been restrained by supply shortages – not weak demand. In fact, there is large pent-up demand for both housing and autos and a reasonable rise in borrowing costs will not thwart this demand. Besides, US household debt and debt servicing costs have declined substantially in the past 10 years (Chart 6). US households are no longer highly indebted. This development – along with robust wage gains – will allow households to borrow more and service their debt. Finally, unlike in many other Anglo-Saxon countries, in the US it is long-term rates – rather than short ones – that matter for household debt servicing. Mortgages make up 70% of household debt in the US and the mortgage rate is tied to the 30-year bond yield. In many other advanced and emerging economies, mortgage rates are more influenced by the central bank policy rate than long-term bond yields. As a result, the US economy will be able to endure monetary tightening by the Fed better than other developed and emerging economies can handle rate hikes from their central banks. Specifically, mainstream EM economies (EM ex-China, Korea and Taiwan) will slow markedly as and if their central banks hike rates further (Chart 7). There is, however, a caveat: Even though Main Street America will be able to withstand a reasonable amount of rate hikes, Wall Street might not be able ride out these rate hikes. The difference is the starting point – US equity valuations are very high. … And Will Herald A US Equity Correction And Sector Rotation The spike in US core inflation is likely to engender a negative correlation between US share prices and bond yields, as was the case in 1966. We first made this argument in last year’s Special Report titled A Paradigm Shift In The Stock-Bond Relationship (Chart 8). Chart 7Mainstream EM: Monetary Tightening Will Dampen Growth
Mainstream EM: Monetary Tightening Will Dampen Growth
Mainstream EM: Monetary Tightening Will Dampen Growth
Chart 8S&P500 And Bond Yields Correlation Will Turn Negative
S&P500 And Bond Yields Correlation Will Turn Negative
S&P500 And Bond Yields Correlation Will Turn Negative
The current episode in the US is akin to the second half of the 1960s when US core inflation and bond yields rose after decades of lingering at very low levels. Starting in 1966, US share prices became negatively correlated with US Treasury yields (Chart 9 – bond yields are shown inverted). Going forward, the S&P 500 will often take its cue from US bond yields: stocks will rally when bond yields decline, and tumble when bond yields rise. Given that we expect US Treasury yields to rise in the coming months (10-year yields will move well above 2%), the S&P 500 is likely to correct. The key risk to this view is the massive amount of cash on the sidelines, and widespread investor willingness to buy any dip in US equities. The absolute level of US retail money market funds currently stands at a formidable $1 trillion (Chart 10, top panel). However, this just represents a mere 2% of the US equity market cap (Chart 10, bottom panel). Hence, if institutional investors begin selling stocks, retail investors might not be able to support the market. Chart 9Early 2020s = Late 1960s?
Early 2020s = Late 1960s?
Early 2020s = Late 1960s?
Chart 10Cash on Sidelines: A Lot Or Not So Much?
Cash on Sidelines: A Lot Or Not So Much?
Cash on Sidelines: A Lot Or Not So Much?
Chart 11EM Relative Equity Performance Is Correlated With The USD, Not Bond Yields
EM Relative Equity Performance Is Correlated With The USD, Not Bond Yields
EM Relative Equity Performance Is Correlated With The USD, Not Bond Yields
Furthermore, rising US bond yields will cause US value stocks to outperform US growth stocks. Will EM stocks outperform US or DM ones as US bond yields rise? The top panel of Chart 11 illustrates that there has been no stable correlation between US bond yields and EM versus DM relative equity performance. Yet, there is a strong relationship between EM relative equity performance and the US dollar (Chart 11, bottom panel). If the broad trade-weighted US dollar rallies, EM stocks will underperform their DM counterparts (the greenback is shown inverted in the bottom panel of Chart 11). A sell-off in US stocks and bonds and the greenback’s rally will tighten US financial conditions considerably. The Fed is putting a lot of weight on financial conditions, especially when they are becoming restrictive. As US financial conditions tighten, the Fed will likely pivot, i.e., soften its hawkish stance. The Fed would likely argue that tight financial conditions will slow growth, which will in turn bring down inflation. Such a Fed pivot will potentially mark the end of a US dollar rally, enable American share prices to rise again, and EM stocks to start outperforming. However, we are not there yet. Bottom Line: For the time being, US core inflation will not drop anywhere close to the Fed’s target range. Hence, the Fed will continue tightening until something breaks. It will take a meaningful drop in the S&P500 (~20%) to make the Fed stop tightening. Commodity Prices Commodity prices have been caught between two opposing forces: US inflation and China’s slowdown. Worries about US inflation have made investors buy inflation hedges, and commodities are traditionally viewed as an inflation hedge. Yet, there is a caveat: Inflation is proliferating in the US but not in China. On the contrary, Chinese imports of key commodities contracted dramatically in H2 2021 (Chart 12). We are surprised that commodity prices have been so resilient despite shrinking Chinese commodity imports. Our sense is that commodity prices have been held up by two forces: strong global manufacturing activity and financial demand from investors. As for the green revolution, we believe it will be a major bullish force for select commodities in a couple of years. At the moment, however, it is not large enough to offset the slowdown in the Chinese economy. It might take investor concerns about US demand and/or a slowdown in global manufacturing to trigger a relapse in commodity prices. Rising US interest rates and a continued dollar rally will eventually result in a meaningful drawdown in commodity prices. Chart 13 demonstrates that the declines in the Swedish manufacturing PMI new orders-to-inventory ratio and the Swedish krona/Swiss franc cross rate point to downside risks in raw materials prices. Chart 12Chinese Imports Of Key Commodities Have Shrunk
Chinese Imports Of Key Commodities Have Shrunk
Chinese Imports Of Key Commodities Have Shrunk
Chart 13A Red Flag For Commodities From Industrial Sweden
A Red Flag For Commodities From Industrial Sweden
A Red Flag For Commodities From Industrial Sweden
Bottom Line: Commodity prices have so far ignored China’s slowdown. However, the Fed’s tightening and the US dollar’s persistent strength amid the lack of recovery in the Chinese business cycle will eventually produce a drawdown in resource prices in the coming months. Investment Strategy For EM Chart 14EM Equities: No Profit Growth, No Bull Market
EM Equities: No Profit Growth, No Bull Market
EM Equities: No Profit Growth, No Bull Market
EM share prices have been falling in absolute terms despite the strength in the S&P 500. The EM equity index will drop further due to the dismal EM profit outlook and the continued de-rating of Chinese TMT stocks. In absolute terms, the EM equity index is at the same level as it was in 2011 because EM EPS in USD has not expanded at all since 2011 (Chart 14). Investors are reluctant to pay high multiples for EM companies because they have produced zero earnings growth over the past 10 years. Besides, higher US bond yields and continued strength in the US dollar will lead to higher EM sovereign and corporate bond yields. EM non-TMT share prices typically wobble when EM US dollar borrowing costs rise (Chart 15). Chart 15Rising EM USD Borrowing Costs Are Bearish For EM Non-TMT Stocks
Rising EM USD Borrowing Costs Are Bearish For EM Non-TMT Stocks
Rising EM USD Borrowing Costs Are Bearish For EM Non-TMT Stocks
We continue to recommend underweighting EM in a global equity portfolio. EM always underperforms DM when the greenback rallies. We maintain our short positions in a basket of EM currencies versus the US dollar. Rising US bond yields and a firm greenback will continue weighing on EM fixed income markets – both local currency and US dollar ones. Fixed-income investors should favor US corporate credit over EM corporate and sovereign credit, quality adjusted. In local rates, we are betting on yield curve inversion in Russia and Mexico, receiving rates in China and Malaysia and paying rates in the Czech Republic. For the full list of our fixed-income, currency and equity recommendations, please refer to the tables below. These are also available on our website. Arthur Budaghyan Chief Emerging Markets Strategist arthurb@bcaresearch.com Equities Recommendations Currencies, Credit And Fixed-Income Recommendations
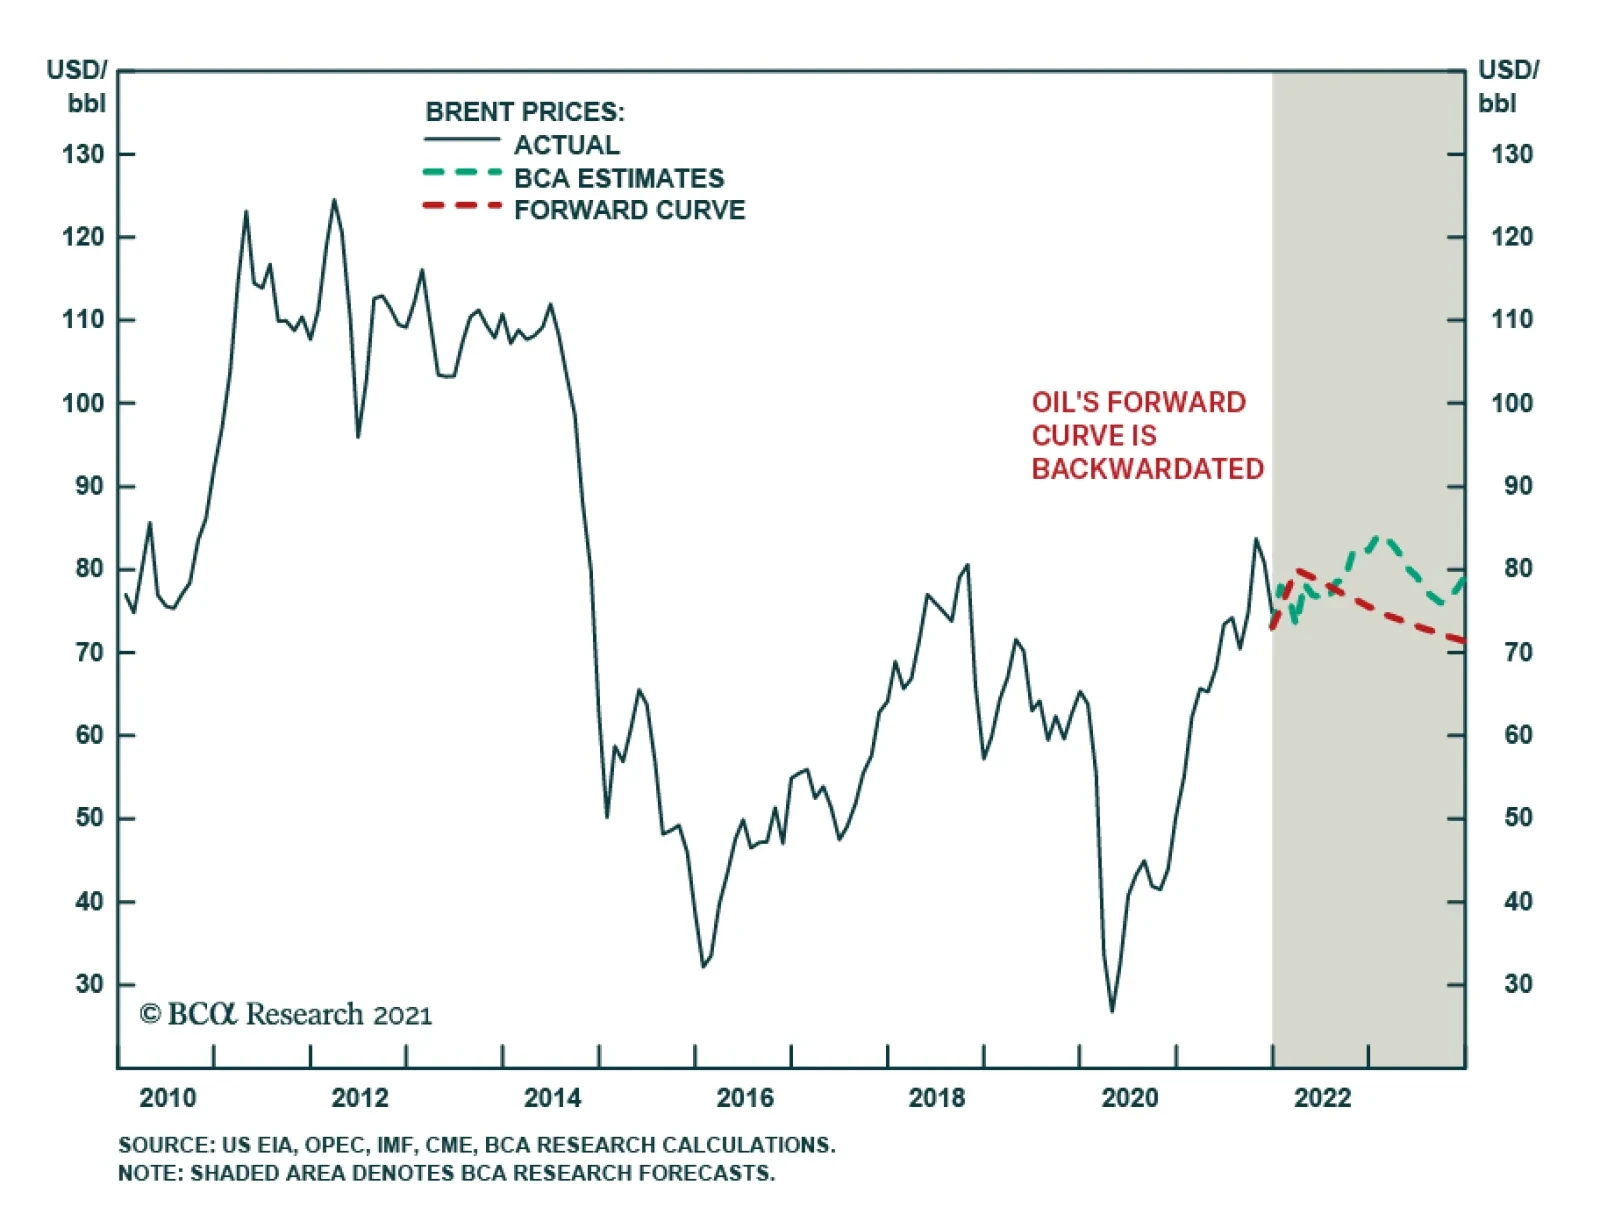
Following the conclusion of its joint ministerial meeting on Tuesday, the OPEC oil producers coalition agreed to increase crude oil output by another 400 thousand barrels per day in February. The decision to raise production despite surging COVID-19 cases…