Commodities & Energy Sector

As 2021 draws to a close, we thank you for your ongoing readership and support. We wish you and your loved ones a happy holiday season and all the best for a healthy and prosperous 2022. Highlights Over the coming three months, the odds are high that the Omicron variant of COVID-19 will disrupt economic activity in advanced economies, but the magnitude of the disruption will be heavily determined by the variant’s capacity to produce severe illness. For now, we remain of the view that the pandemic will recede in importance over the course of the next year. Relative to the assessment that we published in our 2022 Outlook report, the Omicron variant of COVID-19 has modestly raised the odds of a stagflationary outcome next year. Our base case view of above-trend growth and above-target inflation remains the most likely scenario for 2022. We do not think that the actual risk of a recession has risen significantly since we published our annual outlook, but we can envision a scenario in which Fed tightening causes investors to become fearful of a recession. The true risk of a monetary policy-induced recession over the coming 12-18 months will only rise if long-dated inflation expectations break above the range that prevailed prior to the Global Financial Crisis. Beyond 2022, the main risk to financial markets is that investors raise their longer-term interest rate expectations closer to the trend rate of economic growth. This would not be bad news for real economic activity, but it would imply meaningfully lower prices for financial assets that have benefited from low interest rates. We continue to advise that investors position themselves in line with the investment recommendations that we presented in our Outlook report. Over the coming year, investors should watch for the following when deciding whether to reduce exposure to risky assets: a breakout in long-dated inflation expectations, a significant flattening in the yield curve, or a rise in 5-year, 5-year forward US Treasury yields above 2.5%. Feature Our recently published 2022 Outlook report laid out the main macroeconomic themes that we see driving markets next year, as well as our cyclical investment recommendations.1 In this month’s report, we discuss the most relevant risks to our base case view in more depth, and update our fixed-income view in the wake of the December FOMC meeting. The Near-Term Risks Chart I-1DM Policymakers Are Afraid That Omicron Will Overwhelm The Medical System
DM Policymakers Are Afraid That Omicron Will Overwhelm The Medical System
DM Policymakers Are Afraid That Omicron Will Overwhelm The Medical System
Over the coming 0-3 months, the greatest risks to economic growth stem from the likely impact of the Omicron variant of COVID-19 on the medical system and the evolution of Europe’s energy crisis. News about the Omicron variant emerged just a few days prior to the publication of our annual outlook, and considerable uncertainty remains about its impact. Some early evidence suggests that the variant causes less severe disease, with a recent press release from South Africa’s largest private health insurance administrator suggesting that the risk of hospital admission was 29 percent lower for adults with the Omicron variant after adjusting for age, sex, underlying health conditions, and vaccine status. More recent studies from South Africa have suggested a much larger reduction in the severity of disease,2 but it is not yet clear whether these findings are applicable to advanced economies,given South Africa’s more recent vaccination campaign and higher proportion of a previously infected population. If Omicron turns out to result in 30 percent less hospitalizations, that only reduces the net impact on the medical system if the Omicron variant is no more than 1.5x as transmissible as the Delta variant. The sheer speed at which Omicron is spreading suggests it is far more contagious than this, the result in part to its ability to evade two-dose immunity. The potential for Omicron to quickly overwhelm available health system resources has alarmed authorities in several advanced economies, especially given that cases and hospitalizations have already trended higher in several countries even while Delta remained the dominant variant (Chart I-1). Additional restrictions on economic activity in the DM world appear to be likely over the coming weeks, and may be in effect until booster doses have been fully administered and/or Pfizer’s drug Paxlovid becomes widely available. For Europe, a worsening of the COVID situation has the potential to exacerbate the economic impact of the region’s ongoing energy crisis. Chart I-2 highlights that European natural gas prices have again exploded, reaching a new high that is fourteen times its pre-pandemic level. We noted in our Outlook report that European natural gas in storage is well below that of previous years, and Chart I-3 highlights that the gap in stored gas relative to previous years persists. This is occurring despite roughly average temperatures in central Europe over the past month (Chart I-4), underscoring that, barring atypically warmer temperatures, European natural gas prices are likely to remain elevated throughout the winter. Chart I-2Another Explosion In European Natural Gas Prices
Another Explosion In European Natural Gas Prices
Another Explosion In European Natural Gas Prices
Chart I-3
Chart I-5For Europe, COVID Is More Of A Problem Than Natural Gas Prices
For Europe, COVID Is More Of A Problem Than Natural Gas Prices
For Europe, COVID Is More Of A Problem Than Natural Gas Prices
Chart I-4
For now, it appears that the rise in COVID cases is having a more pronounced effect on the European economy than the energy price situation. Chart I-5 highlights that the flash December euro area manufacturing PMI fell only modestly, and that Germany’s manufacturing PMI actually rose in December. By contrast, the euro area services PMI fell over two points, reflecting the toll that recent pandemic control measures have taken on non-goods producing activity. Over the coming three months, the odds are high that the Omicron variant will disrupt economic activity in advanced economies to some degree, but the magnitude of the disruption will be heavily determined by the variant’s capacity to produce severe illness. Investors will have more information on hand in a few weeks by which to judge the extent of this risk. We will provide an update to our own assessment in our February report. Risks Over The Next Year In our Outlook report, we assigned a 60% chance to an above-trend growth and above-target inflation scenario next year, a 30% chance to a “stagflation-lite” scenario of growth at or below potential and inflation well above target, and a 10% chance of a recession. We present below our assessment of the risk that one of the latter two scenarios occurs in 2022. The Risk Of “Stagflation-Lite” Chart I-6Aside From Europe's Energy Crisis, Supply-Side Constraints Are Slowly Easing
Aside From Europe's Energy Crisis, Supply-Side Constraints Are Slowly Easing
Aside From Europe's Energy Crisis, Supply-Side Constraints Are Slowly Easing
The Omicron variant of COVID-19 has modestly raised the odds of a stagflationary outcome next year. Over the past few months, supply-side pressures have been modestly improving outside of Europe. Chart I-6 presents our new BCA Supply-Side Pressure Indicator, which measures the impact of supply-side restrictions across four categories: energy prices, shipping costs, the semiconductor shortage impact on automobile production, and labor availability. When we include all eleven components, the index has been trending higher of late, but trending flat-to-down after excluding European natural gas prices. While Omicron has the potential to reduce energy price pressure outside of Europe, it has the strong potential to cause a further increase in global shipping costs and postpone US labor market normalization. On the shipping cost front, we noted in our Outlook report that supply-side effects have been a significant driver of higher costs this year. The large rise in China/US shipping costs since late-June has been seemingly caused by the one-month closure of the Port of Yantian that began in late-May. While China has made enormous progress in vaccinating its population over the course of the year, and has prioritized the vaccination of workers in key industries, recent reports suggest that the Sinovac vaccine provides essentially no protection against contracting the Omicron variant of COVID-19. It is possible that Sinovac will offer protection against severe illness, but in terms of preventing transmission of the disease, Omicron has essentially returned China’s vaccination campaign back to square one. Chart I-7Further Price Increases May Seriously Slow Goods Spending
Further Price Increases May Seriously Slow Goods Spending
Further Price Increases May Seriously Slow Goods Spending
That fact alone makes it almost certain that China will maintain its zero-tolerance COVID policy for most of 2022, which significantly raises the risk of additional factory and port shutdowns – and thus even higher shipping costs and imported goods prices. One optimistic point is that these shutdowns are more likely to occur in mainland China than in Taiwan Province or Malaysia, two key semiconductor exporters. This is because these two regions have distributed doses of Pfizer’s vaccine, and thus presumably have the ability to provide three-dose mRNA protection to workers in crucial exporting industries (should policymakers choose to do so). Still, US consumer goods prices would clearly be impacted by even higher shipping costs, which would likely have the combined effect of slowing growth and raising prices. Chart I-7 highlights that the recent sharp deterioration in US households’ willingness to buy durable goods has been closely linked to higher goods prices, arguing that goods spending may slow meaningfully if prices rise further alongside renewed weakness in services spending. Omicron’s contagiousness may also exacerbate the ongoing US labor shortage. The shortage has occurred because of a surge in the number of retirees, difficult working conditions in several industries, and increased childcare requirements during the pandemic. The increase in the number of retirees has not happened for structural reasons; it has been driven by a sharp slowdown in the number of older Americans shifting from “retired” to “in the labor force”, which has occurred because of health concerns. None of these factors are likely to improve meaningfully while Omicron is raging, suggesting that services prices are likely to remain elevated or accelerate further even if services spending falls anew.
Chart I-8
To conclude on this point, we estimate that the odds of a stagflation-lite scenario have risen to 35% (from 30%), and the odds of our base-case scenario of above-trend growth and above-target inflation have fallen to 55% (Chart I-8). Still, our base-case view remains the most probable outcome, given that we do not believe the odds of a recession next year have risen. The Risk Of Recession We do not think that the actual risk of a recession has risen significantly since we published our annual outlook, but we can envision a scenario in which Fed tightening causes investors to become fearful of a recession. Such a scenario would have a material impact on cyclical investment strategy, and thus warrants a discussion. Following the December FOMC meeting, BCA’s baseline expectation is that a first Fed hike will occur in June 2022 and that rate increases will proceed at a pace of 25 basis points per quarter through the end of the year. BCA’s house view on this question is now in line with the view of The Bank Credit Analyst service, which published in a September Special Report that the Fed could hit its maximum employment objective as early as next summer.3 The Fed’s shift implies that the 2-year yield should rise to 1.85%, and the 10-year yield to 2.35%, by the end of next year (Chart I-9). Chart I-9A More Hawkish Fed Means A 2.35% 10-Year Yield Next Year
A More Hawkish Fed Means A 2.35% 10-Year Yield Next Year
A More Hawkish Fed Means A 2.35% 10-Year Yield Next Year
We doubt that US monetary policy will become economically restrictive next year. If the Omicron variant of COVID-19 causes a serious slowdown in economic activity, the Fed will ramp down its expectations for rate hikes. And if the Fed meets our baseline expectations for hikes next year in the context of above-trend economic growth, we do not believe that a 2.35% 10-year Treasury yield will be, in any way, limiting for economic activity. However, investors do not agree with our view about the boundary between easy and tight monetary policy, and may begin to fear a recession in response to Fed tightening next year. We noted in our Outlook report that we believe the neutral rate of interest (“R-star”) is likely higher that investors believe, but the fact remains that the Fed and market participants have judged, with deep conviction, that the neutral rate remains very low relative to the potential growth rate of the economy. Chart I-10 presents the fair value path of the 2-year Treasury yield based on our expectations for the Fed funds rate, alongside the actual 10-year Treasury yield. The chart highlights that the 2/10 yield curve could flatten significantly or even invert in the second half of 2022 if long-maturity yields rise only modestly in response to Fed tightening, which could occur if investors focus on the view that the neutral rate of interest is low and that Fed rate hikes will not prove to be sustainable. Based on two different measures of the yield curve, fixed-income investors believe that the current economic expansion is already 50-60% complete (Chart I-11), implying a recession at some point in the first half of 2023. Chart I-10The US Yield Curve Could Invert Next Year If Long-Maturity Yields Rise Only Marginally
The US Yield Curve Could Invert Next Year If Long-Maturity Yields Rise Only Marginally
The US Yield Curve Could Invert Next Year If Long-Maturity Yields Rise Only Marginally
Chart I-11More Than Half Of The Economic Expansion Has Already Occurred, According To The Yield Curve
More Than Half Of The Economic Expansion Has Already Occurred, According To The Yield Curve
More Than Half Of The Economic Expansion Has Already Occurred, According To The Yield Curve
Chart I-12A Serious Flattening In The Yield Curve Could Unnerve Stocks
A Serious Flattening In The Yield Curve Could Unnerve Stocks
A Serious Flattening In The Yield Curve Could Unnerve Stocks
If the yield curve were to flirt with inversion and investors began to price in the potential for a recession, it would cause significant financial market turmoil regardless of whether the risk of recession is real or not. Chart I-12 highlights that the S&P 500 fell 20% in late 2018 as the 2/10 yield curve flattened towards 20 basis points, in response to the economic impact of the China-US Trade War and the global impact of US tariffs on the auto industry. So it is possible that a “recessionary narrative” negatively impacts risky asset prices in the second half of 2022, even if an actual recession is ultimately avoided. Based on this, we would be much more inclined to reduce our recommended exposure to equities if the US 2/10 yield curve were to flatten below 30 basis points next year. In our view, the risk of a monetary policy-induced recession over the coming 12-18 months will only legitimately rise if long-dated inflation expectations break above the range that prevailed prior to the Global Financial Crisis. We noted in our Outlook report that this has not yet occurred for either household or market-based expectations, although it is a risk that cannot be ruled out. The odds of a breakout in long-dated inflation expectations will rise the longer that actual inflation remains elevated, and our inflation probability model suggests that core PCE inflation will remain well above 3% next year and potentially above 4% – although Chart I-13 highlights that the odds of the latter are falling. Chart I-13US Core Inflation Will Remain Well Above Target Next Year
US Core Inflation Will Remain Well Above Target Next Year
US Core Inflation Will Remain Well Above Target Next Year
A dangerous breakout in inflation expectations would raise the risk of a recession because of the Fed’s awareness of the “sacrifice ratio”, a very important economic concept that has been mostly irrelevant for the past 25 years. The sacrifice ratio is an estimate of the amount of output or employment that must be given up in order to reduce inflation by one percentage point. Table I-1 highlights some academic estimates of the sacrifice ratio, which have typically varied between 2-4% in output terms. For comparison purposes, real GDP has typically fallen no more than 2% on a year-over-year basis during most post-war US recessions. Real GDP growth fell 4% year-over-year in 2009, highlighting that the cost of reducing the rate of inflation by 1 percentage point is effectively a severe recession.
Chart I-
In his Senate testimony in late-November, Fed Chair Jay Powell noted that persistently high inflation threatens the economic recovery. He also implied that to reach its maximum employment goal, the Fed may need to act pre-emptively to tame inflation. This was implicit recognition of the sacrifice ratio, and should be seen as an expression of the Fed’s desire to avoid a scenario in which persistently high inflation causes inflation expectations to become unanchored (to the upside), as it would force the Fed to sacrifice economic activity in order to ensure price stability. By acting earlier to normalize monetary policy, the Fed hopes to keep inflation expectations well contained. Chart I-14Long-Dated Market-Based Inflation Expectations Are Not Out Of Control
Long-Dated Market-Based Inflation Expectations Are Not Out Of Control
Long-Dated Market-Based Inflation Expectations Are Not Out Of Control
For now, we see no signs that the Fed will fail to keep inflation expectations from rising dangerously. Chart I-14 highlights that long-dated market expectations for inflation have been falling over the past two months, and are essentially at the same level that they were on average in 2018. Given this, we maintain the 10% odds of recession that we presented in our Outlook report, although investors will need to monitor inflation expectations closely over the coming year to judge whether the risks of a monetary policy-induced recession are indeed rising. Risks Beyond The Next Year Beyond 2022, the main risk to risky asset prices is probably not overly tight monetary policy. Instead, the risk is that investors will come to the conclusion that the Fed funds rate will ultimately end up rising above what the Fed is currently projecting, and that the economy will be capable of tolerating interest rates that are closer to the prevailing rate of economic growth. This would not be bad news for real economic activity, but it would imply meaningfully lower prices for financial assets that have benefited from low interest rates. Chart I-15US Stocks Would Suffer Significant Losses If Interest Rates Rise Towards Potential Growth
US Stocks Would Suffer Significant Losses If Interest Rates Rise Towards Potential Growth
US Stocks Would Suffer Significant Losses If Interest Rates Rise Towards Potential Growth
Chart I-15 drives the point home by comparing the current S&P 500 forward P/E ratio to a “justified” P/E. Here, we calculate the justified P/E using the average ex-ante equity risk premium (ERP) since 1980, and real potential GDP growth as a stand-in for the real risk-free rate of interest. The chart highlights that US stocks would experience a 30% contraction in equity multiples should real long-maturity bond yields approach 2%. A decline in the ERP could potentially reduce losses for equity holders in a higher interest rate scenario, but it is very likely that the net effect would still be negative for stocks. We detailed in our Outlook report why we believe that the neutral rate of interest is higher than most acknowledge. We agree that R-star fell in the US for a time following the Global Financial Crisis (GFC), but we strongly question that it is as low as the Fed and investors believe. The neutral rate of interest fell during the first half of the last economic cycle because of a persistent period of household deleveraging and balance-sheet repair, which was a multi-year consequence of the financial crisis and the insufficient fiscal response to the 2008-09 recession. We highlighted in our Outlook report that US household balance sheets have been repaired, and that the household debt service ratio has fallen to mid-1960s levels. However, Chart I-16 highlights that even the corporate sector, which has leveraged itself significantly over the past decade, has seen its debt service ratio plummet. In a scenario in which long-maturity Treasury yields were to rise to 4%, we estimate that the debt service burden of the nonfinancial corporate sector would rise to its 70th-80th percentile historically. Chart I-16The US Corporate Sector Debt Service Burden Has Room To Rise
The US Corporate Sector Debt Service Burden Has Room To Rise
The US Corporate Sector Debt Service Burden Has Room To Rise
That would be a meaningful increase from current levels, but it would not be unprecedented, and thus would not render a 4% 10-year Treasury yield to be economically unsustainable. In addition, we strongly suspect that corporations would reduce their interest burden in such a scenario by issuing equity to retire debt. That would lower firms’ debt burden and reduce the economic impact of higher interest rates, although it would be additionally negative for equity investors given that this would dilute earnings per share. We argued in our Outlook report that a shift in investor expectations about the neutral rate of interest is unlikely to occur before the Fed begins to normalize monetary policy. Ryan Swift, BCA’s US Bond Strategist, presented further evidence of this perspective in a Special Report earlier this week.4 Ryan highlighted results from a recent academic paper, which showed that the entire decline in the 10-year Treasury yield since 1990 has occurred during three-day windows centered around FOMC meetings (Chart I-17). Ryan argued that this suggests investors change their neutral rate expectations in response to Fed interest rate decisions, rather than in response to independent macroeconomic factors that are distinct from monetary policy action. This argues that a shift in neutral rate expectations is unlikely before the Fed begins to lift interest rates in the middle of the year, and probably not until the Fed has raised rates a few times. We are thus unlikely to recommend that investors reduce their equity exposure in response to this risk until 5-year, 5-year forward Treasury yields break above 2.5% (the Fed’s long-run Fed funds rate projection), which is 80 basis points above current levels (Chart I-18). Chart I-17Fed Rate Decisions Drive Long-Maturity Bond Yields
Fed Rate Decisions Drive Long-Maturity Bond Yields
Fed Rate Decisions Drive Long-Maturity Bond Yields
Chart I-18We Will Consider Selling Stocks If Market-Based Neutral Rate Estimates Exceed 2.5%
We Will Consider Selling Stocks If Market-Based Neutral Rate Estimates Exceed 2.5%
We Will Consider Selling Stocks If Market-Based Neutral Rate Estimates Exceed 2.5%
Investment Conclusions We continue to advise that investors position themselves in line with the investment recommendations that we presented in our Outlook report. Over the following 12-months, we expect the following: Global stocks to outperform bonds Short-duration fixed-income positions to outperform long High-yield corporate bonds to outperform within fixed-income portfolios Value stocks to outperform growth Non-resource cyclicals to outperform defensives Small caps to outperform large A modest rise in commodity prices led by oil A decline in the US dollar However, our discussion of the risks to our views has highlighted three things for investors to monitor next year when deciding whether to reduce exposure to stocks (and risky assets more generally): A breakout in long-dated inflation expectations, as that would likely cause the Fed to raise interest rates more aggressively than it currently projects. A significant flattening in the yield curve, as that would indicate that investors ultimately expect existing Fed rate hike projections to prove recessionary. A rise in 5-year, 5-year forward US Treasury yields above 2.5%, as that would indicate that investors may be upwardly shifting their expectations for the neutral rate of interest. Over the shorter-term, our discussion also underscored that the Omicron variant will likely disrupt economic activity to some degree over the coming three months, and that the risks of a stagflation-lite scenario next year have modestly increased because of the likely maintenance of China’s zero-tolerance COVID policy. We continue to expect that the widespread rollout of booster doses, as well as the progressive availability of effective and safe antiviral drugs, will limit Omicron’s impact on economic activity to the first half of 2022, and that the pandemic will recede in importance next year on average in comparison to 2021. As noted above, this assessment will be monitored continually in response to the release of new information, and we will provide an update in our February report. Jonathan LaBerge, CFA Vice President The Bank Credit Analyst December 23, 2021 Next Report: January 27, 2022 II. Stock Buybacks – Much Ado About Nothing Dear Client, This month’s Special Report is a guest piece by Doug Peta, BCA Research’s Chief US Investment Strategist. Doug’s report examines the impact of US stock buybacks using a median bottom-up approach, and presents a different perspective of the value vs. growth distribution of buybacks than we did in our October Section 2. I trust you will find his report interesting and insightful. Jonathan LaBerge, CFA The Bank Credit Analyst Elected officials’ antipathy for buybacks is unfounded, … : For the companies that are the primary drivers of buyback activity, returning cash to shareholders is more likely to have a positive impact on employment and investment than retaining it. and the idea that they boost stock returns may be, as well, … : Over the last ten years, a cap-weighted bucket of large-cap stocks that most reduced their share counts underperformed the bucket that most increased their share counts by 2% annually. especially within the Tech sector, which has most enthusiastically executed them: Despite the success of Apple, which has seen its market cap soar since embarking on a deliberate strategy to shrink its shares outstanding, a strategy buying Tech’s biggest net reducers and selling its biggest net issuers would have generated sizable negative alpha over the last ten years. The problem is the relative profile of net buyers and net issuers: In general, companies that consistently buy back their own stock are mature companies that cannot earn an accretive return by redeploying the capital their incumbent business generates. Net issuers, on the other hand, are often young companies seeking fresh capital to realize their abundant growth opportunities. The next year is likely to see a pickup of share buybacks nonetheless, … : Our US Equity Strategy service’s Cash Yield Prediction Model points to increased buyback activity in 2022. … as management teams are wedded to them and buying back stock is the best use of capital for the mature companies executing them: Better to return cash to shareholders than to enter new business lines beyond the company’s area of expertise or embark on dubious acquisitions, even in the face of a potential 1% surtax. In Capitol Hill’s current polarized state, stock buybacks are in select company with the tech giants and China as issues that unite solons on both sides of the aisle. They are also a hot-button issue for some investors, who see them as telltale signs of a market kept aloft by sleight of hand. Although we do not think they’re worth getting worked up over – they do not promote the misallocation of capital and they may not actually boost stock prices – they come up repeatedly in client discussions and are likely to remain a feature of the landscape even if they are eventually subjected to a modest federal surtax. We have therefore joined with the BCA Equity Analyzer team to pore over its bottom-up database for insights into the buyback phenomenon. After ranking nearly 600 stocks in our large-cap universe in order of their rolling 12-month percentage change in shares outstanding across the last ten years, we were surprised to discover that the companies that most reduced their share count underperformed the companies that most grew it. We were also surprised to find that Tech was by far the worst performer among the six sectors with negative net issuance. Ultimately, the performance story seemed to boil down to Growth stocks’ extended recent edge over Value stocks. We present the data, our interpretation of it, and some future investment implications in this Special Report. Buybacks’ Bad Rap From Capitol Hill to the White House, prominent Washington voices bemoan buybacks. In a February 2019 New York Times opinion piece,5 Senators Sanders (I-VT) and Schumer (D-NY) argued that equity buybacks divert resources from productive investment in the narrow interest of boosting share prices for the benefit of shareholders and corporate executives. To counter the increasing popularity of buybacks, they proposed legislation that would permit buybacks only after several preconditions for investing in workers and communities had been met. Echoing their concerns, the White House's framework for the Build Back Better bill included a 1% surcharge on stock buybacks, “which corporate executives too often use to enrich themselves rather than investing in workers and growing the economy.” Chart II-1The Smallest Companies Sell Stock; The Largest Buy It Back
The Smallest Companies Sell Stock; The Largest Buy It Back
The Smallest Companies Sell Stock; The Largest Buy It Back
Buybacks’ opponents may mean well, but they seem to be missing an essential point: by and large, the companies that buy back their own stock lack enough attractive investment opportunities to absorb the cash their operations generate. Companies with more opportunities than cash don’t buy back stock; they issue it (and/or borrow) to get the capital to pursue them. The simple generalization that large, mature companies buy back shares while small, growing companies issue new ones is borne out by rolling 12-month percentage changes in shares outstanding by large-cap and small-cap companies (Chart II-1). On an equal-weighted basis, large-cap companies’ rolling share count was flat to modestly down for ten years before the pandemic drove net issuance. Adjusting for market cap, rolling net issuance has been uninterruptedly negative, shrinking by more than 2% per year, on average. The equally weighted small-cap population has been a net issuer to the tune of about 4% annually, with the biggest small-caps issuing even more, pushing the cap-weighted annual average to north of 6%. The bottom line is that large-cap companies in the aggregate have been modestly trimming their share counts, with the biggest companies retiring more than 2% of their shares each year, while small-cap companies are serial issuers, led by their largest (and presumably most bankable) constituents. We are investors serving investors, not policymakers, academics or editorial columnists charged with developing and evaluating public policy. Our mandate is bullish or bearish, not good or bad. We point out the flaws in the prevailing criticism of buybacks simply to make the point that buybacks are not an impediment to productive investment and that no one should therefore expect that productivity and income will rise if legislators or regulators restrict them. On the contrary, since we believe that buybacks represent an efficient allocation of capital, we would expect that successful attempts to limit them will hold back growth at the margin. The Buyback Calculus A company that buys back more of its shares than it issues reduces its share count. All else equal, a company with fewer shares outstanding will report greater earnings per share and a higher return on equity. Increased earnings per share (EPS) does not necessarily ensure a higher share price; if a company’s P/E multiple declines by more than EPS rises, its price will fall. Distributing retained earnings to shareholders reduces a company’s capital buffer against shocks and limits its ability to fund investment internally, but companies that embark on the most ambitious buyback campaigns likely face limited investment opportunities and have much more of a buffer than they could conceivably require. Revealed preferences suggest that management teams like buybacks. They have every interest in getting share prices higher to maximize the value of their own compensation, which typically contains an equity component that accounts for an increasing share of total compensation the more they rise in the company’s hierarchy. It is unclear, however, just how much their attachment to buybacks is founded on an expectation that buying back stock will boost its price. The opportunity to extend their tenure by pursuing a shareholder-friendly policy may well offer a stronger incentive. Do Buybacks Boost Share Prices? Returning cash to shareholders is widely perceived as good corporate governance. It increases the effective near-term yield on an equity investment and denies management the cash to pursue dubious expansion schemes or squander capital on lavish perquisites. It facilitates the reallocation of capital away from cash cows to more productive uses. Buybacks are squarely beneficial in theory, but are they good for investors in practice? (Please see the Box II-1 for a description of the methodology we followed to answer the empirical question.) Box II-1 Performance Calculation Methodology After separating stocks into large- and small-cap categories based on Standard & Poor’s market cap parameters for inclusion in the S&P 500 and the SmallCap 600 indexes, we ranked the constituents in each category in reverse order of their rolling 12-month percentage change in shares outstanding at the end of each month from 2011 through 2021. We then placed the top three deciles (the biggest reducers of their share counts) into the High Buybacks bucket and the bottom three deciles (the biggest net issuers) into the Low Buybacks bucket. We used the buckets to backtest a zero-net-exposure strategy of buying the stocks in the High bucket with the proceeds from shorting the stocks in the Low bucket, calling it the High-Minus-Low (“HML”) strategy. We computed two sets of HML results for the large-cap and small-cap universes. The first populated the buckets without regard for sector representation (“sector-agnostic”) and the second populated the buckets in line with the sector composition of the S&P 500 and SmallCap 600 Indexes (“sector-neutral”). We also track equal-weighted and cap-weighted versions of each HML bucket to gain a sense of performance differences between constituents by size. The experience of the last ten years fails to support the widely held view that stock buybacks boost share prices. Following a zero-net-exposure strategy of owning the top three deciles of large-cap companies ranked by the rolling 12-month percentage reduction of shares outstanding and shorting the bottom three deciles generated a modest positive annual return above 1% (Chart II-2). Small caps merely broke even, largely because their biggest share reducers sharply underperformed in Year 1 of the pandemic. On a cap-weighted basis, however, the large-cap strategy generated a negative annual return a little over 1% during the period, indicating that the largest companies pursuing buyback programs lagged their net issuer counterparts. For small caps, the cap-weighted strategy also lagged the equal-weighted strategy, albeit by a smaller margin. On a sector-neutral basis, the large-cap HML strategy roundly disappointed. The equal-weighted version was never able to do much more than break even, slipping into the red when COVID arrived, while the cap-weighted version continuously lagged it, shedding about 1.5% annually (Chart II-3). Though it was hit hard by the pandemic, the equal-weighted small-cap HML strategy managed to generate about 1% annually, and boasted a 3.5% annualized return for the eight years through 2019. Chart II-2Buybacks May Help A Company's Stock Price At The Margin ...
Buybacks May Help A Company's Stock Price At The Margin ...
Buybacks May Help A Company's Stock Price At The Margin ...
Chart II-3... But They Are Not An Exploitable Factor
... But They Are Not An Exploitable Factor
... But They Are Not An Exploitable Factor
Drilling down to the sector level offers some additional insights. While changes in shares outstanding vary across large-cap sectors, with six sectors reducing their shares outstanding and five expanding them, every small-cap sector has been a net issuer in every single year, ex-Discretionaries and Industrials in 2019 (Chart II-4). Relative sector capital needs are largely consistent regardless of market cap, however, with REITs, which distribute all their income to preserve their tax-free status, unable to expand without raising cash in the capital markets, and Utilities, Energy and traditional Telecom Services being capital-intensive industries (Table II-1). Many Tech niches are capital-light, and established Industrials and Consumer businesses often throw off cash.
Chart II-4
Chart II-
There is less large- and small-cap commonality in HML relative sector performance than in relative sector issuance. Away from Real Estate, Tech and Discretionaries, small-cap HML sector strategies generated aggregate positive returns, led by Communication Services and Energy (Chart II-5). For the large caps, most HML sector strategies produced negative alpha, though the four winners and the one modest loser (Financials) are among the six sectors that have net retired shares outstanding since 2012. Tech is the conspicuous exception, with its HML strategy yielding annualized losses exceeding 3%, contrasting with the sector’s enthusiastic buyback embrace.
Chart II-5
The Corporate Life Cycle Surprising as they may be on their face, negative cap-weighted ten-year HML returns do not mean that buybacks are counterproductive. We simply think they illustrate that net issuance activity follows from a company’s position in the corporate life cycle (Figure II-1). Investors have prized growth in the aftermath of the global financial crisis, and the companies with the best growth prospects are often younger companies just beginning to tap their addressable markets. They have a long pathway of market share capture ahead of them and need to raise capital to begin traveling it. Many of these strong growers populate the Low basket, especially in the Tech sector.
Chart II-
Chart II-
Companies that return cash to their owners via share repurchases are often more mature. Their operations are comfortably profitable and generate more than enough cash to sustain them. They have already captured all the market share they’re likely to gain in their primary business and may not have an outlet for its proceeds in a space in which they have a plausible competitive advantage. Lacking a clear path to bettering the returns from their main operations, they have been steadily accumulating cash for a long time. Through the lens of the Boston Consulting Group’s (BCG) growth share matrix,6 a successful business in the Maturity stage of the business life cycle is known as a Cash Cow. Cash Cows have gained considerable market share in their industry, affording them a competitive advantage based on scale, brand and experience, but little scope for growth because they have saturated a market that is itself mature (Figure II-2). BCG advises management teams with a portfolio of business lines to milk Cash Cows for capital to reinvest in high-share, high-growth-potential Stars or low-share, high-growth-potential Question Marks that could be developed into Stars. In the public markets, a mature large-cap company that retains its excess capital impedes its owners’ ability to redeploy that capital to faster growing investments, subverting the overall economy’s ability to redirect capital to its best uses. Walmart, Twentieth-Century Growth Darling Chart II-6From Young Turk To Respected Elder
From Young Turk To Respected Elder
From Young Turk To Respected Elder
Walmart fits the business life cycle framework to a T and has evolved into a textbook Cash Cow. It is a dominant player that executed its initial strategy so well that it has maxed out its share in the declining/stagnating brick-and-mortar retail industry. Its international attempts to replicate its domestic success have uniformly failed to gain traction, and it currently operates in fewer major countries than it's exited. Given Walmart’s star-crossed international experience and the dismal history of large corporate combinations, returning cash may be the optimal use of shareholder capital. Walmart began life as a public company in fiscal 1971 squarely in the Growth phase. It was profitable from the start and grew annual revenues by at least 25% for every one of its first 23 years of public ownership (Chart II-6, top panel). It was a modest issuer of shares during its Growth phase, conducting just one secondary common stock offering 12 years after its IPO and otherwise limiting growth in shares outstanding to acquisitions, management incentive awards and debt and preferred stock conversions. Once its revenue growth slipped into the low double-digits in the late nineties, it began retiring its shares at a deliberate pace (Table II-2). That retirement inaugurated a ramping up of Walmart’s annual payout ratio (Chart II-6, bottom panel) and cash yield (dividend yield plus buyback yield), underlining its transition from Growth to Maturity. Walmart’s 2010 admission into the S&P 500 Pure Value Index marked its ripening into full maturity, and it has been a Pure Value fixture since 2013. Today’s stolid icon is a far cry from the ambitious disruptor on display in its 1980 Annual Report:
Chart II-
Subsequent to year end, your Company’s directors authorized [a one-third] increase in the annual dividend[.] This continues your Company’s approach of distributing a portion of profits to our shareholders and utilizing the balance to fund our aggressive expansion program. [T]he decade of the ’70’s … has been a tremendous growth period for your Company. In January 1970, we … had 32 stores …, comprising less than a million square feet of retail space. In the next ten years, we added 258 … stores, … constructed and opened three new distribution facilities, and increased our retail space to 12.6 million square feet. During that same period of time, we increased our sales and earnings at an annual compounded rate well in excess of 40 percent. Reflecting upon the progress we have made in the ‘70’s makes it apparent that there is even more opportunity in the ‘80’s for your Company, and we are better positioned to maximize our opportunities … than ever before. The Exception That Proves The Rule Apple has shined so far in the twenty-first century much like Walmart did in the latter stages of the twentieth, growing its revenues and net income at compound annual rates exceeding 20% and 25%, respectively. Unlike Walmart, however, Apple hasn’t required a steady stream of capital to grow. While Walmart had to plow its earnings right back into the business to fund the acquisition and buildout of property to create stores, warehouses and distribution centers, Apple has simply had to make incremental improvements to its music players, phones and tablets while shoring up the moats around its virtual app and music marketplaces. As a result, cash and retained earnings began silting up on Apple’s balance sheet, lying fallow in short-term marketable securities and crimping a range of return metrics.
Chart II-
Beginning in its 2013 fiscal year, Apple embarked on a lengthy strategy of returning that cash to shareholders, buying back stock at a rate that has allowed it to reduce its shares outstanding by 37.5% in the space of nine years (Table II-3). It has reduced its retained earnings by more than $90 billion over that span and is on course to wipe them out completely in the fiscal year ending next September. Equity issuance in the form of incentive compensation augments Apple’s capital by about $5 billion per year, but if it continues to distribute more than 100% of its annual earnings in the form of dividends and repurchases, it could wipe out the rest of its recorded equity capital as well. Does this mean Apple is in danger of sliding into insolvency? Not in the least. The value of its assets dramatically exceeds the value of its liabilities, as evidenced by its nearly $3 trillion market cap and the top AAA credit rating Moody’s awarded it this week. Its reported book value is artificially suppressed by generally accepted accounting principles’ inability to value organically developed intellectual property (IP). Apple’s book value and that of other companies that generate similar IP, or benefit from internally generated moats, are dramatically undervalued. Takeaways For now, Apple is an anomaly when it comes to aggressively returning cash to shareholders while it is still in the Growth stage of its life cycle. Returning cash is typically the province of mature companies with steady operations that are unlikely to grow. It is generally good for the economy when those companies return excess cash to shareholders, freeing it up for more productive uses. If lawmakers or regulators manage to restrict the flow of capital from cash-cow companies to potential stars, we should expect activity to slow at the margin, not quicken. The experience of the last ten years suggests that companies that shrink their share counts do not outperform their counterparts that expand them. The trading strategy of shorting the biggest net share issuers to purchase the biggest net share reducers has produced negative returns. It is unclear if shareholders of companies who cannot redeploy their internally generated capital to augment the returns from their primary operations would be better served if their manager-agents retained the capital, though we suspect they would not. It seems inevitable that manager-agents with access to too much capital will eventually get into mischief. If buying back stock represents good corporate stewardship at mature companies, their shareholders should someday be rewarded for it. Given that the companies most suited to buying back stock tend to fit in the Value style box, the zero-net-exposure HML strategy may continue to accrue losses. Apple remains an outlier among Growth companies as an avid buyer of its stock; much more common are the S&P 500 Life and Multi-Line Insurer sub-industry groups, without which the S&P 500 Pure Value Index would have a hard time reaching a quorum (Table II-4). Their constituents have assiduously bought back their stock over the last ten years, albeit to no relative avail (Chart II-7). However, they should be better positioned once Value returns to favor and rising interest rates make investing their cash flow a more attractive proposition.
Chart II-
Chart II-7... But No One Else Seems To Want To
... But No One Else Seems To Want To
... But No One Else Seems To Want To
Doug Peta, CFA Chief US Investment Strategist III. Indicators And Reference Charts BCA’s equity indicators highlight that the “easy” money from expectations of an eventual end to the pandemic have already been made. Our technical, valuation, and sentiment indicators remain very extended, highlighting that investors should expect positive but modest returns from stocks over the coming 6-12 months. Our monetary indicator has retreated below the boom/bust line, although this mostly reflects the use of producer prices to deflate money growth. In nominal terms, the supply of money continues to grow. Still, the retreat in the indicator over the past year highlights that the monetary policy stance is likely to move in a tighter direction over the coming year, which is in line with the Fed’s recent hawkish shift. Forward equity earnings are pricing in a substantial further rise in earnings per share. Net earnings revisions and net positive earnings surprises are rolling over, but there is no meaningful sign of waning forward earnings momentum. Bottom-up analyst earning expectations remain too high, but stocks are likely to be supported by robust revenue growth over the coming year. Within a global equity portfolio, we continue to recommend that investors position for the underperformance of financial assets that are negatively correlated with long-maturity government bond yields. The US 10-Year Treasury Yield remains well below the fair value implied by a mid-2022 rate hike scenario, underscoring that a move higher over the coming year is quite likely. Commodity prices remain elevated, and our composite technical indicator highlights that they remain overbought. An eventual slowdown in US goods spending, coupled with eventual supply-chain normalization and the absence of a significant reflationary impulse from Chinese policy, could weigh on commodity prices at some point over the coming 6 months. We expect stronger metals prices in the back half of 2022. US and global LEIs remain very elevated but have started to roll over. Our global LEI diffusion index has declined very significantly, but this likely reflects the outsized impact of a few emerging market countries (whose vaccination progress is still lagging). Still-strong leading and coincident indicators underscore that the global demand for goods is robust, and that output is below pre-pandemic levels in most economies because of very weak services spending. The latter will recover significantly at some point over the coming year, as the severity of the pandemic wanes. EQUITIES: Chart III-1US Equity Indicators
US Equity Indicators
US Equity Indicators
Chart III-2Willingness To Pay For Risk
Willingness To Pay For Risk
Willingness To Pay For Risk
Chart III-3US Equity Sentiment Indicators
US Equity Sentiment Indicators
US Equity Sentiment Indicators
Chart III-4US Stock Market Breadth
US Stock Market Breadth
US Stock Market Breadth
Chart III-5US Stock Market Valuation
US Stock Market Valuation
US Stock Market Valuation
Chart III-6US Earnings
US Earnings
US Earnings
Chart III-7Global Stock Market And Earnings: Relative Performance
Global Stock Market And Earnings: Relative Performance
Global Stock Market And Earnings: Relative Performance
Chart III-8Global Stock Market And Earnings: Relative Performance
Global Stock Market And Earnings: Relative Performance
Global Stock Market And Earnings: Relative Performance
FIXED INCOME: Chart III-9US Treasurys And Valuations
US Treasurys And Valuations
US Treasurys And Valuations
Chart III-10Yield Curve Slopes
Yield Curve Slopes
Yield Curve Slopes
Chart III-11Selected US Bond Yields
Selected US Bond Yields
Selected US Bond Yields
Chart III-1210-Year Treasury Yield Components
10-Year Treasury Yield Components
10-Year Treasury Yield Components
Chart III-13US Corporate Bonds And Health Monitor
US Corporate Bonds And Health Monitor
US Corporate Bonds And Health Monitor
Chart III-14Global Bonds: Developed Markets
Global Bonds: Developed Markets
Global Bonds: Developed Markets
Chart III-15Global Bonds: Emerging Markets
Global Bonds: Emerging Markets
Global Bonds: Emerging Markets
CURRENCIES: Chart III-16US Dollar And PPP
US Dollar And PPP
US Dollar And PPP
Chart III-17US Dollar And Indicator
US Dollar And Indicator
US Dollar And Indicator
Chart III-18US Dollar Fundamentals
US Dollar Fundamentals
US Dollar Fundamentals
Chart III-19Japanese Yen Technicals
Japanese Yen Technicals
Japanese Yen Technicals
Chart III-20Euro Technicals
Euro Technicals
Euro Technicals
Chart III-21Euro/Yen Technicals
Euro/Yen Technicals
Euro/Yen Technicals
Chart III-22Euro/Pound Technicals
Euro/Pound Technicals
Euro/Pound Technicals
COMMODITIES: Chart III-23Broad Commodity Indicators
Broad Commodity Indicators
Broad Commodity Indicators
Chart III-24Commodity Prices
Commodity Prices
Commodity Prices
Chart III-25Commodity Prices
Commodity Prices
Commodity Prices
Chart III-26Commodity Sentiment
Commodity Sentiment
Commodity Sentiment
Chart III-27Speculative Positioning
Speculative Positioning
Speculative Positioning
ECONOMY: Chart III-28US And Global Macro Backdrop
US And Global Macro Backdrop
US And Global Macro Backdrop
Chart III-29US Macro Snapshot
US Macro Snapshot
US Macro Snapshot
Chart III-30US Growth Outlook
US Growth Outlook
US Growth Outlook
Chart III-31US Cyclical Spending
US Cyclical Spending
US Cyclical Spending
Chart III-32US Labor Market
US Labor Market
US Labor Market
Chart III-33US Consumption
US Consumption
US Consumption
Chart III-34US Housing
US Housing
US Housing
Chart III-35US Debt And Deleveraging
US Debt And Deleveraging
US Debt And Deleveraging
Chart III-36US Financial Conditions
US Financial Conditions
US Financial Conditions
Chart III-37Global Economic Snapshot: Europe
Global Economic Snapshot: Europe
Global Economic Snapshot: Europe
Chart III-38Global Economic Snapshot: China
Global Economic Snapshot: China
Global Economic Snapshot: China
Jonathan LaBerge, CFA Vice President The Bank Credit Analyst Footnotes 1 Please see The Bank Credit Analyst "OUTLOOK 2022: Peak Inflation – Or Just Getting Started?", dated December 1, 2021, available at bca.bcaresearch.com 2 Early assessment of the clinical severity of the SARS-CoV-2 Omicron variant in South Africa by Wolter et al., medRxiv preprint, December 21, 2021. 3 Please see The Bank Credit Analyst “The Return To Maximum Employment: It May Be Faster Than You Think”, dated August 26, 2021, available at bca.bcaresearch.com 4 Please see US Bond Strategy “The Fed In 2022”, dated December 21, 2021, available at bca.bcaresearch.com 5 Opinion | Schumer and Sanders: Limit Corporate Stock Buybacks - The New York Times (nytimes.com) Accessed December 17, 2021. 6 https://www.bcg.com/about/overview/our-history/growth-share-matrix Accessed December 19, 2021. EQUITIES:FIXED INCOME:CURRENCIES:COMMODITIES:ECONOMY:
Dear client, This is our final report for this year. Clients who missed our FX key views report last week can access the link here. We thank you for your continued readership, and wish you happy and healthy holidays. Kind regards, Chester Highlights We were offside on the dollar this year. Our 94-95 ceiling for the DXY was punched in November (currently 96). More importantly, the dollar is the strongest performing G10 currency this year, which we did not anticipate. That said, both the Norges Bank and the Bank of England hiked rates today. This reinforces our conviction that the Fed will stay behind the curve. Our trades still managed to deliver alpha. Our batting average (percentage of wins) was 64%. Our worst performing trade was to go long silver in July this year and go short USD/JPY in May. This proved premature as the dollar extended its rally, following a hawkish shift by the Federal Reserve. Our best trades were being opportunistically long the Scandinavian currencies, short the gold/silver ratio and short EUR/GBP. More importantly, swimming against the tide, we benefited from respecting our stop losses, and not overstaying our welcome in profitable trades. Our current view is that the dollar has some more near-term upside. Our target for the DXY is 98 over the next few months or so, but we expect a reversal after. For the moment, we are playing three themes in the FX market – policy convergence between central banks (long EUR/GBP, AUD/NZD and short USD/JPY), a rise in FX volatility (long CHF/NZD), and forthcoming green shoots in China (long AUD/USD). That said, we will maintain tight stops on all these trades, given the landscape remains fraught with uncertainty. Feature The dollar is in a perfect storm, characterized by rising inflation that is prompting the Federal Reserve to turn more hawkish, but also raising the possibility that it kills the US recovery. The US 10/2 Treasury curve slope has flattened to 79 bps, and the 30/2 Treasury slope has collapsed to 120 bps (Chart 1A). Historically, this pattern of curve flattening has been symptomatic of a brewing recession and further gains in the dollar (Chart 1B). Chart 1AThe Dollar And The Yield Curve
The Dollar And The Yield Curve
The Dollar And The Yield Curve
Chart 1BThe Dollar And The Yield Curve
The Dollar And The Yield Curve
The Dollar And The Yield Curve
Two-year yields have shot up in the US, relative to other G10 countries. This is a phenomenon that has been pretty consistent throughout the year with sub-zero interest rate countries (euro area, Japan, Switzerland, Chart 2A) but is becoming even more broad based. Two-year yields are accelerating in the US versus countries such as Canada, New Zealand and Norway, where their central banks have already ended QE and/or are raising interest rates. It is also interesting that their currencies have depreciated more this year than what will be implied by nominal yield differentials (Chart 2B). Chart 2ARising Short-Term Rates In The US
Rising Short-Term Rates In The US
Rising Short-Term Rates In The US
Chart 2BRising Short-Term Rates In The US
Rising Short-Term Rates In The US
Rising Short-Term Rates In The US
The Federal Reserve’s own estimates suggest that a 10% increase in the dollar will shave US real growth by 50 bps the following year, an additional 20 bps the year after. This is occurring when China is easing monetary policy, which will likely support growth outside the US. Commodity currencies such as the AUD, NZD and NOK are very sensitive to subtle shifts in Chinese growth (Chart 3). If financial conditions tighten in the US while easing elsewhere, it pretty much ensures that growth will rotate next year from the US to other countries that have seen their currencies weaken (Chart 4). Chart 3Commodity Currencies Weighed Down By The China Slowdown
Commodity Currencies Weighed Down By The China Slowdown
Commodity Currencies Weighed Down By The China Slowdown
Chart 4The US Dollar And Relative ##br##Growth
The US Dollar And Relative Growth
The US Dollar And Relative Growth
This year, our bias was that the Fed will lag the inflation curve, relative to other central banks, and this will weaken the dollar. This thesis hinged on two critical observations. First, real rates in the US remained very low as the Fed was lagging other central banks in tightening policy. Almost all central banks, with the exception of the Bank of Japan and the European Central Bank, have already ended QE. Many have also hiked interest rates (Chart 5). Second, and related, inflation overshot in the US relative to other countries (Chart 6). Where we went wrong was not anticipating that the market would price in a more credible Fed, especially against other G10 central banks. Chart 5Worldwide Monetary Normalization Weighs On The Dollar
Worldwide Monetary Normalization Weighs On The Dollar
Worldwide Monetary Normalization Weighs On The Dollar
Chart 6Surging US Inflation Also Bearish For The Dollar
Surging US Inflation Also Bearish For The Dollar
Surging US Inflation Also Bearish For The Dollar
In the near term, we think the dollar continues to do well, but we are not betting on an overshoot. Longer term, the themes suggested in our outlook should play out, including a weaker dollar. In the next few sections, we review some of our big losses this year, as well as our winners. Finally, in April 2020, we designed a rules-based trading model to see if, over time, currencies could be traded purely mechanically. That model was also offside this year, shorting the dollar 9 out of 12 months. That said, over time, a model grounded in the fundamental basis that has defined the BCA approach provided alpha (Chart 7). According to the model, investors should be long most G10 currencies versus the dollar, except the Japanese yen and the New Zealand dollar (Chart 8A and 8B). Chart 7Our USD Model Takes A Long-Term Approach
Our USD Model Takes A Long-Term Approach
Our USD Model Takes A Long-Term Approach
Chart 8AOur Model Is USD Bearish
Our Model Is USD Bearish
Our Model Is USD Bearish
Chart 8BOur Model Is USD Bearish
Our Model Is USD Bearish
Our Model Is USD Bearish
Overall Trade Performance For 2021 Chart 9 highlights the timeline of closed trades in 2021, alongside performance. Our trades still managed to deliver alpha. Our batting average (percentage of wins) was 64%. The cumulative return this year was 37%, the mean return was 1.1%, and the median return was 1.3%.
Chart 9
Our worst performing trade was to go long silver in July this year and go short USD/JPY in May. Our long silver trade was by far the worst decision. Excluding this trade, our cumulative returns this year would have been 50.6%, with a mean return of 1.6%, and a median return of 1.4%. We implemented this trade after the hawkish shift by the Federal Reserve, but it proved premature as the dollar extended its rally. Short USD/JPY
Chart 10
We were long the yen against the dollar for the entire second half of 2020, and opportunistically long in the spring and summer of 2021. Real rate differentials versus the US supported the yen. Equally important was the yen’s hedging benefit among our other trades at the time, most of which were pro-growth. Finally, the yen was also cheap. Going long in June was particularly interesting. First, we believed that the dollar rally would be short lived, a view that was offside for 2021. We also observed that a nation’s currency tended to outperform as it hosted the Olympic Games, leading to our belief that the yen would benefit from the Tokyo Summer Games (Chart 10). In the end, the two-year yield differential between the US and Japan was the most important driver for the yen. We remain long, but with a stop loss at our latest entry point of 114.40. Long Petrocurrencies (CAD, NOK, MXN, RUB And COP) Versus The Euro Chart 11Commodity Currencies Still Have Upside
Commodity Currencies Still Have Upside
Commodity Currencies Still Have Upside
Our Commodity Strategists have been bullish oil since the bottom in 2020, a call that has been prescient. As a derivative, we went long a petrocurrency basket against the euro for most of the second half of 2020. We took profits on that trade when our trailing stop was triggered, but the returns were mostly from the carry. Towards the end of October 2021, we once again went long the basket, given the divergence between currency performance and surging oil prices (Chart 11). However, we were stopped out a month later as the dollar started to rally on the back of an increasingly hawkish Fed. Overall, our rational for the trade played out, but the meagre gains were because we were swimming against the tide of a strong dollar. Short EUR/GBP We sold this pair in September of 2020 mainly based on the belief that stalled UK/EU trade talks instilled too much pessimism in the market, leading to an undervalued pound against the euro. The UK data that came out during that time were also relatively strong compared to both the US and the euro area. We closed the trade for a sizeable profit. Short CAD/NOK Chart 12The CAD/NOK Still Has Downside
The CAD/NOK Still Has Downside
The CAD/NOK Still Has Downside
Our main rationale for this trade rested on the differences in geographies for these oil sources, amidst a bullish oil environment. While both of these petrocurrencies strengthened, Canadian oil’s lower grade and higher cost of transportation would subject the loonie to underperformance against the NOK. CAD/NOK is also correlated to EUR/USD because of economic ties, and so a bet on a stronger euro (driven by stronger economic performance outside the US) was also a bet on a lower CAD/NOK (Chart 12). Our view turned out to be right. Long EUR/CHF Chart 13EUR/CHF And The German Bund Yield
EUR/CHF And The German Bund Yield
EUR/CHF And The German Bund Yield
We went long EUR/CHF in November 2020 and took profits in May 2021. At the time, CHF had appreciated by 1.2% in a week, opening an interesting gap between EUR/CHF and USD/CHF. This suggested that either the franc was too high versus the euro, or the euro was too high versus the dollar. The overall rationale behind the trade was right. The SNB maintained a dovish stance with a close focus on the exchange rate. Going forward, rising yields on the back of an economic recovery will support EUR/CHF (Chart 13). EUR/CHF is also underpinned by cheap valuations. We remain long the cross. Long CAD/NZD And AUD/NZD Our bias on NZD for most of the 2021 has been negative at the crosses. This was based on two driving factors. First, according to our models, the kiwi is the most expensive G10 currency after the dollar. Second, we did not believe the Reserve Bank of New Zealand could credibly hike interest rates ahead of other G10 countries. New Zealand is an island geographically but not economically. As such, we have been short NZD at the crosses. Other factors add to this high-conviction view. First, the New Zealand stock market is the most defensive in the G10, while Canadian and Australian bourses are heavy in cyclical stocks. Should value start to outperform growth, this will favor the CAD/NZD and AUD/NZD cross. Second, in the commodity space, our bias is that energy and metals will fare better than agriculture, boosting loonie/aussie relative terms of trade. We remain long AUD/NZD, and made modest gains when we got stopped out of our previous position in April. Long Silver Relative To Gold Chart 14Gold/Silver Tracks The Dollar
Gold/Silver Tracks The Dollar
Gold/Silver Tracks The Dollar
We shorted the the gold/silver ratio four times throughout the year based on the view that global ex-US growth was poised to recover amid very accommodative policy. As such, industrial precious metals would be well supported. The gold/silver ratio is also a play on the dollar (Chart 14). Our first two attempts earlier in the spring to catch the drawdown in the gold/silver ratio both profited handsomely, registering 6.25% and 8.45% returns respectively. However, since June, the dollar has strenghthend, which has eroded the anti-fiat appeal of silver. Long Scandinavian Currencies We were long NOK and SEK for most of 2021. We were bullish on the NOK as the Norges Bank is leading the pack in raising interest rates, as we witnessed today. Indeed, for the first half of the year, the return on our Scandinavian basket was driven primarily by the NOK against both the dollar and the euro. We respected our trailing stop loss on this trade, and will reinitiate in the near future. Short AUD/MXN Chart 15AUD/MXN Still Richly Valued
AUD/MXN Still Richly Valued
AUD/MXN Still Richly Valued
Short AUD/MXN was a play on a slowdown in China. A falling credit impulse in China, and a short-term recovery in the US economy relative to the rest of the world, argued for an AUD/MXN short. Further, on a real effective exchange rate basis, AUD/MXN was richly valued (Chart 15). Our first attempt to trade the pair was unsuccessful. Once our stop loss was triggered, we reinitiated the trade and made a net profit. Long CHF/NZD We went long this pair as both a bet on rising currency volatility, but also as a hedge to our portfolio of trades, which were pivoted towards growth and recovery. Our view was right. The pair did strengthen for much of the early part of the year leading up to the end of August. We exited for a minscule profit, but reinitiated, and are now sitting on 3.98% gains. Long EUR/USD The euro has been the toughest call this year, because the ECB has been surprisingly steady on its path to keep interest rates low. In July, our limit buy on EUR/USD was triggered at 1.18. Even though a dollar rally was a major risk, we argued adjustment in the weight of the shelter component in the euro area CPI basket will boost the European CPI relative to the US. This proved premature and we obeyed our stop loss. Chester Ntonifor Foreign Exchange Strategist chestern@bcaresearch.com Kate Sun Research Analyst kate.sun@bcaresearch.com Trades & Forecasts Strategic View Tactical Holdings (0-6 months) Forecast Summary
Dear Client, This week we present our annual Commodities & Energy Strategy outlook, which contains our key views on the principal markets we cover – energy, base metals and bulks, precious metals, and ags. Over the coming decade, we expect industrial commodity prices to move higher in an increasingly volatile fashion, not unlike these markets' recent experience. In the short term, commodity markets will remain exquisitely sensitive to the evolution of the COVID-19 pandemic. The highly transmissible omicron variant of the coronavirus – now spreading at more than 4x the rate of the delta variant – appears to be less lethal than previous mutations, suggesting it could become the dominant variant globally. We remain wary, however, particularly as China still is operating under a zero-tolerance COVID-19 policy, and has relied on less efficacious vaccines that appear to offer no protection against the omicron variant of the coronavirus. This also is a risk for EM economies that rely on these vaccines. However, the roll-out of mRNA vaccines globally via joint ventures will be gathering steam in 2H22, which is bullish for commodity demand. Longer term, the effort to decarbonize global energy markets is gaining traction, with the three largest economies in the world – the US, China and EU – embarked on a massive transition to renewables. This will be a multi-decade undertaking that literally could transform the world. We expect this to continue to unfold in an erratic and uncoordinated fashion, as states work out how to decarbonize the production, delivery and consumption of goods and services. Markets critical to this transition, particularly base metals, face long odds developing the supply that will be necessary for this effort. Conventional energy markets – oil, gas and coal – are in a forced wind-down imposed by courts, investors, governments, climate activists, public opinion and policymakers, which is reducing supply at a faster rate than demand. This leaves markets exposed to volatile price bursts. As is our custom, this will be the last CES report of the year. This decade promises to be extraordinary for commodities, and we are hopeful we will continue to be of service in navigating the epic transition to a low-carbon future. As you gather with friends and loved ones, we wish you all the best in this beautiful season, Robert Ryan Chief Commodity & Energy Strategist Highlights Macro: Bullish. Systematically important central banks will remain wary of moving too strongly too soon, in the wake of the COVID-19 omicron variant. US real rates will remain low and the USD will weaken, which will support commodities. Energy: Bullish. OPEC 2.0 and the price-taking cohort will maintain existing production policies, which will restrain oil supply. The omicron variant likely will dent demand, not tank it. Our 2022 Brent forecast is slightly weaker on omicron risk, averaging $78.50/bbl, with most of the demand hit in 1H22 made up in 2H22, while our 2023 forecast is $80/bbl. Base Metals: Bullish. Supply-demand balances will remain tight. Climate activism in courts and boardrooms; ESG-related costs, local and geopolitical uncertainty will continue to weigh on supply. COMEX copper will average $4.80/lb next year and $6.00/lb in 2023. Precious Metals: Bullish. Rising commodity prices will feed directly into inflation gauges favored by the Fed. Inflation and inflation expectations will remain elevated. Gold will push to $2,000/oz and silver to $30/oz in 2022. Ags/Softs: Neutral. Ag markets will remain balanced, with a bias to the upside from higher costs of fertilizer and transportation. Erratic weather remains an upside risk. Risk: Elevated. On the upside, a less lethal omicron variant that dominates other COVID-19 variants will rally markets. A more virulent mutant would hit demand harder and push prices lower. Hospitalizations/Cases and Deaths/Cases remain the critical ratios – trajectories need to remain flat to downward for growth (Chart of the Week). Recommendations: Our COMT ETF position was stopped out on 13 December 2021, which is when the ETF went ex-dividend. The ETF paid $5.4941/share for an 18.44% dividend (p.a.). Our stop-loss is being overridden, and we remain long the COMT ETF, in the expectation commodity markets will remain tight and backwardation will continue to drive returns. Feature COVID-19 continues to determine the trajectory of global growth – hence commodity demand – and how it will be distributed in the short run. Reports this week indicating the widely used Sinovac COVID-19 vaccine used in China and EM states is ineffective in neutralizing the omicron variant will renew the focus on an underappreciated risk: High vaccination rates in and of themselves are not useful indicators of successful public-health responses.1 More than anything, what appears to matter most is the vaccine that's been used to address the public-health threat posed by COVID-19. A booster of the Pfizer-BioNTech mRNA vaccine, e.g., appears to neutralize the omicron variant, and to convey a higher likelihood of avoiding serious illness and hospitalization.2
Chart 1
This will be important going forward, as the COVID-19 omicron variant appears to be transmitted at a rate that is 4.2x as contagious as the delta variant. This raises the odds that hospital beds will fill faster as the omicron mutant spreads.3 This could again lead to reduced availability of health care, and additional lockdowns to contain the spread of the omicron variant, which would again radiate through global supply chains. Oil Market Outlook Hinges On Omicron Response The risk exposed in these public-health developments is the global commodity recovery – particularly for crude oil and refined products like gasoline and jet fuel – could become more bifurcated this year, with economies using primarily mRNA technology continuing to open and recover. States without access to or distribution of these vaccines will have to rely more on social distancing and lockdowns to contain the spread of the virus. We would expect this to be a powerful inducement to accelerate local production and distribution of mRNA vaccines in Asia, Latin America and Europe. Successful implementation of this strategy would boost commodity demand, particularly for transportation fuels.4 Our prior regarding the omicron variant is it will dent demand but not tank oil demand. To account for the so-far-unknown effects of omicron, we are assuming 1H22 global crude and refined-product demand falls to 100.4mm b/d, versus our earlier estimate of 101.5mm b/d. Most of this demand is recovered in 2H22, when we expect oil consumption to average 101.8mm b/d versus our earlier expectation of 102.5mm b/d. On the supply side, OPEC 2.0 core producers – KSA, Russia, Iraq, UAE and Kuwait – will continue to implement the coalition's production-management strategy – i.e., keeping the level of supply just below demand. Meanwhile, the price-taking cohort led by the US shale-oil producers will continue to focus on profitability, not production for the sake of production. Accelerating production too rapidly at this point would undo much of the work and effort undertaken to establish oil and gas companies as attractive alternatives for investors. Our 2022 Brent forecast is weaker by $1.50/bbl vs last month's estimate, averaging $78.50/bbl. Our 2023 forecast is $1/bbl lower, with our average expectation at $80.00/bbl (Chart 2). Longer term, oil + gas capex remains weak (Chart 3). As we have stressed repeatedly, this is wicked bullish for prices in 2024 and beyond. Chart 2Brent Forecast Slightly Weaker In 2022
Brent Forecast Slightly Weaker In 2022
Brent Forecast Slightly Weaker In 2022
Chart 3
Table 1BCA Global Oil Supply - Demand Balances (MMb/d, Base Case Balances) To Dec23
2022 Key Views: Past As Prelude For Commodities
2022 Key Views: Past As Prelude For Commodities
Weak Capex Keeps Base Metals Outlook Bullish Weak capex is a common theme in the industrial commodities – oil and base metals – which points to tight supply-demand balances for these markets going forward. This is as true for base metals as it is for oil (Chart 4). The principal drivers of the capex squeeze are similar in both markets: A desire to regain investors' favor after years of poor returns. This has managements focused on returning capital to shareholders either in the form of share buybacks or higher dividend payments. However, there are additional pressures adding to the cost structures of industrial commodities, particularly the seismic shifts in the political underpinnings of commodity-exporting countries, where left-of-center politicians are proving more attractive to the median voter in states with contestable elections. Once elected – e.g., in Peru, and, likely Chile after this weekend's elections – politicians push hard to secure a greater share of mining revenues for long-neglected poor and indigenous populations.5
Chart 4
The bellwether base metal market – copper – best highlights these factors, which, in our view, will keep base-metals capex tentative and restrained over the medium term. Miners are almost forced to exercise capex restraint until they get greater clarity on how newly elected governments will deliver on their avowed intent to secure a greater share of mining revenues for their constituents. This is particularly true in Chile and Peru – which together account for a combined 40% of global copper ore output – where poor and indigenous populations are engaging in more frequent civil disobedience.6 In addition to the contentious changing of the guard at the political level, ESG-related initiatives brought to the fore by climate activists elected to corporate boards and in court proceedings are adding new layers of cost to base-metals mining (and oil and gas exploration for that matter). This week, Reuters reported on separate court decisions in Australia and Chile that redress mistreatment of aboriginal peoples in key metals-exporting states.7 We believe political and ESG-related costs will raise miners' all-in sustaining costs, which will have to be covered by higher prices going forward. The additional costs that will be imposed on miners trying to meet the demand that will be driven by the global decarbonization and renewable-energy buildout now kicking into high gear will require prices to spur investment in new mine production, and to keep existing and brownfield production up and running.8 Copper prices will get an assist from a weaker USD, which will boost demand for the metal ex-US (Chart 5). We are expecting copper to push to $4.80/lb on average next year and $6.00/lb in 2023 on the COMEX, on the back of stronger supply fundamentals and a weaker USD. Chart 5A Weaker USD Will Boost Copper
A Weaker USD Will Boost Copper.
A Weaker USD Will Boost Copper.
Gold Will Rally As Inflation, Uncertainty Remain Elevated Gold prices will move higher in 2022 – our target remains $2,000/oz – as investors seek cover from higher commodity prices, which will feed directly through to higher inflation (Chart 6).9 This has been apparent in the recent US PCEPI and core PCEPI – the Fed's preferred inflation gauge – and CPI data, and at the wholesale level in PPI data. Most of this results from tight supplies for commodities and strong demand for goods, which is driving the price increases. We expect this to continue into 2022, as pent-up consumer demand continues to drive goods purchases and supply-side tightness for most manufacturing inputs. Higher prices across commodity markets will keep inflation gauges elevated in 2022. In addition to the inflation-hedging demand we expect next year, investors also will turn to gold as a hedge against economic policy uncertainty: As inflation and policy uncertainty increase, gold prices move higher (Chart 7). Chart 6Higher Commodity Prices Will Pressure Inflation Higher
Higher Commodity Prices Will Pressure Inflation Higher
Higher Commodity Prices Will Pressure Inflation Higher
Chart 7Investors Will Use Gold To Hedge Inflation, Uncertainty
Investors Will Use Gold To Hedge Inflation, Uncertainty
Investors Will Use Gold To Hedge Inflation, Uncertainty
Lastly, in line with our colleagues in BCA's Foreign Exchange Strategy service, we remain USD bears in 2022. As is the case with all commodities, gold will benefit from a weaker USD.10 Ags Remain Balanced In 2022 Global ag markets, by and large, will remain balanced over the current crop year (Chart 8), with a bias to the upside as input and transportation costs – chiefly fertilizers and grain vessels, respectively – remain high (Charts 9 and 10). Erratic weather, as always, remains an upside risk.
Chart 8
Chart 9
Chart 10… And Fertilizer Costs Will Push Grains, Beans Higher
Natgas Price Surge Pushes Fertilizer Prices Higher
Natgas Price Surge Pushes Fertilizer Prices Higher
While we remain neutral grains, the periodic price spikes resulting from higher freight rates and natural gas prices will support overall commodity exposures. Over the short term, the risk of higher prices is acute: Markets still are contending with the possibility of another colder-than-normal winter. This would push natgas prices – and, because it is 70% natgas, fertilizer costs – sharply higher next year. This will have to be recouped by higher food prices, particularly if shipping costs spike higher due to COVID-19-induced port closures. Surging food prices will keep inflation rates higher globally, making them more persistent (vs. transitory). Investment Implications Global supply-demand fundamentals continue to support our conviction commodity markets will remain tight in 2022. As such we remain long commodity index exposure – the S&P GSCI and COMT ETF – expecting market tightness to result in renewed backwardation. We also remain long the PICK expecting continued tightness in base metals. Risks to our views remain elevated – and occur in both directions. On the upside, commodities will rally if a less-lethal omicron variant becomes the dominant COVID-19 strain and does not overly tax hospital resources or drive death rates higher. It could actually convey a global benefit as the dominant strain, crowding out other mutations and pushing states to herd immunity. On the downside, it's still too early to tell how this new variant and other mutations will behave. Given the fragility of the current global recovery and reopening shown in the initial response to omicron, a more virulent mutant likely would hit aggregate demand hard, forcing yet another supply-side adjustment in commodities generally. Upside risks dominate in our assessment, but, as always, we remain cautious. Robert P. Ryan Chief Commodity & Energy Strategist rryan@bcaresearch.com Ashwin Shyam Research Associate Commodity & Energy Strategy ashwin.shyam@bcaresearch.com Footnotes 1 Please see Sinovac shot offers inadequate shield from Omicron variant, says HK study published by straitstimes.com on December 15, 2021. The Sinovac vaccine is almost half as effective as mRNA-based vaccines, and is widely distributed in EM economies. We flagged this risk earlier in July in our report titled Assessing Risks To Our Commodity Views; it is available at ces.bcaresearch.com. 2 Please see Pfizer Booster Shots Are Effective Against Omicron Variant, Israeli Study Says published by wsj.com on December 12, 2021. 3 Please see Omicron four times more transmissible than Delta in Japan study published by straitstimes.com on December 9, 2021. 4 Please see Upside Price Risk Rises For Crude, which we published on September 16, 2021, for addition discussion of the global joint-ventures engaged in local production of mRNA vaccines. 5 Please see Add Local Politics To Copper Supply Risks, which we published on November 25, 2021 and Chile: Prepare For A Boric Win, published by BCA's Emerging Markets Strategy service on December 15, 2021. The latter report discusses the growing odds of a victory for the left-of-center candidate in Chile's election this weekend. 6 Please see, e.g., Peru's poor Andean hamlets, backed by state, unleash anger at mines, published by reuters.com on December 14, 2021. 7 Please see Australian mining state passes Aboriginal heritage protection law, and Chile's Supreme Court orders new evaluation of Norte Abierto mining project published by reuters.com on December 15 and 14, 2021, respectively. 8 Incremental investment needed to meet 2050 net-zero climate goals will come to almost $2 trillion per year, half of which will go into renewable power generation, industrial processes, and transportation, according to estimates by Goldman Sachs, published on December 13, 2021. 9 Please see More Commodity-Led Inflation On The Way, which we published on December 9, 2021. It is worthwhile reiterating Granger-causality between realized and expected inflation gauges (US PCEPI, core PCEPI, CPI, along with 5-year/5-year CPI swap rates) and commodity price indices (the S&P GSCI and Bloomberg Commodity Index) is very strong. 10 Please see 2022 Key Views: Tug Of War, published by BCA's Foreign Exchange Strategy service on December 10, 2021. Investment Views and Themes Strategic Recommendations Trades Closed in 2021
Image
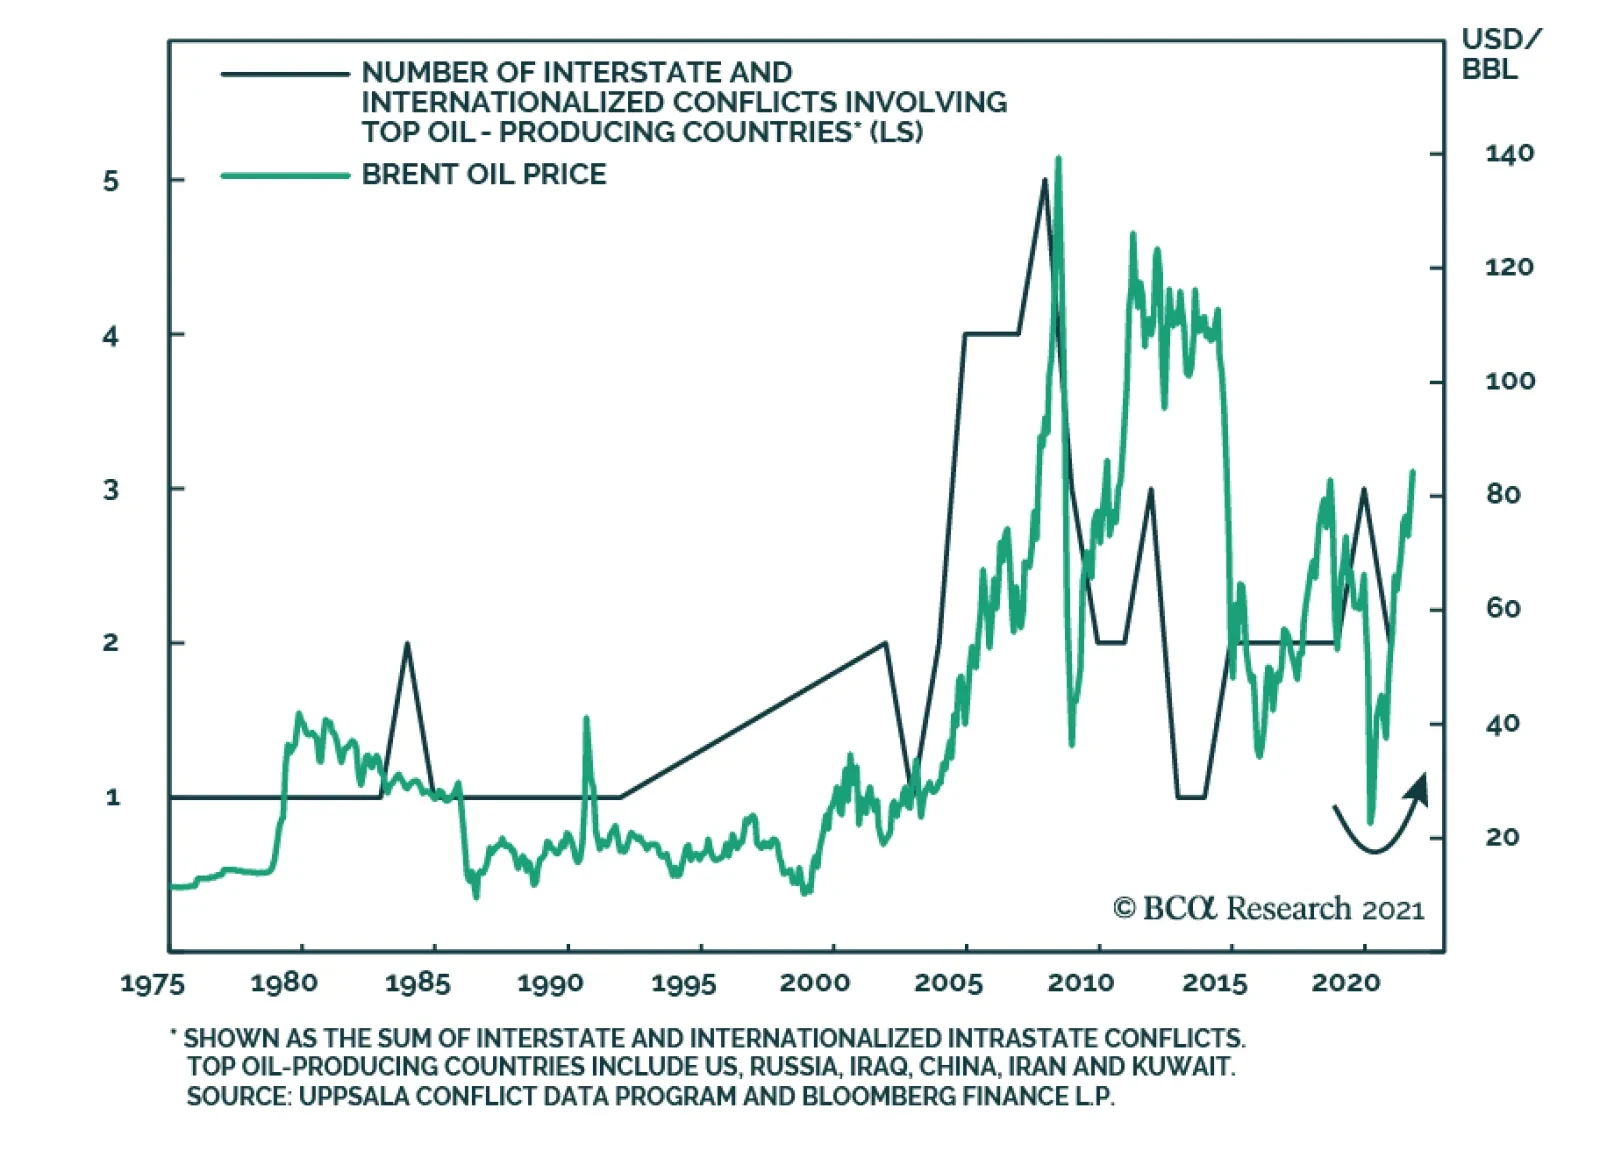
BCA Research’s Geopolitical Strategy service concludes that energy supply is vulnerable to major disruptions in 2022. Oil and natural gas producers gain leverage when the global economy rebounds, commodity prices rise, and supply/demand balances tighten. The…
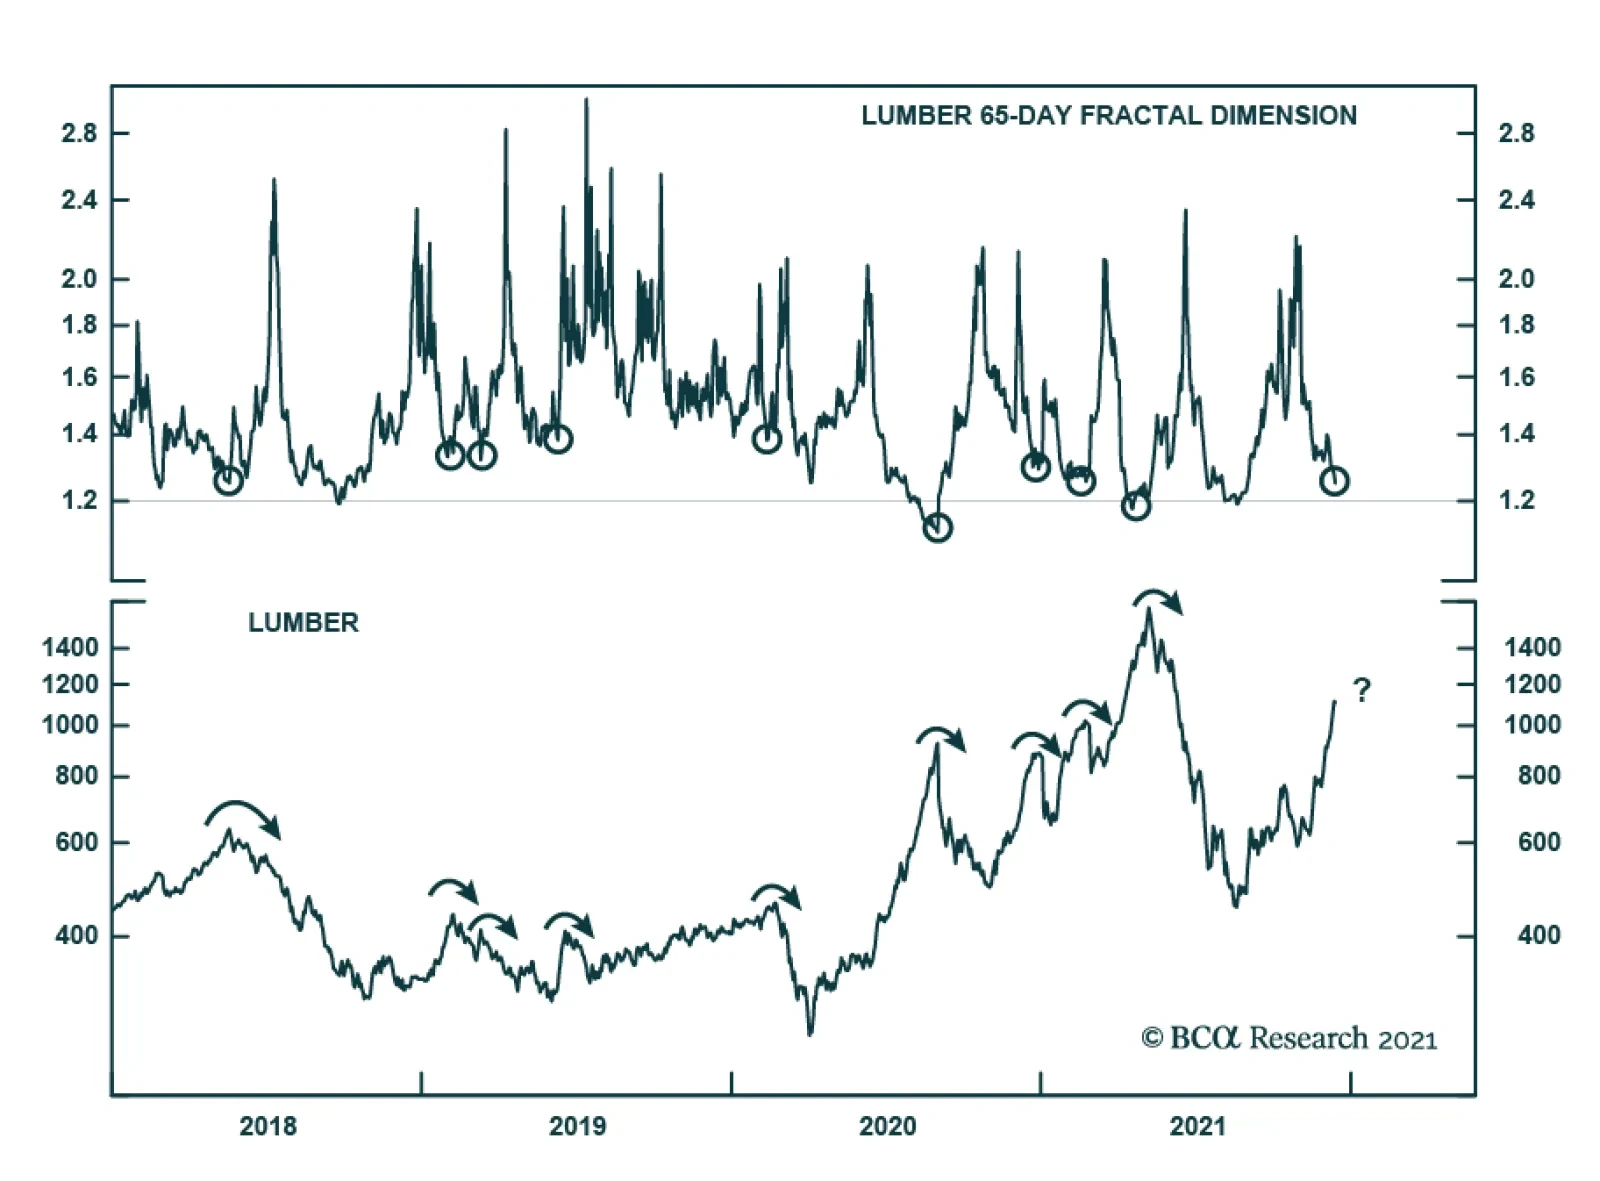
After a dramatic fall from grace over the summer, lumber prices are once again on the rise. They have doubled over the past month alone. Both supply-side and demand-side factors explain the recent rally. On November 24, the US Commerce Department doubled…
Highlights Our three strategic themes over the long run: (1) great power rivalry (2) hypo-globalization (3) populism and nationalism. The implications are inflationary over the long run. Nations that gear up for potential conflict and expand the social safety net to appease popular discontent will consume a lot of resources. Our three key views for 2022: (1) China’s reversion to autocracy (2) America’s policy insularity (3) petro-state leverage. The implications are mostly but not entirely inflationary: China will ease policy, the US will pass more stimulus, and energy supply may suffer major disruptions. Stay long gold, neutral US dollar, short renminbi, and short Taiwanese dollar. Stay tactically long global large caps and defensives. Buy aerospace/defense and cyber-security stocks. Go long Japanese and Mexican equities – both are tied to the US in an era of great power rivalry. Feature Chart 1US Resilience
US Resilience
US Resilience
Global investors have not yet found a substitute for the United States. Despite a bout of exuberance around cyclical non-US assets at the beginning of 2021, the year draws to a close with King Dollar rallying, US equities rising to 61% of global equity capitalization, and the US 30-year Treasury yield unfazed by inflation fears (Chart 1). American outperformance is only partly explained by its handling of the lingering Covid-19 pandemic. The US population was clearly less restricted by the virus (Chart 2). But more to the point, the US stimulated its economy by 25% of GDP over the course of the crisis, while the average across major countries was 13% of GDP. Americans are still more eager to go outdoors and the government has been less stringent in preventing them (Chart 3).
Chart 2
Chart 3Social Restrictions Short Of Lockdown
Social Restrictions Short Of Lockdown
Social Restrictions Short Of Lockdown
Going forward, the pandemic should decline in relevance, though it is still possible that a vaccine-resistant mutation will arise that is deadlier for younger people, causing a new round of the crisis. The rotation into assets outside the US will be cautious. Across the world, monetary and credit growth peaked and rolled over this year, after the extraordinary effusion of stimulus to offset the social lockdowns of 2020 (Chart 4). Government budget deficits started to normalize while central banks began winding down emergency lending and bond-buying. More widespread and significant policy normalization will get under way in 2022 in the face of high core inflation. Tightening will favor the US dollar, especially if global growth disappoints expectations. Chart 4Waning Monetary And Credit Stimulus
Waning Monetary And Credit Stimulus
Waning Monetary And Credit Stimulus
Chart 5Global Growth Stabilization
Global Growth Stabilization
Global Growth Stabilization
Global manufacturing activity fell off its peak, especially in China, where authorities tightened monetary, fiscal, and regulatory policy aggressively to prevent asset bubbles from blowing up (Chart 5). Now China is easing policy on the margin, which should shore up activity ahead of an important Communist Party reshuffle in fall 2022. The rest of the world’s manufacturing activity is expected to continue expanding in 2022, albeit less rapidly. This trend cuts against US outperformance but still faces a range of hurdles, beginning with China. In this context, we outline three geopolitical themes for the long run as well as three key views for the coming 12 months. Our title, “The Gathering Storm,” refers to the strategic challenge that China and Russia pose to the United States, which is attempting to form a balance-of-power coalition to contain these autocratic rivals. This is the central global geopolitical dynamic in 2022 and it is ultimately inflationary. Three Strategic Themes For The Long Run The international system will remain unstable in the coming years. Global multipolarity – or the existence of multiple, competing poles of political power – is the chief destabilizing factor. This is the first of our three strategic themes that will persist next year and beyond (Table 1). Our key views for 2022, discussed below, flow from these three strategic themes. Table 1Strategic Themes For 2022 And Beyond
2022 Key Views: The Gathering Storm
2022 Key Views: The Gathering Storm
1. Great Power Rivalry Multipolarity – or great power rivalry – can be illustrated by the falling share of US economic clout relative to the rest of the world, including but not limited to strategic rivals like China. The US’s decline is often exaggerated but the picture is clear if one looks at the combined geopolitical influence of the US and its closest allies to that of the EU, China, and Russia (Chart 6).
Chart 6
China’s rise is the most destabilizing factor because it comes with economic, military, and technological prowess that could someday rival the US for global supremacy. China’s GDP has surpassed that of the US in purchasing power terms and will do so in nominal terms in around five years (Chart 7).
Chart 7
True, China’s potential growth is slowing and Chinese financial instability will be a recurring theme. But that very fact is driving Beijing to try to convert the past 40 years of economic success into broader strategic security. Chart 8America's Global Role Persists (If Lessened)
America's Global Role Persists (If Lessened)
America's Global Role Persists (If Lessened)
Since China is capable of creating an alternative political order in Asia Pacific, and ultimately globally, the United States is reacting. It is penalizing China’s economy and seeking to refurbish alliances in pursuit of a containment policy. The American reaction to the loss of influence has been unpredictable, contradictory, and occasionally belligerent. New isolationist impulses have emerged among an angry populace in reaction to gratuitous wars abroad and de-industrialization. These impulses appeared in both the Obama and Trump administrations. The Biden administration is attempting to manage these impulses while also reinforcing America’s global role. The pandemic-era stimulus has enabled the US to maintain its massive trade deficit and aggressive defense spending. But US defense spending is declining relative to the US and global economy over time, encouraging rival nations to carve out spheres of influence in their own neighborhoods (Chart 8). Russia’s overall geopolitical power has declined but it punches above its weight in military affairs and energy markets, a fact which is vividly on display in Ukraine as we go to press. The result is to exacerbate differences in the trans-Atlantic alliance between the US and the European Union, particularly Germany. The EU’s attempt to act as an independent great power is another sign of multipolarity, as well as the UK’s decision to distance itself from the continent and strengthen the Anglo-American alliance. If the US and EU do not manage their differences over how to handle Russia, China, and Iran then the trans-Atlantic relationship will weaken and great power rivalry will become even more dangerous. 2. Hypo-Globalization The second strategic theme is hypo-globalization, in which the ancient process of globalization continues but falls short of its twenty-first century potential, given advances in technology and governance that should erode geographic and national boundaries. Hypo-globalization is the opposite of the “hyper-globalization” of the 1990s-2000s, when historic barriers to the free movement of people, goods, and capital seemed to collapse overnight. Chart 9From 'Hyper-Globalization' To Hypo-Globalization
From 'Hyper-Globalization' To Hypo-Globalization
From 'Hyper-Globalization' To Hypo-Globalization
The volume of global trade relative to industrial production peaked with the Great Recession in 2008-10 and has declined slowly but surely ever since (Chart 9). Many developed markets suffered the unwinding of private debt bubbles, while emerging economies suffered the unwinding of trade manufacturing. Periods of declining trade intensity – trade relative to global growth – suggest that nations are turning inward, distrustful of interdependency, and that the frictions and costs of trade are rising due to protectionism and mercantilism. Over the past two hundred years globalization intensified when a broad international peace was agreed (such as in 1815) and a leading imperial nation was capable of enforcing law and order on the seas (such as the British empire). Globalization fell back during times of “hegemonic instability,” when the peace settlement decayed while strategic and naval competition eroded the global trading system. Today a similar process is unfolding, with the 1945 peace decaying and the US facing the revival of Russia and China as regional empires capable of denying others access to their coastlines and strategic approaches (Chart 10).1 Chart 10Hypo-Globalization And Hegemonic Instability
Hypo-Globalization And Hegemonic Instability
Hypo-Globalization And Hegemonic Instability
Chart 11Hypo-Globalization: Temporary Trade Rebound
Hypo-Globalization: Temporary Trade Rebound
Hypo-Globalization: Temporary Trade Rebound
No doubt global trade is rebounding amid the stimulus-fueled recovery from Covid-19. But the upside for globalization will be limited by the negative geopolitical environment (Chart 11). Today governments are not behaving as if they will embark on a new era of ever-freer movement and ever-deepening international linkages. They are increasingly fearful of each other’s strategic intentions and using fiscal resources to increase economic self-sufficiency. The result is regionalization rather than globalization. Chinese and Russian attempts to revise the world order, and the US’s attempt to contain them, encourages regionalization. For example, the trade war between the US and China is morphing into a broader competition that limits cooperation to a few select areas, despite a change of administration in the United States. The further consolidation of President Xi Jinping’s strongman rule will exacerbate this dynamic of distrust and economic divorce. Emerging Asia and emerging Europe live on the fault lines of this shift from globalization to regionalism, with various risks and opportunities. Generally we are bullish EM Asia and bearish EM Europe. 3. Populism And Nationalism A third strategic theme consists of populism and nationalism, or anti-establishment political sentiment in general. These forces will flare up in various forms across the world in 2022 and beyond. Even as unemployment declines, the rise in food and fuel inflation will make it difficult for low wage earners to make ends meet. The “misery index,” which combines unemployment and inflation, spiked during the pandemic and today stands at 10.8% in the US and 11.4% in the EMU, up from 5.2% and 8.1% before the pandemic, respectively (Chart 12). Large budget deficits and trade deficits, especially in the US and UK, feed into this inflationary environment. Most of the major developed markets have elected new governments since the pandemic, with the notable exception of France and Spain. Thus they have recapitalized their political systems and allowed voters to vent some frustration. These governments now have some time to try to mitigate inflation before the next election. Hence policy continuity is not immediately in jeopardy, which reduces uncertainty for investors. By contrast, many of the emerging economies face higher inflation, weak growth, and are either coming upon elections or have undemocratic political systems. Either way the result will be a failure to address household grievances promptly. The misery index is trending upward and governments are continually forced to provide larger budget deficits to shore up growth, fanning inflation (Chart 13). Chart 12DM: Political Risk High But New Governments In Place
DM: Political Risk High But New Governments In Place
DM: Political Risk High But New Governments In Place
Chart 13EM: Political Risk High But Governments Not Recapitalized
EM: Political Risk High But Governments Not Recapitalized
EM: Political Risk High But Governments Not Recapitalized
Chart 14EM Populism/Nationalism Threatens Negative Surprises In 2022
EM Populism/Nationalism Threatens Negative Surprises In 2022
EM Populism/Nationalism Threatens Negative Surprises In 2022
Just as social and political unrest erupted after the Great Recession, notably in the so-called “Arab Spring,” so will new movements destabilize various emerging markets in the wake of Covid-19. Regime instability and failure can lead to big changes in policies, large waves of emigration, wars, and other risks that impact markets. The risks are especially high unless and until Chinese imports revive. Investors should be on the lookout for buying opportunities in emerging markets once the bad news is fully priced. National and local elections in Brazil, India, South Korea, the Philippines, and Turkey will serve as market catalysts, with bad news likely to precede good news (Chart 14). Bottom Line: These three themes – great power rivalry, hypo-globalization, and populism/nationalism – are inflationary in theory, though their impact will vary based on specific events. Multipolarity means that governments will boost industrial and defense spending to gear up for international competition. Hypo-globalization means countries will attempt to put growth on a more reliable domestic foundation rather than accept dependency on an unreliable international scene, thus constraining supplies from abroad. Populism and nationalism will lead to a range of unorthodox policies, such as belligerence abroad or extravagant social spending at home. Of course, the inflationary bias of these themes can be upset if they manifest in ways that harm growth and/or inflation expectations, which is possible. But the general drift will be an inflationary policy setting. Inflation may subside in 2022 only to reemerge as a risk later. Three Key Views For 2022 Within this broader context, our three key views for 2022 are as follows: 1. China’s Reversion To Autocracy As President Xi Jinping leads China further down the road of strongman rule and centralization, the country faces a historic confluence of internal and external risks. This was our top view in 2021 and the same dynamic continues in 2022. The difference is that in 2021 the risk was excessive policy tightening whereas this coming year the risk is insufficient policy easing. Chart 15China Eases Fiscal Policy To Secure Recovery In 2022
China Eases Fiscal Policy To Secure Recovery In 2022
China Eases Fiscal Policy To Secure Recovery In 2022
China’s economy is witnessing a secular slowdown, a deterioration in governance, property market turmoil, and a rise in protectionism abroad. The long decline in corporate debt growth points to the structural slowdown. Animal spirits will not improve in 2022 so government spending will be necessary to try to shore up overall growth. The Politburo signaled that it will ease fiscal policy at the Central Economic Work Conference in early December, a vindication of our 2021 view. Neither the combined fiscal-and-credit impulse nor overall activity, indicated by the Li Keqiang Index, have shown the slightest uptick yet (Chart 15). Typically it takes six-to-nine months for policy easing to translate to an improvement in real economic activity. The first half of the year may still bring economic disappointments. But policymakers are adjusting to avoid a crash. Policy will grow increasingly accommodative as necessary in the first half of 2022. The key political constraint is the Communist Party’s all-important political reshuffle, the twentieth national party congress, to be held in fall 2022 (usually October). While Xi may not want the economy to surge in 2022, he cannot afford to let it go bust. The experience of previous party congresses shows that there is often a policy-driven increase in bank loans and fixed investment. Current conditions are so negative as to ensure that the government will provide at least some support, for instance by taking a “moderately proactive approach” to infrastructure investment (Chart 16). Otherwise a collapse of confidence would weaken Xi’s faction and give the opposition faction a chance to shore up its position within the Communist Party. Chart 16China Aims For Stability, Not Rapid Growth, Ahead Of 20th National Party Congress
China Aims For Stability, Not Rapid Growth, Ahead Of 20th National Party Congress
China Aims For Stability, Not Rapid Growth, Ahead Of 20th National Party Congress
Party congresses happen every five years but the ten-year congresses, such as in 2022, are the most important for the country’s overall political leadership. The party congresses in 1992, 2002, and 2012 were instrumental in transferring power from one leader to the next, even though the transfer of power was never formalized. Back in 2017 Xi arranged to stay in power indefinitely but now he needs to clinch the deal, lest any unforeseen threat emerge from at home or abroad. Xi’s success in converting the Communist Party from “consensus rule” to his own “personal rule” will be measurable by his success in stacking the Politburo and Politburo Standing Committee with factional allies. He will also promote his faction across the Central Committee so as to shape the next generations of party leaders and leave his imprint on policy long after his departure. The government will be extremely sensitive to any hint of dissent or resistance and will move aggressively to quash it. Investors should not be surprised to see high-level sackings of public officials or private magnates and a steady stream of scandals and revelations that gain prominence in western media. The environment is also ripe for strange and unexpected incidents that reveal political differences beneath the veneer of unity in China: defections, protests, riots, terrorist acts, or foreign interference. Most incidents will be snuffed out quickly but investors should be wary of “black swans” from China in 2022. Chinese government policies will not be business friendly in 2022 aside from piecemeal fiscal easing. Everything Beijing does will be bent around securing Xi’s supremacy at all levels. Domestic politics will take precedence over economic concerns, especially over the interests of private businesses and foreign investors, as is clear when it comes to managing financial distress in the property sector. Negative regulatory surprises and arbitrary crackdowns on various industrial sectors will continue, though Beijing will do everything in its power to prevent the property bust from triggering contagion across the economic system. This will probably work, though the dam may burst after the party congress. Relations with the US and the West will remain poor, as the democracies cannot afford to endorse what they see as Xi’s power grab, the resurrection of a Maoist cult of personality, and the betrayal of past promises of cooperation and engagement. America’s midterm election politics will not be conducive to any broad thaw in US-China relations. While China will focus on domestic politics, its foreign policy actions will still prove relatively hawkish. Clashes with neighbors may be instigated by China to warn away any interference or by neighbors to try to embarrass Xi Jinping. The South and East China Seas are still ripe for territorial disputes to flare. Border conflicts with India are also possible. Taiwan remains the epicenter of global geopolitical risk. A fourth Taiwan Strait Crisis looms as China increases its military warnings to Taiwan not to attempt anything resembling independence (Chart 17A). China may use saber-rattling, economic sanctions, cyber war, disinformation, and other “gray zone” tactics to undermine the ruling party ahead of Taiwan’s midterm elections in November 2022 and presidential elections in January 2024. A full-scale invasion cannot be ruled out but is unlikely in the short run, as China still has non-military options to try to arrange a change of policy in Taiwan.
Chart 17
Chart 17BMarket-Based Risk Indicators Say China/Taiwan Risk Has Not Peaked
Market-Based Risk Indicators Say China/Taiwan Risk Has Not Peaked
Market-Based Risk Indicators Say China/Taiwan Risk Has Not Peaked
China has not yet responded to the US’s deployment of a small number of troops in Taiwan or to recent diplomatic overtures or arms sales. It could stage a major show of force against Taiwan to help consolidate power at home. China also has an interest in demonstrating to US allies and partners that their populations and economies will suffer if they side with Washington in any contingency. Given China’s historic confluence of risks, it is too soon for global investors to load up on cheap Chinese equities. Volatility will remain high. Weak animal spirits, limited policy easing, high levels of policy uncertainty, regulatory risk, ongoing trade tensions, and geopolitical risks suggest that investors should remain on the sidelines, and that a large risk premium can persist throughout 2022. Our market-based geopolitical risk indicators for both China and Taiwan are still trending upwards (Chart 17B). Global investors should capitalize on China’s policy easing indirectly by investing in commodities, cyclical equity sectors, and select emerging markets. 2. America’s Policy Insularity Our second view for 2022 centers on the United States, which will focus on domestic politics and will thus react or overreact to the many global challenges it faces. The US faces the first midterm election after the chaotic and contested 2020 presidential election. Political polarization remains at historically high levels, meaning that social unrest could flare up again and major domestic terrorist incidents cannot be ruled out. So far the Biden administration has focused on the domestic scene: mitigating the pandemic and rebooting the economy. Biden’s signature “Build Back Better” bill, $1.75 trillion investment in social programs, has passed the House of Representatives but not the Senate. The spike in inflation has shaken moderate Democratic senators who are now delaying the bill. We expect it to pass, since tax hikes were dropped, but our conviction is low (65% subjective odds), as a single defection would derail the bill. The implication would be inflationary since it would mark a sizable increase in government spending at a time when the output gap is already virtually closed. Spending would likely be much larger than the Congressional Budget Office estimate, shown in Chart 18, because the bill contains various gimmicks and hard-to-implement expiration clauses. Equity markets may not sell if the bill fails, since more fiscal stimulus would put pressure on the Federal Reserve to hike rates faster.
Chart 18
Chart 19
Whether the bill passes or fails, Biden’s legislative agenda will be frozen thereafter. He will have to resort to executive powers and foreign policy to lift his approval rating and court the median voter ahead of the midterm elections. Currently Democrats are lined up to lose the House and probably also the Senate, where a single seat would cost them their majority (Chart 19). The Senate is still in play so Biden will be averse to taking big risks. For the same reason, Biden’s foreign policy goal will be to stave off various bubbling crises. Restoring the Iranian nuclear deal was his priority but Russia has now forced its way to the top of the agenda by threatening a partial reinvasion of Ukraine. In this context Biden will not have room for maneuver with China. Congress will be hawkish on China ahead of the midterms, and Xi Jinping will be reviving autocracy, so Biden will not be able to improve relations much. Biden’s domestic policy could fuel inflation, while his domestic-focused foreign policy will embolden strategic rivals, which increases geopolitical risks. 3. Petro-State Leverage A surge in gasoline prices at the pump ahead of the election would be disastrous for a Democratic Party that is already in disarray over inflation (Chart 20). Biden has already demonstrated that he can coordinate an international release of strategic oil reserves this year. Oil and natural gas producers gain leverage when the global economy rebounds, commodity prices rise, and supply/demand balances tighten. The frequency of global conflicts, especially those involving petro-states, tend to rise and fall in line with oil prices (Chart 21). Chart 20Inflation Constrains Biden Ahead Of Midterms
Inflation Constrains Biden Ahead Of Midterms
Inflation Constrains Biden Ahead Of Midterms
Chart 21
Both Russia and Iran are vulnerable to social unrest at home and foreign strategic pressure abroad. Both have long-running conflicts with the US and West that are heating up for fundamental reasons, such as Russia’s fear of western influence in the former Soviet Union and Iran’s nuclear program. Both countries are demanding that the US make strategic concessions to atone for the Trump administration’s aggressive policies: selling lethal weapons to Ukraine and imposing “maximum pressure” sanctions on Iran. Biden is not capable of making credible long-term agreements since he could lose office as soon as 2025 and the next president could reverse whatever he agrees. But he must try to de-escalate these conflicts or else he faces energy shortages or price shocks, which would raise the odds of stagflation ahead of the election. The path of least resistance for Biden is to lift the sanctions on Iran to prevent an escalation of the secret war in the Middle East. If this unilateral concession should convince Iran to pause its nuclear activities before achieving breakout uranium enrichment capability, then Biden would reduce the odds of a military showdown erupting across the region. Opposition Republicans would accuse him of weakness but public opinion polls show that few Americans consider Iran a major threat. The problem is that this logic held throughout 2021 and yet Biden did not ease the sanctions. Given Iran’s nuclear progress and the US’s reliance on sanctions, we see a 40% chance of a military confrontation with Iran over the coming years. With regard to Ukraine, an American failure to give concessions to Russia will probably result in a partial reinvasion of Ukraine (50% subjective odds). This in turn will force the US and EU to impose sanctions on Russia, leading to a squeeze of natural gas prices in Europe and eventually price pressures in global energy markets. If Biden grants Russia’s main demands, he will avoid a larger war or energy shock but will make the US vulnerable to future blackmail. He will also demoralize Taiwan and other US partners who lack mutual defense treaties. But he may gain Russian cooperation on Iran. If Biden gives concessions to both Russia and Iran, his party will face criticism in the midterms but it will be far less vulnerable than if an energy shock occurs. This is the path of least resistance for Biden in 2022. It means that the petro-states may lose their leverage after using it, given that risk premiums would fall on Biden’s concessions. Of course, if energy shocks happen, Europe and China will suffer more than the US, which is relatively energy independent. For this reason Brussels and Beijing will try to keep diplomacy alive as long as possible. Enforcement of US sanctions on Iran may weaken, reducing Iran’s urgency to come into compliance. Germany may prevent a hardline threat of sanctions against Russia, reducing Russia’s fear of consequences. Again, petro-states have the leverage. Therefore investors should guard against geopolitically induced energy price spikes or shocks in 2022. What if other commodity producers, such as Saudi Arabia, crank up production and sink oil prices? This could happen. Yet the Saudis prefer elevated oil prices due to the host of national challenges they face in reforming their economy. If the US eases sanctions on Iran then the Saudis may make this decision. Thus downside energy price shocks are possible too. The takeaway is energy price volatility but for the most part we see the risk as lying to the upside. Investment Takeaways Traditional geopolitical risk, which focuses on war and conflict, is measurable and has slipped since 2015, although it has not broken down from the general uptrend since 2000. We expect the secular trend to be reaffirmed and for geopolitical risk to resume its rise due to the strategic themes and key views outlined above. The correlation of geopolitical risk with financial assets is debatable – namely because some geopolitical risks push up oil and commodity prices at the expense of the dollar, while others cause a safe-haven rally into the dollar (Chart 22). Global economic policy uncertainty is also measurable. It is in a secular uptrend since the 2008 financial crisis. Here the correlation with the US dollar and relative equity performance is stronger, which makes sense. This trend should also pick up going forward, which is at least not negative for the dollar and relative US equity performance (Chart 23). Chart 22Geopolitical Risk Will Rise, Market Impacts Variable
Geopolitical Risk Will Rise, Market Impacts Variable
Geopolitical Risk Will Rise, Market Impacts Variable
Chart 23Economic Policy Uncertainty Will Rise, Not Bad For US Assets
Economic Policy Uncertainty Will Rise, Not Bad For US Assets
Economic Policy Uncertainty Will Rise, Not Bad For US Assets
We are neutral on the US dollar versus the euro and recommend holding either versus the Chinese renminbi. We are short the currencies of emerging markets that suffer from great power rivalry, namely the Taiwanese dollar versus the US dollar, the Korean won versus the Japanese yen, the Russian ruble versus the Canadian dollar, and the Czech koruna versus the British pound. We remain long gold as a hedge against both geopolitical risk and inflation. We recommend staying long global equities. Tactically we prefer large caps and defensives. Within developed markets, we favor the UK and Japan. Japan in particular will benefit from Chinese policy easing yet remains more secure from China-centered geopolitical risks than emerging Asian economies. Within emerging markets, Mexico stands to benefit from US economic strength and divorce from China. We would buy Indian equities on weakness and sell Chinese and Russian equities on strength. We remain long aerospace and defense stocks and cyber-security stocks. -The GPS Team We Read (And Liked) … Conspiracy U: A Case Study “Crazy, worthless, stupid, made-up tales bring out the demons in susceptible, unthinking people.” Thus the author’s father, a Holocaust survivor translated from Yiddish, on conspiracy theories and the real danger they present in the world. Scott A. Shay, author and chairman of Signature Bank, whose first book was a finalist for the National Jewish Book Award, has written an intriguing new book on the topic and graciously sent it our way.2 Shay is a regular reader of BCA Research’s Geopolitical Strategy and an astute observer of international affairs. He is also a controversialist who has written essays for several of America’s most prominent newspapers. Shay’s latest, Conspiracy U, is a bracing read that we think investors will benefit from. We say this not because of its topical focus, which is too confined, but because of its broader commentary on history, epistemology, the US higher education system – and the very timely and relevant problem of conspiracy theories, which have become a prevalent concern in twenty-first century politics and society. The author and the particular angle of the book will be controversial to some readers but this very quality makes the book well-suited to the problem of the conspiracy theory, since it is not the controversial nature of conspiracy theories but their non-falsifiability that makes them specious. As the title suggests, the book is a polemical broadside. The polemic arises from Shay’s unique set of moral, intellectual, and sociopolitical commitments. This is true of all political books but this one wears its topicality on its sleeve. The term “conspiracy” in the title refers to antisemitic, anti-Israel, and anti-Zionist conspiracy theories, particularly the denial of the Holocaust, coming from tenured academics on both the right and the left wings of American politics. The “U” in the title refers to universities, namely American universities, with a particular focus on the author’s beloved alma mater, Northwestern University in Chicago, Illinois. Clearly the book is a “case study” – one could even say the prosecution of a direct and extended public criticism of Northwestern University – and the polemical perspective is grounded in Shay’s Jewish identity and personal beliefs. Equally clearly Shay makes a series of verifiable observations and arguments about conspiracy theories as a contemporary phenomenon and their presence, as well as the presence of other weak and lazy modes of thought, in “academia writ large.” This generalization of the problem is where most readers will find the value of the book. The book does not expect one to share Shay’s identity, to be a Zionist or support Zionism, or to agree with Israel’s national policies on any issue, least of all Israeli relations with Arabs and Palestinians. Shay’s approach is rigorous and clinical. He is a genuine intellectual in that he considers the gravest matters of concern from various viewpoints, including viewpoints radically different from his own, and relies on close readings of the evidence. In other words, Shay did not write the book merely to convince people that two tenured professors at Northwestern are promoting conspiracy theories. That kind of aberration is sadly to be expected and at least partially the result of the tenure system, which has advantages as well, not within the scope of the book. Rather Shay wrote it to provide a case study for how it is that conspiracy theories can manage to be adopted by those who do not realize what they are and to proliferate even in areas that should be the least hospitable – namely, public universities, which are supposed to be beacons of knowledge, science, openness, and critical thinking, but also other public institutions, including the fourth estate. Shay is meticulous with his sources and terminology. He draws on existing academic literature to set the parameters of his subject, defining conspiracy theories as “improbable hypotheses [or] intentional lies … about powerful and sinister groups conspiring to harm good people, often via a secret cabal.” The definition excludes “unwarranted criticism” and “unfair/prejudiced perspectives,” which are harmful but unavoidable. Many prejudices and false beliefs are “still falsifiable in the minds of their adherents,” which is not the case with conspiracy theories, although deep prejudices can obviously be helpful in spreading such theories. Conspiracy theories often depend on “a stunning amount of uniformity of belief and coordination of action without contingencies.” They also rely excessively on pathos, or emotion, in making their arguments, as opposed to logos (reason) and ethos (credibility, authority). Unfortunately there is no absolute, infallible distinction between conspiracy theories and other improbable theories – say, yet-to-be-confirmed theories about conspiracies that actually occurred. Conspiracy theories differ from other theories “in their relationship to facts, evidence, and logic,” which may sound obvious but is very much to the point. Again, “the key difference is the evidence and how it is evaluated.” There is no ready way to refute the fabrications, myths, and political propaganda that people believe without taking the time to assess the claims and their foundations. This requires an open mind and a grim determination to get to the bottom of rival claims about events even when they are extremely morally or politically sensitive, as is often the case with wars, political conflicts, atrocities, and genocides: Reliable historians, journalists, lawyers, and citizens must first approach the question of the cause or the identity of perpetrators and victims of an event or process with an open mind, not prejudiced to either party, and then evaluate the evidence. The diagnosis may be easy but the treatment is not – it takes time, study, and debate, and one’s interlocutors must be willing to be convinced. This problem of convincing others is critical because it is the part that is so often left out of modern political discourse. Conspiracy theories are often hateful and militant, so there is a powerful urge to censor or repress them. Openly debating with conspiracy theorists runs the risk of legitimizing or appearing to legitimize their views, providing them with a public forum, which seems to grant ethos or authority to arguments that are otherwise conspicuously lacking in it. In some countries censorship is legal, almost everywhere when violence is incited. The problem is that the act of suppression can feed the same conspiracy theories, so there is a need, in the appropriate context, to engage with and refute lies and specious arguments. Clients frequently email us to ask our view of the rise of conspiracy theories and what they entail for the global policy backdrop. We associate them with the broader breakdown in authority and decline of public trust in institutions. Shay’s book is an intervention into this topic that clients will find informative and thought-provoking, even if they disagree with the author’s staunchly pro-Israel viewpoint. It is precisely Shay’s ability to discuss and debate extremely contentious matters in a lucid and empirical manner – antisemitism, the history of Zionism, Holocaust denialism, Arab-Israeli relations, the Rwandan genocide, QAnon, the George Floyd protests, various other controversies – that enables him to defend a controversial position he holds passionately, while also demonstrating that passion alone can produce the most false and malicious arguments. As is often the case, the best parts of the book are the most personal – when Shay tells about his father’s sufferings during the Holocaust, and journey from the German concentration camps to New York City, and about Shay’s own experiences scraping enough money together to go to college at Northwestern. These sequences explain why the author felt moved to stage a public intervention against fringe ideological currents, which he shows to have gained more prominence in the university system than one might think. The book is timely, as American voters are increasingly concerned about the handling of identity, inter-group relations, history, education, and ideology in the classroom, resulting in what looks likely to become a new and ugly episode of the culture and education wars. Let us hope that Shay’s standards of intellectual freedom and moral decency prevail. Matt Gertken, PhD Vice President Geopolitical Strategy mattg@bcaresearch.com Footnotes 1 The downshift in globalization today is even worse than it appears in Chart 10 because several countries have not yet produced the necessary post-pandemic data, artificially reducing the denominator and making the post-pandemic trade rebound appear more prominent than it is in reality. 2 Scott A. Shay, Conspiracy U: A Case Study (New York: Post Hill Press, 2021), 279 pages. Strategic Themes Open Tactical Positions (0-6 Months) Open Cyclical Recommendations (6-18 Months) Appendix: GeoRisk Indicator China
China: GeoRisk Indicator
China: GeoRisk Indicator
Russia
Russia: GeoRisk Indicator
Russia: GeoRisk Indicator
United Kingdom
UK: GeoRisk Indicator
UK: GeoRisk Indicator
Germany
Germany: GeoRisk Indicator
Germany: GeoRisk Indicator
France
France: GeoRisk Indicator
France: GeoRisk Indicator
Italy
Italy: GeoRisk Indicator
Italy: GeoRisk Indicator
Canada
Canada: GeoRisk Indicator
Canada: GeoRisk Indicator
Spain
Spain: GeoRisk Indicator
Spain: GeoRisk Indicator
Taiwan
Taiwan Territory: GeoRisk Indicator
Taiwan Territory: GeoRisk Indicator
Korea
Korea: GeoRisk Indicator
Korea: GeoRisk Indicator
Turkey
Turkey: GeoRisk Indicator
Turkey: GeoRisk Indicator
Brazil
Brazil: GeoRisk Indicator
Brazil: GeoRisk Indicator
Australia
Australia: GeoRisk Indicator
Australia: GeoRisk Indicator
South Africa
South Africa: GeoRisk Indicator
South Africa: GeoRisk Indicator
Section III: Geopolitical Calendar
Highlights A partial reinvasion of Ukraine cannot be ruled out. The constraints on Russia are not prohibitive, especially amid global energy shortages. On this issue, it is better to be alarmist than complacent. We would put the risk of a partial re-invasion of Ukraine as high as 50/50, albeit with an uncertain time frame over 12-36 months. The negative impact of conflict may not stay contained within Russian and eastern European markets. The US and EU are now threatening major retaliatory sanctions if Russia invades. In response Russia could reduce energy exports, exacerbating global shortages and damaging Europe’s overall economy. Investors should stay short Russian assets and overweight developed European equities over emerging European peers. Stay long gold and GBP-CZK. The dollar will be flat-to-up. Feature Chart 1Ruble Faces More Downside From Geopolitics
Ruble Faces More Downside From Geopolitics
Ruble Faces More Downside From Geopolitics
Geopolitical tensions surrounding Russia remain unresolved and investors should continue to reduce holdings of assets exposed to any renewed conflict in Ukraine and the former Soviet Union. The ruble has dropped off its peaks since early November when strategic tensions revived (Chart 1). Presidents Joe Biden and Vladimir Putin held their second bilateral summit on a secure video link on December 7 to discuss the situation in Ukraine, where Russia has amassed 95,000-120,000 troops on the border in a major show of force. Russia also mustered troops in April and only partially drew them down after the Biden-Putin summit in Geneva where the two sides agreed to hold talks to address differences. The two presidents agreed to hold consultations regarding Ukraine. Putin accused NATO of building up Ukraine’s military and demanded “reliable, legally fixed guarantees excluding the expansion of NATO in the eastern direction and the deployment of offensive strike weapons systems in the states adjacent to Russia.”1 President Putin’s red line against Ukraine joining NATO is well known. Recently he said his red line includes the placement of western military infrastructure or missile systems in Ukraine. Biden refused to accept any limits on NATO membership in keeping with past policy. After the summit National Security Adviser Jake Sullivan said, “I will tell you clearly and directly [Biden] made no such commitments or concessions. He stands by the proposition that countries should be able to freely choose who they associate with.” 2 Biden, who had conferred with the UK, France, Germany, and Italy prior to the call, outlined the coordinated economic sanctions that would be leveled against Russia if it resorted to military force, as well as defense aid that would go to Ukraine and other eastern European countries. Thus Putin gave an ultimatum and Biden rebuffed it – and yet the two agreed to keep talking. The Russians have since said that they will present proposals to the Americans in less than a week. Talks are better than nothing. But neither side has given concrete indication of a change in position that would de-escalate strategic tensions – instead they have both raised the stakes. Therefore investors should proceed with the strong presumption that tensions will remain elevated or escalate in the coming months. Clearing Away Misconceptions Before going further we should clear away a few misconceptions about the current situation: Ukraine has unique strategic value to Russia. Like Belarus, but unlike Central Asia, Ukraine serves as critical buffer territory protecting Moscow and the Russian core from any would-be invaders. Russia lacks firm geological borders so it protects itself by means of distance and winter. This grand strategy succeeded against King Charles XII of Sweden, Napoleon, and Hitler. The collapse of the Soviet Union left Russia shorn of much of its buffer territory. Ukraine also offers access to the Black Sea. Russia has long striven to gain access to warm-water ports. The loss of control over Ukraine resulted in a loss of access. Russia’s seizure of Crimea in 2014 only partially rectified the situation. Ukraine’s southern coastline around Crimea is the territory at risk today (Map 1).
Chart
It is Ukraine’s physical existence and unique strategic value – not its democratic leanings or ideological orientation – that ensures perpetual tensions with post-Soviet Russia. Russia has a strategic imperative to reassert control or at least prevent control by foreign powers. Ideological opposition may make things worse but an anti-Russian Ukrainian dictator would also face Russian coercion or aggression, perhaps even more than the current weak democracy. In fact Russia is trying to force Ukraine to revise its constitution and adopt a federal structure so as to grant greater autonomy to separatist regions Donetsk and Luhansk that Russia helped break away in 2014. But Ukraine has not relented to Moscow’s demands of political reform. It is not authoritarianism but a permanent foreclosure of Ukrainian membership in the EU and NATO that Moscow is after. Yet it is highly unlikely that Russia would try to invade and conquer all of Ukraine. Ukraine is the largest country by territory in Europe and has 255,000 active soldiers and 900,000 reserves (contra Russia’s 1 million active and 2 million reserves) who would defend their freedom and sovereignty against an invader.3 Russia would not be able to stage a full-scale invasion with the 175,000 maximum troop buildup that US intelligence is warning about. It would have to mobilize fully, dangerously neglecting other vast dimensions of its national security, and would inevitably get bogged down fighting a vicious insurgency backed by the NATO powers. It would save blood and treasure by paralyzing Ukraine’s politics and preventing it from allying with western militaries, which is what Putin is attempting to do today. Putin uses foreign adventures to strengthen his grip at home but an adventure of this nature would impose such burdens as to threaten his grip at home. A limited re-invasion of Ukraine could yield historic strategic advantages to Russia. Moscow could focus on a partial military incursion that would annex or shore up Donbass, or extend its control from Donbass to the Black Sea, conceivably all the way to the Dnieper river. This pathway would yield Russia maritime access and a buffer space to fortify Crimea. Naval warfare could also yield control of deep-water ports (Yuzhne, Odessa, Mykolaiv, Chornomorsk), control of the mouth of the Dnieper, control of the canal that supplies water to Crimea, and a means of bottling up the Ukrainian navy and preventing foreign maritime assistance. Ukraine would be further weakened and Russia would have a larger beachhead in Ukraine for future pressure tactics. Russia is not bluffing – its military buildup poses a credible threat. If there is anywhere Russia’s threats are credible, it is in taking military action against former Soviet republics like Georgia (2008) and Ukraine (2014) that have pro-western leanings yet lack the collective security of the NATO alliance. At very least, given that Russian forces did deploy in Ukraine in 2014, Russian action in Ukraine cannot be ruled out. The military balance has not changed so significantly in that time and strongly favors Russia (Chart 2). The US has provided around $2.5 billion in military aid to Ukraine since 2014, and has sent lethal weapons including Javelin anti-tank missiles and launchers since 2017-18, including $450 million worth of military aid under the Biden administration (and $300 million just authorized by Congress on December 7). NATO allies have also provided defense aid. This is part of Putin’s complaint but these new arms are not game changers that would prevent Russia from taking military action.
Chart 2
Thus if the West rejects Moscow’s core demands, war is likely. This is true even if Russia would prefer to achieve its aims through political and economic rather than military means. Russia does not deem the West’s threat of sanctions as prohibitive of invasion. The West’s sanctions since 2014 have failed to change Russia’s government, strategy, or posture in Ukraine. Yes, European nations joined the US in imposing sanctions. But Germany also pursued the Nord Stream II pipeline as a means of bypassing Ukraine and working directly with Russia to preserve economic engagement and energy security. Former Chancellor Merkel forced the pipeline through despite the objections of eastern Europeans and the United States. The allies also formed the “Normandy Quartet,” excluding the US, to force Ukraine to accept the Minsk agreements on resolving the conflict. Thus the lesson of 2014-21 is not that NATO allies stood shoulder-to-shoulder in defense of Ukraine’s sovereignty and territorial integrity but rather that Germany and the EU, and the EU and the US, have major differences in interests and risk-tolerance in dealing with Russia. Russia does not face, or may think it does not face, a united front among the western powers. A partial reinvasion of Ukraine would bring the western allies together initially but probably not for long. Russia determines the timing of any new military incursion in Ukraine. Winter is not the ideal time to invade Ukraine, though it is possible. Russia could act in spring 2022, as the US has warned, but it could also act in the summer of 2023, the spring of 2024, or other times. From a strategic point of view, Russia has enjoyed a historic window of opportunity since 2001 when the US got bogged down in Afghanistan and Iraq and then the US and the EU got bogged down in economic and financial crisis. Given that the American political establishment is withdrawing from foreign quagmires, reactivating fiscal policy, bulking up the military-industrial complex, and making a dedicated effort to revitalize its global alliances, Russia may believe that its historic window is closing. Russia’s domestic fundamentals are deteriorating over time. Putin could decide it is necessary to seize strategic ground in Ukraine sooner rather than later. Bottom Line: Ukraine offers unique and irreplaceable buffer space and maritime access to Russia. Russia’s military actions in 2014 led to stalemate, such that Russia remains insecure, Ukraine remains defiant, and the West is still entertaining defense cooperation or even NATO membership with Ukraine. Yet the Crimea conflict also revealed a lack of concert among western powers exemplified by Germany’s Nord Stream II pipeline. Today Russia has the military capability to seize another slice of Ukrainian territory. Western retaliatory actions would be painful but may not be deemed prohibitive. Investors cannot rule out a partial re-invasion of Ukraine. Nord Stream Pipeline Is Not The Sole Factor Is Russia not making a show of military force merely to ensure that Nord Stream II pipeline goes into operation? Will Russia not back down if the pipeline is guaranteed? A common view in Washington and the financial industry is that Russia’s military buildup is just a bluff, i.e. Moscow’s aggressive way of demanding that Germany’s new government and the European Union approve Nord Stream. The pipeline finished construction in September but now awaits formal regulatory certification. Approval was originally expected by May 2022 but has now been delayed. The pipeline would carry 55 billion cubic meters of natural gas into Europe, about half of Russia’s current export capacity outside of Ukraine. Ukraine’s total capacity is around 150 billion cubic meters. The pipeline enables Russia and Germany to bypass Ukraine, whose conflicts with Moscow since 2004 have threatened Germany’s energy security. About 18% of EU’s total energy imports come from Russia, whilst this figure is 16% for Germany. That is about 0.5% and 0.2% of EU and German GDP, respectively. Meanwhile Russian energy exports to Germany and the EU make up 0.8% and 5.6% of GDP, respectively (Chart 3).
Chart 3
The problem with this reasoning is that the US conceded Nord Stream to Russia over the summer. The US initially raised the threat of sanctions because the pipeline strengthened Russo-German ties, diminished Ukraine’s leverage, and deprived the US of a chance to sell liquefied natural gas to Europe. But the Biden administration proved unwilling to take this aggressive approach. Secretary of State Anthony Blinken has a long history of arguing that the US should prioritize strong relations with its European allies rather than punitive measures to try to block Russian gas sales. Biden met with outgoing Chancellor Angela Merkel in July and agreed to let Nord Stream go forward. The only proviso was that Russia not “weaponize natural gas,” i.e. withhold supplies for geopolitical purposes, as it has done in the past.4 Before Russia’s military threats, Germany and the EU were expected to certify the pipeline by no later than May 2022 and an earlier certification looked possible because of Europe’s low natural gas supplies. Yet Russia, fresh off parliamentary elections, did precisely what Germany said it was not supposed to do. The pipeline was completed in September and reports of Russian limitations on natural gas supply surfaced in October. Moscow not only weaponized the gas but also mustered its army on the Ukrainian border again. Putin may have feared that the new German government, which officially took office on December 8, would change policy and refuse to certify the pipeline. He also could have feared that the US Congress would pass a Republican-backed provision that would require Biden to impose sanctions that would halt the pipeline. But these explanations are not satisfactory. First, the German government was not likely to halt Nord Stream. Quite the opposite, Berlin has pushed against all opposition to speed the pipeline into action. It only delayed the regulatory approval when Russia did the one thing that Germany had expressly prohibited, which was weaponize natural gas. Second, the US Congress was never likely to pass mandatory sanctions on Nord Stream operators. The Democrats opposed it, as it would have tied Biden’s hands, whereas presidents always retain discretion over foreign policy and national security. Even moderate Republicans opposed the measure, for the same reason. If either of these were the reason for Putin’s latest buildup, then the buildup will probably dissipate in the coming months. Putin also wants to force Ukraine to implement the Minsk agreements. But the Biden administration adopted the Minsk framework in June for the first time, which was a concession to Russia. So the latest military threats are not solely about coercing Europe to approve the pipeline or Ukraine to implement Minsk. Putin is driving at something else. Putin’s Focus On Ukraine And NATO Putin used military pressure on Ukraine’s border to force the US to accept the pipeline and the Minsk agreements. He is now using the same tactic to raise the stakes and demand that the US and its allies permanently rule out NATO membership and defense cooperation with Ukraine. Biden rejected the first demand during the summit, as mentioned. There is no way that the US or NATO will forswear any and all eastward expansion. Even on Ukraine specifically, Biden cannot give Russia a legal guarantee because it would require a 60-seat majority in the Senate (not likely). Any future president would retain prerogative over the matter anyway and Putin knows this. Moreover Ukraine is never going to join NATO. Russia would attack. And NATO members would not be unanimous (as is required for new members) because the collective defense treaty would require them to defend Ukraine. They would be signing up for a war with Russia. Still Biden is unlikely to disavow Ukrainian NATO membership because to do so would be to deny the self-determination of nations, capitulate to Russian coercion, and demoralize the Ukrainians, whom the US hopes will maintain a plucky resistance against Russian domination. It would also demoralize US allies and partners – namely Taiwan, which also lacks a formal defense treaty and would be forced to sue for peace with China in the face of American abandonment. Biden’s refusal to ban Ukraine from NATO is encapsulated in Diagram 1, an exercise in game theory that exemplifies why the risk of war should not be dismissed. Diagram 1Game Theory Suggests Russia Will Keep Applying Military Pressure
Russia/Ukraine: Don’t Be Complacent
Russia/Ukraine: Don’t Be Complacent
Biden may give private or executive assurances on Ukraine and NATO but Putin will know that these mean nothing since Biden may be out of office as early as January 2025 and then Putin would have to renegotiate. America is not a credible negotiator because partisanship has resulted in extreme foreign policy vacillations – the next president could revoke the deal. Even after Putin is gone Russia would have to negotiate with the US to prevent the US from arming Ukraine. Hence Moscow may decide to reduce Ukraine and improve Russia’s strategic position by force of arms. This is true even if Biden forswears the NATO option, as Diagram 1 illustrates. Putin’s second demand – that the US not provide offensive weapon systems in countries adjacent to Russia – is more material. This is what the new round of talks will focus on. This new Ukraine line of talks is separate, more urgent and important, than the other bilateral dialogues on the arms race, and cyber-war. US-Russia talks on Iran are also urgent, however, and Russia’s cooperation there may be contingent on US concessions regarding Ukraine. The US may be willing to stop its defense cooperation with Ukraine but not with other allies and partners, however. It is also not clear what Putin will accept. These negotiations will have to be watched. Biden cannot make major concessions with a gun to his head. It is unclear how far the US is willing to concede on defense cooperation with countries around Russia. The US may quietly abandon Ukraine but then it would need to reinforce its other defense relationships. If Putin draws down the troops, and Biden calls a stop to defense aid to Ukraine, then a crisis may be averted. What Could Go Wrong? Economic sanctions under consideration in Washington are significant: the US could freeze bank transactions, expand restrictions on trading Russian sovereign and corporate debt, and lobby Belgium to kick Russia off the SWIFT financial messaging system. However, these sanctions may not be effective in preventing Russia from using military force. Russia has weathered US sanctions since 2014, and the smaller and weaker Iranian economy has weathered maximum pressure sanctions since 2019. Energy producers like Russia and Iran have maximum geopolitical leverage when global energy inventories draw down, as is the case today. Even in the face of Russian military aggression, the Biden administration is vacillating on sanctions targeting Russia’s energy sector that would contribute to global shortages and ultimately raise prices at the pump for voters in a midterm election year.5 Germany’s new government also hesitates to declare unambiguously that it will discontinue the Nord Stream II pipeline if Russia invades Ukraine. True, Germany signaled that the pipeline would be halted. Its energy regulator declared that the pipeline’s ownership must be unbundled, which pushes back the certification date to sometime after May 2022 – this was a geopolitical not a legalistic decision. But construction is completed, the pipeline physically exists, which will vitiate Germany’s commitment to sanctions whenever natural gas shortages occur, as is the case this winter (Chart 4). Shortages will continue to occur and Russia controls a large share of supply.
Chart 4
Chart 5
It would take a catastrophe to drive Germany to restart coal and nuclear plants, so natural gas will continue to be in demand. Germany does not have liquefied natural gas import capability yet. If Europe imposes crippling sanctions on Russia, Russia could reduce energy supplies and harm Europe’s economy (Chart 5). The Russian economy and society would suffer which is one reason any military action in Ukraine would be limited in scope. Still, Moscow may believe that Germany would restrain the EU, and the EU would restrain the US, thereby preventing sanctions from being fully, uniformly, and durably implemented. Prior to Russia’s aggression, public opinion polls showed that the German public strongly supported Nord Stream. Even a majority of Green Party members supported it despite the fact that the Greens were the most critical of increasing Germany’s dependency on fossil fuels and an authoritarian petro-state. While public approval of the pipeline has surely suffered in the face of Russian aggression, a majority probably still favors the pipeline. Germany has a national consensus in support of engagement with Russia and avoiding a new cold war, given that the original Cold War cut Germany in half. For that reason invasion may only temporarily unite the western powers – it could ultimately drive a wedge between Germany and other EU members, namely in the former Soviet bloc. It would also divide the more risk-averse EU from the US in terms of how to deal with Russia. And it would weaken the Biden administration at a time when it is extremely vulnerable, exacerbating America’s internal divisions. Russian domestic patriotism would rally, at least initially. Note that Russia could miscalculate on this issue and that is one reason for high level of risk. Perhaps the West would prove far more unified and aggressive in its sanctions enforcement than it was after 2014. A falling ruble and rising inflation could cause Russian social unrest. But Russia could misread the situation. Unless the US and Europe escalate the sanctions threat massively to better deter Russia, their lack of concert is another reason for investors not to be complacent about renewed conflict. Bottom Line: The threat of sanctions may prove insufficient to deter renewed Russian aggression against Ukraine. Germany favors engagement with Russia and Europe’s energy dependency on Russia makes it vulnerable to supply disruptions. Russia has leverage given tight global energy markets, Europe’s low natural gas inventories, and US domestic political considerations ahead of the 2022 midterms. Investment Takeaways The point of this report argues that a partial re-invasion of Ukraine cannot be ruled out. Russia has the capability to reinforce de facto control of Donbas, or expand its footprint in southern Ukraine, though not to invade the whole country. The threat of economic sanctions is not yet so overwhelming as to warrant overconfident predictions of de-escalation. In this case it is better to be alarmist than complacent. Russia would want to maintain an element of surprise so the timing of any belligerence is hard to predict. For de-escalation, investors should watch for Russia to withdraw troops from the Ukrainian border, US-Russia consultations to begin promptly and proceed regularly, and for the US and allies to delay or halt defense cooperation and arms transfers to Ukraine. While global investors would quickly become de-sensitized to conflict that is entirely contained in Ukraine, the trans-Atlantic threat of major sanctions now raises the stakes and suggests that global energy shocks could negatively affect the European or global economy in the event of conflict. Any conflict could also spill outside of Ukraine’s borders, as with Malaysian Airlines flight MH17, which was shot down by Russian-backed Ukrainian separatists in July 2014. The Black Sea has seen a dangerous uptick in naval saber-rattling and that strategic situation would become permanently more dangerous if Russia seized more of coastal Ukraine. Russian military integration with Belarus is also a source of insecurity for EU and NATO members. Global financial markets have only started to price the geopolitical risk emanating from Russia. Our Russian GeoRisk Indicator has ticked up (Chart 6). But Russian equity performance relative to broad emerging markets is only arguably underperforming what is implied by Brent crude oil prices. Chart 6Market Slow To React To Ukraine Crisis - Risk To Downside For Russian Assets
Market Slow To React To Ukraine Crisis - Risk To Downside For Russian Assets
Market Slow To React To Ukraine Crisis - Risk To Downside For Russian Assets
This relatively muted reaction suggests more downside lies ahead if we are right that strategic tensions will be flat-to-up over the coming months. Sell the RUB-USD on any strength. Stay long GBP-CZK. Tactically short Russian equities versus EM-ex-Asia (Chart 7). They are exposed to further correction as a result of escalating geopolitical risk. Chart 7Russia Falling Off Peaks Of Performance Versus EM-Ex-Asia
Russia Falling Off Peaks Of Performance Versus EM-Ex-Asia
Russia Falling Off Peaks Of Performance Versus EM-Ex-Asia
Chart 8Developed Europe A Safer Bet Than Emerging Europe Amid Tensions
Developed Europe A Safer Bet Than Emerging Europe Amid Tensions
Developed Europe A Safer Bet Than Emerging Europe Amid Tensions
Stick to long DM Europe versus EM Europe – our main trade this year to capture rising geopolitical risk between Russia and the West (Chart 8). Matt Gertken Vice President Geopolitical Strategy mattg@bcaresearch.com Footnotes 1 President of Russia, "Meeting with US President Joseph Biden," December 7, 2021, kremlin.ru. 2 White House, "Press Briefing by Press Secretary Jen Psaki and National Security Advisor Jake Sullivan, December 7, 2021," whitehouse.gov. 3 Dan Peleschuk, "Ukraine’s military poses a tougher challenge for Russia than in 2014," Politico, April 14, 2021, politico.eu.; see also Gav Don, "LONG READ: Russia looks poised to invade Ukraine, but what would an invasion actually look like?" Intellinews, November 24, 2021, intellinews.com. 4 US Department of State, "Joint Statement of the United States and Germany on Support for Ukraine, European Energy Security, and our Climate Goals," July 21, 2021, state.gov. 5 Kylie Atwood and Natasha Bertrand, "US likely to hold off for now on energy sanctions for Russia, fearing impact on global prices," CNN, December 9, 2021, cnn.com. Strategic Themes Open Tactical Positions (0-6 Months) Open Cyclical Recommendations (6-18 Months)
Highlights Tight commodity markets, rising incomes, and constrained logistics networks will continue to push inflation gauges higher, so long as coronavirus mutations don't cause another global economic shutdown. Commodity price pressures – exacerbated by weak capex on the supply side – will feed directly into realized and expected inflation gauges going forward, just as they have this year (Chart of the Week). In the short run, tight natural gas markets will raise fertilizer prices, which will keep food prices elevated next year. Inflation in goods prices will persist as tight energy and base-metals markets keep input and transportation costs elevated. Political uncertainty in important energy- and metals-exporting states, and ESG-related costs will contribute to upside price pressures. The cost of building the infrastructure required to decarbonize the global economy – an effort now kicking into high gear – is heavily dependent on the availability of base metals and fossil fuels, which means the cost of this energy transition likely will rise. Against this backdrop, central banks’ room to maneuver will shrink – tightening policy to fight inflation risks will drive up hurdle rates and make supply-side investment more costly. We remain long gold as a hedge against inflation and policy uncertainty, and our commodity-index exposures (S&P GSCI and the COMT ETF). Feature The Fed's preferred inflation gauge, the core Personal Consumption Expenditures Price Index, is up 4.12% y/y; the overall index is up 5.05%. In the euro zone, inflation soared to record highs in November, reaching 4.9% y/y. Most of the surge in these inflation gauges is due to higher commodity prices, which are caused by tight markets globally: In many markets, particularly energy and metals, the level of demand exceeds that of supply, which is forcing inventories lower and prices higher. Supply has been slow catching up with demand post-pandemic. There is a direct feed through from commodity markets to price inflation, something markets will be reminded of repeatedly in coming years as the supply-side of critically important commodities – energy, metals and food – are stressed to keep up with demand (Chart 2).1 Chart of the WeekRealized, Expected Inflation Will Continue To Rise
Realized, Expected Inflation Will Continue To Rise
Realized, Expected Inflation Will Continue To Rise
Chart 2Feedthrough From Commodities To Expected Inflation Is Strong
Feedthrough From Commodities To Expected Inflation Is Strong
Feedthrough From Commodities To Expected Inflation Is Strong
The scope for central banks to act to contain inflation in such circumstances is constrained: Tightening policy to the point where the cost of capital becomes prohibitive will exacerbate supply-side constraints in energy and metals markets. The risk here is acute, given that a decade of monetary policy operating close to the zero bound has failed to encourage long-term investment on the supply side in oil, gas, and metals. The dearth of capex in energy (Chart 3) and metals (Chart 4) threatens to keep supplies constrained for years.
Chart 3
Chart 4
Short-Run Pressure On Food Prices In earlier research, we delved into the sharp rise in food prices, and the underlying causes (Chart 5). Some of these are transitory – e.g., the tight shipping market for grains brought about by clogged logistics markets and delays in sailing, which has lifted rates sharply over the course of this year (Chart 6).
Chart 5
Chart 6
Other factors – high natural-gas prices, which will drive fertilizer prices higher next year – will dog markets at least until 2H22, when natural gas inventories in Europe will be on their way to being rebuilt, following a difficult injection season this year (Chart 7). The scramble to find gas in Europe and Asia as distributors prepare for a La Niña winter will take time to recover from next year.2 Chart 7High EU Gas Prices Will Keep Fertilizer Prices Elevated
High EU Gas Prices Will Keep Fertilizer Prices Elevated
High EU Gas Prices Will Keep Fertilizer Prices Elevated
Energy, Metals PricesDrive Inflation Expectations The really big inflationary push over the next five to 10 years will come from energy and metals markets, where capex has languished for years, as can be seen in Charts 3 and 4. These markets have been and remain in persistent physical deficits, which will not be easy to reverse without higher prices over a sustained period (Charts 8 and 9). Chart 8Oil Markets Will Remain In Deficit...
Oil Markets Will Remain In Deficit...
Oil Markets Will Remain In Deficit...
Chart 9...As Will Metals Bellwether, Copper
...As Will Metals Bellwether, Copper
...As Will Metals Bellwether, Copper
These markets will exert a strong influence on inflation and inflation expectations for as long as capex remains weak and supply is constrained. As can be gleaned from the model shown in Chart 10, the London Metal Exchange Index (LMEX) and 3-year-forward WTI are good explanatory variables for US 5-year/5-year CPI swap rates, the trading market in which inflation expectations are hedged. Until markets see sustainable investment in base metals and hydrocarbons over the course of the global energy transition now underway, forward-looking inflation markets will continue to price to tighter supply expectations.
Chart 10
Gold's Role As A Hedge Against Inflation, Uncertainty In our modeling we often describe gold as a currency, which, similar to other currencies, is highly sensitive to US monetary variables, EM and DM income (as measured by nominal GDP), economic policy uncertainty, and core inflation (Chart 11). These variables are what we could call the "usual suspects" that typically are rounded up to explain inflation, in addition to commodities prices.3 In Chart 12, we zero in on one of the inflation gauges discussed above, which is extremely sensitive to commodity prices, and policy uncertainty. Here we show gold as a function of US Economic Policy uncertainty and US PCEPI to make the point that gold can hedge not only the inflation driving these indices, but the economic uncertainty that likely will attend the transition to a low-carbon future, which we expect will remain elevated during this transition. Chart 11Gold Prices Sensitive To Usual Suspects
Gold Prices Sensitive To Usual Suspects
Gold Prices Sensitive To Usual Suspects
Chart 12...Particualrly Inflation And Uncertainty
...Particualrly Inflation And Uncertainty
...Particualrly Inflation And Uncertainty
Investment Implications Much of the surge showing up in inflation gauges in the US and EU is being driven by strong commodity prices. These prices are being powered higher by strong income growth, which leads to strong demand; tight supplies, and inventories. As we have noted, the level of commodity demand exceeds that of supply, which is forcing inventories lower and prices higher in oil and metals markets. Going forward, these fundamentals will be slow to change, which argues in favor of our long gold position and our long commodity index positions (S&P GSCI and the COMT ETF). We reiterate the COVID-19 risk factor mentioned at the beginning of this report: Global aggregate demand still is fragile. The risk of another coronavirus shock remains high. In particular, China maintains its zero-tolerance COVID-19 policy. This means commodity markets have to remain alert to how policymakers respond if the highly contagious Omicron variant is detected and authorities once again shut down ports and travel. The risk of disrupted supply chains and hits to supply-demand balances next year remains acute.4 Robert P. Ryan Chief Commodity & Energy Strategist rryan@bcaresearch.com Ashwin Shyam Research Associate Commodity & Energy Strategy ashwin.shyam@bcaresearch.com Commodities Round-Up Energy: Bullish Crude oil prices rebounded following its Omicron-induced drop last week. Relative to last Wednesday - when brent closed at its lowest following news of the new variant - prices were up 9.54% as of Tuesday’s close (Chart 13). Saudi Arabia’s decision to increase the official selling price of oil to customers in Asia and the US is testimony to its belief global demand will remain strong, despite the emergence of the highly transmissible new COVID-19 variant. Base Metals: Bullish Ever since the Omicron variant of COVID-19 was disclosed, prices of base-metals bellwether copper have become more volatile. This mostly reflects uncertainty surrounding macroeconomic conditions, as characteristics of the latest variant of the coronavirus are not well-known. COVID-19 lockdowns due to the Omicron variant could potentially delay tightening stimulus measures, which will be positive for industrial metals. However, lockdowns will also reduce industrial activity and demand for the red metal, acting as a sea anchor on copper's price. At the start of this week, looser monetary policy and rising copper imports in China supported the red metal, however these gains were capped by fears regarding the Omicron variant and a strong USD. Despite the volatility in copper prices following Fed Chair Jay Powell’s remarks last week on the pace of the asset purchases, we continue to expect tight fundamentals will outweigh the bearish effects of a stronger USD, and the weaker global financial conditions which come with it (Chart 14). Precious Metals: Bullish The World Platinum Investment Council (WPIC) reported a large third quarter refined platinum surplus of 592k oz, up nearly 430k oz from the second quarter. The jump in the third quarter surplus means the organization expects a full year 2021 surplus of 792k oz, compared to the 190k oz it had forecast in its second quarter report. Increased refined supply due to accelerated processing of 2020 semi-finished platinum stock coupled with lower demand by automakers and outflows from ETFs and stocks held by exchanges propelled the global platinum market into this relatively large surplus. In 2022 South African mined supply is expected to remain stable, while demand is expected to pick up as the economic recovery continues, resulting in a surplus of 637k oz for the full year. These forecasts do not account for the latest Omicron variant which was first reported in South Africa. Lockdowns due to the virus could lead to mine closures in the world’s largest platinum producer and reduce platinum demand from automakers. Chart 13
WTI LEVEL GOING UP
WTI LEVEL GOING UP
Chart 14
Copper Overcomes Tighter Global Financial Conditions
Copper Overcomes Tighter Global Financial Conditions
Footnotes 1 We find Granger-causality between realized and expected inflation gauges (US PCEPI and core PCEPI; US CPI, and US 5-year/5-year CPI swap rates) and commodity price indices (the S&P GSCI and Bloomberg Commodity Index) is very strong. This indicates the commodity-price indices are good explanatory and predictive variables for realized inflation gauges and for inflation expectations. 2 Please see our November 11 report entitled Risk Of Persistent Food-Price Inflation for additional detail. 3 Please see Conflicting Signals Challenge Gold, which we published on October 7, for example. 4 Please see 2022 Key Views: A Challenging Balancing Act published by BCA Research's China Investment Strategy on December 8, 2021. Investment Views and Themes Strategic Recommendations
Highlights 1. How will the pandemic resolve? 2. Will services spending recover to its pre-pandemic trend? 3. Will we spend our excess savings? 4. How will central banks react to inflation? 5. Will cryptocurrencies continue to eat gold’s lunch? 6. How fragile is Chinese real estate? 7. Will there be another shock? Fractal analysis: Personal goods versus consumer services. Feature Chart of the WeekWill Services Spending Recover To Its Pre-Pandemic Trend?
Will Services Spending Recover To Its Pre-Pandemic Trend?
Will Services Spending Recover To Its Pre-Pandemic Trend?
“Judge a man by his questions, not by his answers” The quotation above is often misattributed to Voltaire instead of its true author, Pierre-Marc-Gaston de Lévis. Irrespective of the misattribution, we agree with the maxim. Asking the right questions is more important than finding answers to the wrong questions. In this vein, this report takes the form of the seven crucial questions for 2022 (and our answers). 1. How Will The Pandemic Resolve? As new variants of SARS-CoV-2 have arrived like clockwork, the number of new global cases of infection and the virus reproduction rate have formed a near-perfect mathematical ‘sine wave’. This near-perfect sine wave will propagate into 2022 (Chart I-2). Chart I-2The Pandemic's Sine-Wave Will Propagate Into 2022
The Pandemic's Sine-Wave Will Propagate Into 2022
The Pandemic's Sine-Wave Will Propagate Into 2022
But how will this sine wave of infections translate into mortality, morbidity, and stress on our healthcare systems? As we explained in RNA Viruses: Time To Tell The Truth, the answer depends on the specific combination of contagiousness, immuno-evasion, and pathogenicity of each variant. Yet none of this should come as any surprise. Flus and colds also come in waves, which is why we call them flu and cold seasons. And the morbidity of a given flu and cold season depends on the aggressiveness of that season’s flu and cold variant. So, just like the flu and the cold, Covid will become an endemic respiratory disease which comes in waves. The trouble is that our under-resourced health care systems can barely cope with a bad flu season, let alone with an additional novel disease that can be worse than the flu. Hence, until we add enough capacity to our healthcare systems, expect more disruptions to economic activity from periodic non-pharmaceutical interventions such as travel bans, vaccine passports, and face-mask mandates. 2. Will Services Spending Recover To Its Pre-Pandemic Trend? The pandemic has given us a crash course in virology and epidemiology. We now understand antigens, antibodies, and ‘reproduction rates.’ We understand that a virus transmits as an aerosol in enclosed unventilated spaces, and that singing, and yelling eject this viral aerosol. We understand that vaccinations for RNA viruses have limited longevity, do not prevent reinfections, and that certain environments create ‘super-spreader’ events. Armed with this new-found awareness, a significant minority of people have changed their behaviour. Services which require close contact with strangers – going to the dentist or in-person doctors’ appointments, going to the cinema or to amusement parks, or using public transport – are suffering severe shortfalls in demand. Given that this change in behaviour is likely long-lasting, demand for these services is unlikely to regain its pre-pandemic trend in 2022 (Charts I-3 - I-6). Chart I-3Dental Services Are Far Below The Pre-Pandemic Trend
Dental Services Are Far Below The Pre-Pandemic Trend
Dental Services Are Far Below The Pre-Pandemic Trend
Chart I-4Physician Services Are Far Below The Pre-Pandemic Trend
Physician Services Are Far Below The Pre-Pandemic Trend
Physician Services Are Far Below The Pre-Pandemic Trend
Chart I-5Recreation Services Are Far Below The Pre-Pandemic Trend
Recreation Services Are Far Below The Pre-Pandemic Trend
Recreation Services Are Far Below The Pre-Pandemic Trend
Chart I-6Public Transportation Is Far Below The Pre-Pandemic Trend
Public Transportation Is Far Below The Pre-Pandemic Trend
Public Transportation Is Far Below The Pre-Pandemic Trend
Therefore, to keep overall demand on trend, spending on goods will have to stay above its pre-pandemic trend. This will be a tough ask. Durables, by their very definition, last a long time. Even clothes and shoes, though classified as nondurables, are in fact quite durable. Meaning that are only so many cars, iPhone 13s, gadgets, clothes and shoes that any person can own before reaching saturation. If, as we expect, spending on goods falls back to its pre-pandemic trend, but spending on services does not recover to its pre-pandemic trend, then there will be a demand shortfall in 2022 (Chart of the Week). 3. Will We Spend Our Excess Savings? If spending falls short of income – as it did through the pandemic – then, by definition, our savings have gone up. Many people claimed that this war chest of savings would unleash a tsunami of spending. Well, it didn’t. And, it won’t. Previous episodes of excess savings in 2004, 2008, and 2012 had no impact on the trend in spending (Chart I-7).
Image
The explanation comes from a theory known as Mental Accounting Bias. The theory states that we segment our money into different accounts, which are sometimes physical, sometimes only mental, and that our willingness to spend money depends on which mental account it occupies. This contrasts with standard economic theory which assumes that money is perfectly fungible, meaning that a dollar in a current (checking) account is no different to a dollar in a savings or investment account. In practice, money is not fungible, because we attach different emotions to our different mental accounts. A dollar in our current account we will gladly spend, but a dollar in our savings account we will not spend. Hence, the moment we move the dollar from our current account into our savings account, our willingness to spend it collapses. This explains why consumption trends have no connection with windfall income receipts once those income receipts end up in our savings mental or physical account. Pulling all of this together, the war chest of savings accumulated during the pandemic is unlikely to change the overall trend in spending. 4. How Will Central Banks React To Inflation? The real story of the current ‘inflation crisis’ is that while goods and commodity prices have surged exactly as expected in a positive demand shock, services prices have not declined as would be expected in the mirror-image negative demand shock. The result is that aggregate inflation has surged even though aggregate demand has not (Chart I-8 and Chart I-9). Chart I-8Goods Prices Have Reacted To A Positive Demand Shock...
Goods Prices Have Reacted To A Positive Demand Shock...
Goods Prices Have Reacted To A Positive Demand Shock...
Chart I-9...But Service Prices Have Not Reacted To A Negative Demand Shock
...But Service Prices Have Not Reacted To A Negative Demand Shock
...But Service Prices Have Not Reacted To A Negative Demand Shock
Why have services prices remained resilient despite a massive negative demand shock? One answer, as explained in question 2, is that much of the shortfall in services demand is due to behavioural changes, which cannot be alleviated by lower prices. If somebody doesn’t go to the dentist or use public transport because he is worried about catching Covid, then lowering the price will not lure that person back. In fact, the person might interpret the lower price as a signal of greater risk, and might become more averse. In technical terms, the price elasticity of demand for certain services has flipped from its usual negative to positive. This creates a major problem for central banks, because if the price elasticity of services demand has changed, then surging aggregate inflation is no longer a reliable indicator of surging aggregate demand. To repeat, inflation is surging even though aggregate demand is barely on its pre-pandemic trend. Hence in 2022, central banks face a Hobson’s choice. Choke demand that does not need to be choked, or turn a blind eye to inflation and risk losing credibility. 5. Will Cryptocurrencies Continue To Eat Gold’s Lunch? Most of the value of gold comes not from its economic utility as a beautiful, wearable, and electrically conductive metal, but from its investment value as a hedge against the debasement of fiat money. The multi-year investment case for cryptocurrencies is that they are set to displace much of gold’s investment value. Still, to displace gold’s investment value, cryptocurrencies need to match its other qualities: an economic utility, and limited supply. A cryptocurrency’s economic utility comes from its means of exchange for the intermediation services that its blockchain provides. For example, if you issue a bond or smart-contract using the Ethereum blockchain, then you must pay in its cryptocurrency ETH. Which gives ETH an economic utility. Furthermore, the number of blockchains that will succeed as go-to places for intermediation services will be limited, and each cryptocurrency has a limited supply. Thereby, the supply of cryptocurrencies that have a utility is also limited. With an economic utility, a limited supply, and drawdowns that are becoming smaller, cryptocurrencies can continue to displace gold’s dominance of the $12 trillion anti-fiat investment market. Therefore, the cryptocurrency asset-class can continue its strong structural uptrend, albeit punctuated by short sharp corrections (Chart I-10). Chart I-10Cryptocurrencies Will Continue To Displace Gold's Investment Value
Cryptocurrencies Will Continue To Displace Gold's Investment Value
Cryptocurrencies Will Continue To Displace Gold's Investment Value
The corollary is that the structural outlook for gold is poor. 6. How Fragile Is Chinese Real Estate? A decade-long surge in Chinese property prices has lifted Chinese valuations to nosebleed levels. According to global real estate specialist Savills, prime real estate yields in China’s major cities are now barely above 1 percent, and the world’s five most expensive cities are all in China: Hangzhou, Shenzhen, Guangzhou, Beijing, and Shanghai (Chart I-11).
Chart I-11
Without a social safety net and with limited places to park their money, Chinese savers have for years been encouraged to buy homes, in the widespread belief that property is the safest investment, whose price only goes up. With the bulk of people’s wealth in property acting as a perceived economic safety net, even a modest decline in house prices would constitute a major shock to the household sector’s hopes and expectations of what property is. Therefore, in contrast to the US housing debacle in 2008, the Chinese government will ensure that its property market adjustment does not come from a collapse in home prices. Rather, it will come from a collapse in property development and construction activity. This will have negative implications for commodities, emerging Asia, developing countries that produce raw materials, and machinery stocks worldwide. 7. Will There Be Another Shock? Most strategists claim that shocks, such as the pandemic, are unpredictable. We disagree. Yes, the timing and source of an individual shock is unpredictable, but the statistical distribution of shocks is highly predictable. We define a shock as any event that causes the long-duration bond price in a major economy to rally or slump by at least 20 percent.1 Using this definition through the last 60 years, the statistical distribution of the number of shocks in any ten-year period is Poisson (3.33) and the time between shocks is Exponential (3.33). This means that in any ten-year period, the likelihood of suffering a shock is a near-certain 95 percent; in any five-year period, it is an extremely high 80 percent; in a two-year period it is a coin toss at 50 percent; and even in one year it is a significant 30 percent (Chart I-12).
Chart I-12
Therefore, on a multi-year horizon, another shock is a near-certainty even if we do not know its source or precise timing. The question is, will it be net deflationary, or net inflationary? Our high-conviction view is that it will be net deflationary. Meaning that even if it starts as inflationary, it will quickly morph into deflationary. The simple reason is that it is not just Chinese real estate that is fragile. Through the past ten years, world prime residential prices are up by 70 percent while rents are up by just 25 percent2 (Chart I-13). Meaning that the bulk of the increase in global real estate prices is due to skyrocketing valuations. The culprit is the structural collapse in global bond yields – which, in turn, is due to persistently ultra-low policy interest rates combined with trillions of dollars of quantitative easing. Chart I-13Property Price Inflation Has Far Exceeded Rent Inflation
Property Price Inflation Has Far Exceeded Rent Inflation
Property Price Inflation Has Far Exceeded Rent Inflation
This means that bond yields have very limited scope to rise before pulling the bottom out of the $300 trillion global real estate market. Given that this dwarfs the $90 trillion global economy, it would constitute a massive deflationary backlash to the initial inflationary shock. Some people counter that in an inflationary shock, property – as the ultimate real asset – ought to perform well even as bond yields rise. However, when valuations start off in nosebleed territory as now, the initial intense headwind from deflating valuations would obliterate the tailwind from inflating incomes. Investment Conclusions To summarise, 2022 will be a year in which: Covid waves continue to disrupt the economy; a persistent shortfall in spending on services is not fully countered by excess spending on goods; China’s construction boom comes to an end; inflation takes time to cool, pressuring central banks to raise rates despite fragile demand; and the probability of another shock is an underestimated 30 percent. We reach the following investment conclusions: Overweight the China 30-year bond and the US 30-year T-bond. There will be no sustained rise in long-duration bond yields, and the risk to yields is to the downside. Long-duration equity sectors and stock markets that are least sensitive to cyclical demand will continue to rally (Chart I-14). Chart I-14The US Stock Market = The 30-Year T-Bond Multiplied By Profits
The US Stock Market = The 30-Year T-Bond Multiplied By Profits
The US Stock Market = The 30-Year T-Bond Multiplied By Profits
Overweight the US versus non-US. Underweight Emerging Markets. Underweight old-economy cyclical sectors such as banks, materials, and industrials. Commodities will struggle. Underweight commodities that haven’t corrected versus those that have (Chart I-15). Chart I-15Underweight Commodities That Haven't Yet Corrected
Underweight Commodities That Haven't Yet Corrected
Underweight Commodities That Haven't Yet Corrected
Overweight the US dollar versus commodity currencies. Cryptocurrencies will continue their structural uptrend at the expense of gold. Goods Versus Services Is Technically Stretched Finally, this week’s fractal analysis corroborates the massive displacement from services spending into goods spending, highlighted by the spectacular outperformance of personal goods versus consumer services. This outperformance is now at the point of fragility on its 260-day fractal structure that has signalled previous reversals (Chart I-16). Therefore, a good trade would be to short personal goods versus consumer services, setting a profit target and symmetrical stop-loss at 12.5 percent. Chart I-16Underweight Personal Goods Versus Consumer Services
Underweight Personal Goods Versus Consumer Services
Underweight Personal Goods Versus Consumer Services
Dhaval Joshi Chief Strategist dhaval@bcaresearch.com Footnotes 1 As bond yields approach their lower limit, this definition of a shock will need to change as it will become impossible for long-duration bond prices to rally by 20 percent. 2 Based on Savills Prime Index: World Cities – Capital Values, and World Cities – Rents and Yields, June 2011 through June 2021. Fractal Trading System Fractal Trades 6-Month Recommendations Structural Recommendations Closed Fractal Trades Indicators To Watch - Bond Yields Chart II-1Indicators To Watch - Bond Yields - Euro Area
Indicators To Watch - Bond Yields - Euro Area
Indicators To Watch - Bond Yields - Euro Area
Chart II-2Indicators To Watch - Bond Yields - Europe Ex Euro Area
Indicators To Watch - Bond Yields - Europe Ex Euro Area
Indicators To Watch - Bond Yields - Europe Ex Euro Area
Chart II-3Indicators To Watch - Bond Yields - Asia
Indicators To Watch - Bond Yields - Asia
Indicators To Watch - Bond Yields - Asia
Chart II-4Indicators To Watch - Bond Yields - Other Developed
Indicators To Watch - Bond Yields - Other Developed
Indicators To Watch - Bond Yields - Other Developed
Indicators To Watch - Interest Rate Expectations Chart II-5Indicators To Watch - Interest Rate Expectations
Indicators To Watch - Interest Rate Expectations
Indicators To Watch - Interest Rate Expectations
Chart II-6Indicators To Watch - Interest Rate Expectations
Indicators To Watch - Interest Rate Expectations
Indicators To Watch - Interest Rate Expectations
Chart II-7Indicators To Watch - Interest Rate Expectations
Indicators To Watch - Interest Rate Expectations
Indicators To Watch - Interest Rate Expectations
Chart II-8Indicators To Watch - Interest Rate Expectations
Indicators To Watch - Interest Rate Expectations
Indicators To Watch - Interest Rate Expectations
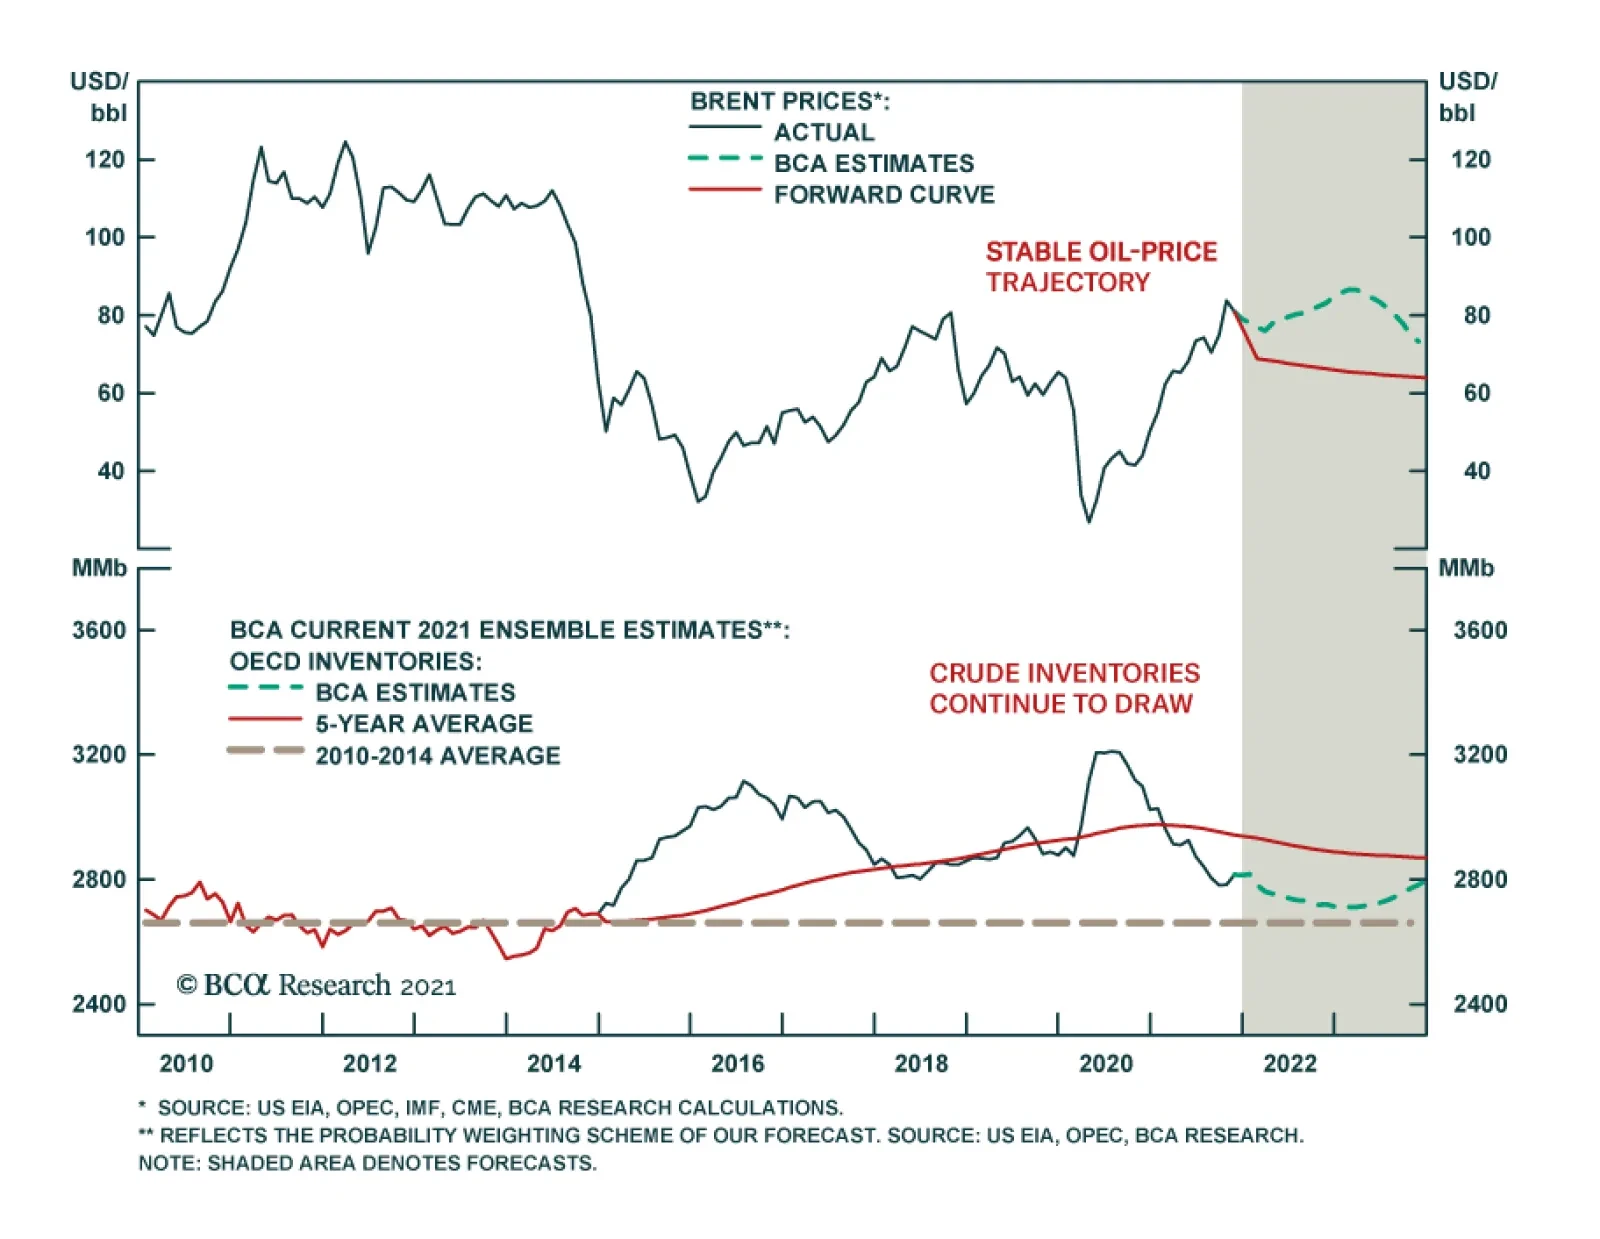
Oil prices have been on a wild ride over the past couple of months. The energy crisis rally that had pushed Brent prices up by 15.6% in September and October lost steam in November as investors speculated that the Biden administration would release some of…