Commodities & Energy Sector

Highlights The 26th Conference of the Parties (COP26) will open this weekend in Glasgow, Scotland, amid a global crisis induced in no small measure by policies and regulations that led to energy-market failures. Price-distorting regulations and ad hoc fixes – e.g., retail price caps, "windfall profits" taxes – will compound the current crisis. Mad rushes to cover energy and space-heating demand in spot coal and gas markets when renewable-energy output falters will be repeated, given utility-scale battery storage will continue to be insufficient to replace hydrocarbons in the transition to a low-carbon economy. On the back of higher coal, gas and oil demand, CO2 emissions will return to trend growth or higher this year (Chart of the Week). Base metals capex will have to increase at the mining and refining levels to meet renewables and EV demand. This includes the need to diversify metals' production and refining concentration risks more broadly.1 We remain strategically long the COMT ETF and the S&P GSCI index, as these fundamental imbalances are addressed. We also are initiating a resting buy order on the XME ETF if this basic materials ETF trades down to $40/share. Feature Going into the COP26 meetings starting this weekend, delegates no doubt will be preoccupied with the global energy crisis engulfing markets as the Northern Hemisphere winter approaches. In no small measure, the crisis is a product of poor policy design and regulatory measures meant to accelerate the transition to low-carbon economies globally. This is most apparent in China, the UK and the EU. China and the UK use retail price-caps to control the cost of energy to households. In China, the price caps recently brought state-owned electricity providers to the brink of bankruptcy, because suppliers were not able to pass through higher wholesale prices for coal and natural gas to retail consumers. In the UK, retail price caps actually did result in bankruptcies of smaller electricity providers. In the EU, price caps and "windfall profits" taxes are being imposed on retail energy providers in different states in the wake of the energy crisis.2
Chart 1
China's Impressive Renewables Push China has been making significant progress in introducing renewable energy to their energy supply mix, particularly wind and solar (Chart 2), accounting for 81.5% of Asia-Pacific's wind generation last year, and 55.5% of the region's solar generation.
Chart 2
China generates just 11% of its energy from renewables. This has been insufficient to meet demand over the past year, owing to a combination of reduced coal supplies; colder-than-normal temperatures last winter, and hotter-than-normal temps during the summer brought on by a La Niña event. While energy demand was expanding over the course of the year due to strong economic growth in 1H21 and weather-related demand over the course of the year (for heating and cooling), provincial officials were vigorously enforcing the state-mandated "dual-control policy," which in some instances led to overly aggressive shutdowns of coal mines that left local markets short of the fuel needed to supply ~ 63% of the country's electricity.3 Chinese authorities have said that they would “go all out” to boost coal production in a bid to tackle widespread power cuts. Some 20 provinces in China have experienced electricity rationing and blackouts over the past month due to power-production shortfalls driven by a lack of coal. The power rationing was imposed due to a shortage of coal supply, which led to the surge in coal prices. The high coal prices, in turn, forced coal-power companies to cut back their production to avoid losses that threatened to bankrupt them.4 To be able to ensure coal and electricity supplies this winter, state authorities released new rules to enforce a policy scheme that includes increasing coal production capacity and revising the electricity pricing mechanism. China's state-owned Global Times news service reported more than 150 coal mines have been approved to re-open.5 The regional governments can prioritize their energy intensity targets over energy consumption. Coal-fired power prices, which are largely state-controlled, will be allowed to fluctuate by up to 20% from baseline levels. However, raising household tariffs is seen as a difficult task politically, given that China's per-capita income remains low.6 UK, EU Market-Distortions The UK electricity production and supply market consists of three segments – producing, distributing, and selling electricity. Entities can operate in any or all of these areas. As in many things, the UK punches way above its weight in renewables, accounting for 15% of wind generation and 7.5% of solar produced in Europe, as seen in Chart 2. Wind can supply ~ 25% of UK power, depending on weather conditions. For all renewables, the UK accounts for 14% of Europe's total generation capacity. Twice a year, the national energy regulator, The Office of Gas and Electricity Markets (Ofgem) sets a cap on the price at which electricity sellers or retailers can supply power to the final consumer. While the maximum price retailers can sell electricity to consumers is capped, the price they can buy it from the electricity producer is not. This price depends on market factors, including fuel costs. When wind power dropped sharply this past summer, electric suppliers were forced to scramble for natgas as a generation fuel, and, at the margin, coal. In the UK, natural gas powers more than 35% of the electricity mix, and accounts for 15% of Europe's natgas-fired generation. Coal generation in the UK accounts for 1% of Europe's coal fueled electricity generation. China's push to secure additional coal and natgas places it in direct competition for limited supplies with European buyers. High demand, stiff competition, reduced supply, and low inventories all contribute to higher gas prices globally (Chart 3). Easing pandemic related restrictions globally has released pent-up energy demand, which is expected to move higher over the next few months, as the Northern Hemisphere possibly sees another colder-than-normal winter, and economic growth boosts manufacturing demand.
Chart 3
Capping selling prices during periods of very high fuel costs squeezes retailers’ profit margins. In the last six weeks, seven UK retailers have gone under, affecting ~ 1.5 million consumers. Such a system favors the incumbents: retailers that can produce their own electricity and hedge their exposure to price volatility have access to lower costs of capital and higher economies of scale. When retailers are no longer able to operate due to bankruptcy, their customers are distributed to the remaining suppliers. The British government would prefer to offer financial support to persuade larger companies to take on stranded consumers than save retailers who are being forced to go out of business.7 However, as wholesale gas prices rise, industry operators – even the more established ones – may not be keen to borrow from the government to take on additional consumers. The EU also finds itself facing stiff competition from Asia for natgas imports. According to Qatar’s energy minister, suppliers prefer Asian buyers since they purchase natgas on fixed long-term contracts to ensure energy security, unlike European buyers which purchase much of their fuel on the spot market.8 The EU's natgas imports are projected to remain uncertain as Russian exports have fallen below pre-pandemic levels and supply via the NordStream2 pipeline is delayed. With one of the lowest working inventories within the EU (Chart 4), the UK, which imports ~ 65% of its natural gas, is unable to protect itself from supply volatility. These high prices coincided with low wind speeds earlier this year, curtailing wind power, which as of 2020, is the UK’s second highest electricity source.
Chart 4
Unfocused Policy Hinders Energy Transition It is impossible to gainsay the merit of the decarbonization of the global economy. Disrupting weather patterns, spewing particulates and chemicals into the atmosphere, dumping plastics into the oceans and waterways, and ravaging forests worldwide do not contribute to any species fitness for survival. However, policymakers appear to be completely ignoring existing constraints any serious decarbonization effort would require. Encouraging the winddown of fossil fuels decades before sufficient renewable-energy and carbon-capture technologies are developed and deployed to replace the lost energy indirectly forces a harsh calculation: Do sovereign governments want to restrict income growth and quality-of-life improvements to the energy available from renewables (including EVs) at any point in time? Who actually makes that choice and enforces the rules and regulations that go with it? We have written about the enormous increase in base metals supply that will be required over the coming decades to develop and deploy renewables, most recently in La Niña And The Energy Transition last month. Base metals – like oil and gas markets – are extremely tight, and are operating in years-long physical deficit conditions, as can be seen in the bellwether copper and Brent markets (Charts 5 and 6). Chart 5Base Metals Markets Are Tight …
Base Metals Markets Are Tight...
Base Metals Markets Are Tight...
Chart 6As Is Oil...
As Is Oil...
As Is Oil...
Any policy contemplating a global buildout of renewable-energy generation and its supporting grids, along with EVs and their supporting infrastructure, should start with the recognition laws, regulations and rules need to encourage responsible, safe and sound incentives for developing the supply side of base metals markets. An argument also could be made for fossil-fuels, which arguably should receive technology subsidies and favorable tax treatment – not unlike those granted to renewables and EVs – to invest in carbon-capture tech development. Rules and regulations favoring long-term contracts so that producers are able to address stranded-asset concerns and secure funding for these projects also should be developed. Investment Implications Absent a more thought-out and focused effort to write laws, develop rules and regulations on at least the level of trading blocs, the evolution to a low-carbon energy future will be halting and volatile. This in an of itself is detrimental to funding such an enormous undertaking. Until something like it comes along, we remain long commodity-index exposure – the S&P GSCI index and the COMT ETF – and long the PICK ETF. At tonight's close we are opening a resting order to buy the XME ETF if if trades to or below $40/share. Robert P. Ryan Chief Commodity & Energy Strategist rryan@bcaresearch.com Ashwin Shyam Research Associate Commodity & Energy Strategy ashwin.shyam@bcaresearch.com Paula Struk Research Associate Commodity & Energy Strategy paula.struk@bcaresearch.com Commodities Round-Up Energy: Bullish Crude oil markets unexpectedly moved lower mid-week on the back of yet another drop in Cushing, OK, inventory levels reported by the US EIA. Cushing crude-oil stocks stood at 27.3mm barrels vs. 31.2mm barrels for the week ended 22 October 2021. Two years ago, Cushing inventories were at 46mm barrels. Markets had been rallying on falling Cushing storage levels over the past couple of weeks. The EIA's estimate of refined-product demand – known as "Product Supplied" – remains below comparable 2019 levels at this time of year, although not by much (19.8mm b/d vs. 21.6mm b/d). We expect global oil and liquids demand to rebound above 100mm b/d in the current quarter. Stronger demand in 2022 and 2023 prompted us to raise our Brent forecasts to $80/bbl and $81/bbl, respectively (Chart 7). Base Metals: Bullish Copper continues to trade lower as markets price in a higher likelihood of softer demand for the bellwether metal as the global power-supply crunch weighs on manufacturing activity, particularly in China. Copper inventories are still at precariously low levels, with the red metal in global inventories hitting lows not seen since 2008 (Chart 8). This will keep copper's forward curve backwardated over time, as inventories are drawn to fill the gap between supply and demand globally. Low inventory levels are expected to persist as power rationing in China, which was responsible for more than 41% of global refined copper output in 2020, persists. Precious Metals: Bullish Federal Reserve Chairman Jerome Powell's remarks stating supply disruptions are expected to keep US inflation elevated next year are supportive to base metals. Higher inflation will increase demand for the yellow metal, as investors look for a hedge against USD debasement. However, the Fed's asset-purchase taper, which we expect to be announced in November, and the interest rate hikes we expect as a result of it beginning in end-2022, will push bond yields higher and raise the opportunity cost of holding non-yielding gold. That said, we believe the Fed will remain behind the inflation curve and will work to keep real rates weak, which will tend to support gold prices. Chart 7
Brent Forecast Lifted Slightly
Brent Forecast Lifted Slightly
Chart 8
Global Copper Inventories Rebuilding But Still Down Y/Y
Global Copper Inventories Rebuilding But Still Down Y/Y
Footnotes 1 Please see our report entitled La Niña And The Energy Transition, published on September 30, 2021, for discussion. 2 Please see Spain to Cap Windfall Energy Profits as Rally Hits Inflation published by bloomberglaw.com on September 14, 2021. 3 Please see carbonbrief.org's China Briefing for 23 and 30 September and 14 October 2021 for additional discussion, and fn 1 above. 4 Please see ‘All out’ to beat power shortages; 2050 ‘net-zero’ for airlines; ‘Critical decade” for global warming, published by China Brief on 7 October, 2021. 5 Please see Chinese officials move to increase coal output amid shortage published by globaltimes.cn 13 October 2021. 6 Data from the World Bank showed China's GDP per capita reached $10,500 in 2020, below the global average of $10,926. Some experts expect any reform to be gradual. 7 Please see Kwarteng insists UK will avoid power shortages as gas crisis worsens, published by the Financial Times on September 20, 2021. 8 Please see Qatar calls for embrace of gas producers for energy transition, published by the Financial Times on October 24, 2021. Investment Views and Themes Recommendations Strategic Recommendations
In lieu of next week’s report, I will be presenting the quarterly Counterpoint webcast titled ‘Where Is The Groupthink Wrong? (Part 2)’. I do hope you can join. Highlights If a continued surge in the oil price – or other commodity or goods prices – started driving up the 30-year T-bond yield, the markets and the economy would feel the pain. We reiterate that the pain point at which the Fed would be forced to volte-face is only around 30 bps away on the 30-year T-bond, equal to a yield of around 2.4-2.5 percent. That would be a great buying opportunity for bonds. Given the proximity of this pain point, it is too late to short bonds, or for equity investors to rotate into value and cyclical equity sectors. That tactical opportunity has almost played out. On a 6-month and longer horizon, equity investors should prefer long-duration defensive sectors such as healthcare. Chinese long-duration bond yields are on a structural downtrend. Fractal analysis: The Korean won is oversold. Feature Many people have noticed the suspicious proximity of oil price surges to subsequent economic downturns – most recently, the 1999-2000 trebling of crude and the subsequent 2000-01 downturn, and the 2007-2008 trebling of crude and the subsequent 2008-09 global recession. Begging the question, should we be concerned about the trebling of the crude oil price since March 2020? Of course, we know that the root cause of both the 2000-01 downturn and the 2008-09 recession was not the oil price surge that preceded them. As their names make crystal clear, the 2001-01 downturn was the dot com bust and the 2008-09 recession was the global financial crisis. And yet, and yet… while the oil price surge was not the culprit, it was certainly the accessory to both murders, by driving up the bond yield and tipping an already fragile market and economy over the brink. Today, could oil become the accessory to another murder? (Chart I-1) Chart I-1AOil Was The Accessory To The Murder In 2008...
Oil Was The Accessory To The Murder In 2008...
Oil Was The Accessory To The Murder In 2008...
Chart I-1B...Could It Become The Accessory To Another Murder?
...Could It Become The Accessory To Another Murder?
...Could It Become The Accessory To Another Murder?
Oil Is The Accessory To Many Murders Turn the clock back to the 1970s, and it might seem more straightforward that the recession of 1974 was the direct result of the oil shock that preceded it. Yet even in this case, we can argue that oil was the accessory, rather than the true culprit of that murder. It is correct that the specific timing, magnitude, and nature of OPEC supply cutbacks were closely related to geopolitical events – especially the US support for Israel in the Arab-Israeli war of October 1973. Yet as neat and popular as this explanation is, it ignores a bigger economic story: the collapse in August 1971 of the Bretton Woods ‘pseudo gold standard’, which severed the fixed link between the US dollar and quantities of commodities. To maintain the real value of oil, the OPEC countries were raising the price of crude oil well before October 1973. Meaning that while geopolitical events may have influenced the precise timing and magnitude of price hikes, OPEC countries were just ‘staying even’ with the collapsing real value of the US dollar, in which oil was priced. Seen in this light, the true culprit of the recession was the collapse of the Bretton Woods system, and the oil price surge through 1973-74 was just the accessory to the murder (Chart I-2). Chart I-2In 1973-74, OPEC Was Just 'Staying Even' With A Collapsing Real Value Of The Dollar
In 1973-74, OPEC Was Just 'Staying Even' With A Collapsing Real Value Of The Dollar
In 1973-74, OPEC Was Just 'Staying Even' With A Collapsing Real Value Of The Dollar
A quarter of a century later in 1999, the oil price again trebled within a short time span – and by the turn of the millennium, the ensuing inflationary fears had pushed up the 10-year T-bond yield from 4.5 percent to almost 7 percent (Chart I-3). With stocks already looking expensive versus bonds, it was this increase in the bond yield – rather than a decline in the equity earnings yield – that inflated the equity bubble to its bursting point in early 2000 (Chart I-4). Chart I-3In 1999, As Oil Surged, So Did The Bond Yield...
In 1999, As Oil Surged, So Did The Bond Yield...
In 1999, As Oil Surged, So Did The Bond Yield...
Chart I-4...Making Expensive Equities Even More Expensive
...Making Expensive Equities Even More Expensive
...Making Expensive Equities Even More Expensive
To repeat, for the broader equity market, the last stage of the bubble was not so much that stocks became more expensive in absolute terms (the earnings yield was just moving sideways). Rather, stock valuations worsened markedly relative to sharply higher bond yields. Seen in this light, the oil price surge through 1999 was once again the accessory to the murder. Eight years later in 2007-08, the oil price once again trebled with Brent crude reaching an all-time high of $146 per barrel in July 2008. Again, the inflationary fears forced the 10-year T-bond yield to increase, from 3.25 percent to 4.25 percent during the early summer of 2008 (Chart I-5) – even though the Federal Reserve was slashing the Fed funds rate in the face of an escalating financial crisis (Chart I-6). Chart I-5In 2008, As Oil Surged, So Did The Bond Yield...
In 2008, As Oil Surged, So Did The Bond Yield...
In 2008, As Oil Surged, So Did The Bond Yield...
Chart I-6...Even Though The Fed Was Slashing Rates In The Face Of A Financial Crisis
...Even Though The Fed Was Slashing Rates In The Face Of A Financial Crisis
...Even Though The Fed Was Slashing Rates In The Face Of A Financial Crisis
Suffice to say, driving up bond yields in the summer of 2008 – in the face of the Fed’s aggressive rate cuts and a global financial system teetering on the brink – was not the smartest thing that the bond market could do. On the other hand, neither could it override its Pavlovian fears of the oil price trebling. Seen in this light, the oil price surge through 2007-08 was once again the accessory to the murder. Inflationary Fears May Once Again Lead To Murder Fast forward to today, and the danger of the recent trebling of the oil price comes not from the oil price per se. Instead, just as in 2000 and 2008, the danger comes from its potential to drive up bond yields, which can tip more systemically important economic and financial fragilities over the brink. One such fragility is the extreme sensitivity of highly-valued growth stocks to the 30-year T-bond yield, as explained in The Fed’s ‘Pain Point’ Is Only 30 Basis Points Away. On this note, one encouragement is that while shorter duration yields have risen sharply through October, the much more important 30-year T-bond yield has just gone sideways. A much bigger systemic fragility lies in the $300 trillion global real estate market, as explained in The Real Risk Is Real Estate (Part 2). Specifically, the global real estate market has undergone an unprecedented ten-year boom in which prices have doubled in every corner of the world. Over the same period, rents have risen by just 30 percent, which has depressed the global rental yield to an all-time low of 2.5 percent. Structurally depressed rental yields are justified by structurally depressed 30-year bond yields. Therefore, any sustained rise in 30-year bond yields risks undermining the foundations of the $300 trillion global real estate market (Chart I-7). Chart I-7Structurally Depressed Rental Yields Are Justified By Structurally Depressed 30-Year Bond Yields
Structurally Depressed Rental Yields Are Justified By Structurally Depressed 30-Year Bond Yields
Structurally Depressed Rental Yields Are Justified By Structurally Depressed 30-Year Bond Yields
Nowhere is this truer than in China, where prime real estate yields in the major cities are at a paltry 1 percent. In this context, the recent woes of real estate developer Evergrande are just the ‘canary in the coalmine’ warning of an extremely fragile Chinese real estate sector. This will put downward pressure on China’s long-duration bond yields. As my colleague, BCA China strategist, Jing Sima, points out, “Chinese long-duration bond yields are on a structural downtrend…yields are likely to move structurally to a lower bound.” But it is not just in China. Real estate is at record high valuations everywhere and contingent on no major rise in long-duration bond yields. In the US, there is a tight relationship between the (inverted) 30-year bond yield and mortgage applications for home purchase (Chart I-8), and a tight relationship between mortgage applications for home purchase and building permits (Chart I-9). Thereby, higher bond yields threaten not only real estate prices. They also threaten the act of building itself, an important swing factor in economic activity. Chart I-8The Bond Yield Drives Mortgage Applications...
The Bond Yield Drives Mortgage Applications...
The Bond Yield Drives Mortgage Applications...
Chart I-9...And Mortgage Applications Drive Building Permits
...And Mortgage Applications Drive Building Permits
...And Mortgage Applications Drive Building Permits
To repeat, focus on the 30-year T-bond yield – as this is the most significant driver for both growth stock valuations, and for real estate valuations and activity. To repeat also, the 30-year T-bond yield has been generally well-behaved over the past few months. But if a continued surge in the oil price – or other commodity or goods prices – started driving up the 30-year T-bond yield, the markets and the economy would feel pain. And at some point, this pain would force the Fed to volte-face. We reiterate that this pain point is only around 30 bps away, equal to a yield on 30-year T-bond of around 2.4-2.5 percent – a level that would be a great buying opportunity for bonds. Given the proximity of this pain point, it is too late to short bonds or for equity investors to rotate into value and cyclical equity sectors. That tactical opportunity has almost played out. On a 6-month and longer horizon, equity investors should prefer long-duration defensive sectors such as healthcare. The Korean Won Is Oversold Finally, in this week’s fractal analysis, we note that the Korean won is oversold – specifically versus the Chinese yuan on the 130-day fractal structure of that cross (Chart I-10). Chart I-10The Korean Won Is Oversold
The Korean Won Is Oversold
The Korean Won Is Oversold
Given that previous instances of such fragility have reliably indicated trend changes, this week’s recommended trade is long KRW/CNY, setting the profit target and symmetrical stop-loss at 2 percent. Dhaval Joshi Chief Strategist dhaval@bcaresearch.com Fractal Trading System Fractal Trades 6-Month Recommendations Structural Recommendations Closed Fractal Trades Indicators To Watch - Bond Yields Chart II-1Indicators To Watch - Bond Yields ##br##- Euro Area
Indicators To Watch - Bond Yields - Euro Area
Indicators To Watch - Bond Yields - Euro Area
Chart II-2Indicators To Watch - Bond Yields ##br##- Europe Ex Euro Area
Indicators To Watch - Bond Yields - Europe Ex Euro Area
Indicators To Watch - Bond Yields - Europe Ex Euro Area
Chart II-3Indicators To Watch - Bond Yields ##br##- Asia
Indicators To Watch - Bond Yields - Asia
Indicators To Watch - Bond Yields - Asia
Chart II-4Indicators To Watch - Bond Yields ##br##- Other Developed
Indicators To Watch - Bond Yields - Other Developed
Indicators To Watch - Bond Yields - Other Developed
Indicators To Watch - Interest Rate Expectations Chart II-5Indicators To Watch - Interest Rate Expectations
Indicators To Watch - Interest Rate Expectations
Indicators To Watch - Interest Rate Expectations
Chart II-6Indicators To Watch - Interest Rate Expectations
Indicators To Watch - Interest Rate Expectations
Indicators To Watch - Interest Rate Expectations
Chart II-7Indicators To Watch - Interest Rate Expectations
Indicators To Watch - Interest Rate Expectations
Indicators To Watch - Interest Rate Expectations
Chart II-8Indicators To Watch - Interest Rate Expectations
Indicators To Watch - Interest Rate Expectations
Indicators To Watch - Interest Rate Expectations
With 119 S&P 500 companies having reported Q3-2021 earnings, it’s time to take a pulse of the interim results. So far, the blended earnings growth rate is 34.8% while actual reported growth rate is 49.9%. The blended sales growth rate is 14.4%, while the actual reported rate is 16.6%. Analysts expected Q3-2021 earnings to be 6% below the Q2-2021 level. As of now, this quarter’s earnings are only 3% lower. Most of the companies that have reported are beating analysts’ forecasts are surprising to the upside. Currently, 83% of companies reported EPS above expectations, with five out of eleven sectors delivering an impressive 100% beat score. In terms of the magnitude of the beats, the overall number currently stands at 14% with Financials and Technology leading the pack. However, these results are bound to change as more companies report: less than 5% of the market cap has reported within the Energy, Materials, Real Estate, and Utilities sectors. The big theme for the current earnings season is input cost inflation. Many industrial giants, including Honeywell (HON), are complaining about supply-chain cost increases, and their potential adverse effect on margins. As a result, many companies are reducing guidance for the fourth quarter. So far, there are 59 positive pre-announcements, and 45 negative. On the bright side, the majority of companies are reporting that demand for their products remains strong, potentially offsetting some of the cost increases. This is especially the case with consumer demand: a few consumer staples companies, such as P&G, commented that their recent price hikes have not dampened demand for their products and have fortified their bottom line against rising costs. Bottom Line: The earnings season is gaining speed, and so far, it appears that Q3-2021 growth expectations are set at a low bar, that is easy to clear for most companies.
Chart
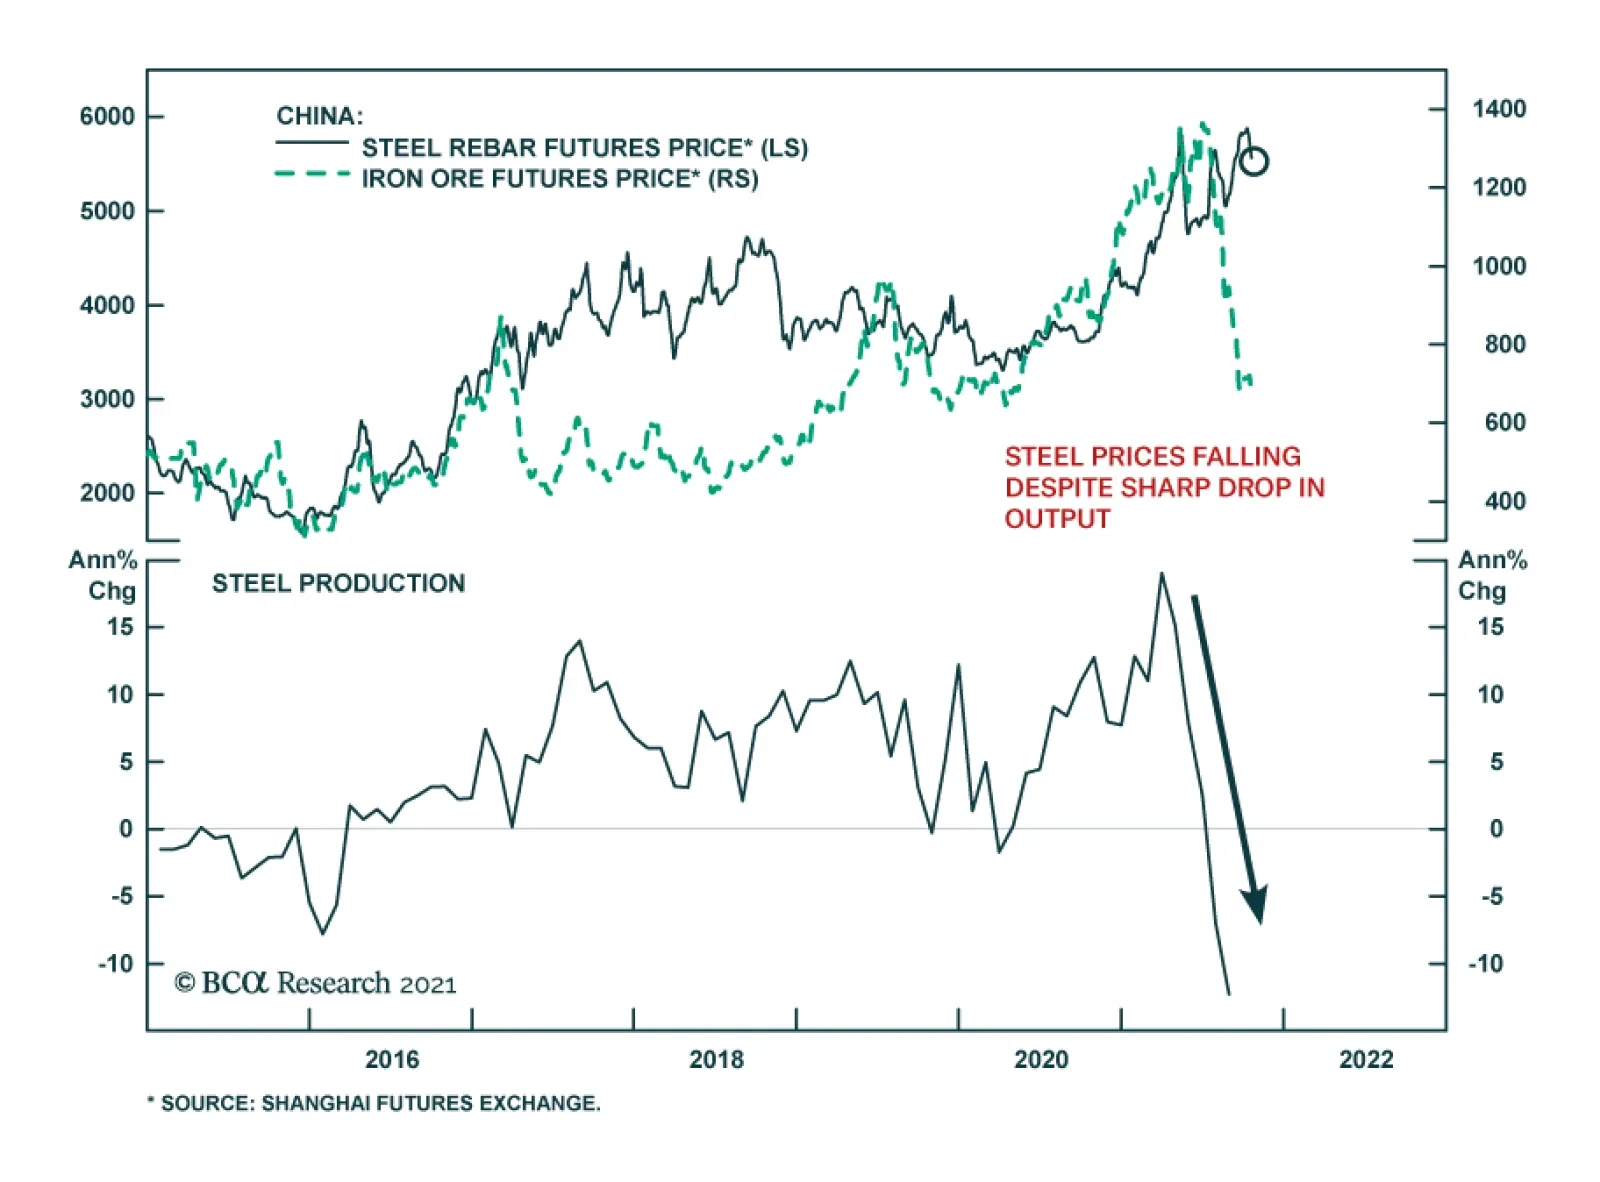
Chinese steel rebar prices have been declining for the past two weeks and now stand 9.5% below their level earlier this month. The decline in steel prices is curious given that it comes amid production curbs that are reducing steel output in…
Dear client, In addition to this week’s brief report, we presented at our annual BCA conference on the challenges to the US dollar’s reserve status. If you missed the session, please contact your account representative for a replay. Kind regards, Chester Highlights The gold/silver ratio is relapsing anew. This has historically been a bearish omen for the dollar. Many petrocurrencies have lagged the rise in oil prices, and offer a very attractive carry. Go long a basket of oil producers (NOK, RUB, MXN and COP) versus the euro. Currency volatility is too low, and is bound to rise. Stay long CHF/NZD on this basis. Remain tactically long EUR/GBP as a play on slight policy convergence between the UK and the euro area. Feature Chart I-1Being Short The Dollar Has Hurt This Year
Being Short The Dollar Has Hurt This Year
Being Short The Dollar Has Hurt This Year
Investing in currencies is tough. One of the reasons is that the currency market is the melting pot of a confluence of catalysts. These range from relative growth dynamics, policy divergences, sector biases that dictate portfolio flows and politics, among many other factors. Our bias has always been that acting on perfect information is a highly improbable feat because we are not insiders. As such, in April 2020, we designed a rules-based model to see if, over time, currencies could be traded purely based on publicly available information. Our results, grounded on the fundamental basis that has defined the BCA approach, was a positive surprise (Chart I-1). Armed with this conviction, this week’s bulletin is focused on a few themes we have held and trading opportunities around these. In a nutshell, a positive bias on any currency can be calibrated on a good macro catalyst, a valuation cushion, and going against the consensus. An Inflation Hedge On A Reflationary Boom It is becoming more evident that inflation might prove stickier than most policymakers expect. This is bad news for real interest rates. Negative real rates have been historically positive for gold and other precious metals. Within this sphere, our preference has been silver. First, silver is a reflationary metal and tends to do well when global growth is strong and the dollar is falling (Chart I-2). Since the onset of the COVID-19 crisis, silver has had a near-perfect negative correlation with the dollar (Chart I-3). Chart I-2Gold, Silver, And the Dollar
Gold, Silver, And the Dollar
Gold, Silver, And the Dollar
Chart I-3Silver Is A Good Reflation Play
Silver Is A Good Reflation Play
Silver Is A Good Reflation Play
There are also an economic and valuation cases to be made for silver. Economically, silver is a byproduct of both copper and zinc mining, which have had supply-side disruptions. Meanwhile, a boom in goods demand has boosted the demand for silver, which mainly goes into electronics production. The combination is leading to a deficit in the silver demand/supply balance (Chart I-4). On the valuation side, the fair value for the gold/silver ratio is near 50, which has been the mean since the 18th century (Chart I-5) Chart I-4Silver Has A Supply Deficit
Silver Has A Supply Deficit
Silver Has A Supply Deficit
Chart I-5Gold Is Expensive Relative To Silver
Gold Is Expensive Relative To Silver
Gold Is Expensive Relative To Silver
Fundamentally, both silver and gold are precious metals. Just like gold, silver benefits from low interest rates, plentiful liquidity, and the incentive for currency wars and fiat money debasement. However, the gold/silver ratio tends to peak when the environment migrates from reflationary to inflationary (Chart I-6). As such, silver is a good inflationary hedge amidst a reflationary boom. This brings us to the sweet spot for silver. Even if global growth remains tepid over the next few months, a lot of the bad news is already reflected in silver prices, especially vis-à-vis gold. Relative speculative positioning hit a low of -25% as a percent of open interest. Relative sentiment on gold is 10% higher relative to silver. This is bullish from a contrarian perspective (Chart I-7). Chart I-6Silver Does Well With Rising Inflation
Silver Does Well With Rising Inflation
Silver Does Well With Rising Inflation
Chart I-7Silver Has Been Shunned Relative To Gold
Silver Has Been Shunned Relative To Gold
Silver Has Been Shunned Relative To Gold
Higher Currency Volatility Currency volatility is likely to rise in the coming months. Options markets offer many opportunities to trade this theme, but being long CHF/NZD is an attractive bet as well (Chart I-8). The kiwi is backed by a very hawkish central bank that will likely dial back its rhetoric amid much uncertainty about the growth outlook. Meanwhile, the kiwi is expensive according to most of our models. As such, we expect the kiwi to rise vis-à-vis the greenback over a cyclical horizon, but we feel it is at risk on a tactical basis. Chart I-8CHF/NZD Tracks Dollar Volatility
CHF/NZD Tracks Dollar Volatility
CHF/NZD Tracks Dollar Volatility
The RBNZ has decided to introduce house price considerations into its mandate. While this is politically palatable, it is economically unviable as rising real estate prices are a global phenomenon. The risk is that a hawkish RBNZ tilts the economy over, especially if the current environment is stagflationary. As such, we are short the NZD at the crosses. Our long AUD/NZD position is based on policy convergence between Australia and New Zealand and our long CHF/NZD is based on rising currency volatility. We were stopped out of our long CHF/NZD position and are reinitiating the trade today. A Play On Higher Oil Prices Oil prices are likely to stay elevated in the coming months. But even if they relapse, a bet on being long oil producers versus consumers could still prove profitable. Petrocurrencies have lagged the performance of oil tremendously (Chart I-9). This is especially the case when looking at oil-producing countries versus oil-consuming ones. RUB, COP, and MXN are trading well below their implied levels relative to the USD, EUR, and RMB. Chart I-9Petrocurrencies Will Catch Up With Oil Price
Petrocurrencies Will Catch Up With Oil Price
Petrocurrencies Will Catch Up With Oil Price
A lot of oil players are seeing a rebound in their economies, as their populations get vaccinated. Russia, Mexico, Brazil, and Colombia all have lower new COVID-19 incidences, compared to earlier this year and versus the US (Chart I-10). As a result, economic activity is rebounding in these countries relative to the US (Chart I-11). Our bias is that the dollar will resume its cyclical bear market in the coming months. This will push up many petrocurrencies, as the path of the dollar usually dictates the performance of many developed and emerging market currencies (Chart I-12). Chart I-10A Drop In Infections Outside The US...
A Drop In Infections Outside The US...
A Drop In Infections Outside The US...
Chart I-11...Leading To A Recovery In Growth
...Leading To A Recovery In Growth
...Leading To A Recovery In Growth
Chart I-12Petrocurrencies Track The Dollar
Petrocurrencies Track The Dollar
Petrocurrencies Track The Dollar
The big risk is a slowdown in China, which will have a meaningful impact on oil demand. The Chinese credit impulse correlates quite well with commodity and oil currencies, and therefore, should the impulse slow further, this will meaningfully impact import demand (Chart I-13). Our bias is that there is little downside to the credit impulse in China, while the imperative to stimulate the economy could be rising. So far, the authorities have been able to ringfire the crisis with no meaningful capital outflows (Chart I-14). Chart I-13China Slowdown A Risk...
China Slowdown A Risk...
China Slowdown A Risk...
Chart I-14...But No Systemic Risk Yet
...But No Systemic Risk Yet
...But No Systemic Risk Yet
On the sentiment and valuation fronts, the case for petrocurrencies is more compelling. Starting with valuation, all of our models show many petrocurrencies as deeply undervalued. On a real effective exchange rate basis, the MXN, COP, and BRL are trading well below historical averages (Chart I-15). On the sentiment front, it is true that many petrocurrencies have lagged the increase in oil prices amid domestic demand concerns. This is bound to change as populations get vaccinated and their economies reopen. More importantly, many petrocurrencies sport very attractive real rates (Chart I-16). If our bias on a dollar decline proves correct, then the carry will be an added bonus. As such, we recommend going long a basket of RUB, COP, and MXN against the euro Chart I-15Most Petrocurrencies Are Cheap
Most Petrocurrencies Are Cheap
Most Petrocurrencies Are Cheap
Chart I-16Petrocurrencies Have An Attractive Carry
Petrocurrencies Have An Attractive Carry
Petrocurrencies Have An Attractive Carry
Chester Ntonifor Foreign Exchange Strategist chestern@bcaresearch.com Currencies U.S. Dollar Chart II-1USD Technicals 1
USD Technicals 1
USD Technicals 1
Chart II-2USD Technicals 2
USD Technicals 2
USD Technicals 2
The US economy remains relatively robust: Retail sales came in at 1.8% month-on-month in September, well above consensus of an 0.8% increase. Sentiment in the US is drifting lower, according to the Michigan survey. The current conditions component of the index slipped from 80.1 to 77.9 in October. The sentiment component also fell from 72.8 to 71.4. Portfolio flows into the US remained strong with net TIC inflows of $US 126bn. Both housing starts and building permits rose in September. Ditto for existing home sales, that increased from 5.88mn to 6.29mn. The US dollar DXY index fell this week. The general tone to markets has been risk on, which has led to less demand for the safe-haven dollar. Meanwhile, according to CFTC data, speculators are very long the dollar which is bearish from a contrarian perspective. Report Links: Arbitrating Between Dollar Bulls And Bears - March 19, 2021 The Dollar Bull Case Will Soon Fade - March 5, 2021 Are Rising Bond Yields Bullish For The Dollar? - February 19, 2021 The Euro Chart II-3EUR Technicals 1
EUR Technicals 1
EUR Technicals 1
Chart II-4EUR Technicals 2
EUR Technicals 2
EUR Technicals 2
Euro area data was mixed this week: New car registrations fell by 23% year-on-year in September. The trade balance came in at €11.1bn, a robust number but below expectations of a €14.2bn surplus. Consumer confidence keeps deteriorating in the euro area amidst the energy crisis. The euro was up 0.2% this week. EUR/USD has had a wild ride in recent weeks, having breached below 1.16. That said, the tides are turning in favor of the euro. Speculators are short the currency, and interest rate expectations for the euro area are bombed out relative to other developed markets. This provides room for positive surprises. Report Links: Relative Growth, The Euro, And The Loonie - April 16, 2021 The Euro Dance: One Step Back, Two Steps Forward - April 2, 2021 On Japanese Inflation And The Yen - January 29, 2021 The Japanese Yen Chart II-5JPY Technicals 1
JPY Technicals 1
JPY Technicals 1
Chart II-6JPY Technicals 2
JPY Technicals 2
JPY Technicals 2
Recent Japanese data has been mixed: Condominium sales fell be 6.7% year-on-year in September. Trade remains robust. Exports rose by 15% year-on-year, while imports surged by 38.6% year-on-year. Supermarket sales increased 3.2% year-on-year in September. The yen rose 20bps this week. We were bullish the yen around 109, and even more bullish at current levels. The two things that have thrown this view offside are 1) an abrupt rise in US yields, that has attracted Treasury bids from Japanese investors and 2) profit taking by foreign investors who did catch the Japan outperformance in August. On the other side of the coin, the yen is now one of the most shorted G10 currencies, and Japanese data has been so poor relative to the rest of the G10 that some measure of catchup is due. Report Links: The Case For Japan - June 11, 2021 The Dollar Bull Case Will Soon Fade - March 5, 2021 On Japanese Inflation And The Yen - January 29, 2021 British Pound Chart II-7GBP Technicals 1
GBP Technicals 1
GBP Technicals 1
Chart II-8GBP Technicals 2
GBP Technicals 2
GBP Technicals 2
The key data release out of the UK this week was the inflation report: Headline CPI came in at 3.1% year-on-year in September, in line with expectations. Core CPI came in at 2.9% year-on-year in September, in line with expectations. RPI an PPI came in at 4.9% and 11.4% respectively. The pound rose by 0.3% this week. The UK is dealing with and energy and inflation crisis, similar to the rest of the world. This is bringing forward expectations of a rate hike by the BoE, which we believe would be the wrong approach should inflation subside. We are bullish sterling on a cyclical horizon, but are also long EUR/GBP tactically as a play on a policy convergence between the BoE and the ECB. Report Links: Why Are UK Interest Rates Still So Low? - March 10, 2021 Portfolio And Model Review - February 5, 2021 Thoughts On The British Pound - December 18, 2020 Australian Dollar Chart II-9AUD Technicals 1
AUD Technicals 1
AUD Technicals 1
Chart II-10AUD Technicals 2
AUD Technicals 2
AUD Technicals 2
The was scant data out of Australia this week: The services PMI rebounded strongly in September, from 45.5 to 52. The manufacturing PMI remained robust, rising from 56.8 to 57.3 in October. As a result, the composite PMI improved from 46 to 52.2. The AUD rose 0.6% this week. The AUD is sitting on a coiled spring and ripe for a rebound. First, the energy crisis is bullish for Australia as it is one of the largest coal and natural gas exporters. Second the AUD is cheap, especially on a terms of trade basis. At the crosses, we are long AUD/NZD as a play on these trends. Report Links: The Dollar Bull Case Will Soon Fade - March 5, 2021 Portfolio And Model Review - February 5, 2021 Australia: Regime Change For Bond Yields & The Currency? - January 20, 2021 New Zealand Dollar Chart II-11NZD Technicals 1
NZD Technicals 1
NZD Technicals 1
Chart II-12NZD Technicals 2
NZD Technicals 2
NZD Technicals 2
The was scant data out of New Zealand this week: CPI exploded higher, rising 4.9% in the third quarter. Credit card spending was down 12.9% year-on-year in September. The NZD rose by 1.2% week. The inflation report out of New Zealand unsettled markets, pushing up bond yields significantly and propping the currency. Given the RBNZ has a mandate to consider house prices in policy settings, this has led to bets of more aggressive policy tightening in New Zealand. We continue to believe the NZD will fare well cyclically, but hawkish expectations from the RBNZ are already priced. This provides room for disappointment. We are long AUD/NZD on this basis. Report Links: How High Can The Kiwi Rise? - April 30, 2021 Portfolio And Model Review - February 5, 2021 Currencies And The Value-Versus-Growth Debate - July 10, 2020 Canadian Dollar Chart II-13CAD Technicals 1
CAD Technicals 1
CAD Technicals 1
Chart II-14CAD Technicals 2
CAD Technicals 2
CAD Technicals 2
Data out of Canada this week has been robust: The CPI report was buoyant. Headline came in a 4.4%, core-trim came in at 3.4%, core-median was 2.8% and core-common was 1.8% year-on-year. Foreigners continue to favor Canadian securities. Inflows for August rose to C$26.3bn, well above a prior print of C$14.2bn. The Business outlook survey from the Bank of Canada was robust in the third quarter, but thew future sales outlook did fall from 47 to 9, a sharp deterioration. The CAD was flat this week. On a cyclical basis, the CAD is backed by robust oil prices, and orthodox central bank that will raise rates to curb high inflation and real estate speculation, and an economy that remains on a recovery path. As such, our bias is that the path of least resistance for the CAD is up. Report Links: Relative Growth, The Euro, And The Loonie - April 16, 2021 Will The Canadian Recovery Lead Or Lag The Global Cycle? - February 12, 2021 The Outlook For The Canadian Dollar - October 9, 2020 Swiss Franc Chart II-15CHF Technicals 1
CHF Technicals 1
CHF Technicals 1
Chart II-16CHF Technicals 2
CHF Technicals 2
CHF Technicals 2
The Swiss economy is on the mend: Total sight deposits were flat at CHF 714bn in the week ended October 15. Exports rose 0.4% month-on-month in September, while imports fell 0.8% month-on-month. The money supply rose 3.2% in September, in line with the August print. CHF rose by 0.5% this week. CHF remains a good hedged against rising currency volatility, which we believe will materialize on a cyclical horizon. That said, the swiss franc will lag the euro and other European currencies, if our view of a pickup in growth next year proves correct. Report Links: An Update On The Swiss Franc - April 9, 2021 Portfolio And Model Review - February 5, 2021 The Dollar Conundrum And Protection - November 6, 2020 Norwegian Krone Chart II-17NOK Technicals 1
NOK Technicals 1
NOK Technicals 1
Chart II-18NOK Technicals 2
NOK Technicals 2
NOK Technicals 2
There was scant data out of Norway this week: The trade balance improved from NOK 42.6bn to NOK 53.7bn in September. The NOK was up 0.7% this week. High oil prices are a boost for the NOK, especially with the opening of the energy pipeline with the UK. We also favor the NOK on valuation grounds. Stay short EUR/NOK and USD/NOK. Report Links: The Norwegian Method - June 4, 2021 Portfolio And Model Review - February 5, 2021 Revisiting Our High-Conviction Trades - September 11, 2020 Swedish Krona Chart II-19SEK Technicals 1
SEK Technicals 1
SEK Technicals 1
Chart II-20SEK Technicals 2
SEK Technicals 2
SEK Technicals 2
There was scant data out of Sweden this week: The unemployment rate fell from 8.5% to 8.2% in September. The SEK rose 15 bps this week. We are short both EUR/SEK and USD/SEK as reflation plays. The SEK will rise very quickly should the Chinese credit impulse bottom, a likely event in our view. Meanwhile, the central bank will end QE this year and could bring forward expectations of a rate hike. Report Links: Revisiting Our High-Conviction Trades - September 11, 2020 More On Competitive Devaluations, The CAD And The SEK - May 1, 2020 Sweden Beyond The Pandemic: Poised To Re-leverage - March 19, 2020 Trades & Forecasts Strategic View Cyclical Holdings (6-18 months) Tactical Holdings (0-6 months) Limit Orders Forecast Summary
BCA Research’s Commodity & Energy Strategy service lifted its expectation for 4Q21 Brent prices to $81/bbl, and its forecasts for 2022 and 2023 to $80.00/bbl and $81.00/bbl, up $5/bbl and $1/bbl, respectively. The short-term evolution of energy markets…
Who Likes A Flattening Yield Curve?
Who Likes A Flattening Yield Curve?
In a recent daily report, we analyzed relative performance of the S&P 500 sectors and styles under different US 10-year Treasury yield (UST10Y) regimes. Today we expand our analysis and map relative performance of the S&P 500 sectors and styles under the distinct US Treasury yield curve regimes, defined as a three-months change between 10-year and 2-year yields. To analyze sector and style performance by regime, we calculate contemporaneous three-months relative returns of sectors and styles. To summarize the results, we calculate median relative return of each sector/style in each regime. We subtract total period median to remove the sector and style biases in the long-term performance. In a flattening yield curve environment, Defensives, Quality, and Growth tend to outperform, as it indicates scarcity of growth. Accordingly, Real Estate, Technology, Utilities, and Communications Services also outperform. Yield curve steepening is usually associated with growth acceleration. This regime gives boost to more economically sensitive and capex intensive sectors and styles: Value, Small caps, and Cyclicals. Bottom Line: The shape of the US Treasury yield curve will be an important variable to monitor going forward, as it has a substantial effect on relative sector and style performance.
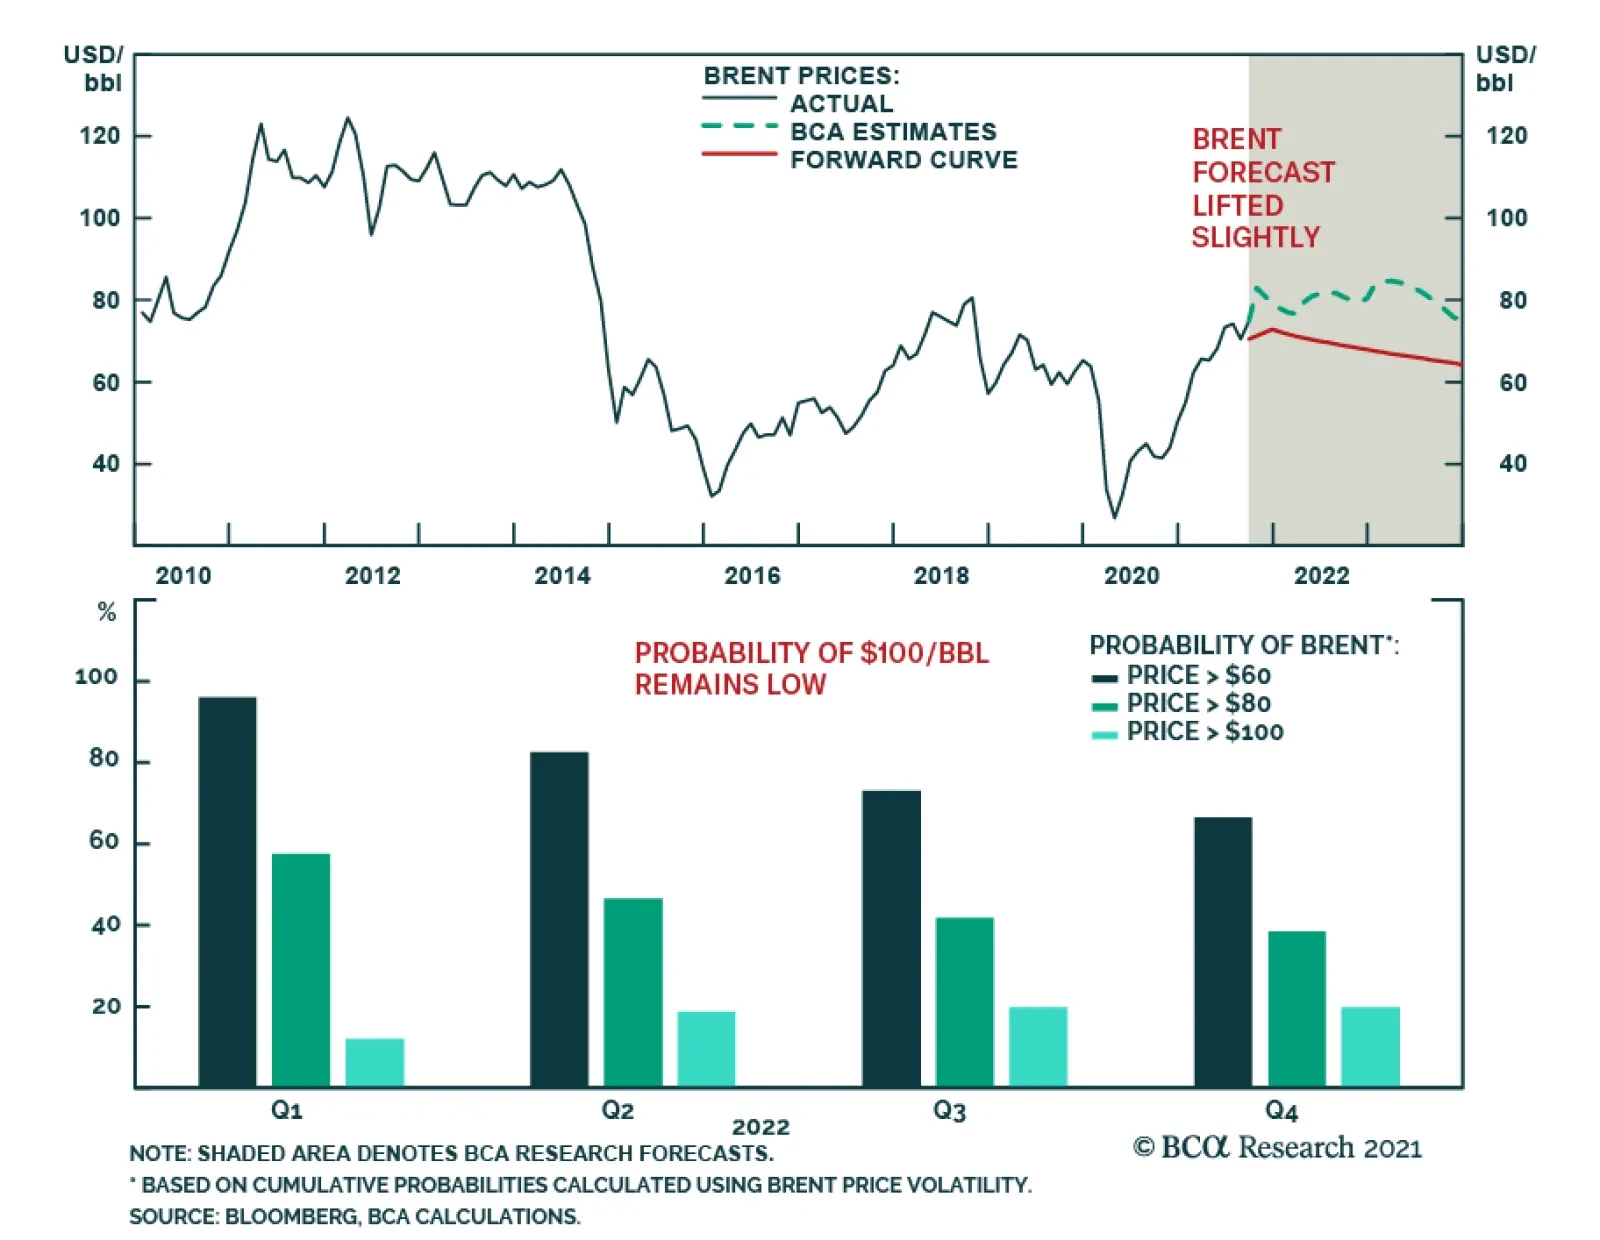
Highlights In our latest balances and forecast estimates, we are lifting our expectation for 4Q21 Brent prices to $81/bbl, and our forecasts for 2022 and 2023 to $80.00/bbl and $81.00/bbl, up $5/bbl and $1/bbl, respectively. Our revised balances reflect deeper physical deficits in the EIA's latest historical data, and higher short-term demand consistent with IEA's expected increase of 500k b/d. This largely is a knock-on effect of tight coal markets in Asia and globally tight natural gas markets. Over-compliance with production-cutting goals likely will force higher oil output from GCC producers to offset declining output from OPEC 2.0 states outside the Gulf. We expect output in the Lower 48 states of the US, which consists mostly of shale-oil production, to average 9.5mm b/d in 2022 and 10mm b/d in 2023, versus 2021 production levels of 9.0mm b/d. The odds of oil prices exceeding $100/bbl by the end of 1Q22 are 12.05%, based on price distributions embedded in market-cleared crude-oil options prices (Chart of the Week).1 At the margin, downside risk is increasing going into winter, due to slower economic growth brought on by tight coal and gas markets globally. Feature The short-term evolution of energy markets globally remains highly uncertain, mostly because it depends so much on the evolution of the Northern Hemisphere winter; policy actions to address tight coal and natural gas markets in Asia and Europe, and OPEC 2.0's reading of short- and medium-term demand. We are lifting our 4Q21 Brent price forecast to $81/bbl from $70.50/bbl, to reflect a marginal increase of 500k b/d in oil demand resulting from the knock-on effects of tighter coal and gas markets in Asia and Europe.2 For all of 2021, we are raising our expected global oil demand to 97.5mm b/d from 97.3mm b/d. Chart of the WeekProbability Of $100/bbl Remains Low
Short-Term Oil-Price Risk Moves To The Downside
Short-Term Oil-Price Risk Moves To The Downside
For 2022 and 2023, we expect slightly higher oil demand – 102mmb/d and 103.3mm b/d, respectively, most of which will come from DM economies at the margin (Chart 2). This lifts our Brent forecasts for next year to $80.00/bbl, and to $81/bbl in 2023 (Chart 3). We expect WTI to trade $2-$3/bbl below Brent. Chart 2Short-Term DM Demand Increases At The Margin
Short-Term DM Demand Increases At The Margin
Short-Term DM Demand Increases At The Margin
Chart 3Brent Forecast Lifted Slightly
Brent Forecast Lifted Slightly
Brent Forecast Lifted Slightly
The uncertainty around our price forecast remains elevated, given the knock-on effects of additional slowing of economic growth in Asia due to lower hydro power output because of drought, and tighter coal and gas markets, as inventories continue to be restocked ahead of the Northern Hemisphere winter.3 Tighter coal and natural gas markets in China and Europe already have led to shutdowns in industrial output particularly in China's and Europe's base metals markets. Countering this bearish impulse is our expectation the roll-out of mRNA-based COVID-19 vaccines will pick up momentum, as joint ventures with the developers of these technologies increase global distribution over the next couple of years.4 Oil Supply Side Remains Well Managed OPEC 2.0 – led by Saudi Arabia and Russia – has consistently managed the level of its production to keep it just below the level of demand for its crude. Producers outside this coalition – the price-taking cohort, in our phraseology – has been managing its output to maintain profitability, which means investor interests are paramount. Both have been responsive to actual demand. Neither is calibrating output to match expected demand. From the EIA’s most recent historical estimates of realized supply and demand, it appears production from both OPEC 2.0 and the price-taking cohort was underestimated in 2H21, or the data-gathering-and-reporting agencies undercounted barrels (Chart 4). This can be seen in the larger physical deficits – i.e., demand in excess of supply – relative to last month's historical estimates, and in the sharply lower OECD inventories (Chart 5). In this month’s modeling, we tweaked OPEC 2.0 supply estimates to reflect the recent high compliance rate of the OPEC 2.0 coalition. According to Reuters, low oil investment in suppliers – chiefly Nigeria, Angola and Kazakhstan – was the primary reason the coalition has been unable to bring all of its agreed-to additional monthly supply increase of 400k b/d to the market.5 This undersupply is expected to continue until the end of 2021 in our models. Chart 4Higher 2H21 Physical Deficits Reported
Higher 2H21 Physical Deficits Reported
Higher 2H21 Physical Deficits Reported
Chart 5OECD Inventories Remain Key OPEC 2.0 Metric
OECD Inventories Remain Key OPEC 2.0 Metric
OECD Inventories Remain Key OPEC 2.0 Metric
We also modified our forecasts for Iranian production to reflect our Geopolitical Strategy colleagues’ belief that a deal between the US and Iran is likely.6 We project Iranian oil supply will reach 2.9 mmb/d by end of Q1 2022, and 3.7 mmb/d by the end of 2022. OPEC's most recent monthly supply-demand estimates caution higher electricity prices due to the coal and natgas shortages in Asia and Europe could lead to lower demand over the winter months. This already is apparent in China and Europe, where heavy electricity users – steel mills and zinc smelters, e.g., – are being forced to shut down production as electricity is rationed. Should this persist – and result in lower oil demand – OPEC 2.0 output could contract. However, with inventories drawing sharply in the OECD, we expect the producer coalition will err on the side of higher output if Brent prices surge to $90/bbl or more this winter. OPEC 2.0 member states do not gain any long-term advantage from higher oil prices when demand globally is contracting and EM economies – the growth engine of global oil markets – are still trying to recover from the COVID-19 pandemic. The price-taking cohort – exemplified by the US shale-oil producers – cannot ramp production quickly enough to fill a physical supply deficit over the course of the winter. We estimate it takes ~ 8 months to assemble rigs and crews, drill pads in the shales, and hook gathering lines up to main lines to move oil to refining centers. Given the level of prices and the shape of the forward curve, we expect US production in the Lower 48 states, which is mostly accounted for by shale-oil production, to average 9.5mm b/d in 2022 and 9.9mm b/d in 2023 (Chart 6). While production in the Permian basin continues to rise, it will not grow quickly enough to address a tightening in global oil markets in the short run (Chart 7). Chart 6Higher US Shale Output Expected
Higher US Shale Output Expected
Higher US Shale Output Expected
Chart 7US Shales Cannot Cover Deficit
Short-Term Oil-Price Risk Moves To The Downside
Short-Term Oil-Price Risk Moves To The Downside
Investment Implications The evolution of global energy markets remains highly uncertain. Markets likely will not be able to form solid expectations until after the New Year begins, owing to weather uncertainty. There are reports already that winter has started early in northern China, but this does not necessarily presage colder-than-normal weather globally for the entire winter.7 We expect markets to remain balanced and for OPEC 2.0 in particular to manage its output in line with actual demand (Table 1). Our intellectual framework for assessing OPEC 2.0's production strategy is grounded in the view the coalition does not want to see oil prices much higher than current levels, given the fragility of the global economic recovery, particularly in EM economies. Table 1BCA Global Oil Supply - Demand Balances (MMb/d, Base Case Balances) To Dec23
Short-Term Oil-Price Risk Moves To The Downside
Short-Term Oil-Price Risk Moves To The Downside
We remain long commodity index exposure going into winter, in the expectation colder-than-normal weather will keep energy prices well bid, and oil and natural gas forward curves backwardated. We continue to monitor weather expectations Robert P. Ryan Chief Commodity & Energy Strategist rryan@bcaresearch.com Commodities Round-Up Energy: Bullish The EIA expects US households using natural gas will pay just under $750 to heat their homes on average this winter, a 30% increase over last year's level. This is the result of higher prices vs last year, and higher consumption estimates by the EIA, given its weather expectation. This past week, the US Climate Prediction Center raised the odds of a second La Niña to 87%, from it earlier 70-80% expectation. This raises the likelihood of a colder-than-normal winter in the Northern Hemisphere. US natural gas inventories are expected to end the April-October injection season at 3.6 TCF, in the EIA's latest estimate, which will put stocks ~ 5% below the 2016-2020 five-year average. US LNG exports are expected to average 10.7 BCF/d over the Oct21-Mar22 period, which would be a record. Higher prices in Asia and Europe due to stronger demand are pulling US natgas prices higher via exports (Chart 8). Base Metals: Bullish Spot copper traded in excess of $1,100/MT over 3-month forward LME futures this week, as traders globally scramble for product ahead of possible power rationing at copper-refining facilities in China this winter.8 Prices abruptly fell more than 7% from there, following a press report the Chinese government would directly intervene in coal markets to lower prices. Coal and natural gas shortages going into the winter are forcing smelters to shut production in China and Europe. Separately, China reportedly ordered 70% (35/50) of its magnesium smelters to close until year-end, to conserve fuel. Magnesium is critical to producing aluminum sheet and billets. The knock-on effects from lower aluminum supplies could be especially harsh for automobile manufacturers, which have been increasing their use of aluminum. Precious Metals: Bullish Gold was unable to hold last week’s gains as US Treasury yields and the dollar rallied towards the end of the week. The expected normalization of the US Fed’s monetary policy will be bullish for the USD and will push treasury yields higher, which will act as headwinds to gold. We continue to expect a weaker dollar, in line with the view of our colleagues at BCA’s Foreign Exchange Strategy (Chart 9). Chart 8
Short-Term Oil-Price Risk Moves To The Downside
Short-Term Oil-Price Risk Moves To The Downside
Chart 9Gold Prices Going Down Along With USD
Gold Prices Going Down Along With USD
Gold Prices Going Down Along With USD
Footnotes 1 Please see Appendix II beginning on p. 22 in Ryan, Bob and Tancred Lidderdale (2009), "Energy Price Volatility and Forecast Uncertainty," Short-Term Energy Outlook Supplement, US EIA. 2 The 500k b/d estimate is consistent with the IEA's October 2021 Oil Market Report. We are loading most of the 500k b/d increase in demand on OECD consumption, given its dual-fired oil and gas generation capacity. Please see Inflation Surges, Slows, Then Grinds Higher and La Niña And The Energy Transition, for additional discussion. 3 The US Climate Prediction Center raised the odds of a La Niña winter in the Northern Hemisphere persisting from Dec21 – Feb22 to 87% this week. While this increases the odds of a colder-than-normal winter in the hemisphere it is not absolutely certain. That said, prudence will push governments and firms to fill inventories and increase coal and gas production ahead of winter. 4 Please see Upside Price Risk Rises For Crude, published on September 16, 2021 for discussion of the global mRNA vaccine rollout. 5 Please see As OPEC reopens the taps, African giants losing race to pump more, published by Reuters on September 27, 2021; Please also refer to OPEC+ struggles to pump more oil to meet rising demand, published by Reuters on September 21, 2021. 6 Please see Third Quarter Outlook 2021: The Pivot To Asia Runs Through Iran, published by BCA’s Geopolitical Strategy on June 25, 2021. 7 Please see Early start to China's winter heating season bullish for gas, coal demand published by S&P Global Platts on October 19, 2021. 8 Please see LME 0-3 Copper Backwardation Surged to above $1,000/mt on Oct 19 published by metal.com on October 20, 2021. Investment Views and Themes Strategic Recommendations
Dear Client, There will be no weekly report next week. Instead, we will host our quarterly webcast on Tuesday, October 26 for the US and EMEA regions and Wednesday, October 27 for the Asia Pacific region. We will resume our regular publishing schedule on Monday, November 1. In the meantime, we look forward to seeing many of you at our BCA Research Investment Conference this week. Best regards, Mathieu Savary Highlights This year’s decline in EUR/USD has rendered this pair sufficiently inexpensive and oversold to account for the near-term risks we highlighted in March. Nonetheless, some risks remain—among them, the continued credit slowdown in China, diverging monetary policy trends, and the energy crisis hurting Europe. However, long-term fundamentals continue to support the euro’s 12- to 18-month outlook. Moreover, Chinese credit growth may soon stabilize and markets already largely factor in the policy divergence between the Fed and the ECB. As a result, we buy the euro today with a preliminary target at 1.25 and a stop loss at 1.1175. The Bank of England will lift rates this December, but the market already prices in a hawkish BoE. GBP/USD has upside, even if the euro should outpace the pound in the coming months. Look to upgrade UK small-cap stocks. Italian equities do not appear particularly appealing on a cyclical horizon, neither in absolute nor relative terms. Investors should favor Spanish stocks over Italian ones for the next 12-to-18 months. Feature EUR/USD recently flirted with 1.15. Did this move create a buying opportunity? Last March, we warned that the euro would correct to the 1.12 to 1.15 zone because short-term models flagged it as expensive, speculators carried a substantial net-long exposure, and Chinese credit growth was set to slow meaningfully. These forces have now mostly played out; thus, the euro’s near-term outlook is becoming more positive. Despite this more constructive view, EUR/USD still carries ample downside risks, especially if Chinese authorities remain reluctant to reflate their economy. Moreover, the energy crisis facing Europe clouds the euro. We are nonetheless buyers of EUR/USD, with a target at 1.25. Investors should set a wide stop in at 1.1175. Cheap And Oversold The internal dynamics of the euro indicate that the bulk of the sell-off is behind us. First, the euro is now cheap on a tactical basis. Back in March, our short-term fair value model for EUR/USD flagged at 7% overvaluation based on real rate differentials, on the slope of the German yield curve relative to that of the US, and on the copper-to-lumber prices ratio. Today, this same measure shows a 5% undervaluation. BCA’s Foreign Exchange Strategy Intermediate Term Timing Model (ITTM) flags an even clearer buy signal. The ITTM framework combines interest rate parity models, with risk aversion and considerations for the currency’s trend. Currently, this model is at -8% or nearly minus one standard error. Historically, such a depressed reading points to generous returns in the subsequent 12 months (Chart 1). Second, the euro is oversold. BCA’s Intermediate Term Technical Indicator has hit 7, which is consistent with past rebounds in EUR/USD (Chart 2). While some of these rallies have been extremely short-lived, the technical indicator’s message is stronger when it is matched by a buy signal from the ITTM. Chart 1Strong Buy Signal From Short-Term Valuations
Strong Buy Signal From Short-Term Valuations
Strong Buy Signal From Short-Term Valuations
Chart 2EUR/USD is Oversold
EUR/USD is Oversold
EUR/USD is Oversold
Chart 3Stale Euro Longs Have Been Purged
Stale Euro Longs Have Been Purged
Stale Euro Longs Have Been Purged
Third, speculators do not carry a large net long position in the euro anymore. This variable suggests that the worst of the selling pressure is behind us, but it has yet to send a strong buy signal on its own (Chart 3). Bottom Line: The euro is sufficiently inexpensive that our Intermediate-term timing model flags a strong buy signal. Moreover, our technical indicators paint an oversold picture consistent with a reversal. Nonetheless, speculators may not be long EUR/USD anymore, but they are not aggressively selling it either. Thus, macro dynamics remain important to the future trend of this currency. Macro Fog Remains The macro environment is not yet conducive to a euro rally, especially when Chinese credit growth remains weak. However, considering the euro’s valuation and technical picture, small changes in the macro environment could be enough to catalyze a jump in EUR/USD. A key problem for the euro is that the dollar remains well bid. The yen and the dollar are the two momentum currencies within the G-10 (Chart 4). This property of the dollar is a large handicap for the euro, because it remains the most liquid vehicle to bet on the USD. Thus, as long as the dollar’s momentum is strong, the euro will find it difficult to rally. Relative economic growth is another headwind for EUR/USD. European activity is weakening versus that of the US. Since 2019, the relative manufacturing PMIs between the Euro Area and the US track EUR/USD, and they currently confirm the euro’s weakness (Chart 5). Moreover, European economic surprises are significantly weaker than US ones, which adds to the euro’s malaise (Chart 5, bottom panel). Chart 4The Dollar Is A Momentum Currency
Time For The Euro To Shine?
Time For The Euro To Shine?
Chart 5Deteriorating European Growth Hurts EUR/USD
Deteriorating European Growth Hurts EUR/USD
Deteriorating European Growth Hurts EUR/USD
The near-term outlook does not signal a resolution of this issue until the first half of 2022. The declines in the expectation and current situation components of both the ZEW and Sentix surveys herald an additional deceleration in manufacturing activity (Chart 6). The Eurozone’s growth problems reflect China’s slowing credit flows. Europe economic activity is still extremely sensitive to the evolution of the global industrial cycle (Chart 7, top panel), much more so than the US GDP is. China’s business cycle is an essential determinant of the robustness of the global manufacturing sector. Consequently, when measures of China’s marginal propensity to consume decelerate, such as the gap between M1 and M2 growth, European PMIs and industrial production underperform those of the US (Chart 7, second and bottom panels). Chart 6A Bit More Time Before Europe's Slowdown Ends
A Bit More Time Before Europe's Slowdown Ends
A Bit More Time Before Europe's Slowdown Ends
Chart 7China's Travails Hurt Europe
China's Travails Hurt Europe
China's Travails Hurt Europe
The fourth quarter of 2021 is likely to represent the tail end of the Chinese headwind on EUR/USD. The Chinese credit impulse remains weak, but signs of a floor are beginning to appear. For example, the decline in Chinese commercial banks excess reserve growth warned us of the coming decline in the credit impulse. Today, excess reserves have begun to stabilize, which points to an upcoming imporvement in credit flows (Chart 8). Additionally, the Evergrande problems continue to weigh on Europe in the near-term because of the deceleration in Chinese construction activity; however, the crisis will also intensify the pressure on Beijing to revive credit growth in order to avoid a systemic collapse. Chart 8Will China's Credit Impulse Bottom Soon?
Will China's Credit Impulse Bottom Soon?
Will China's Credit Impulse Bottom Soon?
Monetary policy differentials also remain euro bearish. The US Federal Reserve will announce the start of its tapering program on November 3. The FOMC is set to hike rates by the end of 2022. Meanwhile, the ECB is unphased by the increase in European inflation, which remains mostly a reflection of energy prices and base effects. Thus, Europe will lag behind the US when it comes to monetary policy tightening. Nonetheless, investors already understand this dichotomy very well. The US OIS curve anticipates four hikes in 2023. Meanwhile, the EONIA curve shows a first 25-bps hike only by September 2023. Thus, the euro will suffer more from policy differentials if the Fed generates hawkish surprises relative to this pricing. The energy crisis shaking Europe is the last major headwind currently affecting the euro. Historically, EUR/USD and the ratio of European to US natural gas prices track each other (Chart 9). This relationship reflects relative growth dynamics. A stronger Eurozone economy relative to the US pushes up the value of the euro and European natural gas, which is a commodity with heavy industrial usage. However, since this summer, the spike in European natural gas prices has coincided with a decline in the euro. This divergence highlights the negative effect on European activity of the current energy shock, which raises fears of stagflation. The cross-Atlantic bond market dynamics confirm the notion that the energy shock increases the perceived stagflation risk in the Eurozone. German yields have risen relative to US ones because of a pick-up in inflation expectations, not real rates (Chart 10). The lack of traction for relative real rates is appropriate because market participants believe that the ECB wants to ignore the spike in energy prices. An environment of rising relative inflation expectations but stable relative real rates is very negative for any currency, including the euro. However, European inflation expectations should decrease relative to those of the US once European natural gas prices normalize, which we expect to take place in the coming months (Chart 10, bottom panel). This process will be very positive for the euro. Chart 9The European Energy Crisis Harms The Euro
The European Energy Crisis Harms The Euro
The European Energy Crisis Harms The Euro
Chart 10Pricing In European Stagflation?
Pricing In European Stagflation?
Pricing In European Stagflation?
Bottom Line: While euro pricing and technicals suggest EUR/USD will bottom soon, the economic environment is murkier. The dollar is a momentum currency, and its current strength feeds the euro’s weakness. China’s credit flows continue to decelerate, which hurts the euro; however, credit flows may stabilize in early 2022. The Fed is a tailwind for the dollar, but markets already price in this reality. Finally, the energy crisis hurts European growth and thus EUR/USD; nonetheless, the spike in natural gas prices will soon give way to a period of decline, which will lessen the pain for the euro. What To Do? When we balance the positives and negative for the euro, we are becoming more comfortable with buying EUR/USD outright, even if it is still a risky bet. To begin with, the big fundamental forces point to a firmer euro on an 18- to 24-month basis: BCA’s Foreign Exchange strategists see greater cyclical downside for the USD and believe the current rebound is a pronounced countertrend move within a multi-year dollar bear market. The euro will naturally benefit over the coming years from a weak greenback. EUR/USD is still inexpensive on long-term valuation metrics. Based on BCA’s purchasing power parity model, this pair trades 17% below its fair value. Moreover, the PPP estimate keeps rising in favor of the euro, a result of the Eurozone’s lower inflation compared to the US (Chart 11). The relative balance of payments favors the euro. The European economy generates a current account surplus of 3% of GDP compared to a current account deficit of 3.1% for the US. The US current account deficit is unlikely to narrow, even if the federal government’s budget hole declines because the private sector’s savings rate is falling even faster. Moreover, US real two-year rates remain well below those of its trading partners. Investors underweight Eurozone assets aggressively. For the past ten years, capital has consistently flowed out of the Euro Area relative to the US (Chart 12). European growth should converge toward the US next year, especially if Chinese credit activity stabilizes. Therefore, 2022 should witness a period of inflows into the Eurozone. Chart 11EUR/USD Significant Long-Term Discount
EUR/USD Significant Long-Term Discount
EUR/USD Significant Long-Term Discount
Chart 12Investors Underweight Eurozone Assets
Investors Underweight Eurozone Assets
Investors Underweight Eurozone Assets
We argued that the valuation and technical backdrop shows the Euro is becoming increasingly supportive and our timing model is clearly arguing against selling EUR/USD. However, the biggest technical risk is the momentum sensitivity of the dollar, which means that the euro’s weakness could last somewhat longer. Nevertheless, BCA’s Dollar Capitulation Index now warns of a pullback in the USD, especially as speculators are very long DXY futures (Chart 13). The biggest downside risk remains China’s credit trend. If it takes more time than we anticipate for Beijing to put an end to the credit impulse slowdown, the euro will experience greater downside pressure. Moreover, the longer it takes Beijing to reflate, the greater the chance of an uncontrolled selloff in the CNY, which would drag down the euro (Chart 14). Chart 13Is The Dollar Technically Vulnerable?
Is The Dollar Technically Vulnerable?
Is The Dollar Technically Vulnerable?
Chart 14China Remains The Euro's Main Risk
China Remains The Euro's Main Risk
China Remains The Euro's Main Risk
Despite this level of near-term uncertainty, we recommend investors buy the euro, with a target at 1.25, and a stop loss at 1.1175. Bottom Line: Conditions are falling in place for the countertrend decline in the euro to end soon. As a result, the euro should converge back toward the upward path driven by fundamentals. The greatest near-term risk remains the path of Chinese credit trends. We recommend investors buy the euro with a preliminary target at EUR1.25 and a stop loss at 1.1175. Country Focus: A Well Discounted BoE Hike The Bank of England will begin to increase interest rates at its December meeting. The BoE’s communication has been clear that it does not see a need to wait between the end of its tapering program in December and the beginning of its hiking campaign. Recent comments by senior MPC members, including new Chief Economist Huw Pill, also suggest a rate hike is looming. Chart 15The BoE's Inflation Problem
The BoE's Inflation Problem
The BoE's Inflation Problem
We see little reason to doubt the willingness of the MPC to start lifting the Bank Rate. UK Core CPI stands at 3.1% or 110 basis points above the BoE’s inflation target. Moreover, both market-based and survey-based long-term inflation expectations are well above 3.5%, which increases the risk of a dangerous dis-anchoring of UK inflation (Chart 15). UK economic activity remains inflationary. Wages are strong, climbing 7.2% in August. This number probably exaggerates the underlying wage growth due to compositional effects, but job creation remains robust and the unemployment rate fell to 5.2%. The BoE was concerned that the end of the furlough scheme last month would cause a jump in unemployment, but their fears have dwindled, because job vacancies stand at a record high and capex intentions are solid (Chart 16). The housing market continues to be a tailwind to growth. House prices are up 10% annually, which lifts household net worth considerably (Chart 17). The pace of transactions in the real estate market will slow this spring because the stamp duty holiday will end; however, low mortgage rates and expectations of further housing gains may fuel greater appreciation. This creates long-term financial stability risks for the UK because household leverage will rise. This worries the BoE. Chart 16The UK's Labor Market Strength Will Continue
The UK's Labor Market Strength Will Continue
The UK's Labor Market Strength Will Continue
Chart 17Rising Household Net Worth
Rising Household Net Worth
Rising Household Net Worth
Market participants already expect a hawkish BoE. A rate hike is priced in for December and the SONIA curve embeds almost two more increases in 2022. The 4.3% underperformance of the UK government bond index over the global benchmark in seven weeks also underscores the rapid adjustment in investors’ perceptions of the UK policy path. BCA’s Global Fixed-Income strategists have underweighted UK government bonds for two months, and they maintain a negative view over the coming quarters. Nonetheless, the risk of a short-lived countertrend rebound in UK bonds’ relative performance is significant. However, it would be a temporary position squaring, while hedge funds and CTAs take profits. BCA’s Foreign Exchange strategists expect GBP/USD to rebound. Cable is oversold and trades at a 12% discount to BCA’s PPP fair-value estimate. GBP/USD is also hurt by fears that the BoE hikes will damage the UK economy. From a contrarian perspective, this creates a positive entry point to buy cable, especially because the pound should benefit from the anticipated dollar weakness and the euro’s upcoming rally. However, BCA’s FX strategists also foresee some decline in the pound versus the euro, because GBP is a low beta play on EUR/USD. Hence, the trade-weighted pound could remain flat to slightly down in the coming months. We stay neutral on UK small-cap stocks relative to large-cap equities, but we are putting them on an upgrade alert. Small-cap stocks benefit from the strength in the domestic economy; however, they are also extremely expensive compared to large-cap ones (Chart 18). The arbiter of performance will be profits. The forward EPS of small-caps have lagged behind those of large-caps by 9% since the COVID recession, after underperforming since 2016 (Chart 19). Small-caps’ relative profits are currently trying to stabilize, but the durability of this trend will be tested if the trade-weighted pound remains flat in the coming months. Thus, the EPS of small-cap shares must regain more ground before moving more aggressively in this market. Chart 18UK Small Cap Are Pricey
UK Small Cap Are Pricey
UK Small Cap Are Pricey
Chart 19Follow The Profits
Follow The Profits
Follow The Profits
Bottom Line: On the back of a strong UK economy and significant inflationary forces, the BoE will start elevating interest rates this December. The market already prices in this outcome. Nonetheless, UK bonds should continue to underperform the global benchmark, and cable has upside, even if the near-term outlook favors the EUR over the GBP. We are putting UK small-cap stocks on a buy alert. They are expensive, but a turnaround in profits would solve this problem. Market Focus: A Quick Take On Italian Equities The Italian equity market remains Europe’s problem child. The Italian MSCI index has underperformed the rest of the Euro Area by 40% since 2010. This underperformance holds even after adjusting for sectoral differences, although it becomes less dramatic (Chart 20, top panel). Despite this underperformance, Italian equities have managed to outperform their Spanish counterparts by 27% since 2010, but this outperformance dissipates once sectoral difference are accounted for (Chart 20, bottom panel). The RoE of Italian non-financial listed equities is equivalent to the rest of the Eurozone, but it only reflects elevated financial leverage, as is the case in Spain (Chart 21). Italy’s RoA is poor, because Italy’s excess capital stocks hurts its return on capital. As a result, Italian equities continue to face a structural handicap. Chart 20A Problem Child
A Problem Child
A Problem Child
Chart 21Italy's Return On Asset Is Poor
Italy's Return On Asset Is Poor
Italy's Return On Asset Is Poor
The good run in Italian equities in absolute terms faces headwinds. Italian stocks are very sensitive to the global business cycle; however, they often respond with a delay and in an exaggerated fashion to decelerations in the global PMI (Chart 22, top panel). Moreover, since 2010, widening European high-yield corporate bond spreads have preceded falling Italian stock prices. Thus, the recent slide in the global PMI and the widening in European high-yield OAS create a period of vulnerability for Italian equities. Finally, Italian share prices have overshot the path implied by US yields (Chart 22, bottom panel). Nonetheless, Italian stocks may be sniffing out further increases in global yields. The cleanest way to play these vulnerabilities in the Italian is via a short bet against Spain. A steeper global yield curve will help both markets due to their heavy exposure to financials. However, we still favor Spanish financials, which benefit from higher RoEs than their Italian counterparts (Chart 23) and lower NPLs. As a result, the forward EPS of Spanish financials should begin to outperform those of Italian financials. Chart 22Some Risks To Italian Stocks
Some Risks To Italian Stocks
Some Risks To Italian Stocks
Chart 23Spanish Banks Are Better Placed To Benefit From Rising Global Yields
Spanish Banks Are Better Placed To Benefit From Rising Global Yields
Spanish Banks Are Better Placed To Benefit From Rising Global Yields
Mathieu Savary, Chief European Strategist Mathieu@bcaresearch.com Jeremie Peloso, Associate Editor JeremieP@bcaresearch.com Tactical Recommendations
Time For The Euro To Shine?
Time For The Euro To Shine?
Cyclical Recommendations
Time For The Euro To Shine?
Time For The Euro To Shine?
Structural Recommendations
Time For The Euro To Shine?
Time For The Euro To Shine?
Closed Trades
Time For The Euro To Shine?
Time For The Euro To Shine?
Currency Performance Fixed Income Performance Equity Performance
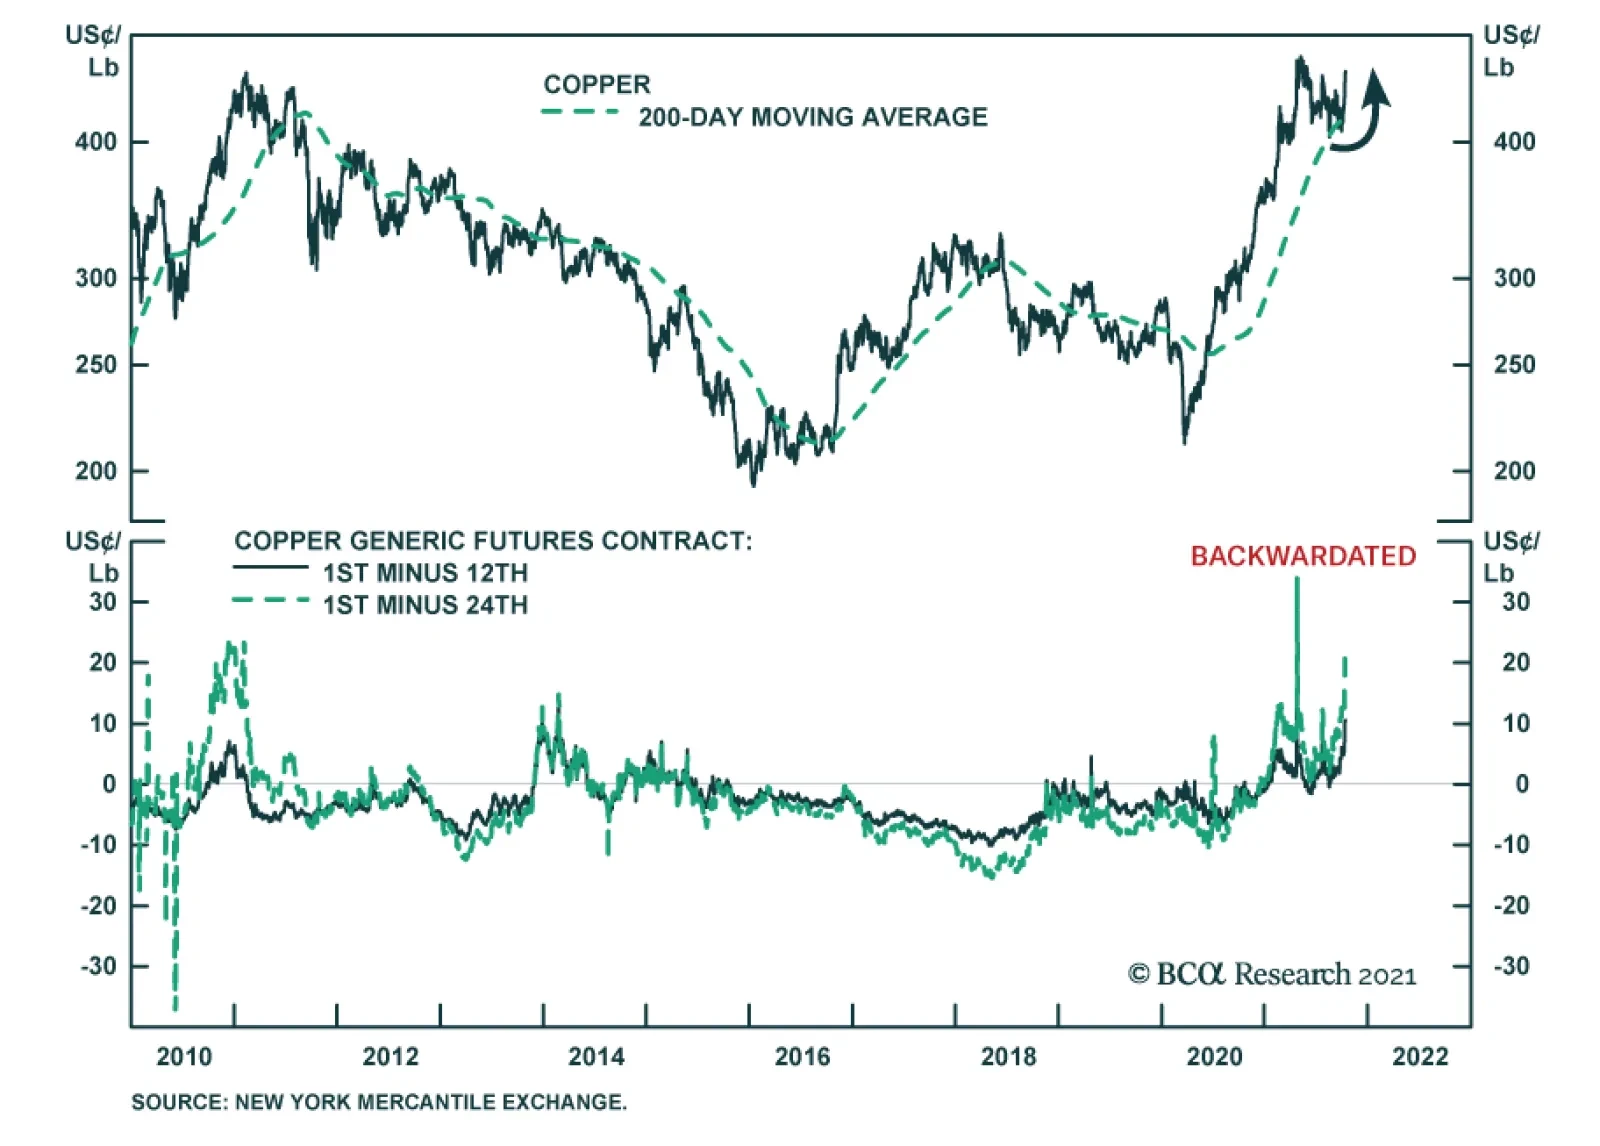
Copper prices are once again on the rise. After peaking in May, the red metal failed to break below its 200-day moving average and is up 13% so far in October. There is scope for copper prices to continue rising. In the recently released 2021/2022 Copper…