Communications Equipment

Today’s AI craze bears some resemblance to the late-1990s dotcom boom. We highlight three lessons from that period which are relevant today. Lesson #1: Productivity gains from the rollout of a new technology can take time to accrue. The dotcom…
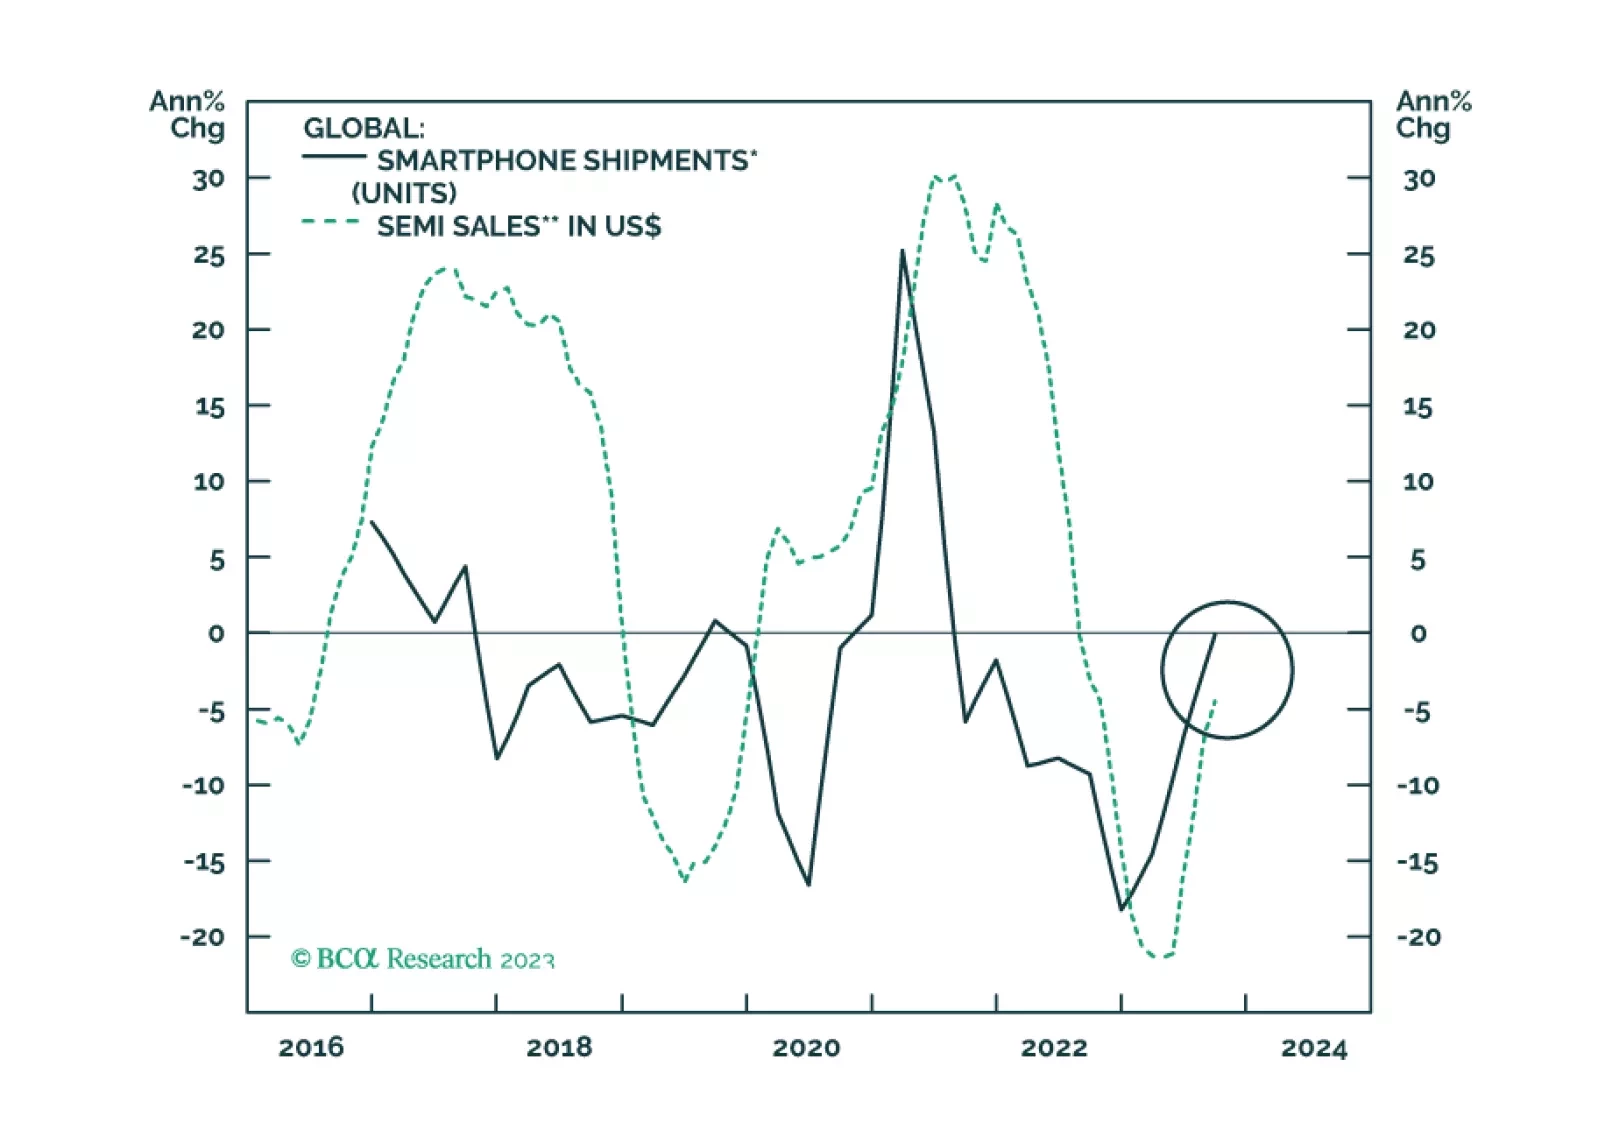
Global smartphone demand will likely find a bottom in 2024Q1 and rebound modestly between 2024Q2 and Q4. Competition in the global smartphone market will intensify. Chinese phone makers will gain market share from Apple and Samsung. Continue overweighting Taiwanese stocks, including tech, within the global equity benchmark.

Generative AI is a major technological breakthrough that holds tremendous economic and investment promise and will have sweeping effects on wide swaths of the economy. We are bullish on generative AI as a long-term investment theme. However, at the moment we observe hallmarks of an investment frenzy. We believe that there will be a more attractive entry point for patient investors.
Underweight Our underweight in the S&P communications equipment index is slightly in the green, and today we reiterate our below benchmark allocation in this niche tech sub-sector. The key reason for concern is industry pricing power. While the US economy is inflating on nearly every metric, communications equipment manufacturers are struggling to keep up, and their relative pricing power is sinking like a stone (second panel). In fact, year-over-year (y/y) growth for CSCO’s enterprise orders is at the 0% mark. Keep in mind that Q1/2020 is the earliest quarter that the pandemic started to wreak havoc, yet CSCO couldn’t even show a positive y/y number, despite soaring CEO capex intensions (bottom panel)! Thus, we view this tech sub-group as a value trap rather than an opportunity and we think there are valid reasons why the market is currently valuing this index at a 20% discount to the broad market on a forward P/E basis to the broad market (third panel). Bottom Line: We reiterate our underweight stance in the S&P communications equipment index. The ticker symbols for the stocks in this index are: BLBG: S5COMM – CSCO, JNPR, MSI, ANET, FFIV.
BCA Research's US Equity Strategy service remains underweight the S&P communications equipment index Our S&P communications equipment index underweight stance is paying dividends, and ongoing capex-related woes signal that a breakdown is looming.…
Underweight Our S&P communications equipment index underweight stance is paying dividends, and ongoing capex-related woes signal that a breakdown is looming (top panel). US CEOs are still reluctant to spend on big ticket items, as highlighted by the most recent CEO Confidence Survey (bottom panel). Lackluster capex spending will remain a headwind for CSCO, which commands a 77% market cap weight in the index. True, the recent drubbing in the greenback should aid telecom equipment exports (second panel). However, the industry’s 40% foreign sales exposure is on par with the SPX, underscoring that a weaker dollar will fail to provide relative profit relief. In fact, our margin proxy has rolled over recently signaling that the sell side’s profit margin optimism is unwarranted (middle panel). All of this suggests that the industry’s 30% forward P/E discount to the broad market represents a value trap rather than an opportunity (fourth panel). As a reminder, our technology sector (currently neutral) strategy is to prefer “defensive” software and services stocks at the expense of hardware and equipment manufacturers. Bottom Line: We remain underweight the S&P communications equipment index. The ticker symbols for the stocks in this index are: BLBG – S5COMM – CSCO, JNPR, MSI, ANET, FFIV.
Underweight The S&P communications equipment index has given up its gains over the course of 2020. We remain bearish as the macro outlook still spells trouble and this positioning is in line with our newly formed view of preferring defensive tech (software & services) and avoiding aggressive tech (hardware & equipment). On the international front, “king dollar” has yet to fully filter through the system as foreign executives are reluctant to spend on big ticket items (CNY/USD shown advanced, top panel). On the domestic front, the industry has been aggressively ramping up headcount to the point that its wage bill is now expanding at the fastest pace this cycle. This rising labor cost backdrop will likely cap the share price ratio (wage bill shown inverted & advanced, middle panel) At the same time, CEOs are not ready to take the capex route as highlighted by the most recent CEO confidence survey (bottom panel). Importantly, the downtick in capex intentions came amidst a healthy rebound in almost every other “future conditions” sub-component of the survey. Bottom Line: Stay underweight the S&P communications equipment index. The ticker symbols for the stocks in this index are: BLBG – S5COMM – CSCO, JNPR, MSI, ANET, FFIV.
Underweight Bellwether CSCO’s latest guidance was weak and confirmed that the capex-laden S&P communications equipment tech sub-index is in for a rough ride. Worryingly, CSCO’s key enterprise segment has no pulse. Historically, this data series has been positively correlated with telecom carrier capital outlays and the current message is grim (second panel). Tack on the ongoing manufacturing recession with CEOs canceling/postponing capital spending plans and the outlook dims further for the revenue prospects of communications equipment vendors (third & bottom panels). Adding insult to injury, the US/China trade war is further complicating the picture as the ongoing tariffs have exacerbated the global growth slowdown, and global capex plans have come under intense scrutiny. Bottom Line: Continue to avoid the S&P communications equipment index. The ticker symbols for the stocks in this index are: BLBG – S5COMM – CSCO, JNPR, MSI, ANET, FFIV. Please refer to this Monday’s Weekly Report for more details.
The communications equipment rally stalled early in the summer and has since morphed into a bear market. The darkening profit outlook for this niche tech sub-group warrants remaining underweight. Bellwether CSCO’s latest guidance was weak and confirmed…
Dear Client, Instead of our regular weekly report next Monday, this Friday November 22, you will receive our flagship publication “The Bank Credit Analyst” with our annual investment outlook. Our regular publication service will resume on December 2 with our high-conviction calls for 2020. Kind regards, Anastasios Avgeriou Highlights Portfolio Strategy Weakening supply/demand dynamics, pricing pressures, macro headwinds and pricey valuations are all warning that REITs are headed south. Global capex blues and the ongoing manufacturing recession, the resilient US dollar and weak operating metrics all confirm that an underweight stance is still warranted in the S&P communications equipment index. Recent Changes There are no changes to our portfolio this week. Table 1 Feature The S&P 500 made fresh all-time highs again last week, as investors focused on hopes of a US/China trade deal and continued to ignore negative data/news at their own peril. Domestically, unemployment insurance claims jumped to the highest level since June, and none of the major market and industry groups showed a gain in output on a month-over-month basis in October according to the latest Fed industrial production release. Internationally, Korean exports remain in the doldrums, Chinese data releases were weak across the board, and the mighty US dollar is making multi-decade highs versus a slew of EM currencies. Chart 1Disquieting Gap All of this begs the question is global growth going to recover and aid the equity market grow into its lofty valuation? Our indicators suggest that a definitive earnings trough is now pushed out to Q2/2020. Thus, equity market caution is still warranted. Given all the recent equity market euphoria, we feel more and more like “the lone calf standing on the desolate, dangerous, wolf-patrolled prairie of contrary opinion” as – arguably the greatest trader of all time – Jesse Livermore mused roughly a century ago. Share buybacks have been a key pillar underpinning stocks since the GFC averaging roughly $500bn/annum since 2010. But, last year equity retirement jumped to nearly $1tn/annum. That is clearly unsustainable, warning that there is a disconnect between the S&P 500 and already steeply decelerating share buybacks. Our equity retirement estimate for next year is a return to the 10-year average, signaling that the market may hit a significant air pocket (top panel, Chart 1). Another perplexing recent phenomenon has been the lack of buying on margin that typically confirms SPX breakouts. While this episode may be similar to the 2015/16 episode, if margin debt does not recover soon it will exert downward pull on the broad market (bottom panel, Chart 1). Turning over to earnings, revenues, margins and the forward multiple is instructive. Turning over to earnings, revenues, margins and the forward multiple is instructive. Chart 2 highlights the S&P 500 earnings growth surprise factor. In more detail, this IBES/Refinitiv data show how accurate the sell side analysts’ 12-month forward EPS forecasts have been over time: a reading above zero implies the analyst community was too timid, while a fall below zero signals analysts were too optimistic. Chart 2Unhinged From The EPS Accuracy Signal Equity market momentum moves with the ebb and flow of this factor and given the still downbeat message both from our SPX profit model (please refer to our recent webcast slides) and our simple liquidity indicator (please see Chart 4 from last week’s publication), we doubt 10% profit growth is even plausible for 2020. On the margin front, all four key profit margin drivers are on the brink of turning from tailwinds to headwinds as we recently highlighted in our “Peak Margins?” Special Report. Revenue growth is also at risk of a standstill. Domestic producer prices are deflating, and the ISM prices paid index has been clobbered. German, Japanese, Korean and Chinese wholesale prices are contracting and the OECD’s composite PPI measure is also sinking, suggesting that final demand is anemic at best. Under such a dire global pricing backdrop, it will be challenging for SPX sales to sustain their positive momentum, especially if the greenback remains well bid (Chart 3). Chart 3Top Line Growth Troubles Forward multiples have slingshot higher despite a near 40bps increase in the 10-year yield since Labor Day. When the discount rate rises the multiple should come in and vice versa. Thus, we would lean against the recent spike in the S&P 500 forward P/E (10-year yield shown inverted, Chart 4). This week we are updating our negative views on a niche high-yielding sector and a tech subgroup. Finally, while sifting through market internals, we recently stumbled upon the GICS2 S&P consumer services index. Digging deeper into services was revealing. This relative share price ratio has gapped down of late. One of the reasons is that the services component of the personal consumption expenditure (PCE) data is decelerating (PCE services shown advanced, middle panel, Chart 5). The ISM non-manufacturing survey is also an excellent leading indicator of the S&P consumer services index, and warns that things will likely get worse before they get better (bottom panel, Chart 5). Chart 4Lofty Valuations Chart 5Market Internals Signal: Sit This One Out This week we are updating our negative views on a niche high-yielding sector and a tech subgroup. Getting Real With Real Estate We would refrain from chasing high yielding real estate stocks higher, and would rather avoid them altogether at the current juncture. Similar to utilities, REITs have come to the forefront lately as they have populated the top return sector ranks. However, real estate stocks, which have split out of the financials sector, are a niche GICS1 sector with a mere 3% market capitalization weight in the SPX, and have not driven the S&P 500 to all-time highs. Instead, tech stocks have, owing to their 23% market capitalization weight, as we have shown in recent research.1 Importantly, several key factors continue to signal that investors should shed public market real estate exposure. Namely, weakening supply/demand dynamics, pricing pressures, macro headwinds and still pricey valuations (primarily rock bottom cap rates) are all firing warning shots. The commercial real estate (CRE) sector is a bubble candidate that exemplifies this cycle’s excesses. As we have highlighted in the past, CRE prices sit at roughly two standard deviations above both the historical time trend and the previous cycle’s peak (not shown).2 Worryingly, CRE demand is waning. Not only our proprietary real estate demand indicator has sunk recently, but also the latest Fed Senior Loan Officer survey revealed that demand for CRE loans remains feeble (third & bottom panels, Chart 6). Simultaneously, fewer bankers are willing to extend CRE credit according to the same quarterly Fed survey (Chart 7). This tightening backdrop is weighing on CRE credit growth and CRE prices (second panel, Chart 6). In fact, absent credit growth providing the necessary fuel to sustain the CRE price inflation frenzy, there are rising odds that investors pull the plug on REITs (top panel, Chart 7). Chart 6Demand Ails Chart 7Time To... Already, occupancy rates have crested and there are increasing anecdotes of credit quality deterioration. As a result, CRE rents are also failing to keep up with inflation which eats into relative cash flow growth prospects (Chart 8). The supply side build up tilts this delicate balance further into deficit. Non-residential construction shows no signs of abating, with multi-family housing starts still running at an historically high rate of roughly 400K/annum (Chart 9). Such relentless overbuilding sows the seeds of the eventual felling in CRE prices and rents, which should also dent the S&P real estate sector. Chart 8...Lighten Up On Real Estate Chart 9Supply Build Up Is Deflationary Meanwhile, interest rate related headwinds will also weigh on this high-yielding sector in coming quarters, especially if the selloff in the bond market gains steam as BCA’s fixed income strategists continue to expect. While in the 2000s REITs were positively correlated with the 10-year Treasury yield, since 2010 this relationship has flipped and is now a tight inverse correlation (Chart 10). Chart 10Rising Yields = Sell REITs Finally, our proprietary Valuation Indicator (VI) has enjoyed an impressive run since the 2017 trough and despite the recent relative selloff remains in overvalued territory. Our Technical Indicator (TI) hit a wall of late near one standard deviation above the historical mean and has only partially unwound the overbought reading since the early 2018 bottom. If our thesis pans out, we expect heightened selling pressure to weigh further on our VI and TI (Chart 11). Chart 11Still Too Pricey Bottom Line: We reiterate our underweight rating in the S&P real estate sector. The ticker symbols for the stocks in this index are: BLBG – S5RLST – AMT, PLD, CCI, SPG, EQIX, WELL, PSA, EQR, AVB, SBAC, O, DLR, WY, VTR, ESS, BXP, CBRE, ARE, PEAK, MAA, UDR, EXR, DRE, HST, REG, VNO, IRM, FRT, KIM, AIV, SLG, MAC . Lost Signal The communications equipment rally stalled early in the summer and has since morphed into a bear market. We are sticking with our underweight recommendation, especially given a darkening profit outlook for this niche tech sub-group. Bellwether CSCO’s latest guidance was weak and confirmed that this capex-laden tech sub-index is in for a rough ride. Worryingly, CSCO’s key enterprise segment has no pulse. Historically, this data series has been positively correlated with telecom carrier capital outlays and the current message is grim (second panel, Chart 12). Tack on the ongoing manufacturing recession with CEOs canceling/postponing capital spending plans and the outlook dims further for the revenue prospects of communications equipment vendors (third & bottom panels, Chart 12). Chart 12Heed The CSCO Warning Adding insult to injury, the US/China trade war is further complicating the picture. The ongoing tariffs have exacerbated the global growth slowdown and global capex plans have come under intense scrutiny. The IFO’s World Economic Outlook capex intentions survey has plunged, warning that global exports of telecom gear have ample downside (Chart 13). Chart 13Global Capex Blues Chart 14US Dollar The Deflator The greenback’s resilience is also sapping business purchasing power, especially in the emerging markets, denting final-demand. Therefore, the US dollar’s appreciation robs communications equipment manufacturers’ pricing power, makes their goods more expensive in the global market place, and as a consequence forces market share losses on them (Chart 14). The greenback’s resilience is also sapping business purchasing power, especially in the emerging markets, denting final-demand. The implication of weakening pricing power is that profits will likely underwhelm. Currently, the sell-side is penciling in roughly 10% EPS growth for the S&P communications equipment index over and above the SPX in the next twelve months. This is a tall order and we would lean against such extreme analyst optimism (bottom panel, Chart 15). Operating metrics are quickly losing steam, another harbinger of profit ails for this tech sub-group. In more detail, our productivity proxy has taken a steep turn for the worse and industry executives have also put investment projects on hold (middle panel, Chart 15). Moreover, the communication equipment new orders-to-inventories ratio is contracting and industry resource utilization is probing multi-year lows, according to the Fed’s latest industrial production release. Under such a backdrop, relative top line growth is on track to level off and likely flirt with the contraction zone (Chart 16). Chart 15Operating Metric... Chart 16...Dysphoria Netting it all out, global capex blues, the resilient US dollar and weak operating metrics all confirm that an underweight stance is still warranted in the S&P communications equipment index. Bottom Line: Continue to avoid the S&P communications equipment index. The ticker symbols for the stocks in this index are: BLBG – S5COMM – CSCO, JNPR, MSI, ANET, FFIV. Anastasios Avgeriou US Equity Strategist anastasios@bcaresearch.com Footnotes 1 Please see BCA US Equity Strategy Insight Report, “Deciphering Sector Returns” dated August 30, 2019, available at uses.bcaresearch.com. 2 Please see BCA US Equity Strategy Special Report, “10 Most FAQs From The Road” dated April 8, 2019, available at uses.bcaresearch.com. Current Recommendations Current Trades Size And Style Views Stay neutral cyclicals over defensives (downgrade alert) Favor value over growth Favor large over small caps (Stop 10%)