Construction & Heavy Trucks
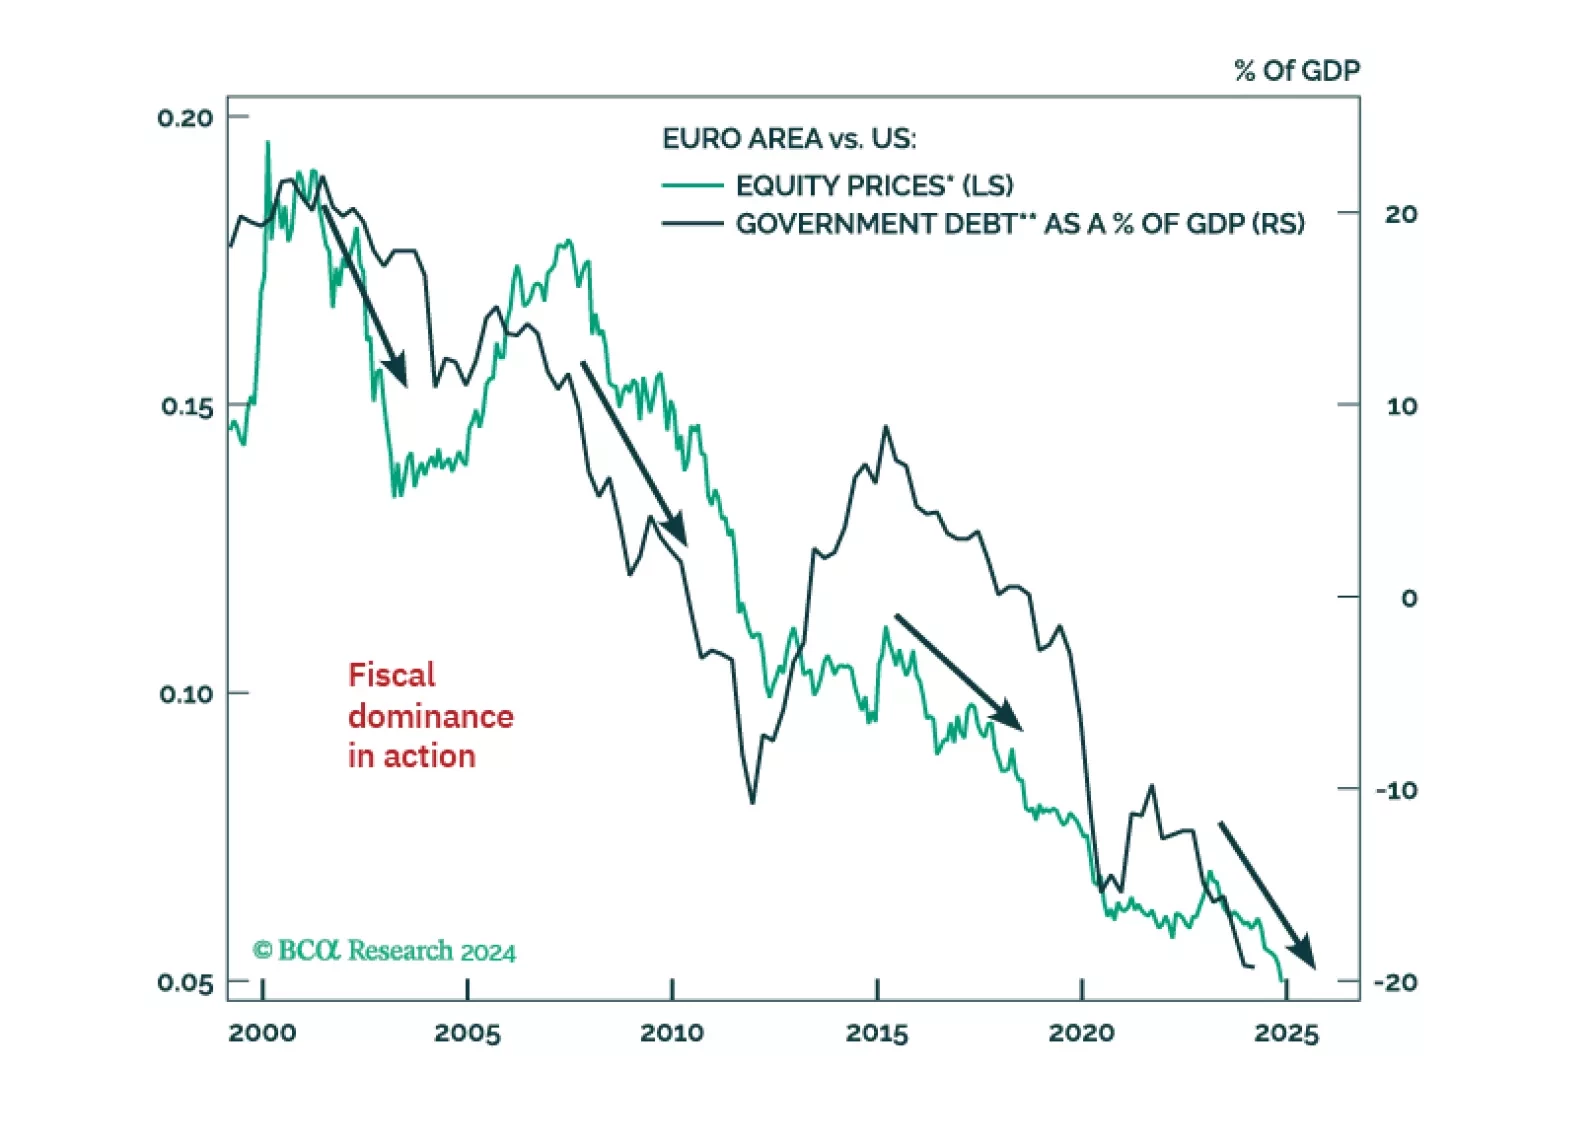
Investors have given up on European assets, which now suffer exceptional discounts to US ones. However, tighter US fiscal policy, the end of Europe’s austerity and deleveraging, the LNG Tsunami about to hit European shores, and the global capex fueled by the Impossible Geopolitical Trinity mean that Europe’s time to shine will soon come back.
Investors have given up on European assets, which now suffer exceptional discounts to US ones. However, tighter US fiscal policy, the end of Europe’s austerity and deleveraging, the LNG Tsunami about to hit European shores, and the global capex fueled by the Impossible Geopolitical Trinity mean that Europe’s time to shine will soon come back.

Highlights Portfolio Strategy China’s slowdown, a grinding higher US dollar, extremely overbought technicals and historically pricey valuations, all signal that the time is ripe to book profits and downgrade machinery to neutral. Recent Changes Lock in gains of 4.3% and downgrade the S&P construction machinery & heavy trucks index to neutral, today. Table 1 Feature While the Fed’s dots dovishly surprised market participants last week, the FOMC’s output and inflation projections were on the hawkish side. Adding the committee’s 2021 core PCE price inflation estimate to their real GDP forecast results in a roughly 9% nominal GDP estimate, assuming the PCE and GDP deflators approximate one another. Clearly, the Fed is in a bind as it tries to strike a delicate balance between short and long term rates. Our thesis, first posited on February 1, remains that the bond market will keep on testing the Fed’s resolve until the FOMC members start to “talk about talking about tapering”. An economy running on steroids buoyed both by ultra loose monetary and fiscal policies at a time when it is primed to reopen at full speed around Memorial Day is inherently inflationary. Under such a backdrop, the subsurface equity market’s response makes perfect sense. “Back-To-Work” stocks left “COVID-19 Winners” in the dust, small caps outperformed the Nasdaq 100, the Value Line Arithmetic Index and the RVRS1 exchange traded fund outshone the SPX and the S&P 495 trounced the S&P 5 (Chart 1). In other words, when growth is scarce as during last year’s recession investors flock to growth stocks, now that growth is abundant investors are cornering value stocks with the highest degree of operating leverage (top panel, Chart 1). While this deck reshuffling may go on temporary hiatus as the 10-year US Treasury yield pauses for breath, this sector rotation has cyclical staying power. Given this looming inflationary impulse context, today we update our Corporate Pricing Power Indicator (CPPI). Chart 2 shows that our CPPI has swung over 10 percentage points from the recent trough, accelerating north of 5%/annum pace. In fact, our diffusion index of the 60 selling price categories we track has vaulted to all-time highs (second panel, Chart 2). Chart 1Anatomy Of The Market Chart 2Corporate Pricing Power Flexing Its Muscles Wage inflation is also coming out of hibernation, with job switchers outpacing job stayers’ salary inflation, according to the latest Atlanta Fed wage growth trackers (third panel, Chart 2). Importantly, the most recent NFIB survey showed that small businesses have the hardest time filling job openings by finding qualified labor. Over the past three decades, this backdrop has been conducive to wage inflation (Chart 3), and if history at least rhymes, a pick-up in wage inflation is in the cards in the back half of the year (Chart 4). Our sense is that the economic reopening will by then be at full speed, further exacerbating wage pressures. Chart 3Inflation… While profit margins are on the cusp of shaking off the remnants of the COVID-19 accelerated recession, sell-side analysts’ 12-month forward profit margin estimates show no signs of input cost pressures, at least not yet. The risk is that corporations may find it challenging to pass on these looming wage increases down the supply chain and all the way to the consumer in order to preserve margins (bottom panel, Chart 2). The jury is still out on who will eventually have to bear the brunt of inflationary pressures, especially in the context of rising fiscal deficits (i.e. personal current transfers). Drilling beneath the surface, our CPPI signals that genuine inflationary pressures are mounting as supply chains are strained causing shortages on a slew of manufacturing industries. As a reminder, we calculate industry group pricing power from the relevant CPI, PPI, PCE and commodity growth rates for each of the 60 industry groups we track. Table 2 also highlights shorter term pricing power trends and each industry's spread to overall inflation. Chart 4…Is Coming Table 2Industry Group Pricing Power While 68% of the industries we cover are outright lifting selling prices, half are doing so at a faster clip than overall inflation. With regard to pricing power trends, encouragingly only 30% of the industries we cover are in a downtrend (Table 2). Services industries mostly populate the bottom half of Table 2 with the usual suspects – airlines, air freight, hotels and movies & entertainment – that COVID-19 wreaked the most havoc to occupying the bottom four spots. Nevertheless, this is looking in the rearview mirror. The tide is slowly turning as a recent update from the TSA highlighted that passenger enplanements are perking up. Lumber has reached escape velocity and has sustained forest products atop our table with a meteoric year-over-year growth rate of 149%! Commodities populate nine out of the top ten spots and while gold has fallen down the ranks since our last update, it is still expanding at a near 10%/annum rate, despite the greenback’s year-to-date rise. Energy related commodities are on fire and peak oil inflation will hit in April/May due to base effects. Keep in mind that last spring WTI crude oil prices sank into a deeply negative print per bbl. While at first sight all seems upbeat in the commodity complex, beneath the surface some cracks are forming. This week, we revisit our number one macro risk for the back half of the year: China’s pending slowdown, and downgrade a deep cyclical capital goods sub-group to neutral. Gauging China’s Slowdown Cresting in Chinese data pushed us to downgrade the cyclical/defensive portfolio bent from overweight to neutral last month (third panel, Chart 5), and now we highlight yet another warning shot originating across the Pacific Ocean. Bloomberg’s compiled China High-Frequency Economic Activity Index (CHFEAI) has downshifted since peaking last December, warning that investors should keep their “China” guard up. The CSI 300 is following down the path of the CHFEAI (second panel, Chart 5), and the near-term risk is that the S&P 500 may be next in line (top panel, Chart 5), as it has closely tracked China, albeit with a slight lag, since COVID-19 hit, as we first showed in our December 21, 2020 Special Report. Tack on the absence of an SPX valuation cushion, and there are rising odds that select deep cyclical/highly levered/China exposed sectors will start to sniff out some China trouble. Taking cue from Chinese financial market data is also instructive. The MSCI China stock price index, its short-term momentum, net EPS revisions and 12-month forward EPS growth all troughed last spring. It is slightly unnerving that by all these metrics China’s stock market recovery is coming off the boil and may be a precursor to a soft-patch in the coming months (Chart 6). Chart 5Monitor China Closely Chart 6What Are Chinese Stocks Sniffing Out? Importantly, select commodities, especially ones that are hypersensitive to Chinese activity, appear exhausted and have likely hit, at least a temporary, zenith. While anecdotes of metal related scams and thefts are mushrooming especially catalytic converters mostly owing to rare earths soaring prices, we would not be surprised were bronze/copper statues to start disappearing and sold for scrap, as was prevalent in the mid-2000s commodity super cycle. Dr. Copper has more than doubled in the past year, is near all-time highs and already discounts a lot of good China recovery news (top panel, Chart 7). Historically, Google Trends searches for “commodity super cycle” have been closely correlated with cyclicals/defensives relative performance and the recent spike near all-time highs likely corroborates that the Chinese recovery is well advanced (Chart 8). Chart 7Glass Ceiling Chart 8“Commodity Super Cycle” Hubris? WTI crude oil prices have also jumped over $100/bbl after hitting the negative $37/bbl mark last April. In the mid-60s/bbl crude oil has likely hit a ceiling and will have a tough time surging past this long term resistance. Sentiment is as extreme as it was during the Desert Storm in the early 1990s, which is the last time the oil RSI jumped over 80 (Chart 9)! Chart 9Slippery Slope? The Australian dollar, a commodity currency levered to China’s wellbeing, has also been on a tear since last March with AUDUSD rising from 0.55 to roughly 0.80. The Aussie is currently at the upper band of its range, since the Hawke/Keating government floated it in 1983, and facing stiff resistance. There are rising odds that AUDUSD is also sniffing out some China softness in the coming months (bottom panel, Chart 7). Finally, Chinese surveys and money aggregates data also signal that a garden variety slowdown will take root, especially post the 100-year Communist Party anniversary this summer. The Chinese manufacturing PMI is awfully close to the 50 expansion/contraction line, at a time when both M1 money supply has ticked lower and the total social financing impulse has rolled over (Chart 10). Tack on our sister’s China Investment Strategy’s recent estimate of a further steep deceleration in the latter and factors are falling into place for an engineered slowdown in China in the back half of the year (bottom panel, Chart 10). Bottom Line: China is on the cusp of a slowdown, remains a key macro risk to monitor, and thus we use this opportunity to book gains in a deep cyclical industrials sub-group and downgrade to neutral. Chart 10Keep Your China Guard Up CAT Stalling? As China’s economic growth downshifts, we are compelled to book gains in machinery stocks and downgrade to neutral. This sub-surface industrials sector move comes on the heels of last week’s upgrade in the more domestically focused railroads, and does not affect the broad sector’s overweight stance. First, machinery stocks are extremely overbought by historical standards outpacing the SPX by 36% on a year-over-year basis. Valuations have also spiked: the relative price to sales ratio is back near par and trades at a 25% premium to the historical average (Chart 11). Such lopsided positioning is fraught with danger and could at least temporarily reverse in a violent fashion. Second, while the US dollar has been boosting the industry’s exports and adding to machinery P&L via positive translation gains, the greenback’s year-to-date appreciation will eat into profits, at the margin, in the back half of the year (second & middle panels, Chart 12). Chart 11Too Far Too Fast Chart 12First Signs Of Cracks Appearing Sell-side analysts have taken notice and net profit revisions have topped out. Similarly, our EPS growth macro models suggest that machinery stocks will struggle to outearn the SPX (Chart 12). Lastly, as China goes, so go machinery stocks. The latest Chinese manufacturing PMIs hooked down and any sustained weakness will weigh heavily on demand for US machinery new orders (fourth panel, Chart 12). Tack on the waning impulse of Chinese total social financing aggregates including BCA’s downbeat forecast, and the outlook for machinery end-demand darkens further (Chart 13). Nevertheless, before getting outright bearish on machinery stocks, there are a few offsetting factors. Commodity prices, while toppy, remain firm, and alleviate fears of a severe Chinese slowdown. Moreover, Chinese excavator sales are on a tear surging to a three year high. While China’s manufacturing PMI has petered out, both the global PMI and developed market PMIs are reaccelerating. As the global economy reopens, services PMIs will further boost the global composite PMIs (second & bottom panels, Chart 14). Chart 13Chart Of The Year Candidate Finally, while our relative EPS growth models hover near the zero line, the same is also true for the sell side’s profit growth estimates and represent a modest hurdle for the industry to surpass (third panel, Chart 14). Netting it all out, China’s slowdown, a grinding higher US dollar, extremely overbought technicals and historically pricey valuations, all signal that the time is ripe to book profits and downgrade machinery to neutral. Chart 14Reasons Not To Turn Outright Bearish Bottom Line: Downgrade the S&P construction machinery & heavy trucks index to neutral today for a relative gain of 4.3% since inception. The ticker symbols for the stocks in this index are: BLBG: S5CSTF – CAT, CMI, PCAR & WAB. Anastasios Avgeriou US Equity Strategist anastasios@bcaresearch.com Footnotes 1 The Reverse Cap Weighted U.S. Large Cap ETF (Ticker: RVRS) provides exposure to the companies in the S&P 500 index. However, while traditional market cap weighted indexes such as the S&P 500 weight companies inside the index by their relative market capitalization, RVRS does the opposite, weighting companies by the inverse of their relative market cap. By investing smallest-to-biggest, the fund is tilting investment exposure to the smaller end of the market cap spectrum within the large cap space. https://exponentialetfs.com/wp-content/uploads/2021/01/Reverse-ETF-Factsheet_2020.12.311.pdf Current Recommendations Current Trades Strategic (10-Year) Trade Recommendations Size And Style Views February 24, 2021 Stay neutral cyclicals over defensives January 12, 2021 Stay neutral small over large caps June 11, 2018 Long the BCA Millennial basket The ticker symbols are: (AAPL, AMZN, UBER, HD, LEN, MSFT, NFLX, SPOT, ABNB, V). January 22, 2018 Favor value over growth
Overweight Caterpillar, the global trade bellwether, reported results yesterday that beat expectations despite sell-side pessimism that global softness had not been priced in to the stock. Of particular note was the resilience in resource demand that was the source of both revenue and profit outperformance as volume and price gains outweighed tariff-driven input cost increases and FX headwinds. The stock’s reaction to the earnings beat was muted as investors focused on management commentary that aggressive competition would result in market share losses in China. Nevertheless, the credit easing-driven rebound in Chinese construction/infrastructure spending growth should more than offset this headwind. We remain focused on the sector’s core performance drivers. The CRB raw industrials index, which moves in lockstep with the S&P CMHT index, has been ticking up recently and continues to positively diverge from the CMHT’s relative performance (second panel). In particular, the recent spike in energy prices will likely provide a robust lever for relative share prices as energy development projects take off (third panel). Bottom Line: Solid end-demand should deliver outsized profit gains while the still-outstanding catalyst from a positive resolution of the China/U.S. trade tussle stands to lift S&P CMHT share prices. Stay overweight. The ticker symbols for the stocks in this index are: BLBG: S5CSTF - CAT, CMI, PCAR.

Of particular note was the resilience in resource demand that was the source of both revenue and profit outperformance, as volume and price gains outweighed tariff-driven input cost increases and FX headwinds. The stock’s reaction to the earnings beat was…
Caterpillar and, by virtue of its dominance of its subsector, the S&P CMHT index was at the front of the news cycle this week as an analyst downgraded CAT based on a belief that global growth had collapsed. The market largely ignored the report and both…
Overweight Caterpillar and, by virtue of its relative dominance, the S&P construction machinery & heavy truck (CMHT) index were at the front of the news cycle this week as an analyst downgraded CAT based on a belief that global growth had collapsed. The market largely ignored the report and both CAT and the S&P CMHT index have continued their outperformance since the late-October trough, when we reiterated our overweight recommendation in our Daily Sector Insight report titled “A Buying Opportunity In Construction Machinery”. The signals from the indicators we track imply that the “global growth collapse” is both late and overstated. The CRB raw industrials index, which moves in lockstep with the S&P CMHT index’s relative performance, unsurprisingly showed weakness at the end of 2018 but has since recovered (second panel). Further, the global credit impulse, an excellent leading indicator of relative profitability, has ticked up into positive territory after sending a weakening signal in 2018 and implies a resumption of profit outperformance (third panel). The combination of positive relative sales growth and still-tepid share price action has taken the relative valuation to levels not seen since the 2015-16 manufacturing recession (bottom panel), which marks an exceptionally affordable entry point, particularly for investors seeking to gain exposure to a China/U.S. trade tussle resolution. We continue to think such buying opportunities are rare and reiterate our overweight recommendation. The ticker symbols for the stocks in this index are: BLBG: S5CSTF - CAT, CMI, PCAR.
Overweight - High Conviction The S&P construction machinery & heavy truck (CMHT) index has been waylaid this week and last following earnings reports that the market did not digest well, first from PCAR and most recently by CAT. With respect to the latter, fears over high dealer inventories and tariff-driven input cost increases outweighed surging volumes and margins and the stock fell dramatically. While investor worries about future growth seem to dominate the equity risk premium in the market's meta-analysis, we remain focused on the fundamentals. That is to say, while spectacular volume growth at CAT is decelerating by virtue of lapping last year's powerful results, a decline (or even diminished upward trajectory) in relative profits is not part of the conversation (second panel). This is a result of the company's success in passing through price increases to offset rising input costs as volumes take the driver's seat in sales outgrowing the broad market by a wide margin (third panel). Meanwhile, the pullback in stock prices has pushed the S&P CMHT index' valuation to very affordable levels (bottom panel). We think such buying opportunities are rare and reiterate our high-conviction overweight recommendation. The ticker symbols for the stocks in this index are: BLBG: S5CSTF - CAT, CMI, PCAR.
Highlights Portfolio Strategy Firming domestic and encouraging global macro conditions along with neutral valuations and washed out technicals suggest that the path of least resistance is higher for the S&P industrials sector. A looming positive global growth impulse, easy Chinese monetary conditions, a still buoyant energy end-market, enticing industry operating metrics and compelling valuations all suggest that now is not the time to throw in the towel on the S&P construction machinery & heavy truck (CMHT) index. Recent Changes There are no changes to our portfolio this week. Table 1 Feature Chart 1All-time Highs Everywhere The SPX catapulted to fresh all-time highs last week following an eight month hiatus, as a de-escalation in the global trade war gained further traction. Chart 1 shows that this is a broad based equity market advance as a slew of major equity market indexes have simultaneously vaulted to new highs. Even the high-yield corporate bond market confirms this breakout with the total return index also vaulting to new all-time highs (not shown). Any further moderation in trade rhetoric from the U.S. administration could serve as a catalyst for additional gains in the SPX, and trade-affected sectors would likely lead the charge, especially post the mid-term elections.1 While the U.S./China trade spat will prove the ultimate equity market litmus test, the longevity and magnitude of the profit upcycle remain the key equity market advance pillars. On that front, a deeper dive into profit margins is in order. The S&P 500's profit margins are benefiting from the one-time fillip of lower corporate taxes in calendar 2018. Nevertheless, it is important to remember that this year's strong profits are not the result of any massaging from CEOs/CFOs of the share count. In other words, profit margins (earnings per share / sales per share) are not impacted by changes in the number of shares outstanding, unlike simple EPS growth. Chart 2 shows that SPX margins recently slingshot to all-time highs. However, excluding tech they remain below the previous cycle's mid-2007 peak. While we are not fans of excluding sectors from our analysis, the sheer size and persistence of the tech sector's profit margin expansion is surprising. Tech sector profit margins are twice the SPX's margins, and tech stocks have been pulling SPX margins higher consistently for the past 8 years as tech giants are flexing their oligopolistic/monopolistic muscle. The implication is that SPX EPS growth of 10% is likely in 2019, but the tech sector has to continue doing most of the heavy lifting given the high profit and market cap weight in the SPX. Keep in mind that the commodity complex in general and energy in particular are also adding to the recent margin euphoria. The late-2015/early-2016 global manufacturing recession-induced collapse in margins is now re-normalizing across basic resources, with margins in the S&P energy sector increasing by 11 percentage points since the Q2 2016 trough (Chart 2). Beyond the sector-related margin implications, from a macro point of view, U.S. stock market-reported employment has also been a significant contributor to the phenomenal profit margin expansion phase. Typically, stock market constituents reported job count growth peaks right before the NBER designated recession commences, on average at over an 8% year-over-year growth rate. The current labor market, while vibrant, has been trailing previous cycles by a wide margin. The most recent year-over-year growth rate clocked in at 3.5% (second panel, Chart 3). Chart 2Tech Margins Leading##br## The Pack Chart 3Smaller Than Usual Labor Footprint##br## Is A Boon For Margins National accounts data also corroborate this enticing profit margin backdrop. Average hourly earnings (AHE) have crested north of 4% in the past three cyclical peaks. Currently AHE are 130bps below that level (top panel, Chart 3). The implication is that as long as top line growth remains solid and corporate pricing power stays upbeat, profit margins will continue to underpin profits. Unlike the tech sector's excessive contribution to the SPX profit margin, the opposite rings true with regard to analysts' forward profit projections. Both on a 12-month and 5-year forward basis the S&P tech sector is trailing the SPX (Chart 4). Importantly, the latter has been at the center of a healthy debate within BCA, and decomposing this seemingly high number is instructive. A 16% long-term EPS growth rate is a tall order. However, sell-side analysts never get the shorter-term, let alone longer-term, forecasts correct. In hindsight, analysts' 5-year forward EPS growth forecasts back in 2016 sunk to an all-time low, even lower than the depths of the Great Recession (top panel, Chart 4). Currently, all we are experiencing is a move from one extreme to the other, and while we are clearly in overshoot territory, it is impossible to predict where this number will peak. Decomposing the broad market's projected long-term EPS growth rate is revealing. First, we note that the tech sector is projected to grow at half the rate predicted during the tech bubble. Second, four sectors comprise the outliers (i.e. forecast to surpass the 16% SPX growth rate) and such a breakneck pace will surely fail to materialize. Another common characteristic these four sectors share is that they all surpassed their tech bubble peak rates, something that the broad market has yet to achieve. Thus, consumer discretionary, financials, industrials and especially energy are in uncharted territory (Chart 5). On the opposite end of the spectrum, Chart 6 highlights the sectors that have yet to overtake their respective peaks and are sporting long-term EPS growth rates below the broad market. Chart 4Putting Tech Long-term Profit##br## Growth Rate In Context Chart 5Decomposing... Chart 6...Long-Term EPS Growth Netting it all out, we continue to have a sanguine cyclical (9-12 month horizon) SPX view, and our price target for 2019 remains 10% higher, assuming the multiple moves sideways leaving the onus on EPS to do all the heavy lifting.2 The week we are highlighting a deep cyclical sector that can benefit from a further de-escalation of the trade war and update one of its key subcomponents that remains a high-conviction overweight. Are Industrials Running On Empty? Last week, in a Special Report on President Trump's trade rhetoric impact on equity markets, we showed that trade policy uncertainty has risen to the highest level with the exception of the 1994 Clinton-era trade spat with the Japanese.3 While U.S. stocks have come out on top versus their global peers, within the U.S. equity market industrials have borne the brunt of the President's trade wrath (Chart 7). Chart 7Trade Uncertainty Weighing On Industrials In more detail, since peaking on January 26th, 2018, two stocks explain over 62% of the S&P industrials sector's fall: GE and MMM, two industrial conglomerates highly exposed to global trade. However, transports in general and rails in particular have been rising smartly almost entirely offsetting the industrial conglomerates' weakness. As a reminder, we are overweight the rails and air freight & logistics, underweight the airlines, neutral on industrial conglomerates and remain comfortable with that intra-sector positioning. Importantly, green shoots are emerging, warning that it does not pay to become bearish on this deep cyclical sector. Our Cyclical Macro Indicator remains upbeat, diverging from relative profitability (Chart 8). Domestic ex-tech output is firing on all cylinders (Chart 8), a message reviving core capital goods orders corroborate (Chart 9). All of this has resulted in firming pricing power. Tack on the reacceleration in our U.S. capital expenditure indicator (second panel, Chart 8) - capex upcycle remains a key BCA theme for the remainder of 2018 - and industrials sector stars are aligned. The upshot is that depressed relative profit growth will easily surprise to the upside (bottom panel, Chart 8). Chart 8Green Shoots... Chart 9...Appearing Not only are there U.S. macro tailwinds, but also a global growth recovery is in the offing that will herald a snapback in relative share prices. The global manufacturing PMI remains squarely above the 50 boom/bust line (fourth panel, Chart 9), and there are early signs of a budding recovery in China. The Li-Keqiang index is ticking higher, Chinese monetary conditions have eased significantly via a depreciating currency and a drop in interest rates, excavator sales continue to expand at a healthy clip, industrial profits are reaccelerating and even Chinese share prices have likely troughed. Expanding Chinese wholesale selling prices also suggest that a reflationary impulse is looming (bottom panel, Chart 9). Were trade tensions to further de-escalate, especially post the midterm elections that could serve as a powerful tonic for relative share prices. Our Industrials EPS growth model does an excellent job in capturing all these forces and is currently signaling that profits will continue to grow into 2019 (Chart 10). Valuations have returned to the neutral zone, but technicals have plunged to one standard deviation below the mean, a level that has historically been associated with playable rallies (bottom panel, Chart 10). One key risk to our optimistic take on the S&P industrials sector is the U.S. dollar. Chart 11 highlights that capital goods revenues, exports and multiples are in jeopardy if the greenback continues to appreciate. Add to that a full blown trade war between the U.S. and China - which is dollar positive - and industrials stocks would suffer another blow. Chart 10Great Entry Point Chart 11Further U.S. Dollar Appreciation Is A Risk Bottom Line: Firming domestic and encouraging global macro conditions along with neutral valuations and washed out technicals suggest that the path of least resistance is higher for the S&P industrials sector. What To Do With Construction Machinery? Early in the year, following our risk management implementation of a 10% stop on our high conviction call list, we got stopped out with a 10% gain from the high-conviction overweight call in the S&P CMHT index. We were subsequently compelled to reinstitute this high-conviction call as all of the fundamental drivers remained in place. However, our timing was not perfect, and given that bellwether Caterpillar has a near 60% foreign sourced revenue exposure, this industrial subsector also bore the brunt of the President's hawkish trade rhetoric. The key question currently is: does it still make sense to be overweight this highly cyclical industrials sub group? The short answer is yes. First, while global growth has decelerated, global trade is still expanding and the signal from the Baltic Dry Index is that the risk of an abrupt halt in global trade similar to the late-2015/early-2016 episode is small (second panel, Chart 12). In addition, the global capex upcycle remains in place and is one of BCA's two themes we continue to explore for the rest of the year. The upshot is that it still pays to remain invested in the S&P CMHT index. Demand for machinery remains upbeat across the globe. Both our global exports and orders proxies for machinery continue to grow, underscoring that a profit-led recovery in construction machinery stocks is looming (third & fourth panels, Chart 12). Second, while China is the administration's primary trade target, easy monetary conditions there will provide much needed breathing room for the Chinese economy. Already, Chinese housing construction data and the rebounding Li-Keqiang Index are pointing to a brighter backdrop for relative share prices (top two panels, Chart 13). Moreover, Chinese excavator sales are advancing at a brisk year-over-year rate, highlighting that construction machinery end-demand remains solid. Chart 12Global Growth & CAPEX Are Tailwinds... Chart 13...And So Is The Troughing Chinese Economy Third, the key energy end-market shows no signs of deceleration. The steeply recovering global oil rig count on the back of a $78 Brent crude oil price suggests that demand for oil & gas field machinery remains on the recovery path and is a harbinger of a rising relative share price ratio (Chart 14). Fourth, industry operating metrics are overheating and signal that profits will continue to surprise to the upside. Rising capex budgets have reduced industry slack (second & third panels, Chart 15). As a result, machinery selling prices have soared to the highest level since the Great Recession (bottom panel, Chart 15) and will underpin industry profits. Chart 14Energy End-market To The Rescue? Chart 15Vibrant Operating Metrics Finally, relative valuations have plunged to near one standard deviation below the average and so have relative technicals. While both can sink further, we would be taking a punt here (Chart 16). Despite our optimistic view on the S&P CMHT index's profit prospects, the appreciating U.S. dollar and recent cresting in the CRB raw industrials index represent key downside risks to our overweight call. This commodity price index is a crucial input to our machinery EPS growth model that has petered out, but at a high level. Any further steep appreciation in the greenback will likely deal a blow to the commodity complex and jeopardize the virtuous machinery profit upcycle (Chart 17). Chart 16Compelling Valuations And Washed Out Technicals Chart 17Risk To Monitor: Commodity Price Relapse Adding it up, a looming global growth pick up, easy Chinese monetary conditions, a still buoyant energy end-market, enticing industry operating metrics and compelling valuation and technical conditions all suggest that now is not the time to throw in the towel in the S&P CMHT index. Bottom Line: Were we not overweight already we would not hesitate to initiate a new above benchmark position in the S&P CMHT index. We reiterate our high-conviction overweight status. The ticker symbols for the stocks in this index are: BLBG: S5CSTF - CAT, PCAR, CMI. Anastasios Avgeriou, Vice President U.S. Equity Strategy anastasios@bcaresearch.com 1 Please see BCA U.S. Equity Strategy Special Report, "Trump, Trade, Tweets & Tumult - Does The Stock Market Care?" dated August 22, 2018, available at uses.bcaresearch.com. 2 Please see BCA U.S. Equity Strategy Weekly Report, "Lifting SPX Target" dated April 30, 2018, available at uses.bcaresearch.com. 3 Please see BCA U.S. Equity Strategy Special Report, "Trump, Trade, Tweets & Tumult - Does The Stock Market Care?" dated August 22, 2018, available at uses.bcaresearch.com. Current Recommendations Current Trades