Corporate

Analysis on Mexico and Central Europe is available on pages 6 and 10, respectively. Highlights Deflationary pressures have been intensifying in Malaysia and the central bank will be forced to cut its policy rate. To play this theme, we recommend receiving 2-year swap rates. In Mexico, pieces are falling into place for stocks to outperform the EM equity benchmark on a sustainable basis. We are also keeping an overweight allocation on Mexican sovereign credit and local currency bonds. In Central Europe (CE), inflation will continue to rise as both labor shortages and ultra-accommodative monetary and fiscal policies promote strong domestic demand. We are downgrading our allocation of CE local currency bonds from overweight to neutral. Malaysia: Besieged By Deflationary Pressures Malaysian interest rates appear elevated given the state of its economy. Deflationary pressures have been intensifying and the central bank will be forced to cut its policy rate. The Malaysian economy continues to face strong deflationary pressures. To play this theme, we recommend receiving 2-year swap rates. We are also upgrading our recommended allocation to Malaysian local currency and U.S. dollar government bonds for dedicated EM fixed-income portfolios from neutral to overweight. The Malaysian economy continues to face strong deflationary pressures, requiring significant rate cuts by the central bank: Chart I-1 shows that the GDP deflator is flirting with deflation, and nominal GDP growth has slowed to the level of commercial banks’ average lending rates. Falling nominal growth amid elevated corporate and household debt levels is an extremely toxic mix (Chart I-2, top panel). Notably, debt-servicing costs for the private sector – both businesses and households – are high at 13.5% of GDP and are also rising (Chart I-2, bottom panel). Chart I-1The Malaysian Economy Is Flirting With Deflation
The Malaysian Economy Is Flirting With Deflation
The Malaysian Economy Is Flirting With Deflation
Chart I-2High Leverage & Debt Servicing Costs Among Businesses & Households
High Leverage & Debt Servicing Costs Among Businesses & Households
High Leverage & Debt Servicing Costs Among Businesses & Households
Crucially, real borrowing costs are elevated. In real terms, the prime lending rate stands at 5% when deflated by the GDP deflator, and at 3% when deflated by headline CPI. Notably, private credit growth (outstanding business and household loans) has plunged to a 15-year low (Chart I-3), underscoring that real borrowing costs are excessive. Chart I-3Malaysia: Credit Growth Is In Freefall
Malaysia: Credit Growth Is In Freefall
Malaysia: Credit Growth Is In Freefall
Chart I-4Malaysia's Corporate Sector Is Struggling
Malaysia's Corporate Sector Is Struggling
Malaysia's Corporate Sector Is Struggling
Malaysia’s corporate sector is struggling. The manufacturing PMI is below the critical 50 threshold and is showing no signs of recovery. Listed companies’ profits are shrinking (Chart I-4, top panel). Poor corporate profitability is prompting cutbacks in capex spending (Chart I-4, middle and bottom panels) and weighing on employment and wages. The household sector has been retrenching; retail sales have been contracting and personal vehicle sales have been shrinking (Chart I-5). The property market – in particular the residential sub-sector – is still in recession. Property sales and starts are falling, and property prices are flirting with deflation (Chart I-6). Critically, monetary policy easing and exchange rate depreciation are the only levers available to policymakers to reflate the economy. Fiscal policy is constrained as the budget deficit is already large at 3.4% of GDP, and public debt is elevated. Prime Minister Mahathir Mohamad is in fact aiming to reduce the total national debt (including off-balance-sheet debt) back to the government’s ceiling of 54% of GDP (from 80% currently). Chart I-5Malaysian Households Are Retrenching
Malaysian Households Are Retrenching
Malaysian Households Are Retrenching
Chart I-6Malaysia's Property Sector Is In A Downturn
Malaysia's Property Sector Is In A Downturn
Malaysia's Property Sector Is In A Downturn
Bottom Line: The Malaysian economy is besieged by deflationary pressures and requires lower borrowing costs. The central bank will deliver rate cuts in the coming months. Investment Recommendations A new trade idea: receive 2-year swap rates as a bet on rate cuts by the central bank. Consistently, for dedicated EM bond portfolios, we are upgrading local currency and U.S. dollar-denominated government bonds from neutral to overweight. Chart I-7Overweight Malaysian Local Currency And U.S. Dollar Government Bonds
Overweight Malaysian Local Currency And U.S. Dollar Government Bonds
Overweight Malaysian Local Currency And U.S. Dollar Government Bonds
While we are downbeat on the ringgit versus the U.S. dollar, Malaysian domestic bonds will likely outperform the EM GBI index in common currency terms on a total return basis (Chart I-7, top panel). The same is true for excess returns on the country’s sovereign credit (Chart I-7, bottom panel). The basis for the ringgit’s more moderate depreciation, especially in comparison with other EM currencies, is as follows: First, foreigners have reduced their holdings of local currency bonds. The share of foreign ownership has declined from 36% in 2015 to 22% now of total outstanding local domestic bonds in the past 4 years (Chart I-8). Hence, currency depreciation will not trigger large foreign capital outflows. Second, the trade balance is in surplus and improving. This will provide a cushion for the ringgit. Finally, the ringgit is cheap in real effective terms which also limits the potential downside (Chart I-9). Dedicated EM equity portfolios should keep a neutral allocation on Malaysian stocks. We are taking profits on our long Malaysian small-cap stocks relative to the EM small-cap index position. This recommendation has generated a 6.6% gain since its initiation on December 14, 2018. Chart I-8Foreigners' Share Of Local Currency Bonds Has Dropped
Foreigners' Share Of Local Currency Bonds Has Dropped
Foreigners' Share Of Local Currency Bonds Has Dropped
Chart I-9The Ringgit Is Cheap
The Ringgit Is Cheap
The Ringgit Is Cheap
Ayman Kawtharani Editor/Strategist ayman@bcaresearch.com Mexico: Raising Our Conviction On Equity Outperformance Mexican local currency bonds, as well as sovereign and corporate credit, have been one of our highest conviction overweights for some time. These positions have played out very well (Chart II-1). Presently, pieces are falling into place for Mexican stocks to outperform the EM equity benchmark on a sustainable basis. First, long-lasting outperformance by Mexican local currency bonds and corporate credit will lead to the stock market’s outperformance relative to the EM benchmark. Chart II-2 shows that when Mexican local currency bond and corporate dollar bond yields fall relative to their EM peers, the Bolsa tends to outperform. In brief, a relative decline in the cost of capital will eventually translate into relative equity outperformance. Chart II-1Mexico Vs. EM: Domestic Bonds And Credit Markets
Mexico Vs. EM: Domestic Bonds And Credit Markets
Mexico Vs. EM: Domestic Bonds And Credit Markets
Chart II-2Mexico: Relative Stock Prices Are Correlated With Relative Cost Of Capital
Mexico: Relative Stock Prices Are Correlated With Relative Cost Of Capital
Mexico: Relative Stock Prices Are Correlated With Relative Cost Of Capital
Second – as discussed in detail in our previous Special Report – market worries about Mexico’s fiscal position are overblown, especially relative to other developing nations such as Brazil and South Africa. Orthodox fiscal and monetary policies, as well as low public debt, warrant a lower risk premium in Mexico, both in absolute terms and relative to other EM countries. Moreover, market participants and credit agencies have overstated the precariousness of Pemex’s debt and financing requirements. Pemex U.S. dollar bond yields have been falling steadily compared to EM aggregate corporate bond yields since the announcements of policies aimed at supporting the company’s debt sustainability. We have discussed Pemex’s financial sustainability and its effect on public finances in past reports.1 Third, having cut rates twice since September, the Central Bank of Mexico (Banxico) has embarked on a rate cutting cycle. This is positive for stock prices, as it implies higher equity valuations and will eventually put a floor under the economy. Given that both core and headline inflation have fallen within the target bands, this gives the monetary authorities more room to reduce interest rates. Banxico members have been vocal about their desire to cut rates further, which is being foreshadowed by the swap market (Chart II-3, top panel). Given that both core and headline inflation have fallen within the target bands, this gives the monetary authorities more room to reduce interest rates. The slowdown in the domestic economy and Andrés Manuel López Obrador’ (AMLO) administration’s tight fiscal policy will enable and encourage Banxico to further ease monetary policy (Chart II-3, bottom panel). Fourth, another positive market catalyst for Mexican equities is the ongoing outperformance of EM consumer staples versus the overall EM index. Consumer staples have a large 35% share of the overall Mexico MSCI stock index, while this sector in the EM MSCI benchmark accounts for only 7%. Therefore, durable outperformance by consumer staples often hints at a relative cyclical outperformance for the Mexican bourse (Chart II-4). Chart II-3Mexico: Continue Betting On Lower Rates
Mexico: Continue Betting On Lower Rates
Mexico: Continue Betting On Lower Rates
Chart II-4Mexican Equities Are A Play On Consumer Staples
Mexican Equities Are A Play On Consumer Staples
Mexican Equities Are A Play On Consumer Staples
Chart II-5Mexican Stocks Offer Reasonable Value
Mexican Stocks Offer Reasonable Value
Mexican Stocks Offer Reasonable Value
Finally, Mexican equities are not expensive. Chart II-5 illustrates that according to our cyclically-adjusted P/E ratios, Mexican stocks offer good value in both absolute terms and relative to EM overall. We continue to believe AMLO’s administration is proving to be a pragmatic government with the aim of reducing rent-seeking activities and addressing structural issues such as poverty, corruption and crime. These policies will be positive for the economy over the long run and share prices will move higher in anticipation. Bottom Line: We are reiterating our overweight allocation on Mexican sovereign credit and domestic local currency bonds within their respective EM benchmarks. With further rate cuts on the horizon, yet upside risks to EM local currency bond yields, we continue to recommend a curve steepening trade in Mexico: receiving 2-year and paying 10-year swap rates. We now have high conviction that Mexican share prices will stage a cyclical outperformance relative to their EM peers. The bottom panel of Chart II-4 on page 8 illustrates that Mexican stocks seem to have formed a major bottom and are about to begin outperforming the EM equity benchmark. Dedicated EM equity managers should have a large overweight allocation to Mexican stocks. Our recommendation of favoring small-caps over large-cap companies in Mexico has been very profitable since we argued for this trade last November. We are taking a 12.9% profit on this position and recommend keeping an overweight allocation to both Mexican large- and small-caps within an EM equity portfolio. Juan Egaña Research Associate juane@bcaresearch.com Arthur Budaghyan Chief Emerging Markets Strategist arthurb@bcaresearch.com Central Europe: An Inflationary Enclave In Deflationary Europe Our macroeconomic theme for Central European (CE) economies – Hungary, Poland and the Czech Republic, elaborated in the linked report, has been as follows: Inflation will continue to rise as both labor shortages and ultra-accommodative monetary as well as fiscal policies in CE promote strong domestic demand. CE economies have stood out as an inflationary enclave in Europe. Notably, CE economies have stood out as an inflationary enclave in Europe. Going forward, inflation will continue to rise across this region, despite the ongoing contraction in European manufacturing. First, Hungary’s and Poland’s central banks are behind the curve – they remain reluctant to hike rates amid rampantly rising inflation within overheating economies (Chart III-1). In turn, real policy rates across CE are becoming more negative and will promote robust money and credit growth (Chart III-2). Chart III-1CE Central Banks Are Behind The Curve
CE Central Banks Are Behind The Curve
CE Central Banks Are Behind The Curve
Chart III-2Low Real Rates Promote Rampant Credit Growth
Low Real Rates Promote Rampant Credit Growth
Low Real Rates Promote Rampant Credit Growth
Policymakers are justifying stimulative policies by stressing ongoing woes in the Europe-wide manufacturing downturn. Yet, they are paying little attention to genuine inflationary pressures in their own economies. Most notably in Hungary, the National Bank of Hungary (NBH) has been aggressively suppressing its policy rate and engaging in a corporate QE program, despite rising inflation and an overheating economy. Similarly, the National Bank of Poland (NBP) seems inclined to cut rates sooner rather than later. On the other end of the spectrum though, the Czech National Bank (CNB) is the only CE central bank to have embarked on a rate hiking cycle over the past 18 months. Going forward, the CNB looks most likely to normalize rates by continuing its hiking cycle. This development will favor rate differentials between it and the rest of CE. As such, we remain long the CZK versus both the HUF and PLN (Chart III-3). Chart III-3Favor CZK Versus PLN & HUF
Favor CZK Versus PLN & HUF
Favor CZK Versus PLN & HUF
Chart III-4Germany's Manufacturing Cycles And CE Inflation
Germany's Manufacturing Cycles And CE Inflation
Germany's Manufacturing Cycles And CE Inflation
Second, European manufacturing cycles have historically defined CE inflation trends, with time lags of around 12 to 18 months. However, this time around, the euro area manufacturing recession will not translate into slower CE inflation and growth dynamics (Chart III-4). Above all, booming credit induced by real negative borrowing costs has incentivized robust domestic demand in general and construction activity in particular in CE. In addition, employment growth remains strong and double-digit wage growth has supported strong consumer spending (Chart III-5). As a result, manufacturing production volumes have remained relatively resilient in Hungary and Poland, even as manufacturing output volumes in both Germany and the broader euro area have been contracting (Chart III-6). Chart III-5Strong Domestic Demand In CE…
bca.ems_wr_2019_10_31_s3_c5
bca.ems_wr_2019_10_31_s3_c5
Chart III-6...Entails Divergences In Manufacturing With Euro Area
...Entails Divergences In Manufacturing With Euro Area
...Entails Divergences In Manufacturing With Euro Area
Third, inflationary pressures in CE are both acute and genuine. Wage growth has been rising faster than productivity growth across the region, leading to surging unit labor costs (Chart III-7). Mounting wage pressures reflect widespread labor shortages. Further, output gaps in these economies have turned positive, which has historically been a precursor of inflationary pressures. Finally, fiscal policy in CE will remain very expansionary, supporting strong business and consumer demand. Bottom Line: Super-accommodative monetary and fiscal policies have led to a classic case of overheating within CE, particularly in Hungary and Poland, and less so in the Czech Republic. Chart III-7Genuine Inflationary Pressures In Central Europe
Genuine Inflationary Pressures In Central Europe
Genuine Inflationary Pressures In Central Europe
Chart III-8A Widening Current Account Deficit Is A Symptom Of Overheating
A Widening Current Account Deficit Is A Symptom Of Overheating
A Widening Current Account Deficit Is A Symptom Of Overheating
Investment Implications Deteriorating current accounts (Chart III-8), rising inflation and behind-the-curve central banks warrant further currency depreciation in both Hungary and Poland. This is why we continue to recommend a short position on both the HUF and PLN versus the CZK. We are closing our Hungarian/euro area relative three-year swap rate trade with a loss of 87 basis points. Our expectation that the market would price in rate hikes in Hungary despite the central bank’s dovishness has not materialized. Investors should remain overweight CE equities within an EM portfolio due to strong domestic demand in these economies and no direct economic exposure to China. As we expect EM equities to underperform DM stocks, we continue to recommend underweighting CE versus the core European markets. We are downgrading our allocation to CE local currency bonds from overweight to neutral within an EM domestic bond portfolio. The primary reason is a risk of a selloff in core European rates. Anddrija Vesic Research Analyst andrija@bcaresearch.com Footnotes 1. Please see Emerging Markets Strategy, "Mexico: The Best Value In EM Fixed Income," dated April 23, 2019 and "Mexico: Crying Out For Policy Easing," dated September 5, 2019, available at ems.bcaresearch.com Equities Recommendations Currencies, Credit And Fixed-Income Recommendations
Highlights The banks got the current earnings season off to a good start, … : Lending growth may be running in place, and net interest margins are under pressure, but positive operating leverage helped the banks beat expectations, and they are returning gobs of cash to their shareholders. … are quite constructive about the economy, … : The big banks’ CFOs and CEOs were uniformly bullish about the U.S. economy based on their perceptions of household and corporate health. … expect stellar credit performance to continue for the foreseeable future, … : Net charge-off and non-performing loan ratios are near all-time lows and the banks don’t see them rising any time soon. … and appear to be willing to extend loans in all categories except commercial real estate: Every bank sees unattractive competition in commercial real estate lending and plans to continue shrinking its CRE loan book. Nothing To See Here Two-fifths of the companies in the S&P 500 have now reported their quarterly earnings, and after this week the share will be two-thirds. At the aggregate level, it appears as if investors’ worst fears will not be realized, just as they weren’t in the first two quarters of the year. 2018’s greater than 20% year-on-year growth, powered by the sharp cut in the top corporate income tax rate, has rolled off, but earnings have yet to contract. They were projected to fall by a little over 3% at the beginning of this reporting season, but repeated practice has allowed corporate managements to hone their underpromise-and-overdeliver skills to a fine point, and we won’t be surprised if they avert an outright contraction. Chart 1Profit Margins Are Being Squeezed, ...
Profit Margins Are Being Squeezed, ...
Profit Margins Are Being Squeezed, ...
Chart 2... But Neither Growing Compensation, ...
... But Neither Growing Compensation, ...
... But Neither Growing Compensation, ...
Earnings growth has been stagnant this year (Chart 1, bottom panel), though revenues have grown a little faster than nominal GDP (Chart 1, top panel), with which they should converge over time. Profit margins have finally come under pressure, though it’s not exactly clear why. Employee compensation is businesses’ biggest expense by far, and while it has risen from its lows, its growth decelerated last quarter (Chart 2). Dollar strength is a headwind for U.S.-based multinationals, but the dollar only really moved last quarter, after ending the first half where it started the year (Chart 3). Dollar gains weigh on revenues just as surely as they do on profits, though we would not be at all surprised if the share of non-dollar expenses is a good bit smaller than the widely quoted 33-40% estimate of S&P 500 constituents’ foreign sales. Chart 3... Nor A Stronger Dollar Is A Clear-Cut Culprit
... Nor A Stronger Dollar Is A Clear-Cut Culprit
... Nor A Stronger Dollar Is A Clear-Cut Culprit
Rate cuts have sparked a wave of mortgage refinancings, shifting wealth from mortgage investors to homeowners, who are more likely to spend it. Easier monetary conditions should help grease the skids for future earnings growth, both in the U.S. and abroad, and we expect the Fed will cut the fed funds rate by another 25 basis points when it meets this week. We have sympathy for the argument that since interest rates were not a meaningful constraint on growth, cutting them is not likely to provide much of a catalyst. Falling rates have provoked a wave of mortgage refinancings (Chart 4), however, so even if they don’t drive a big lending increase, they are already on their way to putting more money in the pockets of homeowners. Lower rates also reduce the risk of default by lowering debt-service costs for adjustable-rate borrowers, and by encouraging investors who need income to venture further out the risk curve, providing ample capital for borrowers seeking to extend their maturing obligations. Chart 4Putting More Money In Homeowners' Pockets
Putting More Money In Homeowners' Pockets
Putting More Money In Homeowners' Pockets
Follow The Money Chart 5Bank Stocks Are Probing Resistance
Bank Stocks Are Probing Resistance
Bank Stocks Are Probing Resistance
For two years, beginning in 2014, we reviewed the biggest banks’ earnings calls every quarter. The goal was to observe the give and take between bank management and sell-side analysts to gain some insight into the lending market and where it might be headed. We specifically sought information about banks’ willingness to lend, consumers’ and businesses’ appetite for credit, borrower performance, and the banks’ bottom-up perspective on the economy. We were also trying to glean insight into mortgage lending and what it might imply for residential investment. Studying the banks is a natural pursuit for a firm that was founded upon the insight that following money flows through the banking system would provide us with a window into the future direction of the economy and financial markets, and we return to it today. Our analysis is not meant to evaluate the banks’ own investment potential, though we note that they are testing resistance once again (Chart 5), and our Global Investment Strategy and U.S. Equity Strategy services both recommend overweighting them. This round of calls found bank management teams eager to ramp up their distributions to shareholders and optimistic about their ability to deploy technology to drive further efficiency gains. Big Banks Beige Book As a group, the banks were constructive on the economy. Despite widespread recession concerns, they do not see evidence of a looming slowdown from their interactions with consumers and businesses. Overall loan growth has remained around 5% over the last year and a half (Chart 6), while corporate and industrial (C&I) loan growth has ground to zero over the last thirteen weeks (Chart 7). The CEOs and CFOs do not see the C&I slump as the beginning of a worrisome trend, though, and global corporate bond issuance hit an all-time high in September, led by sizable issues from mega-cap U.S. companies. Businesses seeking credit are having no trouble getting it, though all the banks expressed an intention to continue cutting back their exposure to commercial real estate (CRE) loans. Chart 6Bank Lending Is Supporting Activity Without Risking Overheating
Bank Lending Is Supporting Activity Without Risking Overheating
Bank Lending Is Supporting Activity Without Risking Overheating
Chart 7Lending Momentum Has Slowed, But It's Okay
Lending Momentum Has Slowed, But It's Okay
Lending Momentum Has Slowed, But It's Okay
Another commercial real estate issue emerged across the calls: several of the biggest banks are consolidating their branch footprints. Prompted by questioning from one analyst, they touted branch closures as a way to enhance efficiency. We do not know if a reduction in bank demand for branch space would have an observable effect on demand for retail space across the country, but it certainly would in Manhattan. It seems possible that branch closures could pressure some retail lessors’ profitability, and thereby act as a drag on CRE whole-loan and CMBS performance at the margin. The Economy [C]onsumer spend and … confidence continue to be strong. I think business activity continues to be strong. I think it’s moderated somewhat because of … trade policy, but generally, I think the economy is solid. (Dolan, USB CFO) I think it’s fair to say that perhaps marginal investment is being impacted by trade fatigue in terms of the uncertainty, but … [there’s] still growth. … [T]he consumer is incredibly strong, … spending is strong, sentiment is strong, … credit is good. [I]t is true that [the recent ISM manufacturing and non-manufacturing surveys] were disappointing[,] so [there are] cautionary signs, but credit remains very good and there is still very healthy business activity. (Piepszak, JPM CFO) In general, our commercial customers continue to see moderate demand and no widespread issues related to trade uncertainty and interest rate changes. … [W]hile our customers are cautious, the most common concern they identify is their ability to hire enough qualified workers. (Shrewsberry, WFC CFO) Consumer payments up 6% year-to-date … [and 6% year-over-year 3Q growth in both our small business segment and total commercial loans] are tangible examples that the U.S. economy is still in solid shape, despite the worries and concerns about trade wars, capital investment slowdowns or other global macro conditions. (Moynihan, BAC CEO) Borrower Performance [W]e’ve had growth in the United States for the better part of 10 years [a]nd … credit is extraordinarily good. … [C]onsumer credit, commercial credit, wholesale is extraordinarily good, it can only get worse if you have a [turn in the] cycle. [Our guidance relates to expected performance across a full cycle.] We’re at the over-earning part of the cycle [beating the through-the-cycle expectation] in credit today, and [at] one point we’ll be at the under-earning part [pulling the full result down to our expectation]. (Dimon, JPM CEO) Our net charge-off rate remains near historic lows at 27 basis points (Chart 8). (Shrewsberry, WFC) Chart 8C&I Charge-Off Rates Are Near Their Historic Lows
C&I Charge-Off Rates Are Near Their Historic Lows
C&I Charge-Off Rates Are Near Their Historic Lows
Credit quality remains stable, and we are not seeing any early indicators in our portfolio that cause us concern. (Cecere, USB CEO) Banks see no broad credit warning signs, but they're perfectly happy to let non-bank lenders take some commercial real estate share at this point of the cycle. We closely monitor our commercial portfolio for signs of weakness and credit quality indicators remain strong. (Shrewsberry, WFC) Lender Willingness [W]e are mindful that at some point, the industry will experience a credit downturn, and we remain disciplined in terms of origination quality and our long-term strategy of remaining within our defined credit box regardless of the competitive environment. (Cecere, USB) [Commercial] real estate banking [declined] as we remain selective, given where we are in the cycle. (Piepszak, JPM) [Commercial real estate lending] is one market where there’s late cycle behavior, there’s lots of non-bank competitors, … more than bank competitors. And so we really have to pick our spots in order to maintain our risk/reward, credit and pricing in loan terms quality. … I wouldn’t look for it to grow meaningfully until the cycle turns and our best customers have really interesting opportunities to put their own capital to work. (Shrewsberry, WFC) [Our declining commercial real estate lending is] really a function of [competition] that we’re not comfortable with. (Cecere, USB) Banks’ Real Estate Demand [C]ustomer behaviors are changing. The amount of transaction activity that’s happening in the branches is significantly less[.] In fact, … roughly 70, 80% of it goes through the digital channel today. So that gives us the opportunity to really reconfigure the branch network, both in terms of size and numbers[.] I think those trends are going to continue … , and … we may accelerate or increase some of [our right-sizing] activity[.] (Dolan, USB) Teller and ATM transactions declined 6% from a year ago, reflecting continued customer migration to digital channels. We’ve consolidated 130 branches in the first nine months of this year, including 52 branches in the third quarter. (Shrewsberry, WFC) [D]o we continue to work on real estate configurations that were down 50 million square feet from the start of 2010[?] [C]an we push [the occupancy rate] up, can we densify the space[?] (Moynihan, BAC) Investment Implications While rereading the April 2014 U.S. Investment Strategy that reviewed the big banks’ 1Q14 earnings calls, we were struck by how similar the picture is today. Back then, we described the central challenge for investors as choosing between mushy fundamentals and generous monetary policy that might be expected to inspire a valuation overshoot. As we do now, we anticipated that activity would soon pick up, providing markets with a fundamental boost, but we also had the sense that “policy settings are such that no much more than the status quo may be required to keep the party going.” We reiterated our equity overweight and our preference for spread product over Treasuries. Between inflection points, investing is an exercise in trend following, and there's no reason to believe that the monetary policy trend is about to change without clear advance notice. Although we are congenitally optimistic about our species and our country, we are not perma-bulls. We simply recognize that, between inflection points, investing is an exercise in trend following, no matter how uncomfortable it may make an investor to leave the portfolio dials alone for a while. As long as the monetary policy backdrop remains extremely accommodative across all of the major developed economies, and central banks are set to add even more accommodation before they start removing it, the bullish trend will remain in place. The prospective real returns of cash and highly-rated sovereign bonds are likely to remain negative for a while against that backdrop, encouraging investors to direct their marginal investment dollar to risk assets as long as a fundamental reversal is not imminent. We think a fundamental inflection is at least two years away, and therefore continue to believe that it is too early to de-risk investment portfolios. We reiterate our recommendation that investors remain at least equal weight equities in balanced portfolios, and at least equal weight spread product within their fixed-income allocations. Doug Peta, CFA Chief U.S. Investment Strategist dougp@bcaresearch.com
Highlights The interim “phase 1” trade agreement reached last week represents a significant step forward towards reaching a détente in the China-U.S. trade war. Regardless of what happens next in the Brexit negotiations, a hard exit will be avoided. Stay long the pound. U.S. earnings growth is likely to be flat in the third quarter, in contrast to bottom-up expectations of a year-over-year decline. Earnings growth should pick up as global growth reaccelerates by year end. Stronger global growth will put downward pressure on the U.S. dollar. Remain overweight global equities relative to bonds over a 12-month horizon. Cyclical stocks should start to outperform defensives. Financials will finally have their day in the sun. Favorable Tradewinds In our Fourth Quarter Strategy Outlook published two weeks ago, we argued that global equities had entered a “show me” phase, meaning that tangible evidence of a de-escalation in the trade war and a recovery in global growth would be necessary for stock indices to move higher.1 We received some positive news on the trade front last Friday. In exchange for suspending the planned October 15th hike in tariffs from 25% to 30% on $250 billion of Chinese imports, China agreed to purchase $40-$50 billion of U.S. agricultural products per year, improve market access for U.S. financial services companies, and enhance the transparency of currency management. Admittedly, there is still much to be done. The text of the agreement has yet to be finalized. Both sides are aiming to conclude the deal by the time of the APEC summit in Santiago, Chile on November 16-17. Considering that a number of key issues remain unresolved, including what sort of enforcement and resolution mechanisms will be included in the deal, further delays or even a breakdown in the talks are possible. The interim deal agreed upon last week also punts the thorny issue of how to handle intellectual property protections to a “phase 2” of the negotiations slated to begin soon after “phase 1” is wrapped up. According to the independent and bipartisan U.S. Commission on the Theft of American Intellectual Property, U.S. producers lose between $225 and $600 billion annually from IP theft.2 China has often been considered among the worst offenders. Given the importance of the IP issue, meaningful progress will be necessary to ensure that tariffs of 15% on about $160 billion of Chinese imports are not introduced on December 15th. Trump Wants A Deal Despite the many hurdles that remain, last week’s developments significantly raise the prospects of a détente in the 18 month-long trade war. As a self-professed “master negotiator,” President Trump has put his credibility on the line by describing the negotiations as a “love fest,” calling the trade pact “the greatest and biggest deal ever made for our Great Patriot Farmers,” and saying that he has “little doubt” that a final agreement will be reached. Just as he did with NAFTA’s successor USMCA – a deal that is substantively similar to the one it replaced – Trump is likely to shift into marketing mode, trumpeting the “tremendous” new deal that he has negotiated on behalf of the American people. From a political point of view, this makes perfect sense. Rightly or wrongly, President Trump gets better marks from voters on his handling of the economy than anything else (Chart 1). A protracted trade war would undermine the U.S. economy, thereby hurting Trump’s re-election prospects. Chart 1Trump Gets Reasonably High Marks On His Handling Of The Economy, But Not Much Else
Kumbaya
Kumbaya
Chart 2Chinese Business Are Not Paying The Bulk Of The Tariffs
Kumbaya
Kumbaya
Notwithstanding his claims to the contrary, the evidence firmly suggests that U.S. consumers, rather than Chinese businesses, are paying the bulk of the tariffs. Chart 2 shows that U.S. import prices from China have barely declined, even as tariff rates on Chinese imports have risen. To the extent that the latest rounds of tariffs are focused on Chinese goods for which there is little U.S. or third-country competition, the ability of Chinese producers to pass on the cost of the tariffs will only increase. If all the tariff hikes that have been announced were implemented, the effective tariff rate on Chinese imports would rise from around 15% as of late August to as high as 25% in December (Chart 3). Such a tariff rate would reduce U.S. household disposable incomes by over $100 billion, wiping out most of the gains from the 2017 tax cuts. Trump can’t let the trade war reach this point. Chart 3Successive Rounds Of Tariffs Have Started To Add Up
Successive Rounds Of Tariffs Have Started To Add Up
Successive Rounds Of Tariffs Have Started To Add Up
Will China Play Hardball? One risk to a favorable resolution to the trade war is that China will increasingly see Trump as desperate to make a deal. This could lead the Chinese to take a hardline stance in the negotiations. While this risk cannot be dismissed, we would downplay it for three reasons: First, even though China’s exporters have been able to maintain some degree of pricing power during the trade war, trade volumes have still suffered, with exports to the U.S. down nearly 22% year-over-year in September. Second, as the crippling sanctions against ZTE have demonstrated, China remains highly dependent on U.S. technologies. This gives Trump a lot of leverage in the trade negotiations. Chart 4Who Will Win The 2020 Democratic Nomination?
Kumbaya
Kumbaya
Third, as Trump himself likes to say, China will find it easier to negotiate with him in his first term in office than in his second. Hoping that Trump would lose his re-election bid might have made sense for China a few months ago when Joe Biden was riding high in the polls; but now that Elizabeth Warren has emerged as the favorite to secure the Democratic nomination, that hope has been dashed (Chart 4). As we noted several weeks ago, China is likely to find Warren no less vexing on trade matters than Trump.3 All this suggests that China, just like Trump, will look for ways to cool trade tensions over the coming weeks. Brexit Breakthrough? As we go to press, the prospects for a Brexit deal have brightened. Although the details have yet to be released, the proposed deal would effectively put Northern Ireland in a veritable quantum superposition where it is both in the European common market and in the U.K. at the same time. This feat will be achieved by keeping Northern Ireland within the U.K. political jurisdiction but still aligned with EU regulatory standards. Negotiations could still go awry. Despite Prime Minister Boris Johnson’s assurance that he secured “a great new deal,” the Conservative’s coalition partner, the Northern Irish Democratic Unionist Party, is still withholding its support for the accord. Labour leader Jeremy Corbyn has also rejected the deal, saying that it is even worse than Theresa May’s originally proposed pact. Regardless of what transpires over the coming days, we continue to think that a hard Brexit will be avoided. Throughout the entire Brexit ordeal, we have argued that there was insufficient political support within the British ruling class for a no-deal Brexit. That conviction has only grown as polling data has revealed that an increased share of voters would choose to stay in the EU if another referendum were held (Chart 5). We have been long the pound versus the euro since August 3, 2017. The trade has gained 6.6% over this period. Investors should stick with this position. Based on real interest rate differentials, GBP/EUR should be trading near 1.30 rather than the current level of 1.16 (Chart 6). We expect the cross to move towards its fair value as hard Brexit risks diminish further. Chart 5Brexit Angst: A Case Of Bremorse
Brexit Angst: A Case Of Bremorse
Brexit Angst: A Case Of Bremorse
Chart 6Substantial Upside In The Pound
Substantial Upside In The Pound
Substantial Upside In The Pound
Global Growth Prospects Improving Chart 7Growth Slowdown Has Been More Pronounced In The Soft Data
Growth Slowdown Has Been More Pronounced In The Soft Data
Growth Slowdown Has Been More Pronounced In The Soft Data
Chart 8Manufacturing Output Rebounds Amid The ISM Slump
Manufacturing Output Rebounds Amid The ISM Slump
Manufacturing Output Rebounds Amid The ISM Slump
A détente in the trade war and a resolution to the Brexit saga should help support global growth. The weakness in the economic data has been much more pronounced in so-called “soft” measures such as business surveys than in “hard” measures such as industrial production (Chart 7). Notably, U.S. manufacturing output has stabilized over the past three months, even as the ISM manufacturing index has swooned (Chart 8). As sentiment rebounds, the soft data should improve. Global financial conditions have eased significantly over the past five months, thanks in large part to the dovish pivot by most central banks (Chart 9). The net number of central banks cutting rates generally leads the global manufacturing PMI by 6-to-9 months (Chart 10). In addition, the Fed’s decision to start buying Treasurys again will increase dollar liquidity, thus further contributing to looser financial conditions. Chart 9Easier Financial Conditions Will Boost Global Growth
Easier Financial Conditions Will Boost Global Growth
Easier Financial Conditions Will Boost Global Growth
Chart 10The Effects Of Easing Monetary Policy Should Soon Trickle Down To The Economy
The Effects Of Easing Monetary Policy Should Soon Trickle Down To The Economy
The Effects Of Easing Monetary Policy Should Soon Trickle Down To The Economy
Stepped-up Chinese stimulus should also help jumpstart global growth. Chinese money and credit growth both came in above expectations in September. The PBoC has been cutting reserve requirements, which has helped bring down interbank rates. Further cuts to the medium-term lending facility are likely over the remainder of this year. Changes in Chinese credit growth lead global growth by about nine months (Chart 11). Chart 11Chinese Credit Should Support The Recovery In Global Growth
Chinese Credit Should Support The Recovery In Global Growth
Chinese Credit Should Support The Recovery In Global Growth
Stay Overweight Global Equities While the road to finalizing a “phase 1” trade deal in time for the APEC summit is likely to be a bumpy one, we continue to reiterate our recommendation that investors overweight global stocks relative to bonds over a 12-month horizon. We expect to upgrade EM and European equities over the coming weeks once we see a bit more evidence that global growth is bottoming out. Ultimately, the trajectory of stocks will hinge on what happens to earnings. The U.S. earnings season began this week. As of last week, analysts expected S&P 500 EPS to decline by 4.6% in Q3 relative to the same quarter last year according to data compiled by FactSet. Keep in mind, however, that EPS growth has beaten estimates by around four percentage points since 2015 (Chart 12). Thus, a reasonable bet is that U.S. earnings will be flat this quarter, clearing a low bar of expectations. Chart 12Actual EPS Has Generally Beaten Estimates
Kumbaya
Kumbaya
Chart 13Earnings And Nominal GDP Growth Tend To Move In Lock-Step
Earnings And Nominal GDP Growth Tend To Move In Lock-Step
Earnings And Nominal GDP Growth Tend To Move In Lock-Step
The fact that 83% of the 63 S&P 500 companies that have reported earnings thus far have beaten estimates – better than the historic average of 64% – supports the view that current Q3 estimates are too dour. Looking out, earning growth should pick up as nominal GDP growth accelerates (Chart 13). European and EM equities generally outperform the global benchmark when global growth is speeding up (Chart 14). This is due to the more cyclical nature of their stock markets. In addition, as a countercyclical currency, the dollar tends to weaken in a faster growth environment. A weaker dollar disproportionately benefits cyclical stocks (Chart 15). Chart 14EM And Euro Area Equities Usually Outperform When Global Growth Improves
EM And Euro Area Equities Usually Outperform When Global Growth Improves
EM And Euro Area Equities Usually Outperform When Global Growth Improves
Chart 15Cyclical Stocks Will Outperform If The Dollar Weakens
Cyclical Stocks Will Outperform If The Dollar Weakens
Cyclical Stocks Will Outperform If The Dollar Weakens
We would include financials in our definition of cyclical sectors. As global growth improves, long-term bond yields will increase at the margin. Since central banks are in no hurry to raise rates, yield curves will steepen. This will boost bank profits and share prices (Chart 16). Cyclical stocks are currently quite cheap compared to defensives (Chart 17). Likewise, non-U.S. equities are quite inexpensive compared to their U.S. peers, even if one adjusts for differences in sector composition across regions. While U.S. stocks trade at 17.5-times forward earnings, international stocks trade at a more attractive forward PE ratio of 13.7. The combination of higher earnings yields and lower interest rates abroad implies that the equity risk premium is roughly two percentage points higher outside the United States (Chart 18). Chart 16Steeper Yield Curves Will Benefit Financials
Steeper Yield Curves Will Benefit Financials
Steeper Yield Curves Will Benefit Financials
Chart 17Cyclical Stocks Are More Attractive Than Defensives
Cyclical Stocks Are More Attractive Than Defensives
Cyclical Stocks Are More Attractive Than Defensives
Chart 18The Equity Risk Premium Is Quite High, Especially Outside The U.S.
The Equity Risk Premium Is Quite High, Especially Outside The U.S.
The Equity Risk Premium Is Quite High, Especially Outside The U.S.
We expect to upgrade EM and European equities over the coming weeks once we see a bit more evidence that global growth is bottoming out. Peter Berezin, Chief Global Strategist Global Investment Strategy peterb@bcaresearch.com Footnotes 1Please see Global Investment Strategy, “Fourth Quarter 2019 Strategy Outlook: A ‘Show Me’ Market,” dated October 4, 2019. 2 “Update to IP Commission Report: The Report of the Commission on the Theft of American Intellectual Property,” The National Bureau of Asian Research, 2017. 3Please see Global Investment Strategy Weekly Report, “Elizabeth Warren And The Markets,” dated September 13, 2019. Strategy & Market Trends MacroQuant Model And Current Subjective Scores
Kumbaya
Kumbaya
Strategic Recommendations Closed Trades
Brief Market Overview The S&P 500 convulsed last week, as a slew of weaker-than-expected data shattered investors’ confidence in the longevity of the business and profit cycles. Importantly, both ISM surveys declined month-over-month, arguing that the manufacturing sector’s ails are infecting services industries (second panel, Chart 1). Chart 1The U.S. Dollar Is The Key Indicator To Monitor
The U.S. Dollar Is The Key Indicator To Monitor
The U.S. Dollar Is The Key Indicator To Monitor
The “In Fed We Trust” doctrine will get severely tested in upcoming weeks. The Federal Reserve’s reaction function to the poor data took center stage with bond investors pricing a 75% probability of a rate cut in late October. However, our four factor EPS growth model continues to predict that earnings will remain weak for the rest of 2019 (not shown). Thus, next year’s 10% EPS growth is wishful thinking and profit growth will begin to bottom in Q1/2020 at the earliest. Absent profit growth, stocks will have to face reality and continue to drift lower. Importantly, the U.S. dollar – the great reflator – is the key determinant of both profit and global economic growth in coming quarters. The third panel of Chart 1 shows that currently that are no advanced economy central banks that have a policy rate higher than the Fed. Historically, this has been U.S. dollar bullish and has weighed on SPX momentum (trade-weighted U.S. dollar shown inverted, bottom panel, Chart 1). It remains to be seen if aggressive Fed easing can change this relationship, stave off recession and engineer a soft landing. U.S. Equity Strategy’s view remains intact that things will get worse before they get better and therefore a cautious overall U.S. equity market stance is still warranted on a cyclical 9-12 month time horizon. NIPA VS. SPX Profit Margins On the eve of earnings season, we decided to delve deeper into corporate profits and margins, and tally where we are in the cycle, specifically with regard to profit margin drivers. To start off, we compare overall economy profits, as measured by the NIPA accounts, with SPX earnings (Chart 2). While a lot of ink has been spent on this topic and the differences between these two profit measures are more or less well recognized and understood, Kenneth A. Petrick’s commentary on the issue is worth re-reading. Without going into much detail, according to Petrick four key reasons explain the differences between NIPA and S&P 500 profits: “coverage, changing shares, industry representation and accounting principles”.1 What interests us is the leading property of NIPA profits. Importantly, NIPA profits have peaked in advance of SPX earnings in the previous three cycles. Economy-wide profits may have already peaked this cycle, warning that the SPX earnings juggernaut is long in the tooth (top panel, Chart 2). Chart 2Earnings Fatigue
Earnings Fatigue
Earnings Fatigue
Given that NIPA profits include a broader universe of firms, small and medium enterprise (SME) profits are weighing on the overall NIPA number. The recent drubbing in economically hypersensitive S&P 400 (mid-caps) and S&P 600 (small-caps) profit estimates confirms this SME profit deterioration and forewarns that SPX profits are likely running out of fuel. While the SPX has not cracked yet courtesy of the heavyweight S&P software index, the Value Line Arithmetic (VLA, gauging the average stock) and Value Line Geometric (VLG, gauging the median stock) indexes appear to have peaked and correspond better to the NIPA profits as these indexes are broad-based are not market capitalization weighted (bottom panel, Chart 3). Chart 3Top Chart Of The Year
Top Chart Of The Year
Top Chart Of The Year
Worryingly for the S&P 500, the VLG index is an excellent leading indicator of the SPX. Based on empirical evidence, it has led the SPX tops in the past three cycles, making it a serious contender for our “Chart Of The Year” award (top panel, Chart 3). Not only have NIPA profits likely crested, but NIPA profit margins are in steep retreat and have definitively peaked. Similar to earnings, NIPA margins lead SPX profit margins (top panel, Chart 4). Importantly, the delta between the two margin gauges is surprisingly wide. This margin gap now sits nearly three standard deviations above the historical mean and has only been wider during the dotcom bubble (bottom panel, Chart 4). Our sense is that such an acute divergence is unsustainable and will likely narrow via a mean reversion in SPX margins. Chart 4Mind The Gap
Mind The Gap
Mind The Gap
Primary Margin Drivers Taking a deeper dive into traditional margin drivers is instructive. We use SPX margins since 1960 and prior to that we have used reconstructed SPX earnings divided by U.S. GDP (gauging SPX sales) to recreate a longer-term equity market profit margin proxy. The primary net-profit margin drivers are: Interest rates, Tax rates, Labor costs / Globalization, And corporate pricing power. Globalization has been another significant profit margin booster in the U.S. As countries are more outward looking, trade flourishes and openness to trade allows the free flow of capital to take advantage of profit maximizing projects. The bond bull market since the early 1980s has been a clear contributor to the secular advance in profits margins. Interest rates cut both ways and the big rise in long-term bond yields post World War II ate into margins. If the bond bull market is ending, then interest rates will start eating into margins anew (interest rates shown inverted, top panel, Chart 5). Intuitively, taxes and margins are also inversely correlated (tax rate shown inverted, bottom panel, Chart 5). Following the 2018 fiscal easing package, the effective corporate tax rate is now hovering in the mid-teens and explains the jump to all-time highs in SPX margins. We doubt corporate tax rates will drop further. At best, taxes will be margin-neutral in the coming years. Rising labor input costs squeeze margins and declining wages boost corporate profit margins. While labor’s share of income tentatively peaked in 1980, the late-1990s is this series’ ultimate peak and since then, it has been in a steady decline (employee compensation shown inverted, second panel, Chart 5). This labor input cost suppression has likely run its course and given that the U.S. economy is at full employment, wage inflation should also start denting margins. Globalization has been another significant profit margin booster in the U.S. As countries are more outward looking, trade flourishes and openness to trade allows the free flow of capital to take advantage of profit maximizing projects. Following the end of the Great Recession and similar to the Great Depression, de-globalization has commenced (third panel, Chart 5). Chart 5Primary...
Primary...
Primary...
Clearly, the Sino-U.S. war has accentuated and accelerated the inward movement of countries including Korea and Japan, and has had negative knock on effects on trade as evidenced by the now nearly two-year old global growth deceleration. The longer the U.S./China trade war remains unresolved, the deeper the cracks in the foundations of global trade. Such a backdrop is negative for profit margins, as inward looking countries prevent capital from being allocated most efficiently. Moreover, the uprooting of supply chains due to the trade war hurts margins and the redeployment of equipment in different jurisdictions will weigh on margins at a time when final demand suffers a setback. Corporate pricing power is deteriorating, which will negatively impact profit margins, given that they are joined at the hip. The current global manufacturing recession is wreaking havoc on selling prices around the world as a number of countries are experiencing outright producer price deflation. To compete, the U.S. corporate sector is doomed to suffer the same fate, which is depressing our Corporate Pricing Power proxy, an indicator composed of 60 top-down sector price series (bottom panel, Chart 6). Chart 6...And Secondary Profit Margin Drivers
...And Secondary Profit Margin Drivers
...And Secondary Profit Margin Drivers
Secondary Margin Drivers The ability of the overall corporate sector to lift prices is largely a function of firming final demand (i.e. volumes) and a falling greenback for the 40% of SPX sales that are international. This leads us to two secondary profit margin drivers: The trade-weighted U.S. dollar, And the yield curve. The ability of the overall corporate sector to lift prices is largely a function of firming final demand (i.e. volumes) and a falling greenback for the 40% of SPX sales that are international. Thus, not only is S&P 500 revenue growth and the trade-weighted U.S. dollar tightly inversely correlated, but also the same holds true for the greenback and profit margins (U.S. dollar shown inverted, top panel, Chart 6). Given that the U.S. dollar refuses to fall and is breaking out according to some Federal Reserve trade-weighted indexes, the path of least resistance for profit margins points south. The yield curve is related to the primary “interest rate” driver discussed above, but its most important signal concerns the business cycle. Empirically, profit margins mean revert at the onset of recession (yield curve shown advanced, middle panel, Chart 6). As a reminder, parts of the yield curve inverted last December, signaling that a corporate profit margin squeeze is looming. Income Inequality And Margins Finally, we make an interesting geopolitical observation. Rising profit margins are synonymous with wealth accruing to the top 1% of U.S. families and vice versa. This relationship dates back to the late-1920s, as far back as our dataset goes. Using Piketty and Saez data excluding capital gains it is clear that profit margin expansion accentuates income inequality (Chart 7).2 Chart 7Income Inequality And Margins
Income Inequality And Margins
Income Inequality And Margins
Rising profit margins lead to rising profits. Because families at the top of the income distribution are more often than not business owners, income disparities are the widest when margins are in overshoot territory. Eventually this income chasm comes to a head and potentially explains the rise of populism. Income re-distribution is therefore a rising probability event in the coming decades.3 Bottom Line: Unequivocally, all six key drivers we have identified (interest rates, tax rates, labor costs / globalization, corporate pricing power, yield curve and the U.S. dollar) are firing warning shots that profit margins have peaked and a “catch down” phase of SPX margins to NIPA margins is in store in the coming quarters. Anastasios Avgeriou, U.S. Equity Strategist anastasios@bcaresearch.com Footnotes 1 https://apps.bea.gov/scb/pdf/national/niparel/2001/0401cpm.pdf 2 https://eml.berkeley.edu/~saez/TabFig2017.xls 3 Please see BCA Geopolitical Strategy Special Report, “The End Of The Anglo-Saxon Economy?” dated April 13, 2016, available at gps.bcaresearch.com.
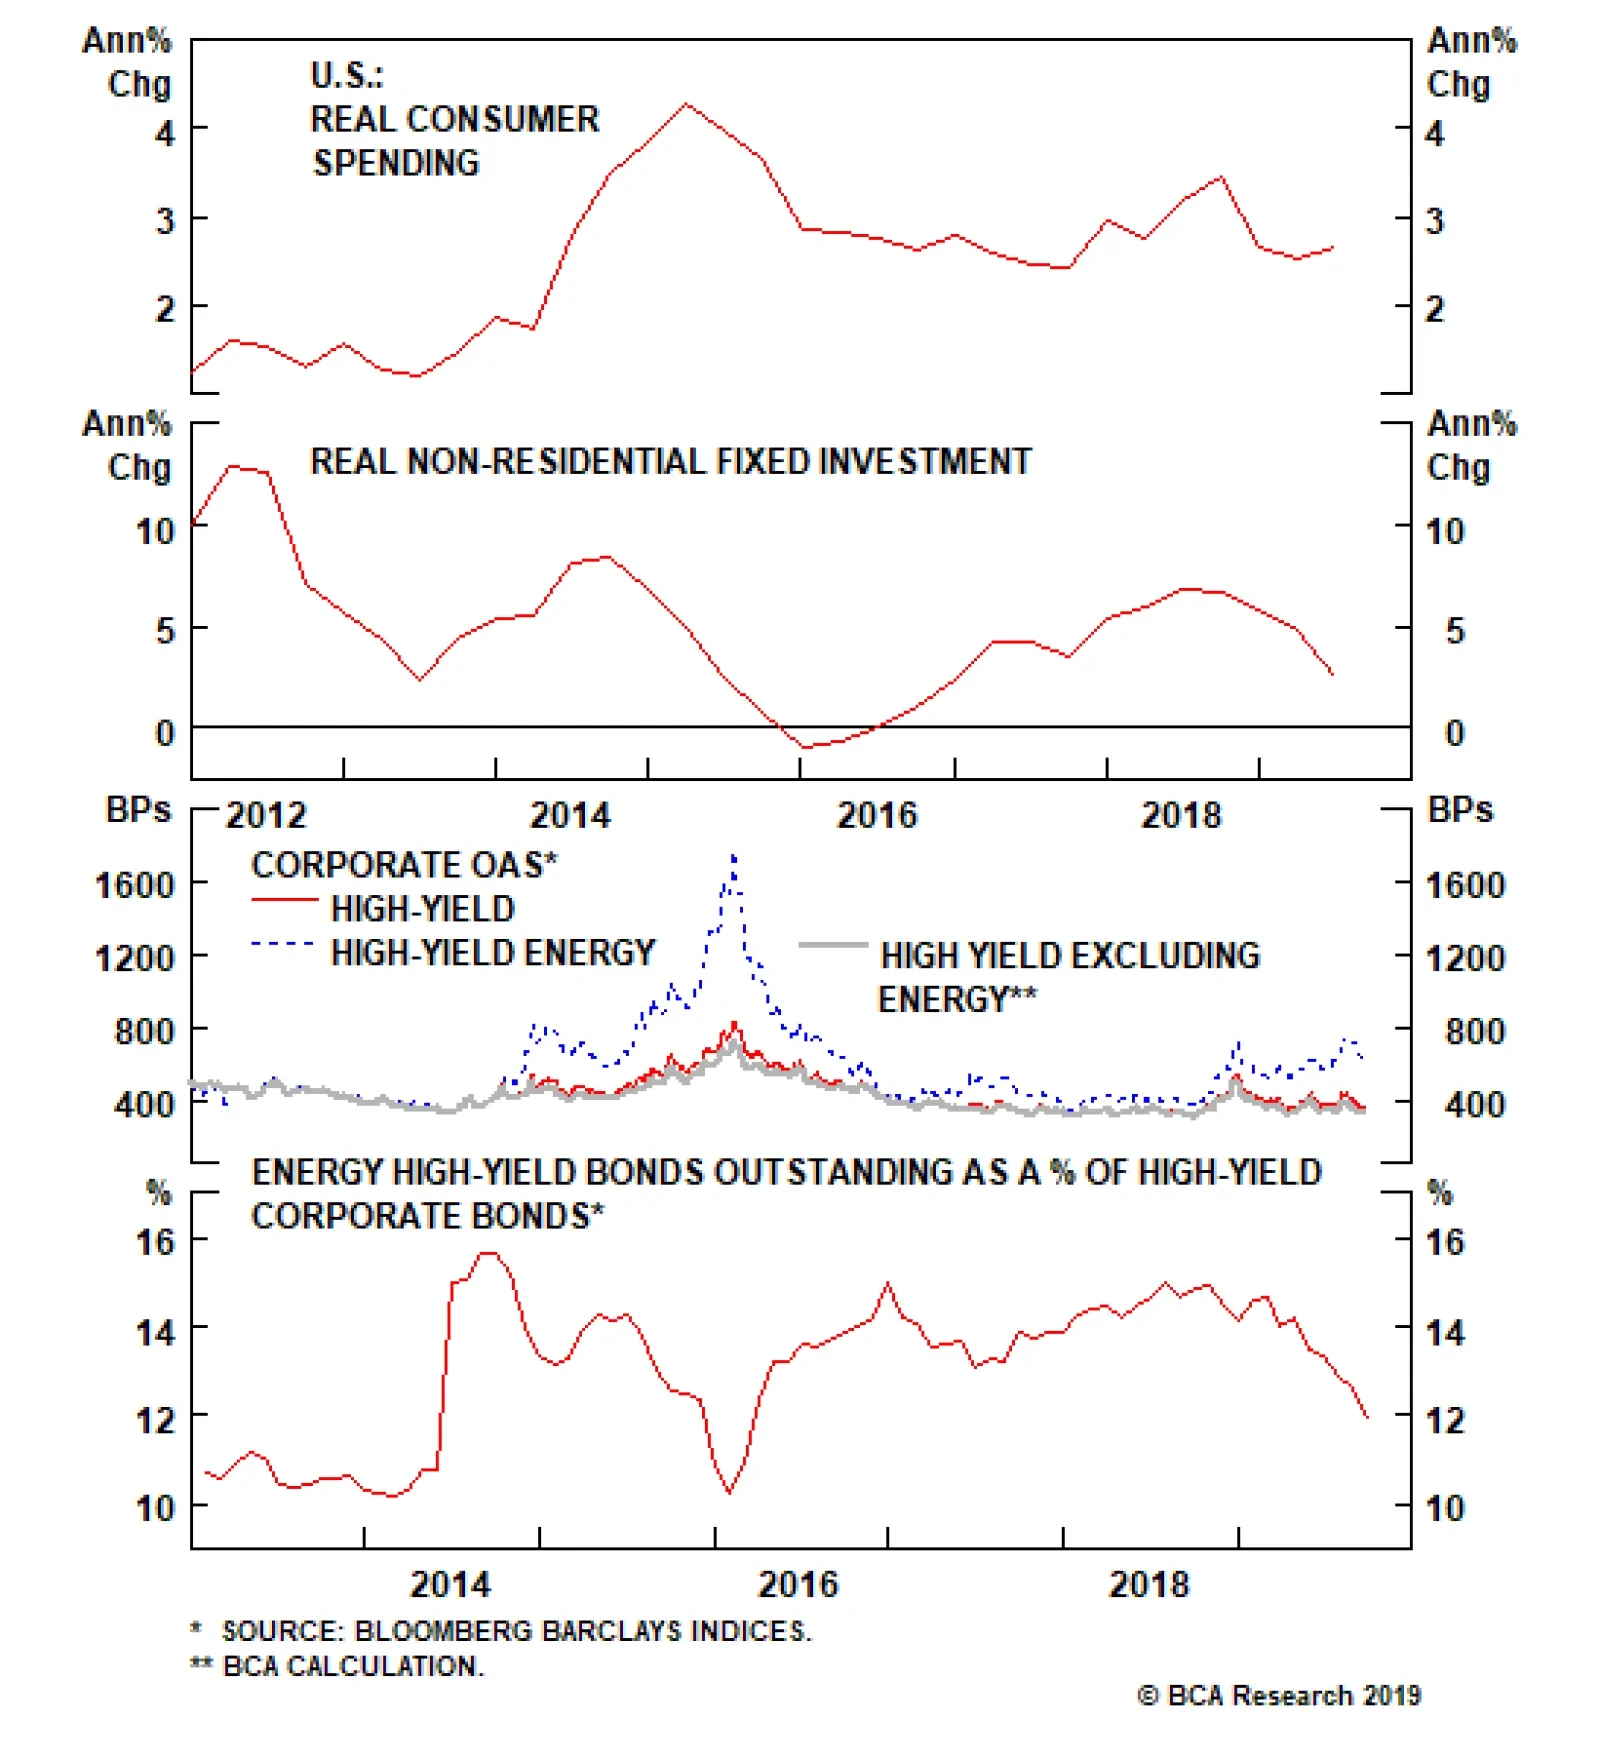
Energy production’s increasing role within the U.S. economy came to the fore when crude prices collapsed from $107 to $26/barrel between June 2014 and February 2016. Per the ‘70s foreign-oil-dependency template, households would have gotten a huge…
Dear Client, Owing to BCA’s 40th Annual Investment Conference at the Grand Hyatt in New York City next week, there will be no report on Wednesday, September 25. We will return to our regular publication schedule on Wednesday, October 2. I look forward to meeting China Investment Strategy clients in person at our conference. Please do not hesitate to say hello. Best regards, Jing Sima China Strategist Highlights China’s economy should bottom as a result of the pickup in credit that occurred earlier this year, but the circumstances surrounding the ongoing slowdown are unprecedented in nature. This raises the risk that policymakers will have to do more in order to stabilize growth. Optimism surrounding recent Chinese policy announcements is misguided. For now, Chinese policymakers are not upping the pace of stimulus, which underscores the risk to our forecast that growth will soon stabilize. A more meaningful shot of reflation will occur in the coming few months if the economy slows further, but policymakers will be reactive rather than proactive. Barring a successful (even if temporary) trade deal, we expect more weakness in the RMB as a passive source of reflation to aid the economy. But currency devaluation is a double-edged sword, and cannot be counted on to single-handedly stabilize China’s economy. Over a 6-12 month time horizon, investors should continue to overweight Chinese stocks versus the global benchmark in currency hedged terms, but the risk of further underperformance over the near-term is high. Feature Chinese economic growth continues to weaken. The Caixin manufacturing PMI for August, along with the New Export Orders component of the manufacturing PMI released by China’s National Bureau of Statistics, registered small gains in August from July. However, any hopes pinned on this being an emerging sign of turnaround in the Chinese economy soon faded. A slew of August data showed continued sluggishness in exports, an even worse domestic-demand picture, and further deflation in ex-factory producer prices. Most importantly, we continue to witness “half-measured” stimulus. In explaining past and existing economic weakness, many investors point to the trade war with the U.S. However, Charts 1 and 2 serve as an important reminder that domestic weakness predates U.S. protectionism. The trade war tensions and tariffs are magnifying this weakness, but China’s slowdown is, at its core, policy driven. Chart 1Weakness In Chinese Economy Predates The Trade War...
Weakness In Chinese Economy Predates The Trade War...
Weakness In Chinese Economy Predates The Trade War...
Chart 2…And Has Been A Byproduct Of Financial De-Risking Campaign
...And Has Been A Byproduct Of Financial De-risk Companion
...And Has Been A Byproduct Of Financial De-risk Companion
Given this, investors should be more focused on identifying signs of a major reversal in policy. So far Chinese policymakers have been firmly holding their line in keeping credit growth somewhat in check. Policy-Induced Economic Stabilization: A Tough Forecast To Make Our baseline view is that the current scale of stimulus should be sufficient to stop economic growth from decelerating further. Two factors support our baseline view: The direct impact from tariffs on the Chinese economy is limited. Growth in China’s exports to the U.S. in 2019 is likely to be somewhere close to a 9% contraction, down from the 10.8% increase registered in 2018. Based on a simple calculation with all else being equal, this is likely to shave 1.6 percentage points off China’s total export growth and 0.3 percentage points off nominal GDP growth in 2019. This is not trivial, but arguably not devastating to China’s aggregate economy either. There is anecdotal evidence suggesting some Chinese exports have been re-routed to peripheral countries such as Vietnam and Taiwan in order to avoid the U.S. import tariffs on Chinese goods (Chart 3). This suggests that real growth in Chinese exports to the U.S. could be stronger than the current data suggests. Chart 3Exports Finding Alternative Routes?
Exports Finding Alternative Routes?
Exports Finding Alternative Routes?
Chart 4Bottoming in the economy In Sight?
Bottoming in the economy In Sight?
Bottoming in the economy In Sight?
Credit growth has picked up since the beginning of this year. Based on the historical relationship between China’s credit impulse (measured by the 12-month change in BCA’s adjusted total social financing as a percentage of nominal GDP) and domestic demand, the economy should bottom out at some point before the end of the year (Chart 4). Although, import growth, a key measure of China’s domestic demand, remains in deep contraction, some of its components that usually lead industrial activities are showing signs of improvement (Chart 5). Chart 5Early Signs of Improved Domestic Demand
Early Signs of Improved Domestic Demand
Early Signs of Improved Domestic Demand
Chart 6Manufacturing Investment Growth In Contraction
Manufacturing Investment Growth In Contraction
Manufacturing Investment Growth In Contraction
However, our level of confidence that the existing stimulus will be sufficient to stabilize economic growth is lower than it otherwise would be. This is due to the fact that the challenges facing the Chinese economy are unprecedented in nature. For one, the indirect impact of the trade war on China’s economy through business sentiment and manufacturing investment has yet to be fully revealed in the data. As Chart 6 shows, manufacturing investment is already deteriorating, particularly in export-intensive sectors. The ultimate impact on investment from the trade war is still uncertain, and can pose significant downside risks to the Chinese economy in the coming year. More importantly, as Chart 7 suggests, a weak credit impulse will at best lead to a very subdued economic recovery even if growth does indeed bottom. In terms of the link between policy and the economy, Chart 8 points out a key difference between the current slowdown and previous down cycles: Monetary conditions have been ultra-loose for more than a year, but current economic conditions remain on a downward trend – much more so than in the previous cycles. This huge gap and lag in economic response to monetary stance can only be explained by an impaired policy transmission mechanism. An expansionary monetary stance has not proportionally translated into credit expansion or economic recovery. This challenges the effectiveness and timeliness of future monetary loosening in terms of its ability to revive the Chinese economy. Chart 7Current Pace Of Credit Growth Will Lead To A Fragile Recovery, At Best
Current Pace Of Credit Growth Will Lead To A Fragile Recovery, At Best
Current Pace Of Credit Growth Will Lead To A Fragile Recovery, At Best
Chart 8An Impaired Monetary Policy Transmission
An Impaired Monetary Policy Transmission
An Impaired Monetary Policy Transmission
The scale and timing of the current stimulus measures have been “behind the curve.” Therefore, the historical relationship between China’s credit impulse and the turning points in the economy may not apply to the current cycle. Bottom Line: China’s economy should bottom as a result of the pickup in credit that occurred earlier this year, but the circumstances surrounding the ongoing slowdown are unprecedented in nature. This raises the risk that policymakers will have to do more in order to stabilize growth. An Unusually Prudent Policy Bias For some, the recent slew of announcements on upcoming stimulus qualified as a major shift in policy bias. Our analysis suggests otherwise. The bank reserve requirement ratio (RRR) cuts announced late in August have been among the most cited policy announcements, with the PBoC stating that the new cuts will release RMB 900 billion of fresh liquidity.1 In our view, this measure is more about maintaining liquidity in China’s large commercial banks than adding to it (on a net basis). Chart 9RRR Cuts May Not Be That Stimulative
RRR Cuts May Not Be That Stimulative
RRR Cuts May Not Be That Stimulative
Chart 9 shows that, in previous episodes of meaningful RMB depreciation against the U.S. dollar, in order to prevent the RMB from falling at an undesirable pace, PBoC has had to intervene in the spot market by selling U.S. dollars. The selling of U.S. dollars in this round of RMB depreciation has been much more muted than in 2015-2016, but we suspect some intervention has taken place following each bout of escalation in the trade war. This has had a liquidity tightening effect on banks, as selling central bank foreign-exchange reserves reduces liquidity in the banking system. It is very likely that following the PBoC’s defense of the RMB in the last two months, the RRR cuts were a measure aimed at preventing a liquidity crunch ahead of the September tax season. If true, this hardly qualifies as net new stimulus for the economy. There were also two important announcements that came out of the September 5th State Council meeting: The entire 2019 quota for local government special project bonds must be issued by the end of September, and all money raised from the bonds must be disbursed to projects by the end of October. This too is not exactly “stimulative,” as over 90% of the 2019 local government special-project bond quota has already been issued. This leaves less than 10% of the quota outstanding, an 80% decline from what was issued last September. On a quarterly basis, special-bond issuance in the third quarter of 2019 will end up being 30% lower than the same period last year. It was also announced that, in order to meet the local needs for construction of key projects, part of 2020’s special bonds quota will be allocated in advance to ensure that the funds are available for use at the beginning of next year.2 While the announcement did not indicate how much in the way of special-purpose bonds local governments are allowed to frontload through the remainder of this year, we maintain our view that this is not a policy shift towards materially larger stimulus than we have seen so far this year: Without an additional quota, local government special-purpose bond issuance would essentially fall to zero in the fourth quarter as the 2019 target would be hit by the end of September. Thus, the frontloading of next year’s bond issuance will only “fill the gap” between now and year-end. As special-purpose bond issuance only accounts for 15% of total funding for local governments’ infrastructure spending, the new measure alone is unlikely to meaningfully accelerate investment growth.3 We have noted in previous reports that in order for local governments to accelerate spending within the current fiscal budget framework, one of three things must occur: more direct funding from the central government, an acceptance by policymakers of more shadow bank lending, or a larger quota for bond issuance. So far we have not seen any of the above-mentioned shifts in policy. Chart 10Local Governments Tightening Belt This Year
Local Governments Tightening Belt This Year
Local Governments Tightening Belt This Year
The only positive sign for local government spending has been a pickup in land sales in Q2, which makes up more than 70% of local government revenues. But, it is far from making up the shortfalls in local governments’ budgets (Chart 10). Local governments are facing considerable fiscal pressure as annual tax revenue growth has fallen to near zero. Critically, the government’s regulatory stance on local government budgets has continued to tighten: Local governments have been ordered by the Ministry of Finance to liquidate state-owned assets to fund their budget deficits this year.4 This austerity measure is also being met with explicit reiteration from the Ministry of Finance on the central government not bailing out local governments, and that local government officials are held responsible for their own borrowing and spending.5 Bottom Line: Optimism surrounding recent Chinese policy announcements is misguided. For now, Chinese policymakers are not upping the pace of stimulus, which underscores the risk to our forecast that growth will soon stabilize. A more meaningful shot of reflation will occur in early 2020 if the economy slows further in Q4, but policymakers will most likely continue their reactive approach rather than proactive. RMB Depreciation: A Plus Or Peril? The RMB’s renewed depreciation since August initially raised fears among global investors that an uncontrolled decline might occur, but these fears have subsided over the past several weeks. Even though the USD-CNY exchange rate has broken the psychological 7 threshold, it is not forming a linear downward trend. Unlike after the August 2015 devaluation, it appears that the PBoC can successfully enact countercyclical measures to guide the RMB’s value higher following each large depreciation (Chart 11). Chart 11PBoC Not Panicking Over RMB Depreciation
PBoC Not Panicking Over RMB Depreciation
PBoC Not Panicking Over RMB Depreciation
Fears of uncontrolled capital outflows following the depreciation are also abating. We presented a dashboard for monitoring short-term capital outflows from China in our March 20 Special Report,6 and an update of these indicators suggests that China’s heightened capital controls are holding – i.e., outflows have not escalated as they did in 2015 (Chart 12). Chart 12No Major Capital Outflow
No Major Capital Outflow
No Major Capital Outflow
Chart 13RMB Depreciation Partially Offsets Tariffs
RMB Depreciation Partially Offsets Tariffs
RMB Depreciation Partially Offsets Tariffs
Thus, the conclusion is that Chinese policymakers appear to be in control of the currency. The reduced risk of an uncontrolled decline has allowed policymakers to (passively) provide meaningful stimulus to the domestic economy via depreciation. Indeed, the RMB has not only depreciated against the USD, but also against many Asian currencies including direct trade competitors such as Vietnam and Taiwan (Chart 13). This is helping offset the negative impact of U.S. tariffs on Chinese exporters. But currency devaluation can come with a price tag – in particular for corporations that have borrowed heavily in U.S. dollar-denominated debt. We estimate that $440 billion of U.S. dollar debt will be maturing over the coming two years, for Chinese companies and banks in the aggregate.7 A 12% depreciation in the RMB since April 2018 means that debt servicing costs will be 12% higher for unhedged debtors. This is particularly painful for real estate and financial services companies, two of the largest holders of U.S. dollar-denominated loans, and the weakest sectors in the current economic downturn. Most importantly, while currency devaluation ease the slowdown, it cannot be counted on to stabilize Chinese economic activity on its own. For example, while our earnings recession model suggests that the decline in the RMB since May has reduced the odds of a major decline in economic activity by roughly 20%, the model also shows that such an event is still highly probable (current odds are roughly at 70%). Bottom Line: Barring a successful (even if temporary) trade deal, we expect more weakness in the RMB as a passive source of reflation to aid the economy. But currency devaluation is a double-edged sword, and cannot be counted on to single-handedly stabilize China’s economy if a further slowdown occurs. An Update On Corporate Earnings Against a backdrop of what may turn out to be insufficient policy support, the earnings picture is providing one modest positive for equity investors. While the growth rate in investable earnings per share has slowed significantly over the past year (Chart 14), it has merely fallen to zero and not deeply into negative territory, as what seemingly occurred in 2015-2016. In our view, the risk of a similar collapse in earnings per share (EPS) has been an important factor weighing on Chinese investable equities’ relative performance since June 2018. In reality, a closer examination of MSCI China Index earnings reveals that a huge decline in EPS this year was never really a threat, because the apparent collapse in 2015-2016 did not actually transpire. Changes to the composition in the MSCI China Index that took effect in November 2015 and June 2016 had the effect of depressing index EPS, due to the sizeable inclusion of a set of richly valued stocks. Chart 15 presents BCA’s calculation of “break-adjusted” EPS for Chinese investable stocks, which shows that EPS growth bottomed out at -10% in late-2016, as opposed to the -28% implied by the unadjusted series. Chart 14Investable EPS Has Yet To Contract Meaningfully
Investable EPS Has Yet To Contract Meaningfully
Investable EPS Has Yet To Contract Meaningfully
Chart 15The Potential Downside For Earnings Is Less Than Many Fear
The Potential Downside For Earnings Is Less Than Many Fear
The Potential Downside For Earnings Is Less Than Many Fear
Chart 16A Cyclical Recovery In Earnings Has Not Yet Begun
A Cyclical Recovery In Earnings Has Not Yet Begun
A Cyclical Recovery In Earnings Has Not Yet Begun
The existence of less downside potential for earnings is certainly positive for investable stocks at the margin, but it does not alter the outlook for equity fundamentals over the coming year. We have shown in several previous reports that there is a strong and reliable link between investable EPS growth and China’s coincident economic activity,8 and the continued slowing in the latter does not suggest that a bottom in earnings is imminent. In addition, Chart 16 highlights that while net earnings revisions have recovered from their early-year lows, they remain in negative territory and have stopped rising over the past few weeks. Twelve-month forward EPS momentum, also presented on a break-adjusted basis, is modestly negative, and has recently weakened (panel 2). Bottom Line: The downside risk to earnings for Chinese investable equities is less than many investors fear. But absent stronger credit growth, it remains too early to confidently project a cyclical earnings recovery. Investment Conclusions The historical relationship between credit growth and economic activity suggests that the latter should soon stabilize, which is our base case view for the coming few months. Still, the risk of a further, meaningful deceleration in growth is elevated, given the unprecedented circumstances surrounding the ongoing slowdown. For equity investors, less potential downside risks to earnings than previously feared is a positive at the margin, but the fundamental outlook still hinges on a durable pickup in economic activity. Over a 6-12 month time horizon, this implies that one of two scenarios will unfold: The economy will stabilize in response to the easing that has already occurred (i.e. our base case view). The economy slows further in the near-term, prompting a more significant policy response that leads to an even sharper pickup in activity. Chart 17Investable Stocks: An Overshoot To The Downside?
Investable Stocks: An Overshoot To The Downside?
Investable Stocks: An Overshoot To The Downside?
In the first scenario, investable stocks have probably overshot to the downside versus the global benchmark and thus will very likely outperform from current levels. Near-term performance is likely to be flat-to-down, as investors await hard evidence of a sequential improvement in growth (Chart 17). In the second scenario, investable stocks are at potentially acute near-term risk, but will likely eventually outperform global stocks once activity begins to pick up sharply. In this scenario, the outperformance of Chinese equities will commence later, but would likely still occur by the tail end of our cyclical investment horizon (6-12 months). As a final point, we are not ruling out the possibility of a temporary trade deal between the U.S. and China, as both sides have the incentive to avoid a further escalation and are now showing goodwill towards constructive negotiations. This may change our tactical view on Chinese stocks, but our cyclical view remains focused on China’s domestic policy and economic fundamentals. Jing Sima China Strategist JingS@bcaresearch.com Footnotes 1 PBC Official: The RRR Cut Aims at Bolstering Real Economy, September 6, 2019 2 China to accelerate the issuance and use of special local government bonds to catalyze effective investment, China State Council, September 4, 2019 3 Please see Emerging Markets Strategy Special Report, “Chinese Infrastructure Investment: A Ramp-Up Ahead?”, dated August 1, 2019, available at ems.bcaresearch.com 4 China’s Local Governments Sell Assets to Make Up for Revenue Loss, Caixin, September 3, 2019 5 http://www.mof.gov.cn/zhengwuxinxi/caizhengxinwen/201909/t20190906_3382239.htm?mc_cid=eb2b199651&mc_eid=9da16a4859 6 Please see China Investment Strategy Special Report, “Monitoring Chinese Capital Outflows”, dated March 20, 2019, available at cis.bcaresearch.com 7 Please see Emerging Markets Strategy Special Report, “China’s Foreign Debt, And A Secret Weapon”, dated September 12, 2019, available at ems.bcaresearch.com 8 Please see China Investment Strategy Weekly Report, “Threading A Stimulus Needle (Part 2):Will Proactive Fiscal Policy Lose Steam?”, dated July 24, 2019, available at cis.bcaresearch.com Cyclical Investment Stance Equity Sector Recommendations
Highlights Portfolio Strategy Intensifying recession fears, rising risks of ineffectual monetary policy, and escalating trade policy uncertainty that is shattering corporate America’s capex plans, warn that sizable drawdown risks persist in the broad U.S. equity market in the upcoming 3-12 months. The transition from a virtuous to a vicious EPS-to capex cycle, souring global growth, the firming U.S. dollar that is weighing on cyclical/defensive pricing power and exports, and deteriorating relative balance sheet (b/s) and relative operating metrics compel us to put the cyclicals/defensives portfolio bent on downgrade alert. Recent Changes The cyclicals/defensives portfolio bent is now on our downgrade watch list. Table 1
Capex Blues
Capex Blues
Feature The SPX moved laterally last week, and remains below the critical 50-day moving average. Recession worries intensified on the back of the first sustained 10/2 yield curve slope inversion. Coupled with the trade war re-escalation, they remain the dominant macro themes. Worrisomely, BCA’s Equity Selloff Indicator captures these dynamics and continues to emit a distress signal (Chart 1). Equities have been relatively resilient in the face of these headwinds. Investors are hoping not only for a U.S./China trade deal, but also that the Fed’s cutting cycle will save the day. Chart 1Mind The Gap
Mind The Gap
Mind The Gap
What caught our attention from all the speeches at the recent Jackson Hole Symposium was RBA Governor Philip Lowe’s speech, especially the section titled “Elevated Expectations That Monetary Policy Can Deliver Economic Prosperity”.1 Lowe highlighted that “When easing monetary policy, all central banks know that part of the transmission mechanism is a depreciation of the exchange rate. But if all central banks ease similarly at around the same time, there is no exchange rate channel: we trade with one another, not with Mars. There are, of course other transmission mechanisms, but once we cancel out the exchange rate channel, the overall effect for any one economy is reduced. If firms don't want to invest because of elevated uncertainty, we can't be confident that changes in monetary conditions will have the normal effect (stress ours).” The perception that the Fed is going to be the savior of the economy is a big risk, and when reality hits that President Trump’s tariffs are a shock to global final demand and presage profit contraction, volatility will skyrocket (please refer to Chart 3 from the August 19 Weekly Report). Importantly, the virtuous capex upcycle that has been in motion since the Trump inauguration when CEOs voted with their feet and started investing, has ground to a halt according to national accounts (Chart 2). U.S. non-residential fixed investment subtracted from GDP growth last quarter, and we doubt the Fed’s fresh interest rate cutting cycle will arrest the fall. Leading indicators of capital outlays point to additional pain in coming quarters (Chart 2). As a reminder, generationally low interest rates and a real fed funds rate near zero hardly restrict expansion plans. Chart 2Free Falling
Free Falling
Free Falling
The shift from a virtuous to a vicious capex cycle is a theme that will start gaining traction as the year draws to a close. While pundits are dismissing the recent steep fall in capex as a one off, our indicators suggest otherwise. The middle panel of Chart 3 clearly depicts this emerging dynamic. Profit growth peaked in 2018 on the back of the massive fiscal easing package and capex is following suit, albeit with a slight lag. There are high odds that a looming profit contraction will further shatter frail animal spirits, sabotage the capex upcycle and tilt into a down cycle. Tack on the ongoing trade uncertainty, and CEOs are certain to, at least, postpone deploying longer-term oriented capital. Worryingly, this transition from a virtuous to a vicious capex cycle is not limited to a few cyclical sectors as we would have expected on the back of the re-escalating Sino-American trade tussle. In fact, basic resources’ and non-capital goods producers’ capital outlays are decelerating, warning that corporate America is in the early stages of retrenchment (bottom panel, Chart 3). Chart 3EPS-To-Capex Down Cycle
EPS-To-Capex Down Cycle
EPS-To-Capex Down Cycle
Chart 4Capex…
Capex…
Capex…
Charts 4, 5 & 6 break down sectorial capex growth using financial statement reported data from Refinitiv. Seven out of eleven sectors are steeply decelerating from near 20%/annum growth to half that; given that these sectors comprise more than 72% of the total capex pie, they will continue to weigh on overall stock market reported investment. Chart 5…Per…
…Per…
…Per…
Chart 6…Sector
…Sector
…Sector
Similarly, the news on the cyclicals versus defensives capex profile is grim. Trade uncertainty and the global growth soft patch has dealt a blow to deep cyclical expansion plans and leading indicators signal that the cyclicals/defensives capex will flirt with the contraction zone in the coming quarters (Chart 7). In sum, intensifying recession fears, rising risks of ineffectual monetary policy, and escalating trade policy uncertainty that is shattering corporate America’s capex plans, warn that sizable drawdown risks persist in the broad U.S. equity market in the upcoming 3-12 months. As a reminder, this is U.S. Equity Strategy’s view, which contrasts BCA’s sanguine equity market house view. Chart 7Relative Capex Blues
Relative Capex Blues
Relative Capex Blues
This week we update our cyclicals versus defensives bias (we are currently neutral) and are compelled to put this portfolio bent on our downgrade watch list. Put The Cyclical/Defensive Tilt On Downgrade Alert Roughly two years ago, when nobody was talking about the brewing capex upcycle, we penned a report titled “Underappreciated Capex” and posited that: “It would be unprecedented if the current business cycle ended without a visible capex upcycle. Since the 1980s recession, all four recessions were preceded by stock market reported capex soaring to roughly a 20% annual growth rate. At the current juncture, capex is merely on the cusp of entering expansion territory and, if history at least rhymes, a significant capex upcycle is looming.” Fast forward to today and as historical empirical evidence had suggested, capex growth peaked near the 20%/annum mark (Chart 3 above). If our assessment is accurate that capex has now likely hit a wall and the virtuous EPS-to-capex cycle reverses to a vicious down cycle as EPS are now contracting, then deep cyclical high-operating leverage sectors are in for a rough ride. This will especially be true if the global recession warnings also morph into an actual recession on the back of the re-escalating Sino-American trade war. More specifically, our capex indicators are firing warning shots. Capex intentions according to a plethora of regional Fed surveys are sinking steadily, which bodes ill for cyclicals versus defensives (Chart 8). One key driver of the capex cycle is China and the emerging markets (EM). News on both fronts is grim. Our real-time indicator that gauges China’s reflation efforts (monetary and fiscal) turning into actual economic activity is Chinese excavator sales that remain in the doldrums (top panel, Chart 9). Chart 8Drop In Capex Will Weigh On Relative Profits
Drop In Capex Will Weigh On Relative Profits
Drop In Capex Will Weigh On Relative Profits
Chart 9Elusive Global Growth
Elusive Global Growth
Elusive Global Growth
Granted, global growth remains elusive as we highlighted last week and while softening Chinese economic activity is weighing on global growth, European and Japanese GDP growth is also decelerating with a number of economies already in the contraction zone (bottom panel, Chart 9). Melting global bond yields reflect these growth fears and warn that the relative share price ratio has more downside (middle panel, Chart 9). Export growth is an important indicator that closely tracks the ebbs and flows of global trade. When the trade-weighted U.S. dollar appreciates it dampens trade, the opposite is also true. Currently the Fed’s trade-weighted greenback based on goods has vaulted to cyclical highs, warning that the path of least resistance is lower for trade, thus a net negative for relative export and profit prospects (Chart 10). Similarly, EM capital outflows exacerbate the ongoing global growth blues and put additional strain on EM economies as depreciating currencies sap consumer purchasing power (top panel, Chart 10). The implication is that EM final demand is in retreat. The rising U.S. dollar not only deals a blow to basic resource exports via making them less competitive and leading to market share losses, but it also undermines cyclical sectors' pricing power. The top panel of Chart 11 shows that deflating commodity prices are exerting downward pull on relative share prices. The ISM manufacturing survey’s prices paid subcomponent corroborates this deflationary backdrop. Keep in mind that operating leverage cuts both ways, and now that the pendulum is swinging the opposite way revenue contraction in these high fixed costs industries will fall straight off the bottom line (Chart 11). Chart 10Rising Dollar Dollar Dampens Trade And…
Rising Dollar Dollar Dampens Trade And…
Rising Dollar Dollar Dampens Trade And…
Chart 11…Saps Pricing Power
…Saps Pricing Power
…Saps Pricing Power
Our macro-based cyclicals/defensives EPS growth models do an excellent job in capturing all these moving parts and signal that defensives have the upper hand in the coming quarters (bottom panel, Chart 8). Turning to operating metrics, the inventory buildup in the past few quarters coupled with a softness in overall business sales underscore that relative share prices will continue to trend lower (top panel, Chart 12). On the balance sheet front, relative net debt-to-EBITDA has troughed and widening junk spreads and the inverted yield curve warn that a further relative b/s degrading looms (second & third panels, Chart 12). If our thesis pans out in the coming months, then cash flow growth will come under pressure as the vicious capex cycle flexes its muscles foreshadowing a rise in bankruptcy filings. Already, the news on the profit margin front is disconcerting. Historically, the ISM manufacturing index and relative operating profit margins have been joined at the hip and the recent flirting of the former with the boom/bust line points toward an ominous relative margin squeeze (bottom panel, Chart 12). Chart 12Poor Financial & Operating Backdrop…
Poor Financial & Operating Backdrop…
Poor Financial & Operating Backdrop…
Chart 13…But Excellent Valuations And Technicals
…But Excellent Valuations And Technicals
…But Excellent Valuations And Technicals
Finally, soft versus hard data surprise oscillations have an excellent track record in forecasting relative share price movements. The current message is to expect additional weakness in relative share prices (second panel, Chart 13). While most of the indicators we track signal that the time is ripe to downgrade this portfolio bent to an underweight stance, bombed out relative valuations, and oversold technicals keep us at bay, at least for the time being (third & bottom panels, Chart 13). However, we are compelled to put the cyclicals/defensives ratio on downgrade alert to reflect the transition from a virtuous to a vicious EPS-to-capex cycle, souring global growth, the firming U.S. dollar that is weighing on cyclical/defensive pricing power and exports, and deteriorating b/s and operating metrics. The way we will execute this downgrade will be via a downgrade of the S&P tech sector (for additional details on the S&P tech sector's downgrade mechanics please refer to last Friday’s U.S. Equity Strategy Insight Report). Bottom Line: Stay on the sidelines in the S&P cyclicals/S&P defensives ratio, but put it on downgrade alert. Anastasios Avgeriou, U.S. Equity Strategist anastasios@bcaresearch.com Footnotes 1 https://www.rba.gov.au/speeches/2019/sp-gov-2019-08-25.html Current Recommendations Current Trades Size And Style Views Stay neutral cyclicals over defensives (downgrade alert) Favor value over growth Favor large over small caps
Highlights Our cyclical view is unchanged, … : Despite the evident risks from escalating trade tensions, soft global economic data, and widespread recession concerns, we expect the expansion and the bull markets in spread product and equities will remain intact. … as fiscal largesse has provided the U.S. economy with ample cushion: Per the IMF’s estimates, the fiscal stimulus package centered on the Tax Cuts and Jobs Act of 2017 amounted to about 70 basis points (“bps”) of fiscal thrust in 2018 and another 40 bps in 2019. But how is Congress’ unprecedented experiment shaping up beyond 2019?: The first-order impact of the tax cuts on government revenues is straightforward. The ultimate net effect turns on how lower taxes alter the course of corporate investment and work force participation. The CBO’s latest projections have the federal deficit widening by an additional $1 trillion over the next decade: Supply-side benefits from the 2017 Act have underwhelmed so far, and the fate of the federal budget depends on lawmakers’ restraint. We are long-run bearish on Treasuries and the dollar. Feature The fundamental backdrop remains mixed in the United States and the rest of the world. Global trade has slowed, and the world is experiencing a sharp manufacturing slowdown. The consensus of BCA researchers expects that manufacturing will soon find a footing, and the global economy will revive, helped along by easier monetary policy. A fiscal pick-me-up is long overdue, and would be especially welcome, but we are not holding our breath, especially when Japan finally seems prepared to impose its repeatedly-postponed VAT increase. Opinion within BCA is notably split, and the glass-half-full and glass-half-empty camps remain far apart. The mixed tone of the macro data offers something for bulls and bears, and contributed to the sharp single-day moves that characterized August’s equity action. Although the S&P 500 moved at least 1% in half of its sessions, however, it was down less than 2% for the month through Thursday. After slipping from its 3,000 perch amidst a 5% decline across August’s first three sessions on renewed trade hostilities, it traded in a narrow range between 2,825 and 2,945 the rest of the way (Chart 1). Chart 1Big Daily Swings, But A Tight Monthly Range
The Longer Run
The Longer Run
The Fed is caught in a loop of responding to inorganic shocks. It tightened policy in 2018 while nervously looking over its shoulder at a sizable injection of procyclical fiscal stimulus that wound up exerting less overheating pressure than it had feared. Now it finds itself uncomfortably drawn into the vortex of the trade war, cutting rates to keep the expansion from being snuffed out prematurely by self-inflicted wounds. Various Fed officials seem to be chafing under the burden of serving as a bulwark against the drag from the tariff fights. As Chair Powell admonished in his Jackson Hole address, “[M]onetary policy … cannot provide a settled rulebook for international trade.” Like it or not, the Fed is stuck cleaning up other policymakers’ messes. Jackson Hole would normally have brought down the curtain on any meaningful market news until after Labor Day. But Bill Dudley, the head of the New York Fed from 2009 to 2018, had other ideas. He argued in a Bloomberg opinion column that the Fed should refuse to abet foolhardy trade policy with rate cuts that offset its ill effects. He went on to posit that it is within the Fed’s remit to set policy with an eye toward influencing the outcome of the 2020 presidential election. Dudley’s grenade enlivened a slow news day and had the effect of unifying the economics community in condemnation of his polemic. The Fed swiftly distanced itself from the comments, reiterating that its “decisions are guided solely by its congressional mandate,” and that “political considerations play absolutely no role.” It is hard to know what Dr. Dudley intended to accomplish, but he ensured that we will be at BCA’s 40th Annual Investment Conference bright and early on Friday, September 27th when he kicks off its second day. Initial Estimates Soon after the 2017 Tax Cuts and Jobs Act was passed, the Congressional Budget Office (“CBO”) assessed how its provisions would affect the U.S. economy. Although calculating the components involves myriad complex estimates, the budget equation is quite simple: Budget Surplus/(Deficit) = Revenues – Outlays. Cutting taxes clearly reduces revenues, and the reductions in individual tax rates, partially offset by limits on deductions, were estimated to cost the federal government roughly $300 billion over the next decade. The 10-year tab for lower corporate rates, and immediate expensing of business investments through 2022, was estimated to run about $1 trillion. Relief from some spending constraints brought the total estimated cost to $1.7 trillion. A trillion here, and a trillion there, and pretty soon you’re talking real money. Though the Act was sure to worsen the deficit, it contained provisions meant to encourage investment and labor supply. Corporate tax cuts and the full immediate expensing of investments in software and eligible equipment were expected to permanently increase the nation’s capital stock, thereby boosting the trend pace of productivity growth. A reduced individual income tax burden was expected to encourage more people to enter the workforce and incumbents to work longer hours. Ultimately, the CBO projected that the Act would boost the level of real potential GDP by 0.7%, on average, through 2029. Six Quarters On It follows that people might work more if they are able to keep more of what they earn, but the data since individual income tax rates were reduced at the beginning of 2018 are inconclusive. The labor force participation rate has been treading water for several years (Chart 2, solid line), as it battles against the drag from baby boomer aging (Chart 2, dashed line). Prime-age labor force participation has risen very slowly off of its 2015 bottom, and has spent 2019 unwinding its gains from late last year (Chart 3). Average weekly hours worked remain locked in the narrow range that has prevailed since 2012 (Chart 4). Though it is difficult to isolate the drivers of participation gains, the part rate’s erratic 2018-9 course suggests that the Act has not yet had a discernible work force impact. Chart 2The Baby Boomers Have Become A Demographic Headwind
The Baby Boomers Have Become A Demographic Headwind
The Baby Boomers Have Become A Demographic Headwind
Chart 3Labor Supply ##br##Gains ...
Labor Supply Gains ...
Labor Supply Gains ...
Chart 4... Have Yet To Materialize
... Have Yet To Materialize
... Have Yet To Materialize
Residential investment, which lost some tax subsidies via the Act’s limits on mortgage interest and state and local tax deductions, has declined in every quarter since it was passed, and we back it out of fixed investment to assess the Act’s impact on corporate investment. As with labor supply, the record so far is mixed. Fixed investment (ex-residential investment) built on its 4Q17 acceleration over the first three quarters of 2018 only to slide in the three subsequent quarters (Chart 5). Publicly traded corporations have proven more eager to share their cash windfall with shareholders than they have been to invest it. Chart 5Investment Stimulus? What Investment Stimulus?
Investment Stimulus? What Investment Stimulus?
Investment Stimulus? What Investment Stimulus?
Looking Ahead – Activity Effects We accept that lower individual income tax rates make work more attractive. People respond to incentives, and more after-tax pay, all else equal, should encourage some discouraged workers to rejoin the labor market and push some of the currently employed to want to work more. The changes are modest, though, with take-home pay increasing $324, or 2%, for someone earning $20,000, and $1,299, or 3%, for someone earning $50,000 (Table 1). We see the Act as having no more than a modest marginal effect on labor supply, though it should help boost consumption until households begin to factor in seemingly inevitable future tax hikes. Table 1Take-Home Pay Is Up, But Not By Much
The Longer Run
The Longer Run
If the 2017 Act really is going to boost the potential trend rate of growth, it will have to do so by pushing the rate of productivity growth higher.1 Workers are able to produce more in a given block of time when they’re endowed with more and better tools, and new tools require investment. If fixed investment doesn’t accelerate, there’s no reason to expect that productivity will (Chart 6). The capex outlook from the NFIB survey and the various Fed regional manufacturing surveys is iffy, and BCA has previously noted how an aging population and a shift to more capital-light businesses may restrain investment. Chart 6Investment Drives Productivity
Investment Drives Productivity
Investment Drives Productivity
It will not be an easy matter to boost productivity by boosting capex, though some of businesses’ after-tax cash will likely find its way to investment. To help the process along, Congress incorporated a familiar provision: accelerated depreciation. Accelerated depreciation’s empirical record as an investment catalyst is hardly clear (Box), and we don’t find its theoretical basis terribly compelling. We think the Act’s trend growth impacts are more likely to disappoint the CBO’s expectations than exceed them. Investment confronts demographic headwinds, too. Pushing trend growth higher will not be easy. Box - An Anodyne Prescription A celebrated provision of the Act allows for the immediate expensing of qualified investments until 2022. Accelerated depreciation programs, which allow for more rapid expensing of investments in property, equipment and other depreciable assets in an attempt to stimulate investment, are a stock measure in lawmakers’ stimulus toolkit, but their effectiveness is hardly assured. For one thing, they’re not new, and businesses may have built up an immunity to them, as they have been a continuous feature of the tax code since 1981. The immediate expensing allowed under the 2017 Act is a form of bonus depreciation, which was initially introduced in the wake of the September 11th attacks. It has remained in place for all but one subsequent year, and though investment peaked during the other stretch that provided for immediate write-offs (September 2010 - December 2011), we are skeptical that it will materially increase the size of the capital stock going forward. Accelerated depreciation schemes encourage investment via the time value of money. They do not increase the depreciation benefit provided by a particular investment, they simply speed up its recognition. Savvy businesses may adjust the timing of their investments to take advantage of temporary bonus periods, but they will not necessarily invest more.2 With rock-bottom interest rates squeezing the time value of money, it’s possible that bonus depreciation’s impact may be especially muted this time. Looking Ahead – The Budget Deficit The CBO’s updated projections through 2029, released two weeks ago, call for the budget shortfall to widen by $800 billion more than previously estimated in January. Despite a downward revision of over $1 trillion in projected interest expense, additional spending has weakened the deficit outlook. It appears that elected officials simply can’t help themselves. In a climate in which neither Congress nor voters evince any desire to rein in the deficit, it seems foolishly naïve to assume that future sessions of Congress will abide by built-in expenditure limits like sunset provisions and spending caps. Although the CBO projects that federal revenues will rise across its 10-year forecasting horizon, they will not do so fast enough to keep up with outlays swollen by interest payments on the growing pile of Treasuries (Chart 7). The CBO sees debt as a share of GDP rising to 95% by 2029, within reach of the all-time high recorded after World War II (Chart 8). Financial markets don’t care now, and we don’t think they will any time in the near future, but the CBO’s baseline projections, which assume future Congresses abide by their stated commitments, probably represent an optimistic scenario. We are more inclined to expect the alternative scenarios, in which sunset provisions are ignored, and pre-set spending caps are set aside, to come to pass. Chart 7A Widening Budget Gap ...
A Widening Budget Gap ...
A Widening Budget Gap ...
Chart 8... Leads To An Increased Debt Burden
... Leads To An Increased Debt Burden
... Leads To An Increased Debt Burden
Investment Implications Chart 9The Dollar's Long-Run Direction Is Down
The Dollar's Long-Run Direction Is Down
The Dollar's Long-Run Direction Is Down
Treasury yields are currently within sight of their July 2016 Brexit-inspired lows, and may well revisit them. Negative yields are a common feature well out the maturity curve in core Europe and Japan. A sustained move higher is not in the cards in the near term, and though we do expect yields to rise as the global economy gains some traction later this year, we do not foresee a disruptive move higher even over the next couple of years. The very long-term outlook for Treasuries is lousy, however, and the dollar also faces secular pressures (Chart 9). The U.S. is not likely to turn into Japan, but the next decade’s returns will likely pale beside those earned since 1982. We are congenitally optimistic about humanity, and Americans seem to have a particular knack for pulling rabbits out of hats. We do not see the U.S. turning into Argentina, Greece or even Japan. The debt burden will weigh on potential growth down the road, however, as debt service will limit Congress’ ability to deploy countercyclical adjustments and longer-term investments, and debt issuance will eventually crimp private entities’ access to capital. All of these factors will limit potential economic growth and contribute to softening returns on equity and credit. We continue to foresee tepid returns over the next ten years relative to the returns investors have grown accustomed to over the last four decades, and we would much rather borrow at current rates for the next 20 or 30 years than lend at them. Doug Peta, CFA Chief U.S. Investment Strategist dougp@bcaresearch.com Footnotes 1 Economic growth is the sum of growth in productivity and growth in the size of the labor force. Since the Act does not bear on immigration or birthrates, productivity represents its best shot at moving the growth needle. 2 Congressional Research Service Report RL31852, The Section 179 and Section 168(k) Expensing Allowances: Current Law and Economic Effects, by Gary Guenther, May 1, 2018.
Dear Client, We will not be publishing a report next week as we take an end-of-summer break. Our next report will be published on Tuesday, September 10th. Best regards, Robert Robis Highlights Canadian Corporates: The small but growing Canadian corporate bond market has delivered performance comparable to other developed market credit over the past decade, with less duration risk and higher average credit quality compared to the larger U.S. corporate debt market. Returns: Our new regression model for Canadian corporate bond excess returns is calling for modest positive gains for Canadian corporate debt over the next year. Corporate Health: Canadian companies’ financial health remains a positive for corporate bond returns on a cyclical basis, but high leverage and mediocre profitability are longer-term concerns. Allocation: We recommend overweight allocations into Canadian investment grade corporates, versus both Canadian government bonds and U.S. investment grade corporates. Amid elevated global policy uncertainty, favor the moderate spread volatility and attractive valuation in Canadian corporates. Feature Canadian corporate bonds do not get much attention from global fixed income investors due to the relatively small size of the market. Yet Canadian corporates have delivered returns in line with their global peers over the past decade, delivering an average excess return over Canadian government bonds (hedged into U.S. dollars) of 2.8% (Chart of the Week).
Chart 1
Looking ahead, Canadian corporates may present an opportunity for diversification in what is becoming an increasingly challenging environment for corporate bond investors, offering relatively higher yields and better credit quality with an economy that has held up well relative to the current weakening trend in global growth. In this Special Report, we outline the contours of the Canadian corporate bond market, assess the macroeconomic factors driving Canadian corporate bond returns, and survey the current overall financial health of Canadian companies. We also take a high-level look at the state of Canadian corporate debt at the sector level, while offering our recommendations on which ones to favor over the next 6-12 months. A Brief Overview
Chart 2
The bulk of outstanding Canadian corporate debt is rated investment grade (IG), but this represents only 5% of the global IG market (Chart 2), using the Bloomberg Barclays Global Corporates Index as a proxy.1 However, the total market capitalization of Canadian corporate bonds is 30% of Canadian GDP – a ratio as large as seen in other major developed countries like the U.S., U.K. and Switzerland (Chart 3). Like those other markets, Canadian companies have taken advantage of historically low borrowing rates and increased demand for income-generating assets to add leverage to their balance sheets.
Chart 3
On the demand side, Canadian corporates have traditionally been more of an institutional investment product, although domestic retail investor interest has picked up in recent years (mostly through mutual funds and exchange traded funds). The buy-and-hold nature of those local institutional investors reduces liquidity, particularly in comparison to the more widely-traded debt of Canadian federal and provincial governments. Yet according to a September 2018 Bank of Canada (BoC) report, domestic investor concerns over a perceived deterioration of Canadian corporate bond market liquidity appeared overstated.2 The report concluded that corporate bond market liquidity had generally been improving since 2010, with only short-lived bouts of illiquidity around events such as the 2011 European Debt Crisis and the 2014/15 collapse in oil prices. That medium-term improvement in liquidity was especially concentrated in high-grade corporate debt and bonds issued by banks, although the BoC concluded that liquidity and trading activity in low-grade and non-bank bonds have generally been stable. Issuance is dominated by financials, utilities, and energy companies. Unsurprisingly, the defensive utilities sector, which has high borrowing requirements, has been the top-performing industry group in 2019 (total return of +14% year-to-date) against a backdrop of falling bond yields and increased investor nervousness about future global growth (Chart 4). Yet all Canadian corporate bonds have generally performed well, with the overall Bloomberg Barclays Canadian Corporate Index delivering a total return of +8.2% so far in 2019, compared to 11.4% for Canadian equities and 5.6% for Canadian government bonds.
Chart 4
Canadian corporate credit spreads have been remarkably stable since the 2008 Global Financial Crisis. The overall index option-adjusted spread (OAS) has stayed in a range between 100-200bps, while both total and excess (duration-matched versus government debt) returns exhibiting fairly low volatility since 2008 (Chart 5). Canadian corporate credit spreads have been remarkably stable since the 2008 Global Financial Crisis. The overall index option-adjusted spread (OAS) has stayed in a range between 100-200bps, while both total and excess (duration-matched versus government debt) returns exhibiting fairly low volatility since 2008 The duration of the benchmark Canadian IG corporate index is now 6.4 years, well below the equivalent level for U.S IG (7.9 years) even though it has steadily increased over the past decade. Over that same period, the average credit quality has deteriorated, with 40% of the Canadian corporate index now rated BBB (Chart 6). This is below the BBB share seen in the U.S. (50%) and euro area (52%), though, making Canadian IG relatively less exposed to potential downgrades to junk bond status. Chart 5Low Volatility Of Spreads & Returns Since 2008
Low Volatility Of Spreads & Returns Since 2008
Low Volatility Of Spreads & Returns Since 2008
Chart 6Lower Share Of BBBs Compared To The U.S. & Europe
Lower Share Of BBBs Compared To The U.S. & Europe
Lower Share Of BBBs Compared To The U.S. & Europe
Bottom Line: The small but growing Canadian corporate bond market has delivered performance comparable to other developed market credit over the past decade, with less duration risk and higher average credit quality compared to the large U.S. corporate debt market. A Fundamental Model To Forecast Canadian Corporate Bond Returns In order to help forecast Canadian corporate bond performance, we have developed a factor-based regression model of Canadian IG excess returns (in local currency terms). We first determined the independent variables in the regression by compiling a list of potential drivers of bond returns which map to four factor groups: growth, inflation, financial variables, and other miscellaneous factors. After statistically testing those factors, the insignificant and unrelated ones were dropped. The final result of this analysis is shown in Table 1. Table 1Regression Details Of The Fundamental Canadian Corporate Bond Return Model
The Great White North: A Framework For Analyzing Canadian Corporate Bonds
The Great White North: A Framework For Analyzing Canadian Corporate Bonds
We concluded that five variables explain the bulk of Canadian corporate bond returns: the annual percentage change in oil prices (using the Canadian benchmark, Western Canadian Select), non-residential fixed investment growth, the M3 measure of money supply growth, the Canadian dollar trade-weighted index (CAD TWI), and the level of Canadian industrial capacity utilization. We concluded that five variables explain the bulk of Canadian corporate bond returns: the annual percentage change in oil prices (using the Canadian benchmark, Western Canadian Select), non-residential fixed investment growth, the M3 measure of money supply growth, the Canadian dollar trade-weighted index (CAD TWI), and the level of Canadian industrial capacity utilization. Chart 7A Fundamental Model Of Canadian Corporate Bond Returns
A Fundamental Model Of Canadian Corporate Bond Returns
A Fundamental Model Of Canadian Corporate Bond Returns
Looking at recent excess return history (Chart 7), it is not surprising that oil prices significantly affect returns given the importance of Canada’s energy sector to the overall Canadian economy. Moreover, growth in non-residential fixed asset investment also positively influences excess returns as faster capital spending can potentially increase the profitability of Canadian firms. In contrast, the inflation factors - money supply and capacity utilization – are detrimental to returns. Increases in both of those factors can result in higher inflation and rising bond yields as the BoC is forced to tighten monetary policy, which often results in rising risk premiums and wider corporate credit spreads (falling excess returns). Finally, the CAD TWI is (weakly) positively correlated to corporate bond excess returns. A stronger currency is a reflection of a strong domestic economy, but it also helps lower imported input costs for Canadian companies – both of which boost corporate profits and corporate bond returns. We now turn to the outlook for these factors over the next 6-12 months, which remain generally supportive for moderate positive excess returns for Canadian corporates: Oil prices: BCA’s commodity strategists expect global oil prices to increase moderately over the next year as global inventory drawdowns outpace expectations (Iran sanctions, Venezuela production collapsing and OPEC 2.0 production discipline are likely sources of supply restraint). In addition, if global growth starts to rebound from the end of this year, as we expect, oil demand will also rise. Non-residential fixed investment: According to the BoC’s most recent Business Outlook Survey of Canadian companies, investment spending plans of firms remain healthy – although that survey was taken at the end of June before the latest increase in uncertainty over global trade and economic growth.3 Moreover, relatively easy credit conditions have made it easier for firms to finance capex. Therefore, our baseline scenario is still to expect moderate growth in non-residential fixed capital investment, although risks are to the downside given the global macro uncertainties. Money supply: The most recent reading of the annual growth of Canadian M3 from June was a solid +7.5%. The BoC is expected to maintain an accommodative monetary policy stance, keeping the current policy rate on hold until the end of 2020. Therefore, money supply growth is likely to remain firm – a negative for Canadian corporate bond returns in our model, although perhaps less so than in the past since rapid money growth will not generate the same type of monetary tightening response from the BoC. Capacity utilization: The Canadian capacity utilization rate is currently at 81%, a meaningful pullback from the 84% level seen in early 2018. According to the latest BoC Monetary Policy Report, the Canadian economy is operating below potential (the output gap in Q1 was estimated to be between -1.25% to -0.25% of potential GDP) and that gap is only expected to close over the next two years. Thus, capacity utilization is not expected to have a major impact on corporate excess returns over the next 6-12 months. Canadian Dollar: The CAD TWI has shown no change over the past year, and will likely remain near current levels in the short term. Although we do not expect the BoC to cut interest rates as much as currently discounted by markets (-40bps over the next twelve months), Canadian monetary policy will still remain accommodative and will likely keep the CAD relatively soft until global manufacturing growth and trade activity stabilize and begin to revive. The CAD is likely to be a neutral factor for Canadian corporate returns over the next year. Bottom Line: Our new regression model for Canadian corporate bond excess returns is calling for modest positive gains for Canadian corporate debt over the next year. Canadian Corporate Balance Sheet Health: OK For Now, But At Risk If The Economy Weakens Chart 8The BCA Canadian Corporate Health Monitors
The BCA Canadian Corporate Health Monitors
The BCA Canadian Corporate Health Monitors
Regular readers of our work will be familiar with our Corporate Health Monitor (CHM) framework. In this approach, we combine financial ratios that are most important for corporate creditworthiness of the entire non-financial corporate sector of a given country into a summary indicator that is designed to track corporate credit spreads. We introduced a Canadian CHM in April 2018, both using top-down national accounts data and aggregated bottom-up ratios from actual company financial statements.4 The latest reading from our top-down and bottom-up Canadian CHMs suggest that the overall health of Canadian corporates is decent, with the CHMs both below the zero line (Chart 8).5 Digging into the individual ratios, however, does reveal some potential signs of future weakness. Leverage is relatively high, while profitability metrics and interest coverage ratios are at the low end of the historical range. However, in our CHM framework, how the latest data compares to the medium-term trend – rather than the absolute level of the ratios - is most relevant for corporate bond performance. On that front, the latest data points for the CHM ratios do represent modest improvements versus the levels seen in 2014 and 2015, which is why our CHMs remain in the “improving health” zone. The more cyclically-driven ratios (profit margins, return on capital, interest coverage) declined amid the sharp plunge in Canadian economic growth at the end of 2018. However, given the recent reacceleration visible in some Canadian economic data, those cyclically-driven ratios may end up showing signs of stabilization, if not improvement, once the underlying CHM data for Q2/2019 and Q3/2019 are available. Looking ahead, Canadian corporate debt would be vulnerable to spread widening (rising risk premiums) in the event of a sustained slowing of the Canadian economy, given the poor absolute levels of the CHM component ratios. With the BoC maintaining an accommodative monetary policy stance, however, and the Canadian economy likely to continue growing at a trend-like pace supported by consumer spending, we think the backdrop will remain conducive to credit spread stability in Canada over the next 6-12 months. With the BoC maintaining an accommodative monetary policy stance, however, and the Canadian economy likely to continue growing at a trend-like pace supported by consumer spending, we think the backdrop will remain conducive to credit spread stability in Canada over the next 6-12 months. Bottom Line: The financial health of Canadian companies remains a positive for corporate bond returns on a cyclical basis, but there are longer-term concerns given high leverage and mediocre profitability. Canadian Corporate Bond Sector Valuation For IG corporate sectors in the U.S., euro area and the U.K., we utilize a relative value framework to rank credit spreads within the benchmark corporate universe. We can apply that same approach to assess valuations of Canadian corporate bond sectors. In our sector relative value model, the “fair value” option-adjusted spread (OAS) for each sector within the Bloomberg Barclays Canadian IG Corporate index is estimated based on a panel regression. The explanatory variables in the regression are the modified duration, convexity and credit rating of each industry sub-sector within the index. The regression produces a set of common coefficients for all sectors that can be used to estimate a fair value OAS for each industry group as a function of its own interest rate duration, convexity and credit quality – all important drivers of corporate bond returns. The Risk-Adjusted Valuation is the difference between each sector’s current OAS and the model estimate of the sector’s fair value OAS. A positive Risk-Adjusted Valuation implies undervaluation for the sector in question, and a negative reading implies overvaluation. Table 2 shows the recommended positioning of the Canadian IG industry sectors based on our relative value model. Sectors with positive Risk-Adjusted Valuations have overweight allocations versus the benchmark, with the opposite holds true for sectors with negative valuations. Sectors with spreads that are very close to fair value (within a range of +5bps to -5bps) have only a neutral recommended weighting versus the benchmark. Table 2Canada Investment Grade Corporate Bond Aggregate: Sector Relative Valuation*
The Great White North: A Framework For Analyzing Canadian Corporate Bonds
The Great White North: A Framework For Analyzing Canadian Corporate Bonds
Chart 9 depicts the risk/reward tradeoff between the valuation metric and the riskiness of each sector as measured by its duration-times-spread (DTS). Valuation is measured along the vertical axis of the chart, while DTS is measured along the horizontal axis. Sectors with higher DTS exhibit greater excess return volatility and are thus riskier.
Chart 9
In the current environment of heightened uncertainty and slowing global growth, but with the BoC and other global central banks responding with a more dovish monetary policy stance, targeting cheap sectors that are less risky (i.e. DTS scores close to or below the average DTS of all sectors) is a prudent strategy. Those would be sectors that appear in the upper left quadrant of Chart 9, like Metals & Mining, Finance Companies and Office REITs. Chart 10Positive Support For Canadian Consumer Cyclicals
Positive Support For Canadian Consumer Cyclicals
Positive Support For Canadian Consumer Cyclicals
We also see a case for overweighting the cheap Consumer Cyclical Services sector, even with a DTS that is modestly higher than the overall index, given the continued strength in the Canadian labor market which supports consumer confidence through rising earning power (Chart 10). Recommended underweights are in the bottom right quadrant of Chart 9, with expensive valuations and high DTS scores, like Utilities: Natural Gas, Utilities: Electric, Supermarkets and Food & Beverage. Bottom Line: Favor Canadian corporate bond sectors with cheap valuations and spread volatility close to that of the overall benchmark index. Investment Conclusions Chart 11Canadian Corporates Outperformance Vs U.S. Will Continue
Canadian Corporates Outperformance Vs U.S. Will Continue
Canadian Corporates Outperformance Vs U.S. Will Continue
Canadian IG corporates now offer a potential opportunity to diversify corporate bond exposure away from the larger markets in the U.S. and Europe. The Canadian economy remains resilient despite slowing global growth, while the fundamental drivers of Canadian corporate bond returns are stabilizing or even improving. At the same time, the economic weakness abroad and heightened trade/political uncertainty will ensure that the BoC maintains an accommodative monetary stance over the next 6-12 months. That is not to say that Canadian corporates are not without risk. Canada is not a low-beta market - spreads do widen during “risk-off” periods in global financial markets. Also, underlying Canadian corporate credit fundamentals look poor on a long-term basis; Canadian private sector debt levels are high (especially for households); and the export-intensive Canadian economy is vulnerable to any incremental deceleration of global growth in particular, and the US more specifically. Yet as a relative value trade versus the much larger corporate bond market to the south, Canadian corporates are well positioned to continue their recent bout of outperformance versus U.S. equivalents over the next 6-12 months, for the following reasons (Chart 11): While markets are priced for rate cuts from both the Fed and the BoC, the starting point for monetary conditions is easier in Canada than in the U.S. given the much weaker level of the Canadian dollar compared to the U.S. dollar. There is a wide gap between the corporate credit fundamentals in Canada and the U.S. according to our top-down Corporate Health Monitors for both countries, such that Canadian balance sheets are more robust. There is a wide gap between the corporate credit fundamentals in Canada and the U.S. according to our top-down Corporate Health Monitors for both countries, such that Canadian balance sheets are more robust. Bottom Line: We recommend that domestic Canadian investors continue to stay overweight Canadian corporates versus Canadian government bonds, while keeping an overall level of spread risk close to benchmark. Global credit investors that have access to the Canadian corporate bond market should consider allocations out of U.S. investment grade corporates into Canadian equivalents. Ray Park, CFA, Research Analyst ray@bcaresearch.com Robert Robis, CFA, Chief Fixed Income Strategist rrobis@bcaresearch.com Footnotes 1 Throughout this report, we solely use data on Canadian corporate debt from the Bloomberg Barclays bond indices, which is the main index data we use in all our global bond research. Comprehensive data is also available from other providers such as FTSE Russell and S&P Global. 2 Bank of Canada September 2018 Staff Analytical Note 2018-31, “Have Liquidity and Trading Activity in the Canadian Corporate Bond Market Deteriorated?” 3 https://www.bankofcanada.ca/2019/06/business-outlook-survey-summer-2019/ 4 Please see BCA Global Fixed Income Strategy Weekly Report, “BCA Corporate Health Monitor Chartbook Update: Growth Is Papering Over The Cracks”, dated April 24, 2018, available at gfis.bcaresearch.com 5 A CHM below zero implies improving financial health, while a CHM above zero indicates deteriorating financial health. Thus, the direction of the CHM is designed to be positively correlated with corporate credit spreads.
Feature According to the official reported growth rate, Chinese industrial profit growth ticked slightly back into positive territory in July, after having fallen into modestly negative territory earlier this year. However, market participants have increasingly noted the gaping difference between the reported year-over-year (YoY) growth rate and the YoY growth rate of the reported level, with the latter having shown a much weaker profile over the past two years (Chart I-1). Chart I-1Will The Real Profit Trend Please Stand Up?
Will The Real Profit Trend Please Stand Up?
Will The Real Profit Trend Please Stand Up?
The profile in the growth of overall earnings per share of listed companies does not match that of the reported level of industrial profit growth (either in the domestic or investable markets), and it remains unclear whether this is due to changes in shares outstanding or other factors. But the divergence between the two series shown in Chart I-1 has certainly focused investor attention on China’s profit outlook, which has deteriorated over the past year regardless of the data series used. This deterioration in earnings has raised the risk of a bullish cyclical position towards Chinese stocks for two reasons: 1) it makes an eventual uptrend in stock prices conditional on a rebound in EPS and, 2) it had led to a deterioration in corporate health in what has become a highly-leveraged economy. The latter is particularly notable, given the backdrop of serious investor concern over rising (although still low) onshore corporate defaults. To investigate the impact of declining/decelerating profit growth on Chinese corporate health, this week we are updating our China Industry Watch thematic chartpack. The charts shown on pages 6 - 27 present our corporate health monitor (CHM) and its components across multiple industries (see below for our CHM methodology).1 Several observations are noteworthy: Although our aggregate CHM for all industrials hasn’t yet fallen back to levels seen in 2008 or during the early-2000s, the deceleration in profit growth has clearly caused a meaningful deterioration in corporate health (Chart I-2). To underscore the point, our aggregate CHM suggests that Chinese industrial sector health is presently the worst that it has been since the global financial crisis (Chart I-3). While we acknowledge that Chinese authorities remain reluctant to prompt a large rise in the macro leverage ratio, this core finding of our report raises the stakes for policymakers in terms of their ability to tolerate significant further weakness in economic activity. Chart I-2In China, Profit Growth Drives Corporate Health
In China, Profit Growth Drives Corporate Health
In China, Profit Growth Drives Corporate Health
Chart I-3Chinese Corporate Health Now The Worst Since the Global Financial Crisis
Chinese Corporate Health Now The Worst Since the Global Financial Crisis
Chinese Corporate Health Now The Worst Since the Global Financial Crisis
Our sub-industry CHMs shed some light on what has driven the deterioration in our overall CHM. The monitors show a particularly marked decline in corporate health for the steel, non-ferrous metals, construction materials, autos, and information technology sectors. Three of these sectors (steel, non-ferrous metals, and IT) are particularly sensitive to exports, suggesting that the trade war with the U.S. is at least partially responsible for the worsening corporate health of industrial enterprises. However, the auto and construction materials sectors tend to be domestically-oriented, underscoring that some of the weakness in these sectors is purely homegrown. Corporate health for energy-related sub-industries (oil & gas and coal) continues to improve from a poor starting point, and the incredible two-decade improvement in health for the food & beverage sector has continued, which shows that Chinese demand for consumer staples remains robust. Measured either by debt-to-assets or interest coverage, China’s industrial enterprises have experienced a broad-based worsening of leverage. To the extent that “deleveraging” has happened, it has occurred in some of China’s “old industries” such as coal, steel, and non-ferrous metals. On the efficiency front, coal and steel have been the only sectors experiencing an improvement in inventory turnover due to China’s capacity reduction campaign; besides this, inventory, asset, and receivable turnover has deteriorated in nearly every other sub-industry. Similarly, profit growth has decelerated and/or fallen into negative territory broadly across sub-industries along with a meaningful deceleration in revenue growth. Utilities and food & beverage are the notable outliers, where profit growth has moderately recovered due to a combination of positive revenue growth and wider margins. Chart I-4Non-SOE Profits: A Leading Indicator For Overall Profit Growth?
Non-SOE Profits: A Leading Indicator For Overall Profit Growth?
Non-SOE Profits: A Leading Indicator For Overall Profit Growth?
Finally, Chart I-4 provides an interesting perspective about overall profit growth. A breakdown of profit growth by ownership (state-owned vs. non-state-owned enterprises), shows that non-SOE industrial profits led the decline in overall profit growth in 2017-2018. While it has not yet occurred, a significant pickup in non-SOE profit growth may herald a durable bottom for industrial sector profits, which could act as a meaningful outperformance catalyst for Chinese stocks over the coming 6-12 months. To us, the significant decline in corporate health noted in this report reinforces both our tactically bearish and cyclically bullish recommendations towards Chinese stocks. In the near-term, the risks facing Chinese stocks are high, as the combination of the reluctance of policymakers to stimulate aggressively, weaker corporate health, and the likelihood of negative near-term economic and profit momentum is a perfect storm for stock prices. We recommend an underweight position relative to global stocks for the remainder of the year. However, over the cyclical time horizon (i.e. 6-12 month), these circumstances also suggest high odds in favor of Chinese policymakers soon accepting the need to ease meaningfully further. Barring a major episode of earnings dilution among publicly-listed stocks, significant further easing along with controlled currency depreciation makes a strong case for an overweight stance towards Chinese stocks versus the global benchmark in local currency terms.2 We recommend that investors who are not yet invested in Chinese assets to remain on the sidelines until clearer signs of materially stronger stimulus emerge. However, intermediate-term investors who are already positioned in favor of Chinese equities should stay long, as the relative performance trend of Chinese stocks will likely be higher a year from now than it is today. Qingyun Xu, CFA, Senior Analyst qingyunx@bcaresearch.com Jing Sima China Strategist jings@bcaresearch.com BCA's China Industry Watch The BCA China Industry Watch includes four categories of financial ratios to monitor a sector’s leverage, profitability, growth and efficiency, respectively. Some of these ratios, as shown in Table 1, are slightly tweaked from conventional definitions due to data availability. The financial data in our exercise are from the official statistics on overall industrial firms, of which the listed companies are a subset, but most financial ratios based on the two sets of data are very similar, especially for the heavy industries that dominate the Chinese stock markets - both onshore and offshore. The financial ratios on leverage, growth and profitability are almost identical for some sectors, while some other sectors that are not well represented in the stock market, such as technology, healthcare and consumer sectors, show notable divergences. As the Chinese equity universe continues to expand, we expect that the two sets of data will increasingly converge.
Chart I-
Appendix: China Industry Watch All Firms Chart II-1Non-Financial Firms: Stock Price & Valuation Indicators
Non-Financial Firms: Stock Price & Valuation Indicators
Non-Financial Firms: Stock Price & Valuation Indicators
Chart II-2Non-Financial Firms: Relative Performance Of Valuation Indicators
Non-Financial Firms: Relative Performance Of Valuation Indicators
Non-Financial Firms: Relative Performance Of Valuation Indicators
Chart II-3Non-Financial Firms: Leverage Indicators
Non-Financial Firms: Leverage Indicators
Non-Financial Firms: Leverage Indicators
Chart II-4Non-Financial Firms: Growth Indicators
Non-Financial Firms: Growth Indicators
Non-Financial Firms: Growth Indicators
Chart II-5Non-Financial Firms: Profitability Indicators
Non-Financial Firms: Profitability Indicators
Non-Financial Firms: Profitability Indicators
Chart II-6Non-Financial Firms: Efficiency Indicators
Non-Financial Firms: Efficiency Indicators
Non-Financial Firms: Efficiency Indicators
Oil & Gas Sector Chart II-7Oil&Gas Sector: Stock Price & Valuation Indicators
Oil&Gas Sector: Stock Price & Valuation Indicators
Oil&Gas Sector: Stock Price & Valuation Indicators
Chart II-8Oil&Gas Sector: Relative Performance Of Valuation Indicators
Oil&Gas Sector: Relative Performance Of Valuation Indicators
Oil&Gas Sector: Relative Performance Of Valuation Indicators
Chart II-9Oil&Gas Sector: Leverage Indicators
Oil&Gas Sector: Leverage Indicators
Oil&Gas Sector: Leverage Indicators
Chart II-10Oil&Gas Sector: Growth Indicators
Oil&Gas Sector: Growth Indicators
Oil&Gas Sector: Growth Indicators
Chart II-11Oil&Gas Sector: Profitability Indicators
Oil&Gas Sector: Profitability Indicators
Oil&Gas Sector: Profitability Indicators
Chart II-12Oil&Gas Sector: Efficiency Indicators
Oil&Gas Sector: Efficiency Indicators
Oil&Gas Sector: Efficiency Indicators
Coal Sector Chart II-13Coal Sector: Stock Price & Valuation Indicators
Coal Sector: Stock Price & Valuation Indicators
Coal Sector: Stock Price & Valuation Indicators
Chart II-14Coal Sector: Relative Performance Of Valuation Indicators
Coal Sector: Relative Performance Of Valuation Indicators
Coal Sector: Relative Performance Of Valuation Indicators
Chart II-15Coal Sector: Leverage Indicators
Coal Sector: Leverage Indicators
Coal Sector: Leverage Indicators
Chart II-16Coal Sector: Growth Indicators
Coal Sector: Growth Indicators
Coal Sector: Growth Indicators
Chart II-17Coal Sector: Profitability Indicators
Coal Sector: Profitability Indicators
Coal Sector: Profitability Indicators
Chart II-18Coal Sector: Efficiency Indicators
Coal Sector: Efficiency Indicators
Coal Sector: Efficiency Indicators
Steel Sector Chart II-19Steel Sector: Stock Price & Valuation Indicators
Steel Sector: Stock Price & Valuation Indicators
Steel Sector: Stock Price & Valuation Indicators
Chart II-20Steel Sector: Relative Performance Of Valuation Indicators
Steel Sector: Relative Performance Of Valuation Indicators
Steel Sector: Relative Performance Of Valuation Indicators
Chart II-21Steel Sector: Leverage Indicators
Steel Sector: Leverage Indicators
Steel Sector: Leverage Indicators
Chart II-22Steel Sector: Growth Indicators
Steel Sector: Growth Indicators
Steel Sector: Growth Indicators
Chart II-23Steel Sector: Profitability Indicators
Steel Sector: Profitability Indicators
Steel Sector: Profitability Indicators
Chart II-24Steel Sector: Efficiency Indicators
Steel Sector: Efficiency Indicators
Steel Sector: Efficiency Indicators
Non Ferrous Metals Sector Chart II-25Non Ferrous Metals Sector: Stock Price & Valuation Indicators
Non Ferrous Metals Sector: Stock Price & Valuation Indicators
Non Ferrous Metals Sector: Stock Price & Valuation Indicators
Chart II-26Non Ferrous Metals Sector: Relative Performance Of Valuation Indicators
Non Ferrous Metals Sector: Relative Performance Of Valuation Indicators
Non Ferrous Metals Sector: Relative Performance Of Valuation Indicators
Chart II-27Non Ferrous Metals Sector: Leverage Indicators
Non Ferrous Metals Sector: Leverage Indicators
Non Ferrous Metals Sector: Leverage Indicators
Chart II-28Non Ferrous Metals Sector: Growth Indicators
Non Ferrous Metals Sector: Growth Indicators
Non Ferrous Metals Sector: Growth Indicators
Chart II-29Non Ferrous Metals Sector: Profitability Indicators
Non Ferrous Metals Sector: Profitability Indicators
Non Ferrous Metals Sector: Profitability Indicators
Chart II-30Non Ferrous Metals Sector: Efficiency Indicators
Non Ferrous Metals Sector: Efficiency Indicators
Non Ferrous Metals Sector: Efficiency Indicators
Construction Material Sector Chart II-31Construction Material Sector: Stock Price & Valuation Indicators
Construction Material Sector: Stock Price & Valuation Indicators
Construction Material Sector: Stock Price & Valuation Indicators
Chart II-32Construction Material Sector: Relative Performance Of Valuation Indicators
Construction Material Sector: Relative Performance Of Valuation Indicators
Construction Material Sector: Relative Performance Of Valuation Indicators
Chart II-33Construction Material Sector: Leverage Indicators
Construction Material Sector: Leverage Indicators
Construction Material Sector: Leverage Indicators
Chart II-34Construction Material Sector: Growth Indicators
Construction Material Sector: Growth Indicators
Construction Material Sector: Growth Indicators
Chart II-35Construction Material Sector: Profitability Indicators
Construction Material Sector: Profitability Indicators
Construction Material Sector: Profitability Indicators
Chart II-36Efficiency Indicators
Construction Material Sector: Efficiency Indicators
Construction Material Sector: Efficiency Indicators
Machinery Sector Chart III-37Machinery Sector: Stock Price & Valuation Indicators
Machinery Sector: Stock Price & Valuation Indicators
Machinery Sector: Stock Price & Valuation Indicators
Chart III-38Machinery Sector: Relative Performance Of Valuation Indicators
Machinery Sector: Relative Performance Of Valuation Indicators
Machinery Sector: Relative Performance Of Valuation Indicators
Chart III-39Machinery Sector: Leverage Indicators
Machinery Sector: Leverage Indicators
Machinery Sector: Leverage Indicators
Chart III-40Machinery Sector: Growth Indicators
Machinery Sector: Growth Indicators
Machinery Sector: Growth Indicators
Chart III-41Machinery Sector: Profitability Indicators
Machinery Sector: Profitability Indicators
Machinery Sector: Profitability Indicators
Chart III-42Machinery Sector: Efficiency Indicators
Machinery Sector: Efficiency Indicators
Machinery Sector: Efficiency Indicators
Automobile Sector Chart III-43Automobile Sector: Stock Price & Valuation Indicators
Automobile Sector: Stock Price & Valuation Indicators
Automobile Sector: Stock Price & Valuation Indicators
Chart III-44Automobile Sector: Relative Performance Of Valuation Indicators
Automobile Sector: Relative Performance Of Valuation Indicators
Automobile Sector: Relative Performance Of Valuation Indicators
Chart III-45Automobile Sector: Leverage Indicators
Automobile Sector: Leverage Indicators
Automobile Sector: Leverage Indicators
Chart III-46Automobile Sector: Growth Indicators
Automobile Sector: Growth Indicators
Automobile Sector: Growth Indicators
Chart III-47Automobile Sector: Profitability Indicators
Automobile Sector: Profitability Indicators
Automobile Sector: Profitability Indicators
Chart III-48Automobile Sector: Efficiency Indicators
Automobile Sector: Efficiency Indicators
Automobile Sector: Efficiency Indicators
Food & Beverage Sector Chart III-49Food&Beverage Sector: Stock Price & Valuation Indicators
Food&Beverage Sector: Stock Price & Valuation Indicators
Food&Beverage Sector: Stock Price & Valuation Indicators
Chart III-50Food&Beverage Sector: Relative Performance Of Valuation Indicators
Food&Beverage Sector: Relative Performance Of Valuation Indicators
Food&Beverage Sector: Relative Performance Of Valuation Indicators
Chart III-51Food&Beverage Sector: Leverage Indicators
Food&Beverage Sector: Leverage Indicators
Food&Beverage Sector: Leverage Indicators
Chart III-52Food&Beverage Sector: Growth Indicators
Food&Beverage Sector: Growth Indicators
Food&Beverage Sector: Growth Indicators
Chart III-53Food&Beverage Sector: Profitability Indicators
Food&Beverage Sector: Profitability Indicators
Food&Beverage Sector: Profitability Indicators
Chart III-54Food & Beverage Sector: Efficiency Indicators
Food&Beverage Sector: Efficiency Indicators
Food&Beverage Sector: Efficiency Indicators
Information Technology Sector Chart III-55Information Technology Sector: Stock Price & Valuation Indicators
Information Technology Sector: Stock Price & Valuation Indicators
Information Technology Sector: Stock Price & Valuation Indicators
Chart III-56Information Technology Sector: Relative Performance Of Valuation Indicators
Information Technology Sector: Relative Performance Of Valuation Indicators
Information Technology Sector: Relative Performance Of Valuation Indicators
Chart III-57Information Technology Sector: Leverage Indicators
Information Technology Sector: Leverage Indicators
Information Technology Sector: Leverage Indicators
Chart III-58Information Technology Sector: Growth Indicators
Information Technology Sector: Growth Indicators
Information Technology Sector: Growth Indicators
Chart III-59Information Technology Sector: Profitability Indicators
Information Technology Sector: Profitability Indicators
Information Technology Sector: Profitability Indicators
Chart III-60Information Technology Sector: Efficiency Indicators
Information Technology Sector: Efficiency Indicators
Information Technology Sector: Efficiency Indicators
Utilities Sector Chart III-61Utilities Sector: Stock Price & Valuation Indicators
Utilities Sector: Stock Price & Valuation Indicators
Utilities Sector: Stock Price & Valuation Indicators
Chart III-62Utilities Sector: Relative Performance Of Valuation Indicators
Utilities Sector: Relative Performance Of Valuation Indicators
Utilities Sector: Relative Performance Of Valuation Indicators
Chart III-63Utilities Sector: Leverage Indicators
Utilities Sector: Leverage Indicators
Utilities Sector: Leverage Indicators
Chart III-64Utilities Sector: Growth Indicators
Utilities Sector: Growth Indicators
Utilities Sector: Growth Indicators
Chart III-65Utilities Sector: Profitability Indicators
Utilities Sector: Profitability Indicators
Utilities Sector: Profitability Indicators
Chart III-66Utilities Sector: Efficiency Indicators
Utilities Sector: Efficiency Indicators
Utilities Sector: Efficiency Indicators
Footnotes 1 Please see China Investment Strategy Special Report, “Introducing The BCA China Industry Watch”, dated February 10, 2016, available at cis.bcaresearch.com. 2 We continue to recommend that investors hedge the currency exposure of a long Chinese equity position by being long USD-CNH. Cyclical Investment Stance Equity Sector Recommendations