Corporate

Highlights Please note that analysis on India is published below. Even if the recent upturn in the Chinese credit impulse is sustained, there will likely still be a six- to nine-month lag between the impulse’s trough and the bottom in the mainland’s business cycle. EM corporate earnings cycles typically lag Chinese stimulus efforts by about nine months. Therefore, EM profits will be contracting in the first three quarters of 2019. This will short-circuit the current rebound in EM share prices. EM equity valuations are not cheap enough to shield stocks from profit contraction. Feature China’s credit growth was very strong in January. We contend that even if the upturn in the credit impulse proves to be persistent, there will likely be a six- to nine-month lag between its low point and the bottom in the mainland’s business cycle. Chart I-1 demonstrates that the credit impulse leads both nominal manufacturing output growth and the manufacturing PMI’s import subcomponent by roughly nine months. Chinese imports are the most pertinent variable to gauge China’s economic impact on the rest of the world. Chart I-1China: Credit Impulse Leads Business Cycle By Nine Months
China: Credit Impulse Leads Business Cycle By Nine Months
China: Credit Impulse Leads Business Cycle By Nine Months
In the meantime, will financial markets exposed to Chinese growth look through the valley of the ongoing growth deceleration and continue to rally? Or will they experience a major relapse in the coming months? In our opinion, corporate profits will be the key to broader financial market performance. So long as corporate profits do not shrink, investors will likely look beyond weak macro data, and any weakness in stocks will be minor. However, if corporate profits contract in the next nine months, then share prices will plummet anew. EM Profits Are Heading Into Contraction Chart I-2 illustrates that China’s credit impulse leads both EM and Chinese corporate earnings per share (EPS) by at least nine months and that it currently foreshadows EPS contraction in the first three quarters of 2019. Even if the recent upturn in the credit impulse is sustained, EM and Chinese EPS growth will likely bottom only in August – while they are in negative territory. Chart I-2EM EPS Is Beginning To Contract
EM EPS Is Beginning To Contract
EM EPS Is Beginning To Contract
EM corporate earnings growth has already dropped to zero and will turn negative in 2019. Chart I-3A reveals that EPS in U.S. dollar terms are already contracting in six out of 10 sectors – industrials, consumer staples, consumer discretionary, telecom, utilities and health care. Chart I-3AEM EPS By Sector
EM EPS By Sector
EM EPS By Sector
Chart I-3BEM EPS By Sector
EM EPS By Sector
EM EPS By Sector
EPS growth has not yet turned negative for financials, technology, energy and materials (Chart I-3B). Notably, corporate earnings within these four sectors collectively account for 70% of EM total corporate earnings, as shown in Table I-1.
Chart I-
Over the course of 2019, these sectors’ EPS are also set to shrink: Technology (accounts for 20% of MSCI EM corporate earnings): NAND semiconductor prices have been plunging for some time, and DRAM prices are also beginning to drop (Chart I-4). This reflects broad-based weakness in global trade – global auto sales are shrinking for the first time since the 2008 global financial crisis, global semiconductor sales are relapsing and global mobile phones shipments are falling (Chart I-5). Chart I-4Semiconductor Prices Are Falling
Semiconductor Prices Are Falling
Semiconductor Prices Are Falling
Chart I-5Broad-Based Weakness In Global Trade
Broad-Based Weakness In Global Trade
Broad-Based Weakness In Global Trade
Semiconductors accounted for 77% of Samsung’s operating profits in the first three quarters of 2018, suggesting the potential drop in DRAM prices will be devastating for its profits. Next week we will publish a Special Report on Korea and discuss the outlook for both semiconductors and Korean profits in more detail. In addition, the ongoing contraction in Taiwanese exports of electronics parts confirms downside risks to EM tech earnings (please refer to top panel of Chart I-3B). In brief, the ongoing decline in semiconductor prices will bring about EPS contraction in the EM technology sector. Financials/Banks (financials make up 31% of EM corporate earnings): Banks’ profits often correlate with fluctuations in economic activity, because the latter drive non-performing loan (NPL) cycles (Chart I-6). NPL cycles outside Brazil, Russia and India – where the banking systems have already gone through substantial NPL recognition and provisioning – will deteriorate, and push banks to increase their provisions. The latter will be a major drag on EM banks’ profits. Chart I-6EM Banks EPS And Economic Activity
EM Banks EPS And Economic Activity
EM Banks EPS And Economic Activity
Regarding Chinese banks in particular, if the credit revival in January is sustained, it would strongly suggest that the government is resorting to its old, credit-driven growth playbook. Following 10 years of an enormous credit frenzy and a 20-year capital spending boom, it is currently difficult to find many financially viable projects. Hence, a renewed credit binge will once again be associated with further capital misallocation and more NPLs. Many of these projects will fail to generate sufficient cash flow to service debt. NPLs will thus rise considerably and the need to raise capital will dilute the banks’ existing shareholders. Of course, this will happen with a time lag. Chart I-7 shows that the gap between Chinese banks’ EPS and non-diluted profits has once again widened, and that EPS are beginning to contract. Chart I-7Chinese Banks: Earnings Dilution
Chinese Banks: Earnings Dilution
Chinese Banks: Earnings Dilution
Chinese banks could issue perpetual bonds – discussed in great detail in last week’s report – to recapitalize themselves. Nevertheless, this will be negative for existing shareholders. In a nutshell, despite low multiples, share prices of Chinese banks will drop because more credit expansion amid the lingering credit bubble is negative for existing shareholders. The basis is that it will ultimately lead to their dilution. Chinese banks make up 4.5% of the MSCI’s EM equity market cap and 10% of aggregate EM profits. Hence, their EPS contraction will have a non-trivial impact on overall EM EPS. Resource sectors (energy and materials together make 20% of EM corporate earnings): The ongoing slowdown in China will exert renewed selling pressure in commodities markets. As shown in Chart I-9 on page 8, base metals prices lag the turning points in the Chinese credit impulse by several months and are still at risk of renewed price decline. Hence, profits of firms in the materials sector are at risk. Energy companies’ trailing EPS growth is still positive because the late-2018 carnage in oil prices has not yet filtered through to corporate earnings announcements (Chart I-3B on page 3). More importantly, the recent oil price rebound can be attributed to both Saudi Arabia’s output cuts as well as stronger demand – in the form of a surge in Chinese imports of oil and petroleum products. Chart I-8 illustrates that growth rates of China’s intake of oil and related products approached zero when crude prices were rising but has dramatically accelerated following their plunge. This is consistent with China’s pattern of buying commodities on dips. The point is that the upside in oil prices will be capped by China, which will likely moderate its oil purchases going forward, as crude prices have recently rallied. Chart I-8China And Oil
bca.ems_wr_2019_02_21_s1_c8
bca.ems_wr_2019_02_21_s1_c8
Bottom Line: EM profit cycles lag Chinese’s stimulus by about nine months. EM profits will be contracting in the first three quarters of 2019. This will short-circuit the current rebound in EM share prices. China’s Credit Cycles And Financial Markets What has been the relationship between China’s credit cycle and related financial markets over the past 10 years? The time lag between turning points in China’s credit impulse and relevant financial markets can be anywhere from zero to 18 months. Chart I-9 illustrates historical time lags between the Chinese credit impulse on the one hand and EM share prices, base metals prices and the global manufacturing PMI on the other. The time lag has not been consistent over time. Chart I-9Chinese Credit Impulse And Financial Markets: Understanding Time Lags
Chinese Credit Impulse And Financial Markets: Understanding Time Lags
Chinese Credit Impulse And Financial Markets: Understanding Time Lags
In late 2015-early 2016, the rebound in China’s credit impulse led financial markets by six months. At the recent market peak in January 2018, the credit impulse led financial markets and the global manufacturing PMI by about 18 months. In the meantime, in the 2012-13 mini cycle, EM share prices and commodities markets did not rally much, despite the meaningful upturn in China’s credit impulse. Finally, at the 2010-2011 peak, the credit impulse led EM stocks and base metals prices by 12 months. In short, the credit impulse led those financial markets by a few months to as much as a year and a half. Further, not only do time lags to the stimulus vary, but the impact on both economic activity and financial markets varies as well. This is because both economic activity and financial markets are driven by human psychology and behavior; iterations in stimulus, economic activity and financial markets are chaotic and complex in nature and do not follow well-defined patterns. Given the poor state of sentiment among Chinese consumers, business managers and entrepreneurs, more stimulus and more time may be required to turn the mainland’s business cycle this time around. Besides, unlike in previous episodes, there has not been any stimulus for the property market and no tax reductions on auto sales. Finally, although China and the U.S. may strike a deal on trade, it is unlikely to be a comprehensive agreement that is sustainable in the long run. This would be consistent with our Geopolitical Strategy team’s view that China and the U.S. are in a long-term and broad geopolitical confrontation – not a trade war. The trade war and tariffs are just one dimension of this. Hence, Chinese consumers and businesses, as well as the global business community may well look through this potential deal and not significantly alter their cautious behavior, at least for some time. In other words, the genie of geopolitical confrontation is out of the bottle, and the presidents of the U.S. and China are unlikely to succeed in putting it back. Bottom Line: Turning points in China’s credit impulse generally lead financial markets exposed to Chinese growth by several months. Given that the improvement in the credit impulse is both very recent and modest, odds are that China-related plays including EM risk assets will go through a major selloff before putting in a durable bottom.1 EM Equity Valuations In terms of the ability of EM stocks to withstand profit contraction, would cheap valuations not shield share prices from a considerable drop? We do not think EM equities are cheap; their valuations are neutral. Hence, there is no real valuation cushion in EM stocks to help them endure a period of negative EPS growth. We have written frequently about valuations and will touch on the topic only briefly here. Market cap-based multiples indeed appear very low. However, some segments of the EM universe such as Chinese banks and state-owned companies in Russia, Brazil, China and India have had low multiples for years. In other words, they are a value trap and their multiples are low for a reason. We elaborated above why Chinese banks are chronically “cheap”. For many other companies, low multiples are due to structural issues such as the lack of focus on profitability and shareholder value, or the high cyclicality of profits. Many of these stocks have large market caps, which pull down the EM index’s aggregate multiple. To remove market-cap bias, we have calculated 20% trimmed-mean multiples by ranking 50 MSCI EM industry groups (sub-sectors) and cutting off the top and bottom 10%. Then, we calculate the equal-weighted average of the remaining 80% of the sub-sectors. We did this calculation for the following five ratios: trailing P/E, forward P/E, price-to-cash earnings, price-to-book value and price-to-dividend. Then, we combined them into a composite valuation indicator (Chart I-10, top panel). This indicator shows that EM equity valuations are neutral. Chart I-10EM Equity Valuations In Absolute Terms
bca.ems_wr_2019_02_21_s1_c10
bca.ems_wr_2019_02_21_s1_c10
In addition, we calculated the median and equal-weighted composite valuation indicators (Chart I-10, middle and bottom panels). They also remove market cap bias and tell the same message: EM stocks are trading close to their fair value. EM equities are also close to their historical average relative to developed markets (DM). Chart I-11 illustrates relative EM versus DM valuation indicators based on 20%-trimmed mean, median and equal-weighted metrics. Chart I-11EM Equity Valuations Versus DM
bca.ems_wr_2019_02_21_s1_c11
bca.ems_wr_2019_02_21_s1_c11
In sum, EM valuations are not cheap neither in absolute terms, nor relative to DM. According to both measures, valuations are neutral. Hence, valuations will not prevent share prices from falling as profits begin to contract. This is why we continue to recommend a defensive strategy for absolute-return investors, and we continue to underweight EM versus DM within a global equity portfolio. Arthur Budaghyan, Senior Vice President Emerging Markets Strategy arthurb@bcaresearch.com India: Beware Of Rural Growth Lapse Indian share prices are weak and are underperforming the emerging markets benchmark in U.S. dollar terms (Chart II-1, top panel). Small cap stocks are in a full-fledged bear market (Chart II-1, bottom panel). Chart II-1Indian Stocks Are Weak
Indian Stocks Are Weak
Indian Stocks Are Weak
The latest earnings season turned out to be disappointing. Many companies missed their earnings estimates. Chart II-2 shows that net profit margins of listed non-financial companies have turned down and overall EPS growth is weakening. Chart II-2Indian Corporate Profits Are Sluggish
Indian Corporate Profits Are Sluggish
Indian Corporate Profits Are Sluggish
Disappointing corporate earnings are confirmed by macro data as well. Chart II-3A shows that manufacturing production is decelerating and intermediate goods production is contracting. Further, sales of two-wheelers, three-wheelers, passenger and commercial vehicles, as well as tractors, are either slowing or contracting (Chart II-3B). Chart II-3ACyclical Spending Is Decelerating
Cyclical Spending Is Decelerating
Cyclical Spending Is Decelerating
Chart II-3BCyclical Spending Is Decelerating
Cyclical Spending Is Decelerating
Cyclical Spending Is Decelerating
This weakness emanates from rural areas. The basis is that food prices have been falling since the summer of 2018 – and are deflating for the first time since the early 2000s. This is hurting rural incomes. Several indicators confirm considerable weakness in rural income growth and the latter’s underperformance versus urban income and spending: The top panel of Chart II-4 illustrates that our proxy for spending in rural areas relative to urban areas has deteriorated massively along with the decline in Indian food prices. Chart II-4Rural Spending Is Weaker Than Urban One
Rural Spending Is Weaker Than Urban One
Rural Spending Is Weaker Than Urban One
This measure is calculated as revenue growth of four rural-exposed listed companies minus the revenue growth of four urban-exposed listed companies. In both cases, the companies largely operate in the consumer goods space. Credit growth in rural areas has lagged that of urban areas, explaining the underperformance of rural spending (Chart II-4, bottom panel). Corroborating this, stock prices of these urban-exposed companies have outperformed their rural peers substantially (Chart II-5). Chart II-5Urban-Exposed Stocks Have Outperformed Rural Ones
Urban-Exposed Stocks Have Outperformed Rural Ones
Urban-Exposed Stocks Have Outperformed Rural Ones
Such a slump in rural income is posing a challenge to Modi’s re-election in May. His government – which lost three key state elections in late 2018 – is aware of these ominous trends and is acting boldly to revive income growth in rural areas. The government announced an expansionary budget that appeases rural voters. In particular, the budget aims to strengthen farmers’ support schemes, cut taxes for low- and middle-income earners and introduce a pension scheme for social security coverage of unorganized labor. However, there is a significant risk that the authorities’ fiscal and monetary stimulus are too late to lift growth before May’s elections. According to the past relationship between fiscal spending and India’s business cycle, higher government expenditure growth will only begin to have an effect on the economy in the second half of this year – i.e. after the elections are held (Chart II-6). Hence, the BJP could lose its majority, meaning it would either rule in a minority government or be forced to turn over power to the Congress Party and its allies. Chart II-6Government Expenditures To Lift Growth In H2 2019
Government Expenditures To Lift Growth In H2 2019
Government Expenditures To Lift Growth In H2 2019
Beyond the elections, food prices might be approaching their lows. Well-below average rain will likely result in weak agricultural production and, hence, higher food prices in the second half of 2019 (Chart II-7). Chart II-7Below Trend Monsoon = Food Prices Will Likely Rise
Below Trend Monsoon = Food Prices Will Likely Rise
Below Trend Monsoon = Food Prices Will Likely Rise
Therefore, in the second half of 2019, both fiscal easing and higher food prices will revive rural incomes and spending. In the meantime, monetary easing and credit growth acceleration will support demand in urban areas. Overall, Indian financial markets will likely remain in a risk zone until the elections as economic growth and corporate profits will continue to disappoint. If the opposition Congress Party’s alliance wins the election, Indian stocks and the currency will initially sell off. After this point, Indian assets could offer a buying opportunity because growth will likely revive in the second half of 2019. Bottom Line: For now, we continue to recommend an underweight position in Indian equities relative to the EM equity benchmark. Weakening growth, the very low interest rate differential versus U.S. rates and political uncertainty ahead of the general elections, pose risks of renewed rupee depreciation. A weaker rupee will continue to benefit India’s export-oriented software companies. Therefore, we also reiterate our long Indian software / short EM stocks recommendation. Finally, fixed-income investors should stay with the yield curve steepening trade. The central bank could further cut rates in the near term. However, long-term bond yields will not fall substantially and will likely start drifting higher sooner than later. The widening fiscal deficit, expectations of growth revival in the second half of 2019, and eventually higher food prices and inflation expectations, will all lead to a continuous steepening in the local yield curve. Ayman Kawtharani, Associate Editor ayman@bcaresearch.com Footnotes 1 This is the view of BCA’s Emerging Markets Strategy team and it is different from BCA’s house view on China-related assets and the global business cycle. The primary source of the difference is the outlook for China’s growth. Equity Recommendations Fixed-Income, Credit And Currency Recommendations
Highlights Spread Product Valuation: Corporate bond spreads don’t look especially cheap relative to average historical levels. But they are far too elevated for the current phase of the economic cycle. Valuations in other spread products are not nearly as attractive. Investors should remain overweight corporate bonds (both investment grade and junk) within U.S. fixed income portfolios. Corporate Defaults: Slowing corporate profit growth during the next 12 months will cause corporate leverage to flatten-off and will lead to a slightly higher default rate than most baseline forecasts suggest. Junk spreads currently offer adequate compensation for the extra default risk, but that cushion will evaporate quickly if spreads tighten during the next few months. Mexican Sovereign Bonds: Mexico’s USD-denominated sovereign debt is attractively priced relative to similarly-rated U.S. corporate credit. U.S. fixed income investors should take the opportunity to add USD-denominated Mexican bonds to their portfolios. Feature Corporate bonds have been on fire since the start of the year. High-yield excess returns have already made back all of their lost ground from 2018, and investment grade credits are on their way (Chart 1). With the Fed’s rate hike cycle on hold and some signs of credit easing in China, the near-term backdrop is amenable to further spread compression. Especially from current elevated levels. Chart 1Corporate Bonds Having A Good Run In 2019
Corporate Bonds Having A Good Run In 2019
Corporate Bonds Having A Good Run In 2019
On the flipside, some indicators of corporate default risk are starting to deteriorate and we can easily envision a more difficult environment for corporate spreads in the second half of this year. Especially if the Fed re-starts rate hikes, as we expect.1 In this week’s report we illustrate the extent of undervaluation in corporate spreads, and also detail our concerns related to budding default risk. We conclude that investors should maintain an overweight allocation to corporate bonds (both investment grade and high-yield) for now, but be prepared to trim exposure once spreads reach more reasonable levels. Finally, we identify an opportunity in USD-denominated Mexican sovereign bonds. Too Cheap For Phase 2 In our Special Report from mid-December that laid out our key themes for 2019, we described how we split the economic cycle into different phases based on the slope of the yield curve (Chart 2).2 We define the three phases of the cycle as follows: Chart 2Expect To Stay In Phase 2 For Most (If Not All) Of 2019
Expect To Stay In Phase 2 For Most (If Not All) Of 2019
Expect To Stay In Phase 2 For Most (If Not All) Of 2019
Phase 1: From the end of the prior recession until the 3-year / 10-year Treasury slope flattens to below 50 bps Phase 2: When the 3/10 slope is between 0 bps and 50 bps Phase 3: From when the 3/10 slope inverts until the start of the next recession Dividing the cycle this way reveals a reliable pattern in corporate bond excess returns versus Treasuries. Excess returns tend to be highest in Phase 1. They tend to be quite low but still positive in Phase 2, and they tend not to turn negative until Phase 3. We argued in December that we are currently in Phase 2 and that we will probably stay there for most, if not all, of 2019. The main reason that excess returns are lower in Phase 2 than in Phase 1 is that corporate bond spreads are much tighter in Phase 2. Most of the cyclical spread compression occurs in Phase 1, in the immediate aftermath of the recession. With that in mind, consider the data presented in Chart 3. The chart shows 12-month breakeven spreads for each corporate bond credit tier as a percentile rank relative to history.3 For example, a percentile rank of 50% means that the breakeven spread has been tighter than its current level half of the time throughout history. Chart 3 also divides the historical data into two samples, showing how breakeven spreads rank relative to the entire history of available data, and also how they rank relative to other Phase 2 periods only.
Chart 3
When the full historical sample is considered, only the B-rated and Caa-rated credit tiers have breakeven spreads above their historical medians. However, when we focus exclusively on Phase 2 environments we see that spreads for every credit tier other than Aaa look extremely cheap. Essentially, Chart 3 shows that today’s spread levels are more consistent with periods when the economy is either just exiting or entering a recession. Absent that sort of macro environment, there would appear to be an obvious buying opportunity in corporate bonds. Interestingly, other spread products don’t look nearly as cheap as corporate bonds. Chart 4 shows the same data as Chart 3 but for all non-corporate U.S. spread products with available data prior to 2000. It shows that Agency MBS and Consumer ABS spreads are close to median Phase 2 levels. USD-denominated Sovereign debt looks somewhat cheap. Meanwhile, Domestic Agencies and Supranationals both look expensive. What’s clear is that right now corporate credit offers the most attractive opportunity in U.S. fixed income.
Chart 4
Bottom Line: Corporate bond spreads don’t look especially cheap relative to average historical levels. But they are far too elevated for the current phase of the economic cycle. Valuations in other spread products are not nearly as attractive. Investors should remain overweight corporate bonds (both investment grade and junk) within U.S. fixed income portfolios. Default Cycle At A Turning Point? Another valuation tool in our arsenal is the High-Yield default-adjusted spread. This is the excess spread available in the high-yield index after accounting for expected 12-month default losses. It can also be thought of as the 12-month return earned by the High-Yield index in excess of a position in duration-matched Treasuries, assuming that default losses match expectations and that there are no capital gains (losses) from spread tightening (widening). Expected default losses are calculated using the Moody’s baseline default rate forecast and our own forecast of the recovery rate. Combining the Moody’s baseline default rate forecast of 2.4% and our recovery rate forecast of 45% gives expected 12-month default losses of 1.3%. Those expected default losses are then subtracted from the average High-Yield index option-adjusted spread to get a default-adjusted spread of 274 bps. This is slightly above the historical average of 250 bps (Chart 5). In other words, junk investors are currently being compensated at slightly above average levels to bear default risk. Chart 5A Look At The Default-Adjusted Spread
A Look At The Default-Adjusted Spread
A Look At The Default-Adjusted Spread
Another way to conceptualize the default-adjusted spread is to ask what default rate would have to prevail over the next 12 months for junk investors to earn average historical excess compensation. This spread-implied default rate is denoted by the ‘X’ in the second panel of Chart 5. It is currently 2.8%, slightly above Moody’s baseline expectation. Is The Baseline Default Rate Forecast Reasonable? If we view the Moody’s 2.4% default rate forecast as reasonable, then we should conclude that junk bonds are attractively valued. However, some macro indicators suggest that 2.4% might be too optimistic. Chart 6 shows a model of the 12-month trailing speculative grade default rate based on gross leverage, which we define as total debt over pre-tax profits, and C&I lending standards. Chart 6A Simple Model Of The 12-Month Trailing Speculative Grade Default Rate
A Simple Model Of The 12-Month Trailing Speculative Grade Default Rate
A Simple Model Of The 12-Month Trailing Speculative Grade Default Rate
Gross leverage has improved during the past few quarters as profit growth has outpaced corporate debt growth (Chart 6, panel 2). This has acted to push down the fair value reading from our default rate model. On the other hand, commercial & industrial (C&I) lending standards tightened in the fourth quarter of last year (Chart 6, bottom panel). A net tightening in C&I lending standards is consistent with a higher default rate. Overall, the fair value reading from our default rate model is currently 3.5%, above the current 12-month trailing default rate of 2.6%. For the purposes of valuation, where the default rate will be 12 months from now is more important than where it is currently. To get a sense of where the fair value from our model is headed we need forecasts for corporate profit and debt growth. Profit growth will almost certainly moderate from its current lofty levels (Chart 7). Pressures on revenues and expenses both point in that direction. Total business sales and the ISM Manufacturing PMI have both fallen sharply from their recent highs (Chart 7, panel 2), suggesting lower corporate revenue growth going forward. Meanwhile, wages continue to accelerate (Chart 7, bottom panel). Chart 7Forecasting Profit Growth
Forecasting Profit Growth
Forecasting Profit Growth
Using a model based on nominal GDP growth, wage growth, industrial production and the trade-weighted dollar, if we forecast that nominal GDP growth slows to the same rate as wage growth over the next 12 months, then the model predicts that profit growth will fall into the mid-single digits (Chart 7, top panel). This would be more or less consistent with the recent growth rate in corporate debt, meaning that gross leverage would flatten-off and the fair value reading from our default rate model would stabilize near 3.5%. In summary, if profit growth moderates in line with our expectations during the next 12 months, then it is likely that the corporate default rate will be somewhat higher than the current Moody’s forecast of 2.4%, possibly as high as 3.5%. But even a 3.5% default rate would still translate to a default-adjusted junk spread of 211 bps. Positive compensation for default risk, though less than average historical levels. In that case we would still expect solid positive excess returns from junk bonds. However, it will be important to monitor our default-adjusted spread during the next few months. If junk spreads tighten in the near-term, as we anticipate, then the excess compensation for default risk will evaporate quickly. Bottom Line: Slowing corporate profit growth during the next 12 months will cause corporate leverage to flatten-off and will lead to a slightly higher default rate than most baseline forecasts suggest. Junk spreads currently offer adequate compensation for the extra default risk, but that cushion will evaporate quickly if spreads tighten during the next few months. Buy Mexican Bonds While most spread products have benefited from the Fed’s pause, delivering excellent year-to-date returns. We notice that the spreads on Mexico’s USD-denominated sovereign debt have not tightened alongside other comparable credits (Chart 8). This presents an attractive opportunity. Chart 8Mexican Bonds: An Attractive Opportunity
Mexican Bonds: An Attractive Opportunity
Mexican Bonds: An Attractive Opportunity
When we compare 12-month breakeven spreads between the USD-denominated sovereign debt of different emerging market countries versus the spreads on equivalently-rated U.S. corporate bonds, we see that Mexico has now joined Argentina, Saudi Arabia, Qatar, UAE and Poland as the only countries that offer attractive compensation relative to the U.S. corporate sector (Chart 9).
Chart 9
Why has this happened? Our Emerging Markets Strategy service postulates that many investors fear that the new political regime will bring fiscal profligacy, but in fact, the AMLO administration is proving to be less populist and more pragmatic than expected.4 The 2019 budget, for example, targets a primary surplus of 1% of GDP, and envisages a decline in nominal expenditures in 29 out of 56 categories. This commitment to sound fiscal policy should benefit Mexican sovereign bond spreads. More fundamentally, our Emerging Markets strategists note that the Mexican peso is very cheap as measured by the real effective exchange rate based on unit labor costs. This is not surprising given that the peso has been relatively flat versus the dollar during the past two years, despite interest rates being much higher in Mexico than in the U.S. The Mexican 10-year real yield is currently 4.1%, well above real GDP growth which was 2.6% during the past four quarters (Chart 10). Contrast that with the U.S., where the 10-year real yield is a meagre 0.8% versus real GDP growth of 3% during the past four quarters. In other words, interest rate differentials favor a stronger peso, which is positive for USD-denominated sovereign spreads. Chart 10Good Time To Add USD-Denominated Mexican Bonds To A Portfolio
Good Time To Add USD-Denominated Mexican Bonds To A Portfolio
Good Time To Add USD-Denominated Mexican Bonds To A Portfolio
Though the Mexican/U.S. interest rate differential remains wide, it is likely to compress going forward. Elevated Mexican interest rates relative to growth signal that monetary policy is restrictive. A fact that is already evident in decelerating Mexican money supply (Chart 10, bottom panel). Meanwhile, low U.S. real yields relative to GDP suggest that further Fed tightening is necessary before U.S. rates are similarly restrictive. Bottom Line: Mexico’s USD-denominated sovereign debt is attractively priced relative to similarly-rated U.S. corporate credit. U.S. fixed income investors should take the opportunity to add USD-denominated Mexican bonds to their portfolios. Ryan Swift, Vice President U.S. Bond Strategy rswift@bcaresearch.com Footnotes 1 Please see U.S. Bond Strategy Weekly Report, “Caught Offside”, dated February 12, 2019, available at usbs.bcaresearch.com 2 Please see U.S. Bond Strategy Special Report, “2019 Key Views: Implications For U.S. Fixed Income”, dated December 11, 2018, available at usbs.bcaresearch.com 3 The 12-month breakeven spread is the spread widening required over the next 12 months for the corporate bond to break even with a duration-matched position in Treasury securities. We use the breakeven spread instead of the average index spread because it takes into account the changing duration of the bond indexes. 4 Please see Emerging Markets Strategy Weekly Report, “Dissecting China’s Stimulus”, dated January 17, 2019, available at ems.bcaresearch.com Fixed Income Sector Performance Recommended Portfolio Specification
Highlights The current trajectory in global share prices resembles what took place in 2000 and early 2001. The early 2001 rebound in global and EM stocks lasted several weeks only, despite ongoing easing by the Federal Reserve. Corporate profits – not the Fed – was the key driver in 2001 and remains the principal driver of global and EM stocks today. EM corporate profits are set to contract this year due to China’s continuing slowdown and weakening global trade. This suggests the current EM rally is unsustainable; continue underweighting EM. In Chile, bet on lower swap rates. Continue shorting the peso but overweight the local bourse within an EM equity portfolio. Feature The dovish shift by the U.S. Federal Reserve in the past month has boosted EM risk assets and currencies. Yet, we find that in the medium and long term there is a very low correlation between Fed policy and U.S. interest rates, on the one hand, and EM financial markets on the other. Instead, EM risk assets and currencies correlate with EM/China business cycles and global trade (Chart I-1). We have not detected any improvement in China/EM growth, nor in global trade (Chart I-1). What’s more, we expect Chinese growth and world trade to continue to weaken in the coming six months. Therefore, the EM rebound and outperformance will be reversed sooner than later. Chart I-1Global Growth Indicators Do No Confirm EM Rally
Global Growth Indicators Do No Confirm EM Rally
Global Growth Indicators Do No Confirm EM Rally
Please note this is the view of BCA’s Emerging Markets Strategy team. BCA’s house view is presently positive on global risk assets and global growth. The basis for this difference between our current position and that of the majority of our colleagues is the outlook for China’s growth. A Replay Of 2016 Or 2001? Most investors are betting that 2019 will be a replay of 2016, when the Fed’s dovish turn and China’s stimulus propelled the EM and global equity rallies. It is enticing to compare the current episode in financial markets to the one that occurred only three years ago. To be sure, there are a lot of similarities: the global trade slowdown driven by China/EM, selloffs in global equity and credit markets, a dovish shift in the Fed’s stance and policy stimulus in China are all reminiscent of early 2016. Not surprisingly, this has created a stampede into EM. According to the most recent Bank of America Merrill Lynch survey, as of mid-January some 29% of investors were overweight EM stocks compared to 1% overweight in the U.S., 11% underweight in the euro area and 1% underweight in Japan. By now, the overweight in EM equities is most likely even higher, given the stampede into EM assets that has occurred over the past several weeks. This stands in contrast to the 33% underweight in EM equities in January 2016. It is apparent that the majority of investors are indeed extrapolating 2016 into 2019. We hold a different view and believe China’s slowdown will be more protracted than in 2015-’16, and that EM corporate earnings are set to contract (please refer to Chart I-5 on page 6). A key distinction between China’s current policy efforts and what was implemented in 2015-‘16 is the absence of stimulus for real estate. The odds are that China’s property market will continue to languish, weighing on household and business sentiment as well as spending. Further, the efficiency of monetary transmission mechanisms could be lower today than it was in 2016 due to the regulatory tightening on both banks and non-banks. The fiscal multiplier could also be lower due to the fragile sentiment among consumers and businesses. We discussed these issues in detail in our January 17, 2019 report. Remarkably, it appears that global share prices are tracking the pattern of 1998-2001 – their trajectories are identical in terms of both magnitude and duration (Chart I-2). Chart I-2Global Stocks Are Tracking Pattern Of 1998-2001 In Magnitude And Duration
Global Stocks Are Tracking Pattern Of 1998-2001 In Magnitude And Duration
Global Stocks Are Tracking Pattern Of 1998-2001 In Magnitude And Duration
That said, there are substantial differences between today and 2001 in respect to the economic backdrops in the U.S. and China. Our focal point is to demonstrate that the Fed easing is not sufficient to prop up share prices if it does not lead to a recovery in corporate earnings. We conclude that the latest rebound in EM risk assets is probably late because neither the Fed’s pause nor China’s stimulus will revive EM corporate profits in the next nine months. In terms of market action, one can draw a number of parallels between the trajectory in global share prices today and in 2000-’01. Following an exponential rally in 1999, the global equity index peaked in January 2000 (Chart I-3). The equity selloff accelerated in the last quarter of 2000, with stocks plunging in December of that year. Chart I-3Is Rebound In Global And EM Stocks Late?
Is Rebound In Global And EM Stocks Late?
Is Rebound In Global And EM Stocks Late?
Oversold conditions in global share prices and the Fed’s intra-meeting 50-basis-point rate cut on January 3, 2001, generated a 7% and 15% rebound in global and EM stocks, respectively. The bounce lasted from late December 2000 until early February 2001. The current trajectory in global share prices – the rollover in late January 2018, the top formation lasting several months followed by a dramatic plunge, the bottom in late December, 2018 and the subsequent rebound – closely resemble the path global share prices took in 2000 and early 2001 (Chart I-3, top panel). The same holds true for EM share prices (Chart I-3, bottom panel). Critically, the Fed continued to cut interest rates in 2001 and 2002, yet the bear market in global equities, including EM, persisted until March 2003 (Chart I-4A and I-4B, top panels). The culprit was shrinking corporate profits (Chart I-4A and Chart I-4B, bottom panels). Chart I-4AFed Easing Did Not Help Global Stocks In 2001
Fed Easing Did Not Help Global Stocks In 2001
Fed Easing Did Not Help Global Stocks In 2001
Chart I-4BFed Easing Did Not Help EM Stocks In 2001
Fed Easing Did Not Help EM Stocks In 2001
Fed Easing Did Not Help EM Stocks In 2001
Odds are that EM earnings are set to contract this year as discussed below and shown in Chart I-5. As a result, this view bolsters our conviction that EM equities are likely to roll over soon and plunge anew in absolute terms, and certainly underperform U.S. stocks. Bottom Line: There are many economic differences between today and 2001. Our main point is that the Fed easing-inspired rally in global equities in early 2001 lasted several weeks only and was followed by a new cycle low. The key factor was not Fed policy but corporate profits. Provided our view that corporate earnings in EM and global cyclical sectors will contract this year, the rally in these segments is not sustainable regardless of Fed policy. What Drives EM: Chinese Or U.S. Growth? Predicting the outlook for China and global trade correctly is key to getting the EM call right. First, China’s credit and fiscal spending impulse leads EPS growth of companies included in the EM MSCI equity index by nine months, and it currently points to continued deceleration and contraction in EM EPS in the months ahead (Chart I-5, top panel). The average of new and backlog orders within China’s manufacturing PMI also portends a negative outlook for EM corporate earnings (Chart I-5, bottom panel). Chart I-5EM Profits Are Heading Into Contraction
EM Profits Are Heading Into Contraction
EM Profits Are Heading Into Contraction
The primary linkage between China’s credit and fiscal spending impulse and EM profits is as follows: China impacts EM and the rest of the world via its imports. This explains why EM share prices correlate with Chinese PMI imports (Chart I-6). Chart I-6Chinese Imports And EM Equities
Chinese Imports And EM Equities
Chinese Imports And EM Equities
Second, China’s imports are to a large extent driven by capital spending, especially construction. Some 85% of mainland imports are composed of various commodities, industrial goods and materials, and autos. Consumer goods make up only about 15% of imports. Major capital expenditures in general and construction, in particular, cannot be undertaken without financing. This is why the country’s credit and fiscal spending impulse leads its imports cycles (Chart I-7). This impulse is presently foreshadowing a deepening slump in mainland imports and by extension its suppliers’ revenues and profits. Chart I-7Chinese Imports Are Heading South
bca.ems_wr_2019_02_07_s1_c7
bca.ems_wr_2019_02_07_s1_c7
Third, as EM shipments to China dwindle, not only will EM corporate revenues and profits disappoint but EM currencies will also depreciate. The latter bodes ill for EM U.S. dollar and local currency bonds. The basis is that exchange rate depreciation makes U.S. dollar debt more expensive to service, and also pushes up local bond yields in high-yielding EM fixed-income markets. Fourth, The majority of developing economies sell more to China than to the U.S. Remarkably, global trade and global manufacturing decelerated in 2018, even though U.S. goods imports were booming (Chart I-8). Crucially, the more recent strength in the U.S.’s intake of goods was in part due to frontloading of shipments to the U.S. before the import tariffs went into effect on January 1, 2019. Chart I-8U.S. Imports Are Very Robust
U.S. Imports Are Very Robust
U.S. Imports Are Very Robust
Yet despite robust U.S. demand, aggregate exports of Korea, Taiwan, and Japan have done poorly and their manufacturing have slumped (Chart I-9A and Chart I-9B). Chart I-9AAsian Exports: Flirting With Contraction
Asian Exports: Flirting With Contraction
Asian Exports: Flirting With Contraction
Chart I-9BAsian Manufacturing: Flirting With Contraction
Asian Manufacturing: Flirting With Contraction
Asian Manufacturing: Flirting With Contraction
This highlights the increased significance of Chinese demand and the diminished importance of U.S. domestic demand in world trade. In particular, at $6 trillion, EM aggregate goods and services imports, including Chinese imports (but excluding China’s imports for processing and re-exporting), is greater than the combined imports of the U.S. and EU, which currently stand at $4.7 trillion ($2.5 trillion plus $2.2 trillion, respectively). Finally, the media and many investors have exaggerated the impact of U.S. tariffs on the Chinese economy. We are not implying that the tariffs are not relevant at all, or that they have not damaged sentiment among mainland businesses and households. They have. The point is that China’s exports to the U.S. constitute 3.8% of Chinese GDP only (Chart I-10). This compares to Chinese capital spending amounting to 42% of GDP and total annual credit origination and fiscal spending of 26% of GDP. Chart I-10China's Exports To U.S. Are Small (3.8% of GDP)
China's Exports To U.S. Are Small (3.8% of GDP)
China's Exports To U.S. Are Small (3.8% of GDP)
Overall, China’s growth slowdown in 2018 was not due to its plunging shipments to the U.S. – actually, the latter were rising strongly till December due to frontloading – but due to weakness in credit origination, primarily among non-banks (shadow banking). Bottom Line: The Chinese business cycle – not the U.S.’s – is the key driver of EM share prices and currencies and more important than the Fed. EM And The Fed On the surface, it seems that EM is tracking Fed policy. To us, however, this is akin to“not seeing the forest for the trees”. Investors need to stand back and examine the medium- and long-term relationships between U.S. interest rates, DM central banks’ balance sheets, and EM financial markets. In this broader context, the following becomes apparent: There is no stable correlation between EM share prices, EM currencies and EM sovereign credit, on the one hand, and U.S. 10-year bond yields, on the other (Chart I-11). Chart I-11EM And U.S. Bond Yields: No Stable Correlation
EM And U.S. Bond Yields: No Stable Correlation
EM And U.S. Bond Yields: No Stable Correlation
Historically, the correlation between EM share prices and the Fed funds rate has been mixed, albeit more positive than negative (Chart I-12). On this 40-year chart, we shaded the periods when EM stocks did well during periods of a rising fed funds rate. These time spans are 1983-1984, 1988-1989, 1999-2000, 2003-2007 and 2017. Chart I-12EM Stocks And Fed Funds Rate: A Historical Perspective
EM Stocks And Fed Funds Rate: A Historical Perspective
EM Stocks And Fed Funds Rate: A Historical Perspective
The only two episodes when EMs crashed amid rising U.S. interest rates were the 1982 Latin America debt crisis and the 1994 Mexican peso crisis. Yet, it is essential to emphasize that these crises occurred because of poor EM fundamentals: elevated foreign currency debt levels, negative terms-of-trade shocks, large current account deficits and pegged exchange rates. Dire EM fundamentals also prevailed before the Asian/EM crises of 1997-1998. However, these late-1990s crises occurred without much in the way of Fed tightening or rising U.S. bond yields. Remarkably, there is also no correlation between the size and the rate of change of DM central banks’ balance sheets, on the one hand, and EM risk assets and currencies on the other. In particular, Chart I-13 validates that the annual growth rate of G4 central banks’ balance sheets does not correlate with either EM share prices or EM local currency bonds’ total returns in U.S. dollars. Chart I-13Pace Of QEs And EM: No Correlation
Pace Of QEs And EM: No Correlation
Pace Of QEs And EM: No Correlation
Finally, there is a low correlation between U.S. real interest rates and the real broad trade-weighted dollar (Chart I-14). Notably, Chart I-15 illustrates that the greenback often acts as a countercyclical currency, appreciating when global growth is slowing and depreciating when the global business cycle accelerating. Please note that the dollar is shown inverted on this chart. Chart I-14The U.S. Dollar And U.S. Real Rates
The U.S. Dollar And U.S. Real Rates
The U.S. Dollar And U.S. Real Rates
Chart I-15The U.S. Dollar Is Countercyclical
The U.S. Dollar Is Countercyclical
The U.S. Dollar Is Countercyclical
Bottom Line: Many analysts and investors assign more significance to the Fed policy’s impact on EM risk assets than historical evidence warrants. Unless Fed policy easing coincides with EM growth recovery, the Fed’s positive impact on EM will prove to be fleeting. Investment Considerations Widespread bullish bias on EM among investors currently and a continuous slew of poor growth data in China and global trade give us the conviction to argue that the current EM rally is not sustainable. Even if the S&P 500 drifts higher, EM stocks and credit will underperform their U.S. counterparts (Chart I-16). Chart I-16Stay Short EM / Long S&P 500
Stay Short EM / Long S&P 500
Stay Short EM / Long S&P 500
The EM equity index is sitting at a major technical resistance, and a decisive break above this level will challenge our view (Chart I-17, top panel). The same holds true for many EM currencies and copper (Chart I-17, bottom panel). However, for now, we are maintaining our negative bias. Chart I-17EM Equities And Copper Are Facing Resistance
EM Equities And Copper Are Facing Resistance
EM Equities And Copper Are Facing Resistance
Within the EM equity universe, our overweights are Brazil, Mexico, Chile, Russia, central Europe, Korea, and Thailand. Our underweights are Indonesia, India, Philippines, South Africa, and Peru. We continue to recommend shorting the following EM currency basket versus the U.S. dollar: ZAR, IDR, MYR, CLP, and KRW. The full list of our recommended positions across EM equities, local rates, credit, and currencies is available on pages 17-18. Arthur Budaghyan, Senior Vice President Emerging Markets Strategy arthurb@bcaresearch.com Chile: Favor Bonds Over Stocks Local currency bonds will outperform equities in Chile over the next six to nine months (Chart II-1). Chart II-1Chile: Favor Bonds Over Stocks
Chile: Favor Bonds Over Stocks
Chile: Favor Bonds Over Stocks
The central bank is raising interest rates to cap inflation. However, we believe this is misguided because China’s ongoing deceleration along with lower copper prices, will slow growth in Chile over the course of this year. In addition, the current domestic inflation dynamics are less worrisome than the central bank contends. There is ongoing debate in the policy circles of Santiago over whether the recent large net immigration wave, particularly from Venezuela, is inflationary or disinflationary. On the one hand, net immigration expands the supply of labor and puts downward pressure on wages, and hence is disinflationary (Chart II-2). On the other hand, net immigration bolsters demand, and thereby inflation. Chart II-2Chile: Labor Force Is Expanding At 2%
Chile: Labor Force Is Expanding At 2%
Chile: Labor Force Is Expanding At 2%
The central bank has acknowledged both effects but has cited that the latter will overwhelm the former. We disagree with this assessment and believe that current immigration in Chile will be more disinflationary. There are a number of factors that make us believe so: Both nominal and real wage growth are cooling off rapidly (Chart II-3). This corroborates the thesis that the expanding supply of labor is capping wage increases. Chart II-3Chile: Wage Growth Is Decelerating
Chile: Wage Growth Is Decelerating
Chile: Wage Growth Is Decelerating
Central banks in any country need to be concerned with rising unit labor costs and service sector inflation. Energy and food prices are beyond a central bank’s control. Monetary policy should not respond to fluctuations in these prices unless there are second-round effects on wages and other prices. There is presently no genuine inflationary pressures in Chile. The average of Chile’s core and trimmed mean inflation rates stands at 2.5%, and service sector inflation is at 3.7% (Chart II-4). This is within the central bank’s inflation target range of 3% +/-1%. Chart II-4Chile: Inflation Is Within Target Range
Chile: Inflation Is Within Target Range
Chile: Inflation Is Within Target Range
Finally, Chile’s exports are set to shrink due to the ongoing deceleration in China and lower copper prices (Chart II-5). With exports accounting for 30% of GDP, a negative external shock will slow domestic demand too. This will be disinflationary. Chart II-5Chilean Exports Are About To Contract
Chilean Exports Are About To Contract
Chilean Exports Are About To Contract
The fixed-income market in Chile is pricing in rate hikes (Chart II-6). We continue to recommend receiving 3-year swap rates. Even if the central bank continues to tighten, long-term interest rates will decline, anticipating rate cuts down the road. Chart II-6Chile: Receive 3-Year Swap Rates
Chile: Receive 3-Year Swap Rates
Chile: Receive 3-Year Swap Rates
Chilean share prices, in absolute terms, are at risk from the EM and commodities selloff. However, we recommend dedicated EM equity portfolios overweight Chile. The economy is fundamentally and structurally solid, and local equity markets are supported by large local investment pools. Importantly, unlike many other commodity producers, currency depreciation in Chile does not stop the central bank from cutting interest rates. Banco Central de Chile does not target the exchange rate and will cut rates to mitigate the adverse external shock. This will ensure that business cycle fluctuations in Chile will be milder than in other developing economies where central banks tighten to defend their currencies. This is positive for Chilean stocks versus other EM bourses. Finally, the peso is at risk of depreciation from lower copper prices. Bottom Line: Local investors should favor domestic bonds over stocks. Fixed-income traders should bet on lower three-year swap rates. Dedicated EM investors should overweight Chilean equities. Currency traders should maintain a short CLP / long USD trade. Footnotes Equity Recommendations Fixed-Income, Credit And Currency Recommendations
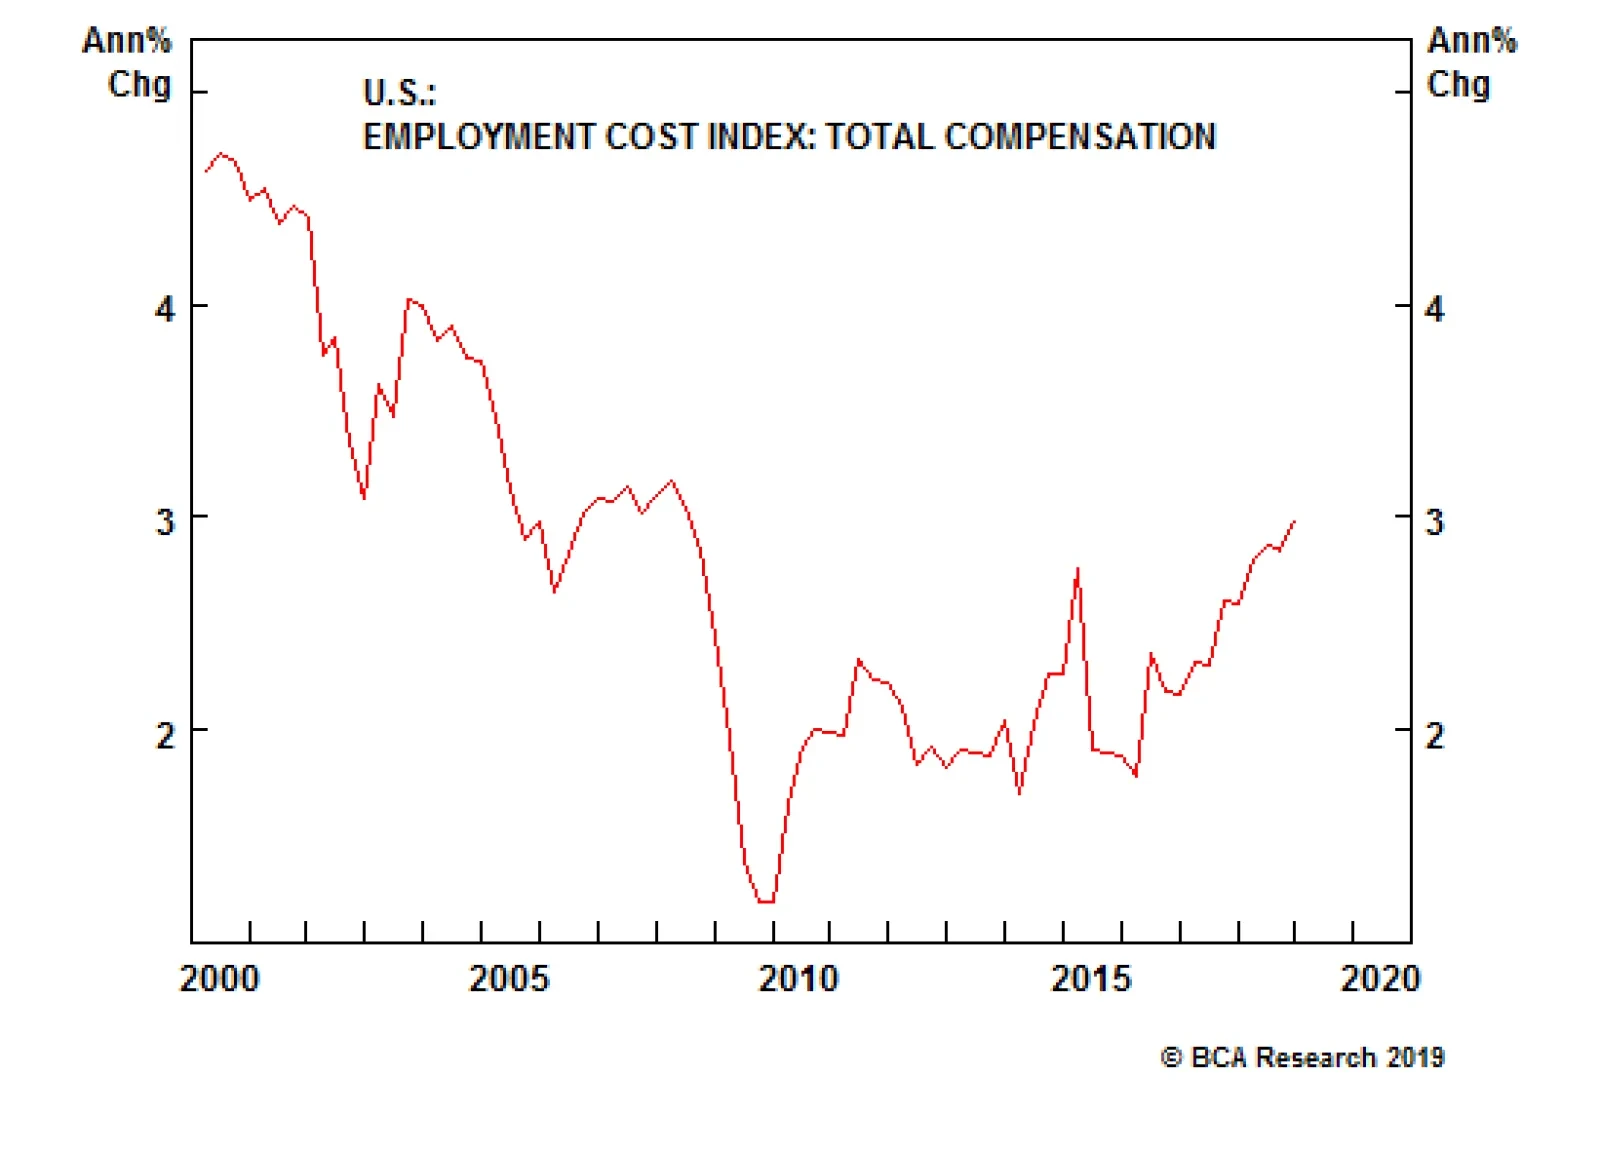
Compensation costs should not hurt margins if they grow at or below the sum of the rate of price-level and productivity gains. If inflation grows at the Fed’s 2% target, and productivity maintains its rough 1.25% growth pace, compensation growth of 3.25%…
All the components of the U.K. CHM have contributed to this worsening trend. Even short-term liquidity, which had been in a powerful uptrend for almost a decade, has started to roll over. The cause for this deterioration can be reduced to one cause:…
For IG, the gap between domestic and foreign issuers continues to widen, with the former worsening at the margin. For domestic issuers, interest and debt coverage has improved but operating margins and return on capital remain low while leverage is inching…
Highlights We recently upgraded our recommended investment stance on global corporate bonds to overweight on a tactical (3 to 6 months) basis.1 Feature That change was mostly based on our view that global financial conditions had tightened enough in late 2018 – both through lower equity prices and wider corporate credit spreads – to force central banks (most notably, the Fed) to shift to a less hawkish policy bias. Our opinion that global growth expectations had grown too pessimistic, particularly in the U.S., also played a role in the upgrade (Chart 1). Chart 1Global Corporates: Too Much Bad News Now Discounted
Global Corporates: Too Much Bad News Now Discounted
Global Corporates: Too Much Bad News Now Discounted
One other supporting factor for the upgrade to corporates: the prior bout of spread widening was not justified by a significant worsening of the underlying financial health of companies. With that in mind, this week we are presenting our latest update of the BCA Corporate Health Monitor (CHM) Chartbook. The CHMs are composite indicators of balance sheet and income statement ratios (using both top-down and bottom-up data) that are designed to assess the financial well-being of the overall non-financial corporate sectors in the major developed economies. A brief overview of the methodology is presented in Appendix 1 on Pages 15-16. The broad conclusion from the latest readings on our CHMs is that global credit quality has been enjoying a cyclical improvement, but with divergences starting to open up among individual regions. The U.S. has delivered the biggest improvement in corporate health, thanks largely to the boost to profitability from the Trump corporate tax cuts. Euro area corporates still appear to be in decent health, but are now exposed to the sharp slowing of European growth and the end of the ECB’s buying of corporates through its Asset Purchase Program. Meanwhile, corporate health in the U.K. and Japan is showing some strain from weaker growth in both countries. Given those regional divergences, we continue to prefer U.S. corporates over non-U.S. equivalents, even within that tactical overweight recommendation on global corporate exposure. Beyond that tactical timeframe, however, there are growing risks for corporate bond performance. Our base case scenario is that resilient U.S. growth and inflation will prompt the Fed to restart the rate hike cycle later in the year, creating a more challenging backdrop for corporates from U.S. growth uncertainty and rising volatility. Yet if the U.S. (and global) economy surprises to the downside, that is even worse for corporate bond returns given how the only real improvements in our global CHMs have come from cyclical variables like profit margins and interest coverage. U.S. Corporate Health Monitors: Strong Profits “Trump” High Leverage Our top-down CHM for the U.S. has ever so slightly flipped into the “improving health” zone, after flashing “deteriorating health” since mid-2014 (Chart 2). The resilience of the U.S. economy, combined with the positive impact on U.S. profitability from the Trump corporate cuts, has put U.S. companies in a cyclically healthier position, even with relatively high leverage. Chart 2Top-Down U.S. CHM: Supported By Cyclically Strong Profits
Top-Down U.S. CHM: Supported By Cyclically Strong Profits
Top-Down U.S. CHM: Supported By Cyclically Strong Profits
There are clear uptrends in the ratios that go into the top-down CHM that are directly related to corporate profits – return on capital, profit margins, interest coverage and debt coverage. From a fundamental perspective, the top-down U.S. CHM suggests that the U.S. credit cycle is being extended by the stubborn endurance of the U.S. business cycle. In other words, there are no immediate domestic pressures on U.S. corporate finances that should require significantly wider credit spreads to compensate for rising downgrade/default risk. The bottom-up versions of the U.S. CHMs for IG corporates (Chart 3) and HY companies (Chart 4) have also shown meaningful cyclical progress, with the HY indicator now firmly in “improving health” territory. This confirms that the signal from our top-down CHM is being reflected in both higher rated and lower quality companies. Yet the longer-term issues related to high leverage and low interest/debt coverage are not going away, suggesting that potential problems are being stored up for the next U.S. economic downturn. Chart 3Bottom-Up U.S. IG CHM: Steady, But Have Margins Peaked?
Bottom-Up U.S. IG CHM: Steady, But Have Margins Peaked?
Bottom-Up U.S. IG CHM: Steady, But Have Margins Peaked?
Chart 4Bottom-Up U.S. High-Yield CHM: Only A Cyclical Improvement
Bottom-Up U.S. High-Yield CHM: Only A Cyclical Improvement
Bottom-Up U.S. High-Yield CHM: Only A Cyclical Improvement
Interest coverage remains the key ratio to watch in both the IG and HY bottom-up U.S. CHMs. For IG, the fact that interest coverage has fallen in recent years, despite high profit margins and historically low corporate borrowing rates, is worrisome. This indicates that the stock of U.S. corporate debt is now so large that the interest expense required to service that debt is eating up a greater share of corporate revenues, even at a time when profit growth is still quite strong. This will raise downgrade risk if corporate borrowing rates were to increase significantly or if U.S. earnings growth slows sharply – likely from rising labor costs eroding high profit margins. For HY, interest coverage remains depressed by historical standards, with the liquidity ratio down to levels last seen prior to the 2009 recession. This suggests that U.S. HY companies are at risk of a severe default cycle when the current U.S. economic expansion ends, with fewer liquid assets available to meet current liabilities. Given these more medium-term fundamental concerns, we do not plan on overstaying our current tactical overweight stance on U.S. IG and HY corporates versus both U.S. Treasuries and non-U.S. corporates (Chart 5). We anticipate cutting our recommended exposure once the Fed begins signaling a need to restart the rate hikes, likely around mid-year. For those with an investment horizon beyond the next six months, the more prudent decision may be to sell into the corporate bond outperformance that we are expecting. The medium-term outlook for U.S. corporates is far more challenging given the advanced age of the U.S. monetary, business and credit cycles. Chart 5U.S. Corporates: Stay Tactically Overweight IG & HY
U.S. Corporates: Stay Tactically Overweight IG & HY
U.S. Corporates: Stay Tactically Overweight IG & HY
Euro Corporate Health Monitors: Stable, But Slowing Growth Is A Problem The CHMs remain a core part of our suite of bond market indicators, reliably proving their usefulness in helping evaluate the fundamental risks in owning corporate bonds. That does not, however, mean that there is no room for improvement in the CHM methodology from time to time. This is the case for our top-down CHM for the euro area, which has been behaving in a manner inconsistent with our bottom-up CHMs for the region – which are based on actual reported financial data from publicly traded companies – for some time. This is not the case in the U.S., where our bottom-up and top-down CHMs continue to move broadly in lockstep. Thus, we are taking our top-down euro area CHM “into the garage” for repairs. We will revisit all aspects of the methodology, from calculations to data sources, to try and improve the signal from the top-down euro area CHM. We plan on introducing a new and (hopefully) improved indicator sometime in the next few months. The message from our bottom-up CHMs for euro area IG and HY is still generally positive for overall European corporate health. Yet there are noticeable divergences within the sub-components of those individual CHMs that paint a more worrisome picture. For IG, the gap between domestic and foreign issuers in the euro area corporate bond market continues to widen, with the former worsening on the margin (Chart 6). While interest/debt coverage has improved for domestic issuers, operating margins and return on capital remain low and leverage has been inching higher. These trends have not been matched by foreign issuers. Perhaps most ominously, the short-term liquidity ratio has fallen quite sharply for domestic IG issuers in the euro area. Chart 6Bottom-Up Euro Area IG CHMs: Stable, But Watch Liquidity Ratios
Bottom-Up Euro Area IG CHMs: Stable, But Watch Liquidity Ratios
Bottom-Up Euro Area IG CHMs: Stable, But Watch Liquidity Ratios
For HY, the signal from the bottom-up CHM is more consistently positive between domestic and foreign issuers (Chart 7). Leverage has declined and operating margins have improved for both sets of issuers, but interest/debt coverage and liquidity are worse for domestic issuers. Chart 7Bottom-Up Euro Area High-Yield CHMs: Cyclically Healthier
Bottom-Up Euro Area High-Yield CHMs: Cyclically Healthier
Bottom-Up Euro Area High-Yield CHMs: Cyclically Healthier
Within the euro area, our bottom-up IG CHMs for Core and Periphery countries show that both remain in the “improving health” zone (Chart 8). Yet the CHM for the Core now sits on the edge of the “deteriorating health” zone, led by higher leverage, lower debt coverage and a sharply falling liquidity ratio. Notably, there is no gap between the profitability metrics of the Core and Peripheral companies used in our bottom-up CHMs. Chart 8Bottom-Up Euro Area IG CHMs: Trending In Wrong Direction
Bottom-Up Euro Area IG CHMs: Trending In Wrong Direction
Bottom-Up Euro Area IG CHMs: Trending In Wrong Direction
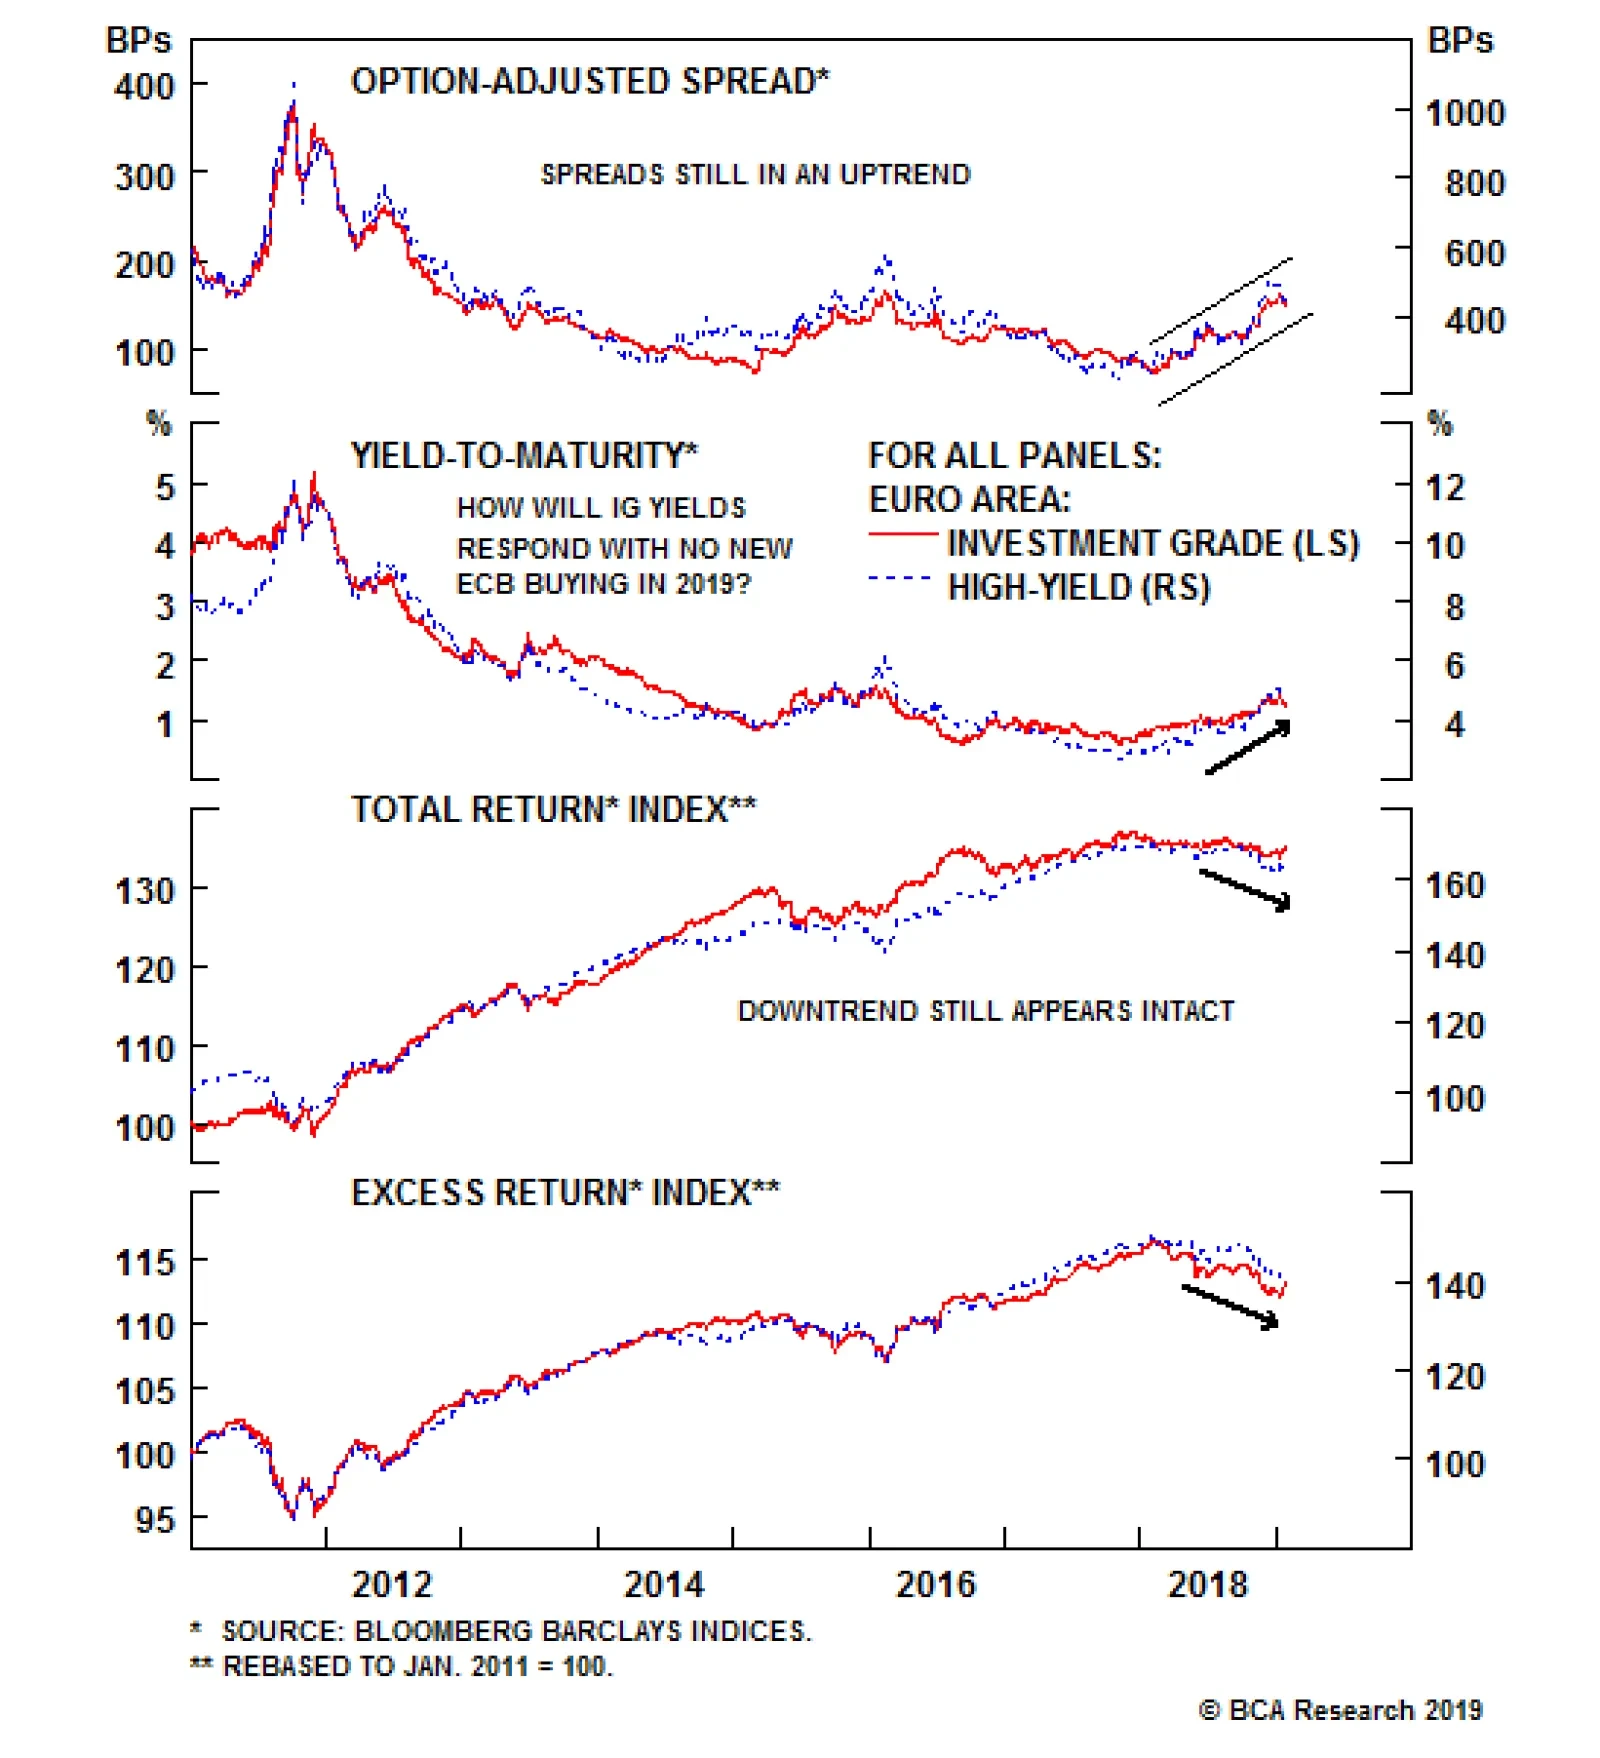
Peripheral European issuers continue to have much higher leverage and much lower interest coverage, the latter suggesting that Core issuers have benefitted more from the ECB’s super-easy monetary policies that have lowered borrowing costs (negative short-term interest rates, liquidity programs designed to prompt low-cost bank lending, and asset purchase programs that include buying of corporate bonds). Despite the lack of a major negative signal from the CHMs, we are concerned that the combination of slowing euro area economic growth and the end of ECB corporate bond buying will negatively impact the performance of euro area corporates (Chart 9). We are only maintaining a neutral allocation to euro area corporates, even within our current overweight stance on overall global corporates. In addition, we are sticking with our preference to favor U.S. corporates – both IG and HY – over euro area equivalents for two important reasons: stronger U.S. growth and better U.S. corporate health. Chart 9Euro Area Corporates: Stay Tactically Neutral IG & HY
Euro Area Corporates: Stay Tactically Neutral IG & HY
Euro Area Corporates: Stay Tactically Neutral IG & HY
Euro area corporates have not enjoyed the same rally that U.S. corporates have seen so far in 2019, and for good reasons. In Chart 10, we show an overall bottom-up CHM for the U.S. and euro area, combining both IG and HY are combined into a single measure for each region.2 The obvious visible trend is that U.S. corporate health has been steadily improving, while it is starting to worsen in the euro area. The gap between those two CHMs is strongly correlated to the difference in credit spreads between European and U.S. issuers (middle panel), suggesting that relative corporate health is favoring U.S. names. At the same time, the relatively stronger U.S. economy continues to support U.S. corporate performance versus euro area equivalents (bottom panel). Chart 10Relative Bottom-Up CHMs: Continue To Favor U.S. Over Europe
Relative Bottom-Up CHMs: Continue To Favor U.S. Over Europe
Relative Bottom-Up CHMs: Continue To Favor U.S. Over Europe
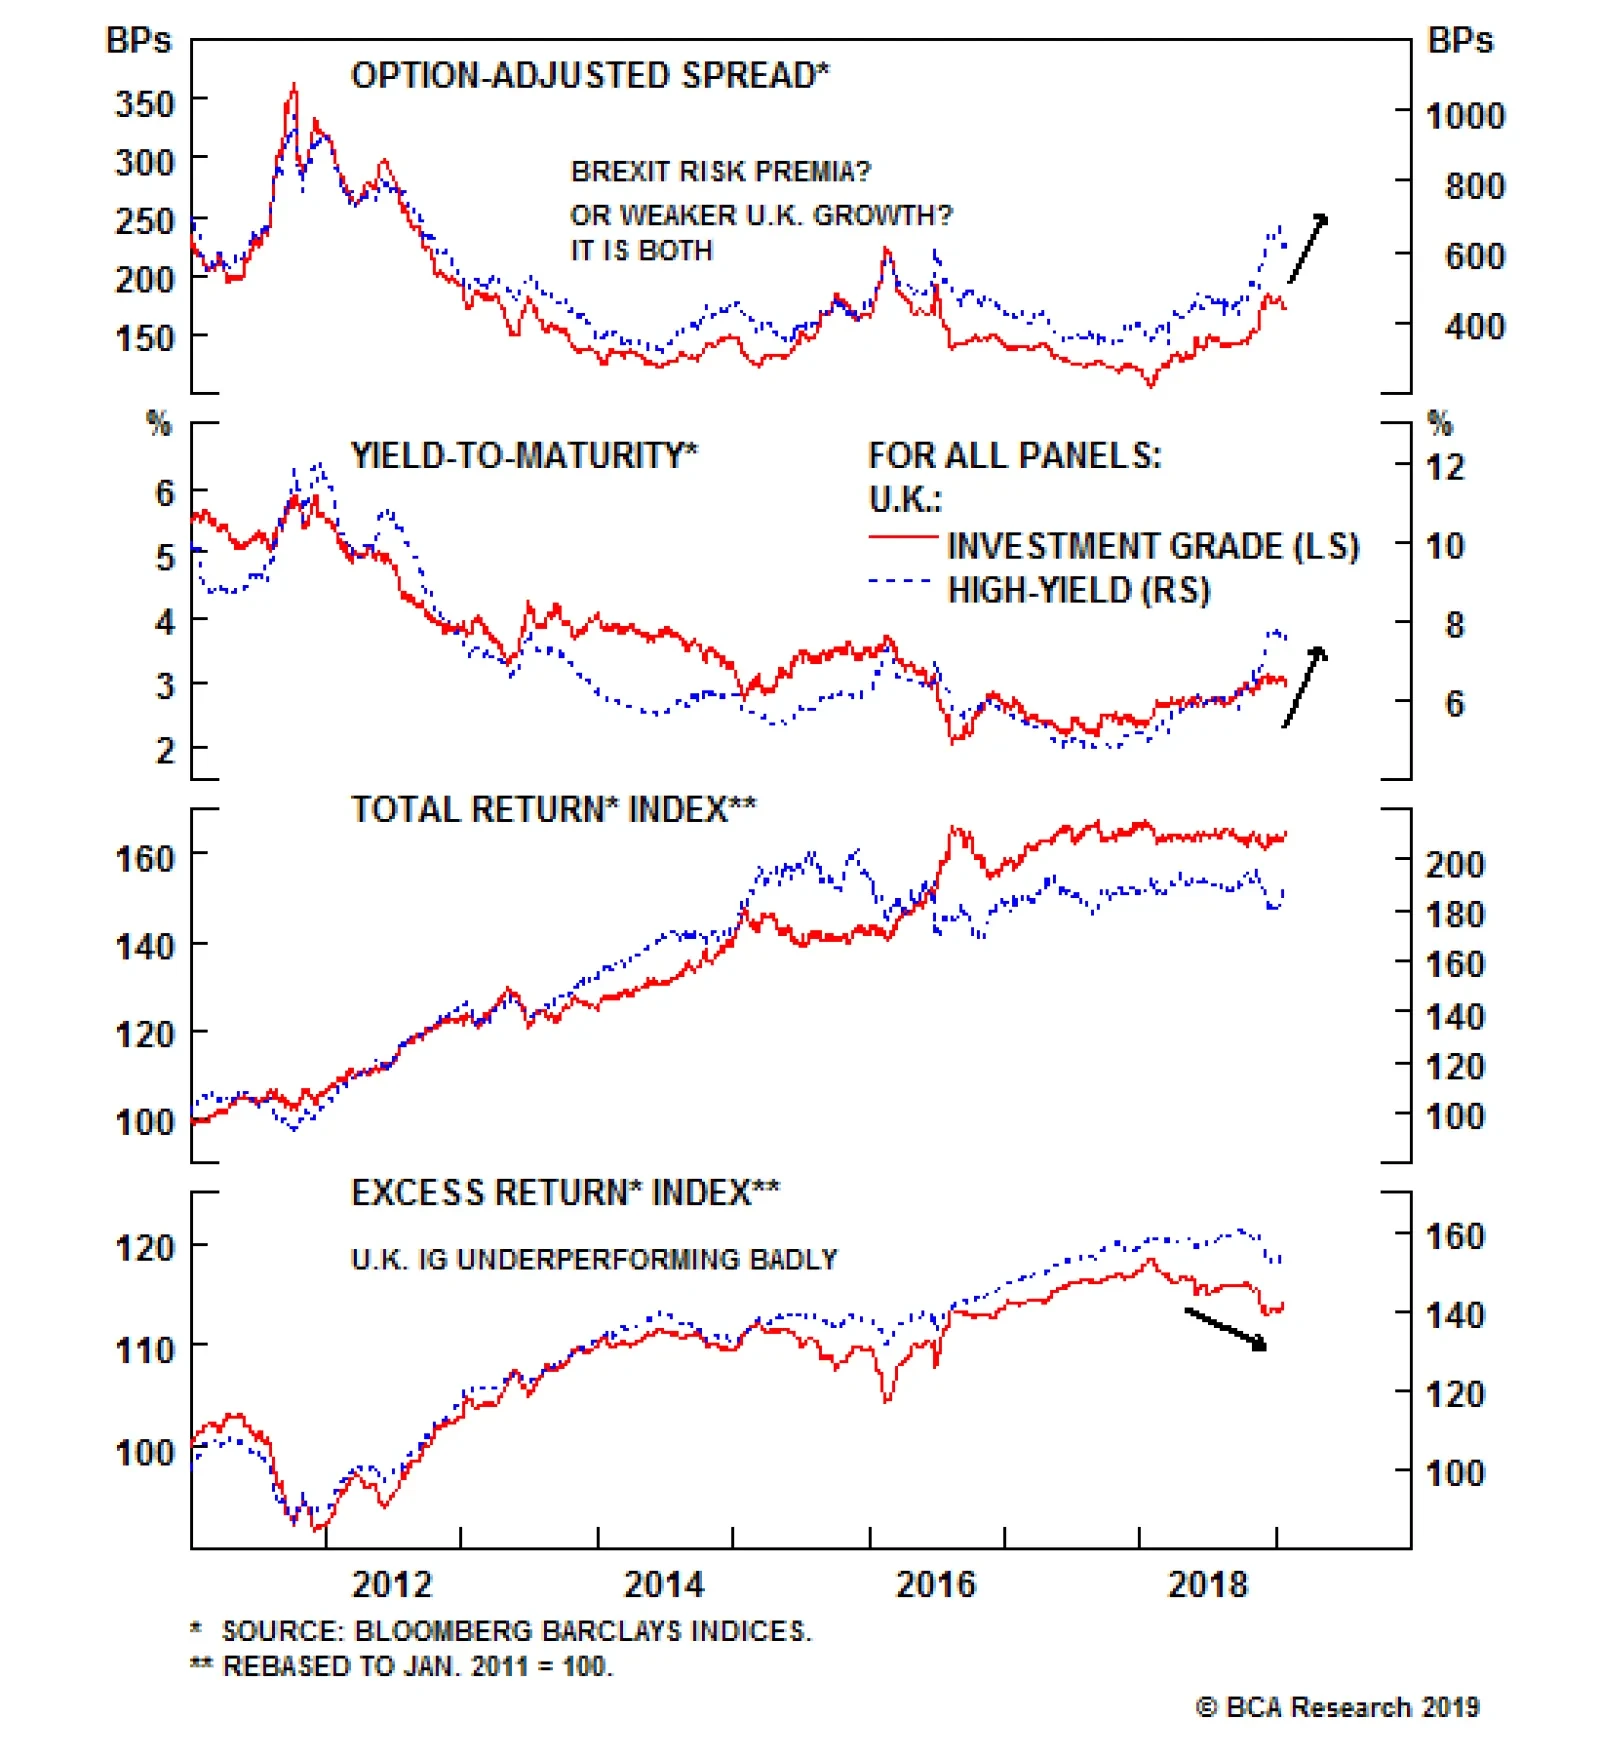
U.K. Corporate Health Monitor: A Brexit-Fueled Deterioration Our top-down U.K. CHM indicates that U.K. companies remain in the “improving health” zone, but just barely as the indicator has been drifting towards “deteriorating health” over the past two years. All the components of the U.K. CHM have contributed to this worsening trend (Chart 11). Even short-term liquidity, which has been in a powerful uptrend for almost a decade, has started to roll over. Chart 11U.K. Top-Down CHM: Cyclical Hit From Brexit Worries
U.K. Top-Down CHM: Cyclical Hit From Brexit Worries
U.K. Top-Down CHM: Cyclical Hit From Brexit Worries
The cause for this deterioration can be reduced to six letters: B-R-E-X-I-T. Two years of political uncertainty over the details of the U.K.’s future relationship with the European Union have eroded confidence among U.K. businesses and consumers. The result is slowing economic growth and diminished corporate profitability that has hit all earnings-related ratios in the U.K. CHM. Perhaps most disturbingly for U.K. credit performance, even the interest coverage ratio has rolled over – at a historically low level – despite the Bank of England keeping U.K. interest rates at deeply depressed levels. The toxic combination of political uncertainty and weaker economic growth has resulted in a substantial widening of U.K. credit spreads. The spread on U.K. HY corporates has widened by 293bps since September 2017 and now sits at the widest level since September 2012. U.K. IG has not seen the same degree of spread widening, but has underperformed even more on an excess return basis versus duration-matched U.K. Gilts (Chart 12). Chart 12U.K. Corporates: Brexit Uncertainty = Stay Underweight
U.K. Corporates: Brexit Uncertainty = Stay Underweight
U.K. Corporates: Brexit Uncertainty = Stay Underweight
We are currently recommending an underweight stance on U.K. corporates, even as we have become more tactically positive on overall global corporate exposure. While credit spreads have widened to levels that appear to offer value, U.K. economic momentum is fading steadily and leading economic indicators are pointing to even slower growth in 2019. With Conservative Prime Minster Theresa May now in a dramatically weakened position after losing the recent vote on her Brexit deal with the EU, there are no immediate options that will solve the Brexit uncertainty in a way that will provide a lasting boost to U.K. business confidence. In fact, the only realistic options – postponing Brexit, fresh U.K. elections, even a second Brexit referendum – all involve a period of even more uncertainty that will weigh on the performance of U.K. corporate debt. Japan Corporate Health Monitor: A Negative Signal Our bottom-up Japan CHM3 has consistently stayed in the “Improving health” zone since 2010; however, the most recent data shows that the health of Japanese corporates has started to deteriorate as the last data point from Q3/2018 is just above the zero line (Chart 13). The overall Japanese economy has generally performed well (by Japanese standards) over the past few years, boosted by “Abenomics” economic stimulus combined with the extraordinarily easy monetary policies of the Bank of Japan. Yet the slowing of global growth momentum seen in 2018 has weighed on the performance of the Japanese corporate sector, which is still heavily geared to exports and global growth. Chart 13Japan Bottom-Up CHM: Cyclical Deterioration
Japan Bottom-Up CHM: Cyclical Deterioration
Japan Bottom-Up CHM: Cyclical Deterioration
Looking at the components of the CHM, there was a modest deterioration of all the ratios last year, except for profit margins which have been virtually unchanged since 2015. On an absolute basis, the CHM components do not suggest any major problems with Japanese credit quality. Japanese companies are not highly levered and liquidity remains near the highest level seen since at least the mid-2000s. Interest coverage is still high on a historical basis and is much higher than the ratios seen in the other major developed markets. Yet at the same time, return on capital and profit margins remain very low compared to those same other major economies. Japanese companies remain cash-rich with low debt levels – a sharp contrast to the other countries show in this report. There are many potential cyclical risks for Japanese corporates in 2019: even weaker demand for Japanese exports, the drag on Japanese capital spending from firms worried about slowing global growth and the spillover effects from the U.S.-China trade war, even a possible hike in the consumption tax that the Abe government is still considering for October of this year. Yet these all would prevent any adjustment of the interest rate policy of the Bank of Japan, which remains the biggest factor to consider when looking at the investment prospects of Japanese corporate bonds. Japanese corporate spreads did not widen much compared to other countries’ corporate spreads in the 2018 selloff, due to their relative illiquidity and the extreme low level of interest rates in Japan. As the central bank is under no pressure to move off its current hyper-easy monetary policy settings, government bond yields and corporate spreads will remain low, even if the Japanese economy continues to slow. Therefore, for those investors who have access to the relatively small Japanese corporate debt market, we continue to recommend an overweight stance on Japanese corporates vs Japanese government bonds (Chart 14). Chart 14Japan Corporates: Stay Overweight Vs JGBs
Japan Corporates: Stay Overweight Vs JGBs
Japan Corporates: Stay Overweight Vs JGBs
Canada Corporate Health Monitor: Now Even Healthier Both our top-down and bottom-up Canadian CHMs indicate an improving trend in Canadian corporate health (Chart 15). Steady above-trend economic growth, combined with some increases in realized inflation, have helped boost the profitability and interest/debt coverage ratios. Yet not all the news is good - leverage is high and rising, while the absolute levels of return on capital and debt/interest coverage are low. This may be building up risks for the next Canadian economic downturn but, for now, Canadian companies look in decent shape. Chart 15Canada CHMs: Supported By Solid Growth
Canada CHMs: Supported By Solid Growth
Canada CHMs: Supported By Solid Growth
With so much of Canada’s economy (and its financial markets) geared to the performance of the energy sector, the recent recovery in global oil prices is a significant boost for the overall Canadian corporate market. Our commodity strategists see additional upside in oil prices over the next 6-9 months, which will further underpin the health of Canadian oil companies. Canadian corporates were not immune to the period of global spread widening seen at end of 2018, but the magnitude of the move was modest (Chart 16). This is a function of the still-low interest rate environment in Canada, where the Bank of Canada has not yet lifted policy rates to its own estimate of neutral (2.5-3.5%). Easy monetary conditions and relatively low Canadian interest rates will continue to make Canadian corporates relatively attractive, in an environment of decent growth and firm corporate health. Chart 16Canadian Corporates: Stay Overweight Vs Canadian Govt. Debt
Canadian Corporates: Stay Overweight Vs Canadian Govt. Debt
Canadian Corporates: Stay Overweight Vs Canadian Govt. Debt
We continue recommending an overweight position in Canadian corporate debt relative to Canadian government bonds on a tactical basis. Spreads have been in a very stable range since the 2009 recession, ranging between 100-200bps even during periods when our CHMs were indicating worsening corporate health. To break out of that range to the upside, we would need to see a sharp deterioration of Canadian economic growth or several more rate hikes from the Bank of Canada – neither outcome is likely over at least the next six months. Yet given how closely the Bank of Canada has been tracking the Fed’s current tightening cycle, we anticipate downgrading Canadian corporates at the same time do the same for U.S. corporates, likely around mid-2019. Robert Robis, CFA, Senior Vice President Global Fixed Income Strategy rrobis@bcaresearch.com Ray Park, CFA, Research Analyst ray@bcaresearch.com Appendix 1: An Overview Of The BCA Corporate Health Monitors The BCA Corporate Health Monitor (CHM) is a composite indicator designed to assess the underlying financial strength of the corporate sector for a country. The Monitor is an average of six financial ratios inspired by those used by credit rating agencies to evaluate individual companies. However, we calculate our ratios using top-down (national accounts) data for profits, interest expense, debt levels, etc. The idea is to treat the entire corporate sector as if it were one big company, and then look at the credit metrics that would be used to assign a credit rating to it. Importantly, only data for the non-financial corporate sector is used in the CHM, as the measures that would be used to measure the underlying health of banks and other financial firms are different than those for the typical company. The six ratios used in the CHM are shown in Table 1 below. To construct the CHM, the individual ratios are standardized, added together, and then shown as a deviation from the medium-term trend. That last part is important, as it introduces more cyclicality into the CHM and allows it to better capture major turning points in corporate well-being. Largely because of this construction, the CHM has a very good track record at heralding trend changes in corporate credit spreads (both for Investment Grade and High-Yield) over many cycles. Table 1Definitions Of Ratios That Go Into The CHMs
BCA Corporate Health Monitor Chartbook: Still OK … For Now
BCA Corporate Health Monitor Chartbook: Still OK … For Now
Top-down CHMs are now available for the U.S., euro area, the U.K. and Canada. The CHM methodology was extended in 2016 to look at corporate health by industry and by credit quality.4 The financial data of a broad set of individual U.S. and euro area companies was used to construct individual “bottom-up” CHMs using the same procedure as the more familiar top-down CHM. Some of the ratios differ from those used in the top-down CHM (see Table 1), largely due to definitional differences in data presented in national income accounts versus those from actual individual company financial statements. The bottom-up CHMs analyze the health of individual sectors, and can be aggregated up into broad CHMs for Investment Grade and High-Yield groupings to compare with credit spreads. In 2018, we introduced bottom-up CHMs for Japan and Canada. With the country expansion of our CHM universe, we now have coverage for 92% of the Bloomberg Barclays Global Aggregate Corporate Bond Index (Appendix Chart 1).
Image
Appendix 2: U.S. Bottom-Up CHMs For Selected Sectors
APPENDIX 2: ENERGY SECTOR
APPENDIX 2: ENERGY SECTOR
APPENDIX 2: MATERIALS SECTOR
APPENDIX 2: MATERIALS SECTOR
APPENDIX 2: COMMUNICATIONS SECTOR
APPENDIX 2: COMMUNICATIONS SECTOR
APPENDIX 2: CONSUMER DISCRETIONARY SECTOR
APPENDIX 2: CONSUMER DISCRETIONARY SECTOR
APPENDIX 2: CONSUMER STAPLES SECTOR
APPENDIX 2: CONSUMER STAPLES SECTOR
APPENDIX 2: HEALTH CARE SECTOR
APPENDIX 2: HEALTH CARE SECTOR
APPENDIX 2: INDUSTRIALS SECTOR
APPENDIX 2: INDUSTRIALS SECTOR
APPENDIX 2: TECHNOLOGY SECTOR
APPENDIX 2: TECHNOLOGY SECTOR
APPENDIX 2: UTILITIES SECTOR
APPENDIX 2: UTILITIES SECTOR
Footnotes 1 Please see BCA Global Fixed Income Strategy Weekly Report, “Enough With The Gloom: Upgrade Global Corporates On A Tactical Basis”, dated January 15th, 2019, available at gfis.bcaresearch.com. 2 We only use the CHMs for euro area domestic issuers in this aggregate bottom-up CHM, as this is most reflective of uniquely European corporate credits. This also eliminates double-counting from U.S. companies that issue in the euro area market that are part of our U.S. CHMs. 3 We do not currently have a top-down CHM for Japan given the lack of consistent government data sources for all the necessary components. 4 Please see Section II of The Bank Credit Analyst, “U.S. Corporate Health Gets A Failing Grade”, dated February 2016, available at bca.bcaresearch.com Recommendations The GFIS Recommended Portfolio Vs. The Custom Benchmark Index
BCA Corporate Health Monitor Chartbook: Still OK … For Now
BCA Corporate Health Monitor Chartbook: Still OK … For Now
Duration Regional Allocation Spread Product Tactical Trades Yields & Returns Global Bond Yields Historical Returns
Highlights Portfolio Strategy Vibrant and broad-based bank credit growth, pristine credit quality, pent up bank buyback demand and a V-shaped recovery in bank ROE more than offset the risk of 10/2 yield curve inversion, and suggest that the path of least resistance is higher for the S&P banks index. Rising residential construction versus stalling residential investment, easing interest rates, cheapened lumber prices, and alluring valuations and technicals all signal that more gains are in store for homebuilders at the expense of home improvement retailers. Recent Changes Initiate a long S&P homebuilding/short S&P home improvement retail pair trade today. Table 1
Dissecting 2019 Earnings
Dissecting 2019 Earnings
Feature Equities have retraced 50% of the peak-to-trough losses, and are still consolidating the post December Fed meeting tremor. Chart 1 shows that the VIX has been cut in half and the high-yield corporate bond option-adjusted spread has dropped 105bps. Retrenching volatility and deflating junk spreads suggest that the equity risk premium (ERP) remains uncharacteristically high. The path of least resistance is for the ERP to narrow in the coming months as we do not foresee recession in 2019. As a reminder, the ERP and the economy are inversely correlated. Chart 1Risk Premia Renormalization
Risk Premia Renormalization
Risk Premia Renormalization
Nevertheless, in order for the reflex rebound since the late-December lows to morph into a durable rally, the macro/policy backdrop has to turn from a headwind to a tailwind. We are closely monitoring three potential positive catalysts: A definitively more dovish Fed, which would help restrain the greenback A positive U.S./China trade resolution A continuation of the earnings juggernaut With regard to the macro related catalysts, an update to our reflation gauge (RG) is in order. The trade-weighted U.S. dollar has been depreciating since early November, the 10-year U.S. Treasury yield has come undone since the early November peak and oil prices are 33% lower than the early-October peak. These three variables comprise our RG and the signal is unambiguously bullish. In other words, a reflationary impulse looms in the months ahead which should pave the way for a rebound in both plunging investor sentiment and the gloomy economic surprise index (RG shown advanced, Chart 2). Chart 2Reflating Away
Reflating Away
Reflating Away
On the earnings front, last week we trimmed our end-2020 SPX EPS forecast to $181 while we sustained the multiple at 16.5 times which resulted in a 3,000 SPX target.1 Drilling beneath the surface and analyzing the composition of SPX profits is revealing. Table 2 highlights sell side analysts’ profit levels and growth projections on a per GICS1 sector basis and also their contribution to overall earnings along with each sector’s projected earnings weight and most recent market capitalization weight. Table 2S&P 500 Earnings Analysis
Dissecting 2019 Earnings
Dissecting 2019 Earnings
Chart 3 shows that financials, health care and industrials are responsible for 61% of the SPX’s profit growth in 2019. Interestingly, technology’s contribution has fallen to a mere 7.2% and even if we add the new communication services sector’s 9.6% contribution it still falls well shy of the tech sector’s market cap and earnings weight. Another worthwhile observation is that energy profits are no longer off the charts, as base effects since the early-2016 $25/bbl oil trough have filtered out of the dataset.
Chart 3
While the risk of disappointment surrounds financials, health care and industrials, there are high odds that tech surprises to the upside as it has borne the brunt of recent negative earnings revisions (Charts 4 & 5). In addition, if our Commodity & Energy Strategy service’s bullish oil forecast pans out this year, the negative energy sector contribution to SPX profit growth will get a sizable upward revision (please look forward to our GICS1 sector EPS growth models updates and profit margin analysis in next week’s report). Chart 4Earnings Revisions...
Earnings Revisions...
Earnings Revisions...
Chart 5...Really Weigh On Tech
...Really Weigh On Tech
...Really Weigh On Tech
In sum, if the Fed pauses its hiking cycle through at least the first half of the year, we see a positive U.S./China trade resolution and SPX profits sustain their upward trajectory, then the SPX budding recovery will morph into a durable rally. This week we are updating an interest rate sensitive index that is highly levered to the surging U.S. credit impulse (Chart 6) and are initiating an early cyclical intra-sector and intra-industry pair trade. Chart 6Heed The U.S. Credit Impulse Signal
Heed The U.S. Credit Impulse Signal
Heed The U.S. Credit Impulse Signal
Stick With Banks While our overweight call in the S&P banks index suffered a setback last month, since inception it has moved laterally, and we continue to recommend an above benchmark allocation to this key financials sub group. Not only are the odds of recession low for this year, but narrowing credit spreads and a reversal in financial conditions are also waving the green flag (junk spread shown inverted & advanced, bottom panel, Chart 7). Chart 7Bank On Banks
Bank On Banks
Bank On Banks
Unlike the previous three reporting seasons when banks revealed blowout numbers and stocks subsequently fell, this season some profit and top line growth misses have been greeted with rising bank stocks prices. Such a reaction suggests that the worst is behind this sector and a sustainable recovery looms. Importantly, on the loan growth front, our credit impulse diffusion index is reaccelerating (Chart 6) and the overall credit impulse is expanding (middle panel, Chart 7). Our total loans & leases growth model and BCA’s C&I loan growth model both corroborate this encouraging credit backdrop (second & bottom panels, Chart 8). The latter is significant given that C&I loans are the single biggest credit category in bank loan books (Chart 9). Importantly, C&I loans have gone vertical recently topping the 10.5% growth mark despite softening capex intentions and CEO confidence. Chart 8Credit Models Flashing Green
Credit Models Flashing Green
Credit Models Flashing Green
Chart 9Credit Models Flashing Green
C&I Loans Leading The Pack
C&I Loans Leading The Pack
Multi-decade highs in consumer confidence are offsetting the Fed’s tightening cycle and suggest that consumer loans, another key lending category, will also gain traction (third panel, Chart 8). The outlook for the second largest credit category, residential real estate, remains upbeat in spite of last quarter’s soft housing related data releases. The recent easing in monetary conditions has breathed life back into the mortgage purchase applications index and also house prices continue to expand at a healthy pace (Chart 10). The upshot is that first-time home buyers will show up this spring selling season. Chart 10Residential Loans Also On Solid Footing
Residential Loans Also On Solid Footing
Residential Loans Also On Solid Footing
Beyond positive credit growth prospects, credit quality remains pristine. BCA’s no recession in 2019 view remains intact, thus NPLs and chargeoffs should stay muted. As a reminder, U.S. banks are the best capitalized banks in the world,2 and their reserve coverage ratio has returned to 124%, a level last seen in 2007 (Chart 11). Chart 11Pristine Credit Quality
Pristine Credit Quality
Pristine Credit Quality
Another important source of support is equity retirement. Banks have been late to the buyback game as the GFC along with the new strict bank regulatory body, the Fed, really tied their hands with regard to shareholder friendly activities. In fact, according to flow of funds data, the financial sector is still a net equity issuer, albeit at a steeply decelerating pace especially relative to the non-financial corporate sector (Chart 12). Pent up financial sector buyback demand is a boon for bank EPS growth. Chart 12Pent Up Buyback Demand Getting Unleashed
Pent Up Buyback Demand Getting Unleashed
Pent Up Buyback Demand Getting Unleashed
This is significant at a time when analysts have been swiftly downgrading EPS growth figures for the SPX. Encouragingly, our bank EPS growth model captures all these positive forces and while it is decelerating it still suggests that profit growth will be stellar in 2019 and easily outpace the overall market (Chart 13). Chart 13Banks EPS Growth Will Outpace The Market
Banks EPS Growth Will Outpace The Market
Banks EPS Growth Will Outpace The Market
Despite all this enticing news, bank valuations remain anchored near rock bottom levels and a resurgent ROE is signaling that a re-rating phase looms (Chart 14). Chart 14Rerating In Still In The Early Innings
Rerating In Still In The Early Innings
Rerating In Still In The Early Innings
Nevertheless, there is one headwind banks face as the business cycle is long in the tooth and on track to become the longest expansion on record: the price of credit. One reason for the deflating relative stock price ratio since the January 2018 peak has been the yield curve slope flattening (Chart 15), as it suppresses bank net interest margins. Banks have been fighting this off partly by keeping their source of funding ultra-low judging by still anemic CD rates, according to Bankrate’s national average (bottom panel, Chart 15). Chart 15One Minor Headwind
One Minor Headwind
One Minor Headwind
While yield curve inversions have widened all the way out to the 7/1 slope, the key 10/2 slope has yet to invert. Were the 10-year U.S. treasury to resume its selloff, even a mild yield curve steepening will go a long way, as BCA’s bond strategists expect. Clearly a flattening curve is a risk to our sanguine bank view, but the rest of the positives we outlined above more than offset the yield curve blues. Adding it all up, vibrant and broad-based bank credit growth, pristine credit quality, pent up bank buyback demand and a V-shaped recovery in bank ROE more than offset the risk of the 10/2 yield curve inversion, and suggest that the path of least resistance is higher for the S&P banks index. Bottom Line: Maintain the overweight stance in the S&P banks index. The ticker symbols for the stocks in this index are: BLBG: S5BANKX – WFC, JPM, BAC, C, USB, PNC, BBT, STI, MTB, FITB, CFG, RF, KEY, HBAN, CMA, ZION, PBCT, SIVB, FRC, . Buy Homebuilders/Sell Home Improvement Retailers While we reiterate our recent overweight call on the S&P homebuilding index3 and the high-conviction underweight call on the S&P home improvement retail (HIR) group,4 it also makes sense to initiate a market neutral trade: long homebuilders/short HIR. This pair trade is levered on the swings of residential construction compared with residential investment. Currently the former is significantly outpacing the latter and suggests that relative share prices have ample room to run (top panel, Chart 16). Chart 16A Play On Residential Construction Vs. Investment
A Play On Residential Construction Vs. Investment
A Play On Residential Construction Vs. Investment
Put differently, this share price ratio moves in tandem with homebuilders breaking new ground versus home owners renovating their existing house. Chart 17 shows the NAHB’s homebuilder sales expectations survey compared with the remodeling expectations survey. This relative sentiment gauge has ticked up recently, confirming the message from national accounts that residential construction has the upper hand over residential investment. The upshot is that the bull market in relative share prices is in the early innings. Chart 17Relative Survey Expectations...
Relative Survey Expectations...
Relative Survey Expectations...
Keep in mind that housing starts and building permits are extremely sensitive to interest rates, depend on first time home buyers and move in lockstep with the homeownership rate. Currently, interest rates are easing, the homeownership rate is coming out of its GFC funk and first time home buyers are slated to make a comeback this spring selling season. This is a boon for homebuilders at the expense of HIR (middle & bottom panels, Chart 16). More specifically on the interest rate front, while both groups move with the oscillation of lending rates, new home sales are more sensitive than HIR sales to the price of credit. Our proxy of mortgage application purchase to refinance index does an excellent job in capturing this relative interest rate sensitivity and the recent jump signals that a catch up phase looms in the relative share price ratio (top panel, Chart 18). Chart 18...Easing Interest Rates...
...Easing Interest Rates...
...Easing Interest Rates...
Relative loan growth activity also corroborates that demand for residential real estate is outpacing demand for home renovation (bottom panel, Chart 18). Beyond these macro tailwinds for this intra-sector trade, the price of lumber is a key determinant of relative profitability: lumber represents an input cost to homebuilders whereas it is an important selling item in Big Box building & supply retailers that make a set margin on it. In other words, rising lumber prices are a boon for HIR and a bane to homebuilders and vice versa. The recent drubbing in lumber prices should ease margin pressures on homebuilders but eat into HIR profits (Chart 19). Chart 19...And Cheapened Lumber Prices Favor Homebuilders Over HIR
...And Cheapened Lumber Prices Favor Homebuilders Over HIR
...And Cheapened Lumber Prices Favor Homebuilders Over HIR
Finally, oversold relative technicals, depressed valuations and extreme sell side analysts’ relative profit pessimism, offer a very compelling entry point in the pair trade for fresh capital (Chart 20). Chart 20Oversold And Unloved
Oversold And Unloved
Oversold And Unloved
Netting it all out, rising residential construction versus stalling residential investment, easing interest rates, cheapened lumber prices, and relative alluring valuations and technicals all signal that more gains are in store for homebuilders at the expense of home improvement retailers. Bottom Line: Initiate a new long S&P homebuilding/short S&P home improvement retail pair trade today. The ticker symbols for the stocks in these indexes are: BLBG: S5HOME – DHI, LEN and PHM, and BLBG: S5HOMI – HD and LOW, respectively. Anastasios Avgeriou, Vice President U.S. Equity Strategy anastasios@bcaresearch.com footnotes 1 Please see BCA U.S. Equity Strategy Report, “Catharsis” dated January 14, 2019, available at uses.bcaresearch.com. 2 Please see BCA U.S. Equity Strategy Special Report, “Top 10 Reasons We Still Like Banks” dated March 5, 2018, available at uses.bcaresearch.com. 3 Please see BCA U.S. Equity Strategy Report, “Indurated” dated September 24, 2018, available at uses.bcaresearch.com. 4 Please see BCA U.S. Equity Strategy Report, “2019 Key Views: High-Conviction Calls” dated December 3, 2018, available at uses.bcaresearch.com. Current Recommendations Current Trades Size And Style Views Favor value over growth Favor large over small caps
Highlights Our market-based China growth indicator has risen meaningfully since mid-December, but mostly due to the equity components. For now, we regard this as a mixed signal, rather than a green light for Chinese stocks. Our research suggests that the odds of a serious earnings contraction for Chinese investable stocks over the coming year are high. Stocks are only likely to bottom near the end of the earnings adjustment process, if the 2014-2015 episode is a guide. Despite reasonable relative valuation, the long-term downtrend in sales-to-GDP suggests that Chinese stocks may be a “value trap” even over a multi-year time horizon. Feature Over the past several months BCA’s China Investment Strategy service has focused heavily on the cyclical condition of China’s economy, and whether any “green shoots” are evident from the key indicators that we track. We noted in last week’s report that our leading indicator for China’s old economy continues to point to slower growth over the coming months,1 a conclusion that is generally supported by the December trade, money, and credit data. In today's special report we address six questions concerning the outlook for Chinese stocks in light of passive outperformance versus the global benchmark over the past 3 months. We highlighted in last week’s report that investors should not view recent outperformance as a positive cyclical sign for Chinese stocks, and our answers to the questions below will hopefully provide readers with a fuller understanding of our neutral stance over a 6- to 12-month time horizon. The bottom line of our analysis is that a cyclical (6-12 month) overweight stance toward Chinese investable stocks versus the global benchmark remains uncompelling until the earnings contraction that is likely to occur this year is well underway. Chinese stocks offer reasonable-to-good valuation relative to global stocks, but may be cheap for a reason even over a multi-year time horizon. We remain tactically overweight Chinese investable stocks in recognition of the fact that investors may bid up the market in the lead-up to a possible trade deal with the U.S., but a legitimate improvement in domestic fundamentals is likely needed before we recommend investors upgrade their medium-term equity allocation to China. Q: Are the market signals from China-related assets bullish or bearish for Chinese stocks? A: Our market-based China growth indicator has risen meaningfully since mid-December, but mostly due to the equity components. For now, we regard this as a mixed signal, rather than a green light for Chinese stocks. Chart 1 presents our market-based China growth indicator, its four asset class subcomponents, and the range between the strongest and weakest components. Table 1 shows the change in the indicator and its 17 individual components since December 10, when the indicator clearly broke out. Chart 1Largely Driven By EM Equity Relative Performance
Largely Driven By EM Equity Relative Performance
Largely Driven By EM Equity Relative Performance
Both the chart and the table make it clear that the recent rise in the indicator is not uniform. While it is true that most of the individual components have improved over the past month, the equity components and two currency measures (the inverse of the dollar and Asian currencies), especially CNY-USD have accounted for most of the gains. Table 1(Anomalous) Equity Relative Performance Has Driven The Recent Improvement In Our MBCGI
Six Questions About Chinese Stocks
Six Questions About Chinese Stocks
As we noted in last week’s report, the Q4 outperformance of Chinese / emerging market stocks has been passive in nature, meaning that they have outperformed simply because developed market equities have collapsed. This, in combination with the fact that the strongest currency components have been linked to declining interest rate expectations in the U.S., tell us that the aggregate indicator has largely risen due to a 1) generalized selloff in global risk assets, 2) perceptions of easier Fed policy, and 3) a modest improvement in sentiment concerning the U.S.-China trade war. While it would not normally be the case that a global equity selloff would cause the equity component of our indicator to rise, December was atypical because many China-related assets had already declined in advance of the selloff. Are the latter two factors noted above reason enough move to an overweight stance towards Chinese stocks over the coming 6- to 12-months? In our view, the answer is “not yet”. While easier U.S. monetary policy is certainly welcome (particularly given our view that a recession is unlikely), it is not yet clear that either of the negative factors waiting on Chinese stocks in absolute terms will be resolved over the coming year. The first factor is the trade war with the U.S. We agree that the odds of some sort of a deal that avoids further tariff imposition have risen significantly over the past two months, more than we anticipated in the lead-up to the G20 meeting in Argentina. However, given the deep, structural nature of the dispute between the U.S. and China, we think it is dangerous to pre-emptively act on an agreement that may not come or may take much longer to be reached than investors currently hope. This risk is in addition to what is likely to be a deceleration in export growth over the coming few months regardless of the outcome of negotiations, as the export front-running effect that has boosted trade volume over the past several months wanes. But as we address in the next question, the second negative factor impacting Chinese stocks is the upcoming impact of a slowing domestic economy on Chinese earnings, an effect that is not likely to be impacted by the changes in the global economy implied by financial markets since mid-December. Q: What is the outlook for Chinese earnings growth over the coming year? A: Our research suggests that the odds of a serious earnings contraction over the coming year are high. Chart 2 presents an update to a model for Chinese ex-tech (or “old economy”) earnings growth that is part of our analytical toolkit.2 The model paints a rosy outlook for earnings growth, suggesting that it is set to decelerate over the coming year but will continue to grow at a double-digit rate. Chart 2The Li Keqiang Index Suggests Ex-Tech Earnings Growth Will Stay Positive...
The Li Keqiang Index Suggests Ex-Tech Earnings Growth Will Stay Positive...
The Li Keqiang Index Suggests Ex-Tech Earnings Growth Will Stay Positive...
However, one problem with the approach used in Chart 2 is the fact that we have used the Li Keqiang index (LKI) as the independent variable in the model. Historically the LKI has reliably led ex-tech earnings growth, but we have highlighted several times over the past few months that the index is currently being supported by trade front-running activity that is very likely to wane, a view that is strongly consistent with the very negative December trade data that was released earlier this week. Chart 3 presents a different approach, namely the prediction of the odds of a serious investable equity earnings contraction over the coming 12-months (defined as earnings growth falling below -5%). The statistical approach taken in Chart 3 (logistic regression) is similar to that often employed by researchers attempting to predict the odds of a recession, and the chart shows that the model successfully warned of the two major earnings contractions over the past decade. Crucially, the odds of a major contraction did not rise about the 50% mark in 2012, when investable earnings growth decelerated significantly and fell briefly into negative territory. Chart 3...But Other Measures Imply High Odds Of An Outright Contraction
...But Other Measures Imply High Odds Of An Outright Contraction
...But Other Measures Imply High Odds Of An Outright Contraction
The current message from the model is clear: the odds of a significant earnings contraction over the coming 12-months are as high as 70%, implying that the deceleration in 12-onth trailing earnings growth shown in panel 2 of Chart 3 is likely to continue. Q: If earnings are set to contract, when will investors anticipate a recovery? A: Near the end of the earnings adjustment process (for investable stocks), if the 2014-2015 episode is any guide. Chart 4 presents some perspective on the issue of when investors are likely to anticipate an eventual bottom in earnings if a contraction does indeed occur. The chart shows the level of 12-month forward earnings for investable and domestic stocks, and circles at what point stocks in each market bottomed during the massive selloff in the Chinese equity market from 2014-2015. Chart 4The Forward Earnings Adjustment Process Has Yet To Begin
The Forward Earnings Adjustment Process Has Yet To Begin
The Forward Earnings Adjustment Process Has Yet To Begin
The chart shows that the domestic market bottomed roughly halfway through the earnings adjustment process, whereas the investable market bottomed almost at the end of the process. The chart also shows that this adjustment process has barely begun, which (in combination with Chart 3) currently argues against a cyclically overweight stance towards global stocks. Q: In the developed world (particularly the U.S.), elevated profit margins are viewed as a potential risk to earnings over the coming few years. Is profit margin mean-reversion a risk in China? A: Based on the absolute level of profit margins, no. Relative to the history of poor profitability for Chinese stocks, yes. Chart 5 shows the 12-month trailing profit margins for global and investable Chinese stocks. It shows how global margins have now moved past their previous cycle highs, a circumstance that is even more extreme in the case of the U.S. Chart 5Chinese Profit Margins Are Very Low, But Very Elevated Relative To Their History
Chinese Profit Margins Are Very Low, But Very Elevated Relative To Their History
Chinese Profit Margins Are Very Low, But Very Elevated Relative To Their History
Investable Chinese margins are very low, which at first blush implies less risk of a mean-reversion assuming a common mean. However, panel 2 shows that Chinese investable margins are as high relative to their own history as they are for global stocks, and they have followed a similar pattern over the past few years. This suggests that the central tendency for Chinese margins is indeed significantly lower than it is for the global benchmark, and that the risk of mean reversion is similarly elevated in the face of a major economic shock. How is it possible that Chinese investable ROE has been similar or even higher than that of the global benchmark, but that profit margins are substantially lower? The answer, with very high likelihood, is leverage. Panel 1 of Chart 6 shows ROE for both markets, whereas panel 2 shows ROE divided by the profit margins shown in Chart 5. Using the DuPont approach to decomposing ROE, ROE divided by profit margins is equal to sales over equity, or the product of the asset turnover (sales/assets) and leverage (assets/equity) ratios. Panel 2 shows that product of turnover and leverage is more than twice that of global stocks, implying that Chinese companies are either extremely efficient in the use of their assets to generate sales, or they are very highly levered compared with global stocks. Chart 6High Chinese ROE The Result Of High Leverage
High Chinese ROE The Result Of High Leverage
High Chinese ROE The Result Of High Leverage
The latter is overwhelmingly more likely. We presented evidence in our August 29 Special Report suggesting that Chinese state-owned enterprises (SOEs) now have a negative net return on borrowed funds,3 a situation that has been caused by persistent leveraging since 2010. Not only does this explain the low profitability of Chinese stocks, it also magnifies the risk of significant mean reversion beyond a 6-12 month time horizon if Chinese policymakers panic and aggressively stimulate credit to stabilize a slowing economy. Q: Are Chinese stocks relatively cheap? A: The domestic equity market, yes. The investable market, somewhat. We presented Charts 7 and 8 in our final report of 2018,4 which showed the following: The forward P/E ratio for both domestic and investable Chinese stocks has improved substantially over the past several months. In relative terms, Chinese stocks are not as cheap as they have ever been but, depending on the measure employed, usually haven’t been cheaper (at least over the past decade). The A-share market particularly stands out, with all four relative valuation measures near, at, or above their 2014 levels. Chart 7Chinese Stocks Have Become Cheaper In Absolute Terms…
Chinese Stocks Have Become Cheaper In Absolute Terms...
Chinese Stocks Have Become Cheaper In Absolute Terms...
Chart 8…And Relative To Global Stocks
...And Relative To Global Stocks
...And Relative To Global Stocks
Since we published our December report, global stocks sold off severely, which has somewhat diminished the relative cheapness of investable Chinese stocks. But the bottom line for investors is that Chinese stocks are not expensive in absolute terms, relative to global stocks, or compared with the history of relative valuation. Q: Given reasonable-to-good valuation, are Chinese stocks a good long-term buy? A: Not necessarily. It is distinctly possible that Chinese investable stocks are an example of a “value trap”. When discussing equity valuations in our last report of the year, we also mused about whether Chinese stocks are a great long-term buy. We noted that valuation is normally a powerful predictor of 10-year future performance, but that deviations from this relationship can exist. Chart 9 shows a vivid example of such a deviation, by presenting the profile of investable and domestic equities versus U.S. and global stocks, all rebased to the start of the U.S. recession in December 2007. The chart shows that for every $100 invested in equities at the end of 2007, local currency prices have fallen to $52 for domestic stocks and $86 for investable stocks. This is in sharp contrast to $128 for global equities, and a whopping $176 for the S&P 500. Chart 9A (Largely) Lost Decade For Chinese Stocks
A (Largely) Lost Decade For Chinese Stocks
A (Largely) Lost Decade For Chinese Stocks
Excessive Chinese stock market valuation at the end of the last economic cycle has certainly contributed to the divergence shown in Chart 9. But Chart 10 shows another, less discussed factor: Chinese fundamental performance has not kept up with GDP growth, in contrast to developed markets. The chart shows the indexed ratio of sales per share to nominal GDP growth for the U.S. and China, and highlights that the latter has not only trended downward over time but has collapsed over the past four years. Chart 10Are Chinese Stocks Really A Play On Higher Chinese Growth?
Are Chinese Stocks Really A Play On Higher Chinese Growth?
Are Chinese Stocks Really A Play On Higher Chinese Growth?
At root, the secularly bullish narrative surrounding Chinese stocks is based on the fact that China’s rate of economic growth is considerably higher than that of the developed world. But if the fundamental performance of China’s listed equities cannot keep pace with the economy, are they such a compelling buy simply because they are not expensive? An alternative view is that Chinese stocks are cheap for a reason, i.e. that they are a value trap. In combination with the sizeable risks facing the Chinese economy from extremely elevated levels of corporate debt, the best answer that we can give investors looking out over a multi-year horizon is that Chinese stocks are a great long-term buy for those who do not share our structural concerns. On a risk-adjusted basis, we do not yet find the value proposition to be compelling, meaning that our recommended multi-year allocation to Chinese stocks is neutral. Jonathan LaBerge, CFA, Vice President Special Reports jonathanl@bcaresearch.com Footnotes 1 Please see China Investment Strategy Weekly Report “Monitoring The (Weak) Pulse Of The Data”, dated January 9, 2019, available at cis.bcaresearch.com. 2 Owing to the recent changes to the global industrial classification system (GICS), the chart shows Chinese earnings growth excluding the information technology and communication services sectors. 3 Please see China Investment Strategy Special Report “Chinese Policymakers: Facing A Trade-Off Between Growth And Leveraging”, dated August 29, 2018, available at cis.bcaresearch.com. 4 Please see China Investment Strategy Weekly Report “Legacies of 2018”, dated December 19, 2018, available at cis.bcaresearch.com. Cyclical Investment Stance Equity Sector Recommendations
Mr. X and his daughter, Ms. X, are long-time BCA clients who visit our office toward the end of each year to discuss the economic and financial market outlook. This report is an edited transcript of our recent conversation. Mr. X: I have been eagerly looking forward to this meeting given the recent turbulence in financial markets. Our investments have done poorly in the past year and, with hindsight, I wish I had followed my instincts to significantly cut our equity exposure at the end of 2017, although we did follow your advice to move to a neutral stance in mid-2018. I remain greatly troubled by economic and political developments in many countries. I have long believed in open and free markets and healthy political discourse, and this all seems under challenge. As always, there is much to talk about. Ms. X: Let me add that I also am pleased to have this opportunity to talk through the key issues that will influence our investment strategy over the coming year. As I am sure you remember, I was more optimistic than my father about the outlook when we met a year ago but things have not worked out as well as I had hoped. In retrospect, I should have paid more attention to your view that markets and policy were on a collision course as that turned out to be a very accurate prediction. When I joined the family firm in early 2017, I persuaded my father that we should have a relatively high equity exposure and that was the correct stance. However, this success led us to maintain too much equity exposure in 2018, and my father has done well to resist the temptation to say “I told you so.” So, we are left with a debate similar to last year: Should we move now to an underweight in risk assets or hold off on the hope that prices will reach new highs in the coming year? I am still not convinced that we have seen the peak in risk asset prices as there is no recession on the horizon and equity valuations are much improved, following recent price declines. I will be very interested to hear your views. BCA: Our central theme for 2018 that markets and policy would collide did turn out to be appropriate and, importantly, the story has yet to fully play out. The monetary policy tightening cycle is still at a relatively early stage in the U.S. and has not even begun in many other regions. Yet, although it was a tough year for most equity markets, the conditions for a major bear market are not yet in place. One important change to our view, compared to a year ago, is that we have pushed back the timing of the next U.S. recession. This leaves a window for risk assets to show renewed strength. It remains to be seen whether prices will reach new peaks, but we believe it would be premature to shift to an underweight stance on equities. For the moment, we are sticking with our neutral weighting for risk assets, but may well recommend boosting exposure if prices suffer further near-term weakness. We will need more clarity about the timing of a recession before we consider aggressively cutting exposure. Mr. X: I can see we will have a lively discussion because I do not share your optimism. My list of concerns is long and I hope we have time to get through them all. But first, let’s briefly review your predictions from last year. BCA: That is always interesting to do, although sometimes rather humbling. A year ago, our key conclusions were that: The environment of easy money, low inflation and healthy profit growth that has been so bullish for risk assets will start to change during the coming year. Financial conditions, especially in the U.S., will gradually tighten as decent growth leads to building inflationary pressures, encouraging central banks to withdraw stimulus. With U.S. equities at an overvalued extreme and investor sentiment overly optimistic, this will set the scene for an eventual collision between policy and the markets. The conditions underpinning the bull market will erode only slowly which means that risk asset prices should continue to rise for at least the next six months. However, long-run investors should start shifting to a neutral exposure. Given our economic and policy views, there is a good chance that we will move to an underweight position in risk assets during the second half of 2018. The U.S. economy is already operating above potential and thus does not need any boost from easier fiscal policy. Any major tax cuts risk overheating the economy, encouraging the Federal Reserve to hike interest rates and boosting the probability of a recession in 2019. This is at odds with the popular view that tax cuts will be good for the equity market. A U.S. move to scrap NAFTA would add to downside risks. For the second year in a row, the IMF forecasts of economic growth for the coming year are likely to prove too pessimistic. The end of fiscal austerity has allowed the Euro Area economy to gather steam and this should be sustained in 2018. However, the slow progress in negotiating a Brexit deal with the EU poses a threat to the U.K. economy. China’s economy is saddled with excessive debt and excess capacity in a number of areas. Any other economy would have collapsed by now, but the government has enough control over banking and other sectors to prevent a crisis. Growth should hold above 6% in the next year or two, although much will depend on how aggressively President Xi pursues painful reforms. The market is too optimistic in assuming that the Fed will not raise interest rates by as much as indicated in their “dots” projections. There is a good chance that the U.S. yield curve will become flat or inverted by late 2018. Bonds are not an attractive investment at current yields. Only Greece and Portugal have real 10-year government bond yields above their historical average. Corporate bonds should outperform governments, but a tightening in financial conditions will put these at risk in the second half of 2018. The Euro Area and Japanese equity markets should outperform the U.S. over the next year reflecting their better valuations and more favorable financial conditions. Developed markets should outperform the emerging market index. Historically, the U.S. equity market has led recessions by between 3 and 12 months. If, as we fear, a U.S. recession starts in the second half of 2019, then the stock market would be at risk from the middle of 2018. The improving trend in capital spending should favor industrial stocks. Our other two overweight sectors are energy and financials. The oil price will be well supported by strong demand and output restraint by OPEC and Russia. The Brent price should average $65 a barrel over the coming year, with risks to the upside. We expect base metals prices to trade broadly sideways but will remain highly dependent on developments in China. Modest positions in gold are warranted. Relative economic and policy trends will favor a firm dollar in 2018. Unlike at the start of 2017, investors are significantly short the dollar which is bullish from a contrary perspective. Sterling is quite cheap but Brexit poses downside risks. The key market-relevant geopolitical events to monitor will be fiscal policy and mid-term elections in the U.S., and reform policies in China. With the former, the Democrats have a good chance of winning back control of the House of Representatives, creating a scenario of complete policy gridlock. A balanced portfolio is likely to generate average returns of only 3.3% a year in nominal terms over the next decade. This compares to average returns of around 10% a year between 1982 and 2017. As already noted, the broad theme that policy tightening – especially in the U.S. – would become a problem for asset markets during the year was supported by events. However, the exact timing was hard to predict. The indexes for non-U.S. developed equity markets and emerging markets peaked in late-January 2018, and have since dropped by around 18% and 24%, respectively (Chart 1). On the other hand, the U.S. market, after an early 2018 sell-off, hit a new peak in September, before falling anew in the past couple of months. The MSCI All-Country World index currently is about 6% below end-2017 levels in local-currency terms. Chart 1Our 'Collision Course' Theme For 2018 Played Out
Our 'Collision Course' Theme For 2018 Played Out
Our 'Collision Course' Theme For 2018 Played Out
We started the year recommending an overweight in developed equity markets but, as you noted, shifted that to a neutral position mid-year. A year ago, we thought we might move to an underweight stance in the second half of 2018 but decided against this because U.S. fiscal stimulus boosted corporate earnings and extended the economic cycle. Our call that emerging markets would underperform was on target. Although it was U.S. financial conditions that tightened the most, Wall Street was supported by the large cut in the corporate tax rate while the combination of higher bond yields and dollar strength was a major problem for many indebted emerging markets. Overall, it was not a good year for financial markets (Table 1). Table 1Market Performance
OUTLOOK 2019: Late-Cycle Turbulence
OUTLOOK 2019: Late-Cycle Turbulence
As far as the overall macro environment was concerned, we were correct in predicting that the IMF was too pessimistic on economic growth. A year ago, the IMF forecast that the advanced economies would expand by 2% in 2018 and that has since been revised up to 2.4% (Table 2). This offset a slight downgrading to the performance of emerging economies. The U.S., Europe and Japan all grew faster than previously expected. Not surprisingly, inflation also was higher than forecast, although in the G7, it has remained close to the 2% level targeted by most central banks. Table 2IMF Economic Forecasts
OUTLOOK 2019: Late-Cycle Turbulence
OUTLOOK 2019: Late-Cycle Turbulence
Despite widespread fears to the contrary, the data have supported our view that Chinese growth would hold above a 6% pace in 2018. Nevertheless, a slowdown currently is underway and downside risks remain very much in place in terms of excessive credit and trade pressures. Another difficult year lies ahead for the Chinese authorities and we will no doubt return to this topic later. As far as our other key forecasts are concerned, we were correct in our views that oil prices and the U.S. dollar would rise and that the market would be forced to revise up its predictions of Fed rate hikes. Of course, oil has recently given back its earlier gains, but we assume that is a temporary setback. On the sector front, our macro views led us to favor industrials, financials and energy, but that did not work out well as concerns about trade took a toll on cyclical sectors. Overall, there were no major macro surprises in 2018, and it seems clear that we have yet to resolve the key questions and issues that we discussed a year ago. At that time, we were concerned about the development of late-cycle pressures that ultimately would undermine asset prices. That story has yet to fully play out. It is hard to put precise timing on when the U.S. economy will peak and, thus, when asset prices will be at maximum risk. Nevertheless, our base case is that there likely will be a renewed and probably final run-up in asset prices before the next recession. Late-Cycle Challenges Mr. X: This seems like déjà-vu all over again. Since we last met, the cycle is one year older and, as you just said, the underlying challenges facing economies and markets have not really changed. If anything, things are even worse: Global debt levels are higher, inflation pressures more evident, Fed policy is moving closer to restrictive territory and protectionist policies have ratcheted up. If it was right to be cautious six months ago, then surely we should be even more cautious now. Ms. X: Oh dear, it does seem like a repeat of last year’s discussion because, once again, I am more optimistic than my father. Obviously, there are structural problems in a number of countries and, at some point, the global economy will suffer another recession. But timing is everything, and I attach very low odds to a downturn in the coming year. Meanwhile, I see many pockets of value in the equity market. Rather than cut equity positions, I am inclined to look for buying opportunities. BCA: We sympathize with your different perspectives because the outlook is complex and we also have lively debates about the view. The global equity index currently is a little below where it was when we met last year, but there has been tremendous intra-period volatility. That pattern seems likely to be repeated in 2019. In other words, it will be important to be flexible about your investment strategy. You both make good points. It is true that there are several worrying problems regarding the economic outlook, including excessive debt, protectionism and building inflation risks. At the same time, the classic conditions for an equity bear market are not yet in place, and may not be for some time. This leaves us in the rather uncomfortable position of sitting on the fence with regard to risk asset exposure. We are very open to raising exposure should markets weaken further in the months ahead, but also are keeping careful watch for signs that the economic cycle is close to peaking. In other words, it would be a mistake to lock in a 12-month strategy right now. Mr. X: I would like to challenge the consensus view, shared by my daughter, that the next recession will not occur before 2020, and might even be much later. The main rationale seems to be that the policy environment remains accommodative and there are none of the usual imbalances that occur ahead of recessions. Of course, U.S. fiscal policy has given a big boost to growth in the past year, but I assume the effects will wear off sharply in 2019. More importantly, there is huge uncertainty about the level of interest rates that will trigger economic problems. It certainly has not taken much in the way of Fed rate hikes to rattle financial markets. Thus, monetary policy may become restrictive much sooner than generally believed. I also strongly dispute the idea that there are no major financial imbalances. If running U.S. federal deficits of $1 trillion in the midst of an economic boom is not an imbalance, then I don’t know what is! At the same time, the U.S. corporate sector has issued large amounts of low-quality debt, and high-risk products such as junk-bond collateralized debt obligations have made an unwelcome reappearance. It seems that the memories of 2007-09 have faded. It is totally normal for long periods of extremely easy money to be accompanied by growing leverage and increasingly speculative financial activities, and I don’t see why this period should be any different. And often, the objects of speculation are not discovered until financial conditions become restrictive. Finally, there are huge risks associated with rising protectionism, the Chinese economy appears to be struggling, Italy’s banks are a mess, and the Brexit fiasco poses a threat to the U.K. economy. Starting with the U.S., please go ahead and convince me why a recession is more than a year away. BCA: It is natural for you to worry that a recession is right around the corner. The current U.S. economic expansion will become the longest on record if it makes it to July 2019, at which point it will surpass the 1990s expansion. Economists have a long and sad history of failing to forecast recessions. Therefore, a great deal of humility is warranted when it comes to predicting the evolution of the business cycle. The Great Recession was one of the deepest downturns on record and the recovery has been fairly sluggish by historic standards. Thus, it has taken much longer than usual for the U.S. economy to return to full employment. Looking out, there are many possible risks that could trip up the U.S. economy but, for the moment, we see no signs of recession on the horizon (Chart 2). For example, the leading economic indicator is still in an uptrend, the yield curve has not inverted and our monetary indicators are not contracting. Our proprietary recession indicator also suggests that the risk is currently low, although recent stock market weakness implies some deterioration. Chart 2Few U.S Recession 'Red Flags'
Few U.S Recession 'Red Flags'
Few U.S Recession 'Red Flags'
The buildup in corporate debt is a cause for concern and we are not buyers of corporate bonds at current yields. However, the impact of rising yields on the economy is likely to be manageable. The interest coverage ratio for the economy as a whole – defined as the profits corporations generate for every dollar of interest paid – is still above its historic average (Chart 3). Corporate bonds are also generally held by non-leveraged investors such as pension funds, insurance companies, and ETFs. The impact of defaults on the economy tends to be more severe when leveraged institutions are the ones that suffer the greatest losses. Chart 3Interest Costs Not Yet A Headwind
Interest Costs Not Yet A Headwind
Interest Costs Not Yet A Headwind
We share your worries about the long-term fiscal outlook. However, large budget deficits do not currently imperil the economy. The U.S. private sector is running a financial surplus, meaning that it earns more than it spends (Chart 4). Not only does this make the economy more resilient, it also provides the government with additional savings with which to finance its budget deficit. If anything, the highly accommodative stance of fiscal policy has pushed up the neutral rate of interest, giving the Fed greater scope to raise rates before monetary policy enters restrictive territory. The impetus of fiscal policy on the economy will be smaller in 2019 than it was in 2018, but it will still be positive (Chart 5). Chart 4The U.S. Private Sector Is Helping To Finance The Fiscal Deficit
The U.S. Private Sector Is Helping To Finance The Fiscal Deficit
The U.S. Private Sector Is Helping To Finance The Fiscal Deficit
Chart 5U.S. Fiscal Policy Still Stimulative In 2019
U.S. Fiscal Policy Still Stimulative In 2019
U.S. Fiscal Policy Still Stimulative In 2019
The risks to growth are more daunting outside the U.S. As you point out, Italy is struggling to contain borrowing costs, a dark cloud hangs over the Brexit negotiations, and China and most other emerging markets have seen growth slow meaningfully. The U.S., however, is a relatively closed economy – it is not as dependent on trade as most other countries. Its financial system is reasonably resilient thanks to the capital its banks have raised over the past decade. In addition, Dodd-Frank and other legislation have made it more difficult for financial institutions to engage in reckless risk-taking. Mr. X: I would never take a benign view of the ability and willingness of financial institutions to engage in reckless behavior, but maybe I am too cynical. Even if you are right that debt does not pose an immediate threat to the market, surely it will become a huge problem in the next downturn. If the U.S. federal deficit is $1 trillion when the economy is strong, it is bound to reach unimaginable levels in a recession. And, to make matters worse, the Federal Reserve may not have much scope to lower interest rates if they peak at a historically low level in the next year or so. What options will policymakers have to respond to the next cyclical downturn? Is there a limit to how much quantitative easing central banks can do? BCA: The Fed is aware of the challenges it faces if the next recession begins when interest rates are still quite low. Raising rates rapidly in order to have more “ammunition” for counteracting the downturn would hardly be the best course of action as this would only bring forward the onset of the recession. A better strategy is to let the economy overheat a bit so that inflation rises. This would allow the Fed to push real rates further into negative territory if the recession turns out to be severe. There is no real limit on how much quantitative easing the Fed can undertake. The FOMC will undoubtedly turn to asset purchases and forward guidance again during the next economic downturn. Now that the Fed has crossed the Rubicon into unorthodox monetary policy without generating high inflation, policymakers are likely to try even more exotic policies, such as price-level targeting. The private sector tends to try to save more during recessions. Thus, even though the fiscal deficit would widen during the next downturn, there should be plenty of buyers for government debt. However, once the next recovery begins, the Fed may feel increasing political pressure to keep rates low in order to allow the government to maintain its desired level of spending and taxes. The Fed guards its independence fiercely, but in a world of increasingly political populism, that independence may begin to erode. This will not happen quickly, but to the extent that it does occur, higher inflation is likely to be the outcome. Ms. X: I would like to explore the U.S.-China dynamic a bit more because I see that as one of the main challenges to my more optimistic view. I worry that President Trump will continue to take a hard line on China trade because it plays well with his base and has broad support in Congress. And I equally worry that President Xi will not want to be seen giving in to U.S. bullying. How do you see this playing out? BCA: Investors hoping that U.S. President Donald Trump and his Chinese counterpart Xi Jinping will reach a deal to end the trade war on the sidelines of the forthcoming G20 leaders' summit in Buenos Aires are likely to be disappointed. President Trump's fiscal policy is completely inconsistent with his trade agenda. Fiscal stimulus in a full-employment economy will suck in imports. It also forces the Fed to raise rates more aggressively than it otherwise would, leading to a stronger dollar. The result will be a larger U.S. trade deficit. Trump will not be able to blame Canada or Mexico for a deteriorating trade position because he just signed a trade agreement with them. The new USMCA agreement is remarkably similar to NAFTA, with the notable exception that it contains a clause barring Canada and Mexico from negotiating bilateral trade deals with China. This means Trump needs a patsy who will take the blame for America's burgeoning trade deficit and China will fill that role. For his part, President Xi knows full well that he will still be China’s leader when Trump is long gone. Giving in to Trump’s demands would hurt him politically. All this means that the trade war will persist. Mr. X: I see a trade war as a major threat to the economy, but it is not the only thing that could derail the economic expansion. Let’s explore that issue in more detail. The Economic Outlook Mr. X: You have shown in previous research that housing is often a very good leading indicator of the U.S. economy, largely because it is very sensitive to changes in the monetary environment. Are you not concerned about the marked deterioration in recent U.S. housing data? BCA: Recent trends in housing have indeed been disappointing, with residential investment acting as a drag on growth for three consecutive quarters. The weakness has been broad-based with sales, the rate of price appreciation of home prices, and builder confidence all declining (Chart 6). Even though the level of housing affordability is decent by historical standards, there has been a fall in the percentage of those who believe that it is a good time to buy a home. Chart 6Recent Softness In U.S. Housing
Recent Softness In U.S. Housing
Recent Softness In U.S. Housing
There are a few possible explanations for the weakness. First, the 2007-09 housing implosion likely had a profound and lasting impact on the perceived attractiveness of home ownership. The homeownership rate for people under 45 has remained extremely low by historical standards. Secondly, increased oversight and tighter regulations have curbed mortgage supply. Finally, the interest rate sensitivity of the sector may have increased with the result that even modest increases in the mortgage rate have outsized effects. That, in turn, could be partly explained by recent tax changes that capped the deduction on state and local property taxes, while lowering the limit on the tax deductibility of mortgage interest. The trend in housing is definitely a concern, but the odds of a further major contraction seem low. Unlike in 2006, the home vacancy rate stands near record levels and the same is true for the inventory of homes. The pace of housebuilding is below the level implied by demographic trends and consumer fundamentals are reasonably healthy. The key to the U.S. economy lies with business investment and consumer spending and these areas are well supported for the moment. Consumers are benefiting from continued strong growth in employment and a long overdue pickup in wages. Meanwhile, the ratio of net worth-to-income has surpased the previous peak and the ratio of debt servicing-to-income is low (Chart 7). Last year, we expressed some concern that the depressed saving rate might dampen spending, but the rate has since been revised substantially higher. Based on its historical relationship with U.S. household net worth, there is room for the saving rate to fall, fueling more spending. Real consumer spending has grown by 3% over the past year and there is a good chance of maintaining that pace during most of 2019. Chart 7U.S. Consumer Fundamentals Are Healthy
U.S. Consumer Fundamentals Are Healthy
U.S. Consumer Fundamentals Are Healthy
Turning to capital spending, the cut in corporate taxes was obviously good for cash flow, and surveys show a high level of business confidence. Moreover, many years of business caution toward spending has pushed up the average age of the nonresidential capital stock to the highest level since 1963 (Chart 8). Higher wages should also incentivize firms to invest in more machinery. Absent some new shock to confidence, business investment should stay firm during the next year. Chart 8An Aging Capital Stock
An Aging Capital Stock
An Aging Capital Stock
Overall, we expect the pace of U.S. economic growth to slow from its recent strong level, but it should hold above trend, currently estimated to be around 2%. As discussed earlier, that means capacity pressures will intensify, causing inflation to move higher. Ms. X: I share the view that the U.S. economy will continue to grow at a healthy pace, but I am less sure about the rest of the world. BCA: You are right to be concerned. We expected U.S. and global growth to diverge in 2018, but not by as much as occurred. Several factors have weighed on CEO confidence outside of the U.S., including trade wars, a strong dollar, higher oil prices, emerging market turbulence, the return of Italian debt woes, and a slowdown in the Chinese economy. The stress has shown up in the global manufacturing PMI, although the latter is still at a reasonably high level (Chart 9). Global export growth is moderating and the weakness appears to be concentrated in capex. Capital goods imports for the major economies, business investment, and the production of investment-related goods have all decelerated this year. Chart 9Global Manufacturing Slowdown
Global Manufacturing Slowdown
Global Manufacturing Slowdown
Our favorite global leading indicators are also flashing yellow (Chart 10). BCA’s global leading economic indicator has broken below the boom/bust line and its diffusion index suggests further downside. The global ZEW composite and the BCA boom/bust indicator are both holding below zero. Chart 10Global Growth Leading Indicators
Global Growth Leading Indicators
Global Growth Leading Indicators
Current trends in the leading indicators shown in Chart 11 imply that the growth divergence between the U.S. and the rest of the world will remain a key theme well into 2019. Among the advanced economies, Europe and Japan are quite vulnerable to the global soft patch in trade and capital spending. Chart 11Global Economic Divergence Will Continue
Global Economic Divergence Will Continue
Global Economic Divergence Will Continue
The loss of momentum in the Euro Area economy, while expected, has been quite pronounced. Part of this is due to the dissipation of the 2016/17 economic boost related to improved health in parts of the European banking system that sparked a temporary surge in credit growth. The tightening in Italian financial conditions following the government’s budget standoff with the EU has weighed on overall Euro Area growth. Softer Chinese demand for European exports, uncertainties related to U.S. trade policy and the torturous Brexit negotiations, have not helped the situation. Real GDP growth decelerated to close to a trend pace by the third quarter of 2018. The manufacturing PMI has fallen from a peak of 60.6 in December 2017 to 51.5, mirroring a 1% decline in the OECD’s leading economic indicator for the region. Not all the economic news has been bleak. Both consumer and industrial confidence remain at elevated levels according to the European Commission (EC) surveys, consistent with a resumption of above-trend growth. Even though exports have weakened substantially from the booming pace in 2017, the EC survey on firms’ export order books remains at robust levels (Chart 12). Importantly for the Euro Area, the bank credit impulse has moved higher.The German economy should also benefit from a rebound in vehicle production which plunged earlier this year following the introduction of new emission standards. Chart 12Europe: Slowing, But No Disaster
Europe: Slowing, But No Disaster
Europe: Slowing, But No Disaster
We interpret the 2018 Euro Area slowdown as a reversion-to-the-mean rather than the start of an extended period of sub-trend growth. Real GDP growth should fluctuate slightly above trend pace through 2019. Given that the Euro Area’s output gap is almost closed, the ECB will not deviate from its plan to end its asset purchase program by year end. Gradual rate hikes should begin late in 2019, assuming that inflation is closer to target by then. In contrast, the Bank of Japan (BoJ) is unlikely to change policy anytime soon. The good news is that wages have finally begun to grow at about a 2% pace, although it required extreme labor shortages. Yet, core inflation is barely positive and long-term inflation expectations are a long way from the 2% target. The inflation situation will have to improve significantly before the BoJ can consider adjusting or removing the Yield Curve Control policy. This is especially the case since the economy has hit a bit of an air pocket and the government intends to raise the VAT in 2019. Japan’s industrial production has stalled and we expect the export picture to get worse before it gets better. We do not anticipate any significant economic slack to develop, but even a sustained growth slowdown could partially reverse the gains that have been made on the inflation front. Ms. X: We can’t talk about the global economy without discussing China. You have noted in the past how the authorities are walking a tightrope between trying to unwind the credit bubble and restructure the economy on the one hand, and prevent a destabilizing economic and financial crisis on the other. Thus far, they have not fallen off the tightrope, but there has been limited progress in resolving the country’s imbalances. And now the authorities appear to be stimulating growth again, risking an even bigger buildup of credit. Can it all hold together for another year? BCA: That’s a very good question. Thus far, there is not much evidence that stimulus efforts are working. Credit growth is still weak and leading economic indicators have not turned around (Chart 13). There is thus a case for more aggressive reflation, but the authorities also remain keen to wean the economy off its addiction to debt. Chart 13China: No Sign Of Reacceleration
China: Credit Impulse Remains Weak
China: Credit Impulse Remains Weak
Waves of stimulus have caused total debt to soar from 140% of GDP in 2008 to about 260% of GDP at present (Chart 14). As is usually the case, rapid increases in leverage have been associated with a misallocation of capital. Since most of the new credit has been used to finance fixed-asset investment, the result has been overcapacity in a number of areas. For example, the fact that 15%-to-20% of apartments are sitting vacant is a reflection of overbuilding. Meanwhile, the rate of return on assets in the state-owned corporate sector has fallen below borrowing costs. Chart 14China: Debt Still Rising
China: Debt Still Rising
China: Debt Still Rising
Chinese exports are holding up well so far, but this might only represent front-running ahead of the implementation of higher tariffs. Judging from the steep drop in the export component of both the official and private-sector Chinese manufacturing PMI, exports are likely to come under increasing pressure over the next few quarters as the headwinds from higher tariffs fully manifest themselves (Chart 15). Chart 15Chinese Exports About To Suffer
Chinese Exports About To Suffer
Chinese Exports About To Suffer
The most likely outcome is that the authorities will adjust the policy dials just enough to stabilize growth sometime in the first half of 2019. The bottoming in China’s broad money impulse offers a ray of hope (Chart 16). Still, it is a tentative signal at best and it will take some time before this recent easing in monetary policy shows up in our credit impulse measure and, later, economic growth. A modest firming in Chinese growth in the second half of 2019 would provide a somewhat stronger demand backdrop for commodities and emerging economies that sell goods to China. Chart 16A Ray Of Hope From Broad Money
bca.bca_mp_2018_12_01_c16
bca.bca_mp_2018_12_01_c16
Ms. X: If you are correct about a stabilization in the Chinese economy next year, this presumably would be good news for emerging economies, especially if the Fed goes on hold. EM assets have been terribly beaten down and I am looking for an opportunity to buy. BCA: Fed rate hikes might have been the catalyst for the past year’s pain in EM assets, but it is not the underlying problem. As we highlighted at last year’s meeting, the troubles for emerging markets run much deeper. Our long-held caution on emerging economies and markets is rooted in concern about deteriorating fundamentals. Excessive debt is a ticking time bomb for many of these countries; EM dollar-denominated debt is now as high as it was in the late 1990s as a share of both GDP and exports (Chart 17). Moreover, the declining long-term growth potential for emerging economies as a group makes it more difficult for them to service the debt. The structural downtrend in EM labor force and productivity growth underscores that trend GDP growth has collapsed over the past three decades (Chart 17, bottom panel). Chart 17EM Debt A Problem Given Slowing Supply-Side...
EM Debt A Problem Given Slowing Supply-Side...
EM Debt A Problem Given Slowing Supply-Side...
Decelerating global growth has exposed these poor fundamentals. EM sovereign spreads have moved wider in conjunction with falling PMIs and slowing industrial production and export growth. And it certainly does not help that the Fed is tightening dollar-based liquidity conditions. EM equities usually fall when U.S. financial conditions tighten (Chart 18). Chart 18...And Tightening Financial Conditions
...And Tightening Financial Conditions
...And Tightening Financial Conditions
Chart 19 highlights the most vulnerable economies in terms of foreign currency funding requirements, and foreign debt-servicing obligations relative to total exports. Turkey stands out as the most vulnerable, along with Argentina, Brazil, Indonesia, Chile, and Colombia. In contrast, Emerging Asia appears to be in better shape relative to the crisis period of the late 1990s. Chart 19Spot The Outliers
OUTLOOK 2019: Late-Cycle Turbulence
OUTLOOK 2019: Late-Cycle Turbulence
The backdrop for EM assets is likely to get worse in the near term, given our view that the Fed will continue to tighten and China will be cautious about stimulating more aggressively. Our base case outlook sees some relief in the second half of 2019, but it is more of a “muddle-through” scenario than a V-shaped economic recovery. Mr. X: Perhaps EM assets could enjoy a bounce next year if the Chinese economy stabilizes, but the poor macro fundamentals you mentioned suggest that it would be a trade rather than a buy-and-hold proposition. I am inclined to avoid the whole asset class in 2019. Bond Market Prospects Ms. X: Let’s turn to fixed income now. I was bearish on bonds in 2018, but yields have risen quite a bit, at least in the United States. The Fed has lifted the fed funds rate by 100 basis points over the past year and I don’t see a lot of upside for inflation. So perhaps yields have peaked and will move sideways in 2019, which would be good for stocks in my view. BCA: Higher yields have indeed improved bond value recently. Nonetheless, they are not cheap enough to buy at this point (Chart 20). The real 10-year Treasury yield, at close to 1%, is still depressed by pre-Lehman standards. Long-term real yields in Germany and Japan remain in negative territory at close to the lowest levels ever recorded. Chart 20Real Yields Still Very Depressed
Real Yields Still Very Depressed
Real Yields Still Very Depressed
We called the bottom in global nominal bond yields in 2016. Our research at the time showed that the cyclical and structural factors that had depressed yields were at an inflection point, and were shifting in a less bond-bullish direction. Perhaps most important among the structural factors, population aging and a downward trend in underlying productivity growth resulted in lower equilibrium bond yields over the past couple of decades. Looking ahead, productivity growth could stage a mild rebound in line with the upturn in the growth rate of the capital stock (Chart 21). As for demographics, the age structure of the world population is transitioning from a period in which aging added to the global pool of savings to one in which aging is beginning to drain that pool as people retire and begin to consume their nest eggs (Chart 22). The household saving rates in the major advanced economies should trend lower in the coming years, placing upward pressure on equilibrium global bond yields. Chart 21Productivity Still Has Some Upside
Productivity Still Has Some Upside
Productivity Still Has Some Upside
Chart 22Demographics Past The Inflection Point
Demographics Past The Inflection Point
Demographics Past The Inflection Point
Cyclical factors are also turning against bonds. U.S. inflation has returned to target and the Fed is normalizing short-term interest rates. The market currently is priced for only one more rate hike after December 2018 in this cycle, but we see rates rising more than that. Treasury yields will follow as market expectations adjust. Long-term inflation expectations are still too low in the U.S. and most of the other major economies to be consistent with central banks’ meeting their inflation targets over the medium term. As actual inflation edges higher, long-term expectations built into bond yields will move up. The term premium portion of long-term bond yields is also too low. This is the premium that investors demand to hold longer-term bonds. Our estimates suggest that the term premium is still negative in the advanced economies outside of the U.S., which is not sustainable over the medium term (Chart 23). Chart 23Term Premia Are Too Low
Term Premia Are Too Low
Term Premia Are Too Low
We expect term premia to rise for two main reasons. First, investors have viewed government bonds as a good hedge for their equity holdings because bond prices have tended to rise when stock prices fell. Investors have been willing to pay a premium to hold long-term bonds to benefit from this hedging effect. But the correlation is now beginning to change as inflation and inflation expectations gradually adjust higher and output gaps close. As the hedging benefit wanes, the term premium should rise back into positive territory. Second, central bank bond purchases and forward guidance have depressed yields as well as interest-rate volatility. The latter helped to depress term premia in the bond market. This effect, too, is beginning to unwind. The Fed is letting its balance sheet shrink by about $50 billion per month. The Bank of England has kept its holdings of gilts and corporate bonds constant for over a year, while the ECB is about to end asset purchases. The Bank of Japan continues to buy assets, but at a much reduced pace. All this means that the private sector is being forced to absorb a net increase in government bonds for the first time since 2014 (Chart 24). Chart 25 shows that bond yields in the major countries will continue to trend higher as the rapid expansion of central bank balance sheets becomes a thing of the past. Chart 24Private Sector To Absorb More Bonds
OUTLOOK 2019: Late-Cycle Turbulence
OUTLOOK 2019: Late-Cycle Turbulence
Chart 25QE Unwind Will Weigh On Bond Prices
QE Unwind Will Weigh On Bond Prices
QE Unwind Will Weigh On Bond Prices
Ms. X: I’m not a fan of bonds at these levels, but that sounds overly bearish to me, especially given the recent plunge in oil prices. BCA: Lower oil prices will indeed help to hold down core inflation to the extent that energy prices leak into non-energy prices in the near term. Nonetheless, in the U.S., this effect will be overwhelmed by an overheated economy. From a long-term perspective, we believe that investors still have an overly benign view of the outlook for yields. The market expects that the 10-year Treasury yield in ten years will only be slightly above today’s spot yield, which itself is still very depressed by historical standards (Chart 26). And that also is the case in the other major bond markets. Chart 26Forward Yields Are Too Low
Forward Yields Are Too Low
Forward Yields Are Too Low
Of course, it will not be a straight line up for yields – there will be plenty of volatility. We expect the 10-year Treasury yield to peak sometime in 2019 or early 2020 in the 3.5%-to-4% range, before the next recession sends yields temporarily lower. Duration should be kept short at least until the middle of 2019, with an emphasis on TIPS relative to conventional Treasury bonds. We will likely downgrade TIPS versus conventionals once long-term inflation expectations move into our target range, which should occur sometime during 2019. The ECB and Japan will not be in a position to raise interest rates for some time, but the bear phase in U.S. Treasurys will drag up European and Japanese bond yields (at the very long end of the curve for the latter). Total returns are likely to be negative in all of the major bond markets in 2019. Real 10-year yields in all of the advanced economies are still well below their long-term average, except for Greece, Italy and Portugal (Chart 27). Chart 27Valuation Ranking Of Developed Bond Markets
OUTLOOK 2019: Late-Cycle Turbulence
OUTLOOK 2019: Late-Cycle Turbulence
Within global bond portfolios, we recommend being underweight bond markets where central banks are in a position to raise short-term interest rates (the U.S. and Canada), and overweight those that are not (Japan and Australia). The first ECB rate hike is unlikely before the end of 2019. However, the imminent end of the asset purchase program argues for no more than a benchmark allocation to core European bond markets within global fixed-income portfolios, especially since real 10-year yields in parts of continental Europe are the furthest below their long-term average. We are overweight gilts at the moment, but foresee shifting to underweight in 2019, depending on how Brexit plays out. Ms. X: What about corporate bonds? I know that total returns for corporates will be poor if government bond yields are rising. But you recommended overweighting corporate bonds relative to Treasurys last year. Given your view that the next U.S. recession is more than a year away, it seems reasonable to assume they will outperform government bonds. BCA: We were overweight corporates in the first half of 2018, but took profits in June and shifted to neutral at the same time that we downgraded our equity allocation. Spreads had tightened to levels that did not compensate investors for the risks. Recent spread widening has returned some value to U.S. corporates. The 12-month breakeven spreads for A-rated and Baa-rated corporate bonds are almost back up to their 50th percentile relative to history (Chart 28). Still, these levels are not attractive enough to justify buying based on valuation alone. As for high-yield, any rise in the default rate would quickly overwhelm the yield pickup in this space. Chart 28Corporate Bond Yields Still Have Upside
Corporate Bond Yields Still Have Upside
Corporate Bond Yields Still Have Upside
It is possible that some of the spread widening observed in October and November will reverse, but corporates offer a poor risk/reward tradeoff, even if the default rate stays low. Corporate profit growth is bound to decelerate in 2019. This would not be a disaster for equities, but slowing profit growth is more dangerous for corporate bond excess returns because the starting point for leverage is already elevated. As discussed above, at a macro level, the aggregate interest coverage ratio for the U.S. corporate sector is decent by historical standards. However, this includes mega-cap companies that have little debt and a lot of cash. Our bottom-up research suggests that interest coverage ratios for firms in the Bloomberg Barclays corporate bond index will likely drop close to multi-decade lows during the next recession, sparking a wave of downgrade activity and fallen angels. Seeing this coming, investors may require more yield padding to compensate for these risks as profit growth slows. Our next move will likely be to downgrade corporate bonds to underweight. We are watching the yield curve, bank lending standards, profit growth, and monetary indicators for signs to further trim exposure. You should already be moving up in quality within your corporate bond allocation. Mr. X: We have already shifted to underweight corporate bonds in our fixed income portfolio. Even considering the cheapening that has occurred over the past couple of months, spread levels still make no sense in terms of providing compensation for credit risk. Equity Market Outlook Ms. X: While we all seem to agree that corporate bonds are not very attractive, I believe that enough value has been restored to equities that we should upgrade our allocation, especially if the next recession is two years away. And I know that stocks sometimes have a powerful blow-off phase before the end of a bull market. Mr. X: This is where I vehemently disagree with my daughter. The recent sell-off resembles a bloodbath in parts of the global market. It has confirmed my worst fears, especially related to the high-flying tech stocks that I believe were in a bubble. Hopes for a blow-off phase are wishful thinking. I’m wondering if the sell-off represents the beginning of an extended bear market. BCA: Some value has indeed been restored. However, the U.S. market is far from cheap relative to corporate fundamentals. The trailing and 12-month forward price-earnings ratios (PER) of 20 and 16, respectively, are still far above their historical averages, especially if one leaves out the tech bubble period of the late 1990s. And the same is true for other metrics such as price-to-sales and price-to-book value (Chart 29). BCA’s composite valuation indicator, based on 8 different valuation measures, is only a little below the threshold of overvaluation at +1 standard deviation because low interest rates still favor equities on a relative yield basis. Chart 29U.S. Equities Are Not Cheap
U.S. Equities Are Not Cheap
U.S. Equities Are Not Cheap
It is true that equities can reward investors handsomely in the final stage of a bull market. Chart 30 presents cumulative returns to the S&P 500 in the last nine bull markets. The returns are broken down by quintile. The greatest returns, unsurprisingly, generally occur in the first part of the bull market (quintile 1). But total returns in the last 20% of the bull phase (quintile 5) have been solid and have beaten the middle quartiles. Chart 30Late-Cycle Blow-Offs Can Be Rewarding
OUTLOOK 2019: Late-Cycle Turbulence
OUTLOOK 2019: Late-Cycle Turbulence
Of course, the tricky part is determining where we are in the bull market. We have long viewed financial markets through the lens of money and credit. This includes a framework that involves the Fed policy cycle. The historical track record for risk assets is very clear; they tend to perform well when the fed funds rate is below neutral, whether rates are rising or falling. Risk assets tend to underperform cash when the fed funds rate is above neutral (Table 3). Table 3Stocks Do Well When The Fed Funds Rate Is Below Neutral
OUTLOOK 2019: Late-Cycle Turbulence
OUTLOOK 2019: Late-Cycle Turbulence
We believe the fed funds rate is still in easy territory. This suggests that it is too early to shift to underweight on risk assets. We may even want to upgrade to overweight if stocks become cheap enough, as long as Fed policy is not restrictive. That said, there is huge uncertainty about the exact level of rates that constitutes “neutral” (or R-star in the Fed’s lingo). Even the Fed is unsure. This means that we must watch for signs that the fed funds rate has crossed the line into restrictive territory as the FOMC tightens over the coming year. An inversion of the 3-month T-bill/10-year yield curve slope would be a powerful signal that policy has become tight, although the lead time of an inverted curve and declining risk asset prices has been quite variable historically. Finally, it is also important to watch U.S. profit margins. Some of our research over the past couple of years focused on the late-cycle dynamics of previous long expansions, such as the 1960s, 1980s and 1990s. We found that risk assets came under pressure once U.S. profit margins peaked. Returns were often negative from the peak in margins to the subsequent recession. Mr. X: U.S. profit margins must be close to peak levels. I’ve seen all sorts of anecdotal examples of rising cost pressures, not only in the labor market. BCA: We expected to see some margin pressure to appear by now. S&P 500 EPS growth will likely top out in the next couple of quarters, if only because the third quarter’s 26% year-over-year pace is simply not sustainable. But it is impressive that our margin proxies are not yet flagging an imminent margin squeeze, despite the pickup in wage growth (Chart 31). Chart 31U.S. Margin Indicators Still Upbeat
U.S. Margin Indicators Still Upbeat
U.S. Margin Indicators Still Upbeat
Margins according to the National Accounts (NIPA) data peaked in 2014 and have since diverged sharply with S&P 500 operating margins. It is difficult to fully explain the divergence. The NIPA margin is considered to be a better measure of underlying U.S. corporate profitability because it includes all companies (not just 500), and it is less subject to accounting trickery. That said, even the NIPA measure of margins firmed a little in 2018, along with the proxies we follow that correlate with the S&P 500 measure. The bottom line is that the macro variables that feed into our top-down U.S. EPS model point to a continuing high level of margins and fairly robust top-line growth, at least for the near term. For 2019, we assumed slower GDP growth and incorporated some decline in margins into our projection just to err on the conservative side. Nonetheless, our EPS model still projects a respectable 8% growth rate at the end of 2019 (Chart 32). The dollar will only be a minor headwind to earnings growth unless it surges by another 10% or more. Chart 32EPS Growth Forecasts
EPS Growth Forecasts
EPS Growth Forecasts
The risks to EPS growth probably are to the downside relative to our forecast, but the point is that U.S. earnings will likely remain supportive for the market unless economic growth is much weaker than we expect. None of this means that investors should be aggressively overweight stocks now. We trimmed our equity recommendation to benchmark in mid-2018 for several reasons. At the time, value was quite poor and bottom-up earnings expectations were too high, especially on a five-year horizon. Also, sentiment measures suggested that investors were overly complacent. As you know, we are always reluctant to chase markets into highly overvalued territory, especially when a lot of good news has been discounted. As we have noted, we are open to temporarily shifting back to overweight in equities and other risk assets. The extension of the economic expansion gives more time for earnings to grow. The risks facing the market have not eased much but, given our base-case macro view, we would be inclined to upgrade equities if there is another meaningful correction. Of course, our profit, monetary and economic indicators would have to remain supportive to justify an upgrade. Mr. X: But you are bearish on bonds. We saw in October that the equity market is vulnerable to higher yields. BCA: It certainly won’t be smooth sailing through 2019 as interest rates normalize. Until recently, higher bond yields reflected stronger growth without any associated fears that inflation was a growing problem. The ‘Fed Put’ was seen as a key backstop for the equity bull market. But now that the U.S. labor market is showing signs of overheating, the bond sell-off has become less benign for stocks because the Fed will be less inclined to ease up at the first sign of trouble in the equity market. How stocks react in 2019 to the upward trend in yields depends a lot on the evolution of actual inflation and long-term inflation expectations. If core PCE inflation hovers close to or just above 2% for a while, then the Fed Put should still be in place. However, it would get ugly for both bonds and stocks if inflation moves beyond 2.5%. Our base case is that this negative dynamic won’t occur until early 2020, but obviously the timing is uncertain. One key indicator to watch is long-term inflation expectations, such as the 10-year TIPS breakeven inflation rate (Chart 33). It is close to 2% at the moment. If it shifts up into the 2.3%-2.5% range, it would confirm that inflation expectations have returned to a level that is consistent with the Fed meeting its 2% inflation target on a sustained basis. This would be a signal to the Fed that it is must become more aggressive in calming growth, with obvious negative consequences for risk assets. Chart 33Watch For A Return To 2.3%-2.5% Range
Watch For A Return To 2.3%-2.5% Range
Watch For A Return To 2.3%-2.5% Range
Mr. X: I am skeptical that the U.S. corporate sector can pull off an 8% earnings gain in 2019. What about the other major markets? Won’t they get hit hard if global growth continues to slow as you suggest? BCA: Yes, that is correct. It is not surprising that EPS growth has already peaked in the Euro Area and Japan. The profit situation is going to deteriorate quickly in the coming quarters. Industrial production growth in both economies has already dropped close to zero, and we use this as a proxy for top-line growth in our EPS models. Nominal GDP growth has decelerated sharply in both economies in absolute terms and relative to the aggregate wage bill. These trends suggest that profit margins are coming under significant downward pressure. Even when we build in a modest growth pickup and slight rebound in margins in 2019, EPS growth falls close to zero by year-end according to our models. Both the Euro Area and Japanese equity markets are cheap relative to the U.S., based on our composite valuation indicators (Chart 34). However, neither is above the threshold of undervaluation (+1 standard deviation) that would justify overweight positions on valuation alone. We think the U.S. market will outperform the other two at least in the first half of 2019 in local and, especially, common-currency terms. Chart 34Valuation Of Nonfinancial Equity Markets Relative To The U.S.
OUTLOOK 2019: Late-Cycle Turbulence
OUTLOOK 2019: Late-Cycle Turbulence
Ms. X: It makes sense that U.S. profit growth will outperform the other major developed countries in 2019. I would like to circle back to emerging market assets. I understand that many emerging economies have deep structural problems. But you admitted that the Chinese authorities will eventually stimulate enough to stabilize growth, providing a bounce in EM growth and asset prices next year. These assets seem cheap enough to me to warrant buying now in anticipation of that rally. As we all know, reversals from oversold levels can happen in a blink of an eye and I don’t want to miss it. BCA: We are looking for an opportunity to buy as well, but are wary of getting in too early. First, valuation has improved but is not good enough on its own to justify buying now. EM stocks are only moderately undervalued based on our EM composite valuation indicator and the cyclically-adjusted P/E ratio (Chart 35). EM currencies are not particularly cheap either, outside of Argentina, Turkey and Mexico (Charts 36A and 36B). Valuation should only play a role in investment strategy when it is at an extreme, and this is not the case for most EM countries. Chart 35EM Stocks Are Not At Capitulation Levels...
bca.bca_mp_2018_12_01_c35
bca.bca_mp_2018_12_01_c35
Chart 36A…And Neither Are EM Currencies
...And Neither Are EM Currencies
...And Neither Are EM Currencies
Chart 36B…And Neither Are EM Currencies
...And Neither Are EM Currencies
...And Neither Are EM Currencies
Second, corporate earnings growth has plenty of downside potential in the near term. Annual growth in EM nonfinancial EBITDA, currently near 10%, is likely to turn negative next year, based on our China credit and fiscal impulse indicator (Chart 37). And, as we emphasized earlier, China is not yet pressing hard on the gas pedal. Chart 37EM Earnings Growth: Lots Of Downside
EM Earnings Growth: Lots Of Downside
EM Earnings Growth: Lots Of Downside
Third, it will take time for more aggressive Chinese policy stimulus, if it does occur, to show up in EM stocks and commodity prices. Trend changes in money growth and our credit and fiscal impulse preceded the trough in EM stocks and commodity prices in 2015, and again at the top in stocks and commodities in 2017 (Chart 38). However, even if these two indicators bottom today, it could take several months before the sell-off in EM financial markets and commodity prices abates. Chart 38Chinese Money And Credit Leads EM And Commodities
Chinese Money And Credit Leads EM And Commodities
Chinese Money And Credit Leads EM And Commodities
Finally, if Chinese stimulus comes largely via easier monetary policy rather than fiscal stimulus, then the outcome will be a weaker RMB. We expect the RMB to drift lower in any event, because rate differentials vis-à-vis the U.S. will move against the Chinese currency next year. A weaker RMB would add to the near-term headwinds facing EM assets. The bottom line is that the downside risks remain high enough that you should resist the temptation to bottom-fish until there are concrete signs that the Chinese authorities are getting serious about boosting the economy. We are also watching for signs outside of China that the global growth slowdown is ending. This includes our global leading economic indicator and data that are highly sensitive to global growth, such as German manufacturing foreign orders. Mr. X: Emerging market assets would have to become a lot cheaper for me to consider buying. Debt levels are just too high to be sustained, and stronger Chinese growth would only provide a short-term boost. I’m not sure I would even want to buy developed market risk assets based solely on some Chinese policy stimulus. BCA: Yes, we agree with your assessment that buying EM in 2019 would be a trade rather than a buy-and-hold strategy. Still, the combination of continued solid U.S. growth and a modest upturn in the Chinese economy would alleviate a lot of investors’ global growth concerns. The result could be a meaningful rally in pro-cyclical assets that you should not miss. We are defensively positioned at the moment, but we could see becoming more aggressive in 2019 on signs that China is stimulating more firmly and/or our global leading indicators begin to show some signs of life. Besides upgrading our overall equity allocation back to overweight, we would dip our toes in the EM space again. At the same time, we will likely upgrade the more cyclical DM equity markets, such as the Euro Area and Japan, while downgrading the defensive U.S. equity market to underweight. We are currently defensively positioned in terms of equity sectors, but it would make sense to shift cyclicals to overweight at the same time. Exact timing is always difficult, but we expect to become more aggressive around the middle of 2019. We also think the time is approaching to favor long-suffering value stocks over growth stocks. The relative performance of growth-over-value according to standard measures has become a sector call over the past decade: tech or financials. The sector skew complicates this issue, especially since tech stocks have already cracked. But we have found that stocks that are cheap within equity sectors tend to outperform expensive (or growth) stocks once the fed funds rate moves into restrictive territory. This is likely to occur in the latter half of 2019. Value should then have its day in the sun. Currencies: Mr. X: We don’t usually hedge our international equity exposure, so the direction of the dollar matters a lot to us. As you predicted a year ago, the U.S. dollar reigned supreme in 2018. Your economic views suggest another good year in 2019, but won’t this become a problem for the economy? President Trump’s desire to lower the U.S. trade deficit suggests that the Administration would like the dollar to drop and we could get some anti-dollar rhetoric from the White House. Also, it seems that the consensus is strongly bullish on the dollar which is always a concern. BCA: The outlook for the dollar is much trickier than it was at the end of 2017. As you highlighted, traders are already very long the dollar, implying that the hurdle for the greenback to surprise positively is much higher now. However, a key driver for the dollar is the global growth backdrop. If the latter is poor in the first half of 2019 as we expect, it will keep a bid under the greenback. Interest rates should also remain supportive for the dollar. As we argued earlier, current market expectations – only one more Fed hike after the December meeting – are too sanguine. If the Fed increases rates by more than currently discounted, the dollar’s fair value will rise, especially if global growth continues to lag that of the U.S. Since the dollar’s 2018 rally was largely a correction of its previous undervaluation, the currency has upside potential in the first half of the year (Chart 39). Chart 39U.S. Dollar Not Yet Overvalued
U.S. Dollar Not Yet Overvalued
U.S. Dollar Not Yet Overvalued
A stronger dollar will dampen foreign demand for U.S.-produced goods and will boost U.S. imports. However, do not forget that a rising dollar benefits U.S. consumers via its impact on import prices. Since the consumer sector represents 68% of GDP, and that 69% of household consumption is geared toward the (largely domestic) service sector, a strong dollar will not be as negative for aggregate demand and employment as many commentators fear, unless it were to surge by at least another 10%. In the end, the dollar will be more important for the distribution of U.S. growth than its overall level. Where the strong dollar is likely to cause tremors is in the political arena. You are correct to point out that there is a large inconsistency between the White House’s desires to shore up growth, while simultaneously curtailing the trade deficit, especially if the dollar appreciates further. As long as the Fed focuses on its dual mandate and tries to contain inflationary pressures, the executive branch of the U.S. government can do little to push the dollar down. Currency intervention cannot have a permanent effect unless it is accompanied by shifts in relative macro fundamentals. For example, foreign exchange intervention by the Japanese Ministry of Finance in the late 1990s merely had a temporary impact on the yen. The yen only weakened on a sustained basis once interest rate differentials moved against Japan. This problem underpins our view that the Sino-U.S. relationship is unlikely to improve meaningfully next year. China will remain an easy target to blame for the U.S.’s large trade deficit. What ultimately will signal a top in the dollar is better global growth, which is unlikely until the second half of 2019. At that point, expected returns outside the U.S. will improve, causing money to leave the U.S., pushing the dollar down. Mr. X: While 2017 was a stellar year for the euro, 2018 proved a much more challenging environment. Will 2019 be more like 2017 or 2018? BCA: We often think of the euro as the anti-dollar; buying EUR/USD is the simplest, most liquid vehicle for betting against the dollar, and vice versa. Our bullish dollar stance is therefore synonymous with a negative take on the euro. Also, the activity gap between the U.S. and the Euro Area continues to move in a euro-bearish fashion (Chart 40). Finally, since the Great Financial Crisis, EUR/USD has lagged the differential between European and U.S. core inflation by roughly six months. Today, this inflation spread still points toward a weaker euro. Chart 40Relative LEI's Moving Against Euro
Relative LEI's Moving Against Euro
Relative LEI's Moving Against Euro
It is important to remember that when Chinese economic activity weakens, European growth deteriorates relative to the U.S. Thus, our view that global growth will continue to sputter in the first half of 2019 implies that the monetary policy divergence between the Fed and the ECB has not yet reached a climax. Consequently, we expect EUR/USD to trade below 1.1 in the first half of 2019. By that point, the common currency will be trading at a meaningful discount to its fair value, which will allow it to find a floor (Chart 41). Chart 41Euro Heading Below Fair Value Before Bottoming
Euro Heading Below Fair Value Before Bottoming
Euro Heading Below Fair Value Before Bottoming
Mr. X: The Bank of Japan has debased the yen, with a balance sheet larger than Japan’s GDP. This cannot end well. I am very bearish on the currency. BCA: The BoJ’s monetary policy is definitely a challenge for the yen. The Japanese central bank rightfully understands that Japan’s inability to generate any meaningful inflation – despite an economy that is at full employment – is the consequence of a well-established deflationary mindset. The BoJ wants to shock inflation expectations upward by keeping real rates at very accommodative levels well after growth has picked up. This means that the BoJ will remain a laggard as global central banks move away from accommodative policies. The yen will continue to depreciate versus the dollar as U.S. yields rise on a cyclical horizon. That being said, the yen still has a place within investors’ portfolios. First, the yen is unlikely to collapse despite the BoJ’s heavy debt monetization. The JPY is one of the cheapest currencies in the world, with its real effective exchange rate hovering at a three-decade low (Chart 42). Additionally, Japan still sports a current account surplus of 3.7% of GDP, hardly the sign of an overstimulated and inflationary economy where demand is running amok. Instead, thanks to decades of current account surpluses, Japan has accumulated a positive net international investment position of 60% of GDP. This means that Japan runs a constant and large positive income balance, a feature historically associated with strong currencies. Chart 42The Yen Is Very Cheap
The Yen Is Very Cheap
The Yen Is Very Cheap
Japan’s large net international investment position also contributes to the yen’s defensive behavior as Japanese investors pull money back to safety at home when global growth deteriorates. Hence, the yen could rebound, especially against the euro, the commodity currencies, and EM currencies if there is a further global growth scare in the near term. Owning some yen can therefore stabilize portfolio returns during tough times. As we discussed earlier, we would avoid the EM asset class, including currency exposure, until global growth firms. Commodities: Ms. X: Once again, you made a good call on the energy price outlook a year ago, with prices moving higher for most of the year. But the recent weakness in oil seemed to come out of nowhere, and I must admit to being confused about where we go next. What are your latest thoughts on oil prices for the coming year? BCA: The fundamentals lined up in a very straightforward way at the end of 2017. The coalition we have dubbed OPEC 2.0 – the OPEC and non-OPEC producer group led by the Kingdom of Saudi Arabia (KSA) and Russia – outlined a clear strategy to reduce the global oil inventory overhang. The producers that had the capacity to increase supply maintained strict production discipline which, to some analysts, was still surprising even after the cohesiveness shown by the group in 2017. Outside that core group output continued to fall, especially in Venezuela, which remains a high-risk producing province. The oil market was balanced and prices were slowly moving higher as we entered the second quarter of this year, when President Trump announced the U.S. would re-impose oil export sanctions against Iran beginning early November. The oft-repeated goal of the sanctions was to reduce Iranian exports to zero. To compensate for the lost Iranian exports, President Trump pressured OPEC, led by KSA, to significantly increase production, which they did. However, as we approached the November deadline, the Trump Administration granted the eight largest importers of Iranian oil 180-day waivers on the sanctions. This restored much of the oil that would have been lost. Suddenly, the market found itself oversupplied and prices fell. As we move toward the December 6 meeting of OPEC 2.0 in Vienna, we are expecting a production cut from the coalition of as much as 1.4mm b/d to offset these waivers. The coalition wishes to keep global oil inventories from once again over-filling and dragging prices even lower in 2019. On the demand side, consumption continues to hold up both in the developed and emerging world, although we have somewhat lowered our expectations for growth next year. We are mindful of persistent concerns over the strength of demand – particularly in EM – in 2019. Thus, on the supply side and the demand side, the level of uncertainty in the oil markets is higher than it was at the start of 2018. Nonetheless, our base-case outlook is on the optimistic side for oil prices in 2019, with Brent crude oil averaging around $82/bbl, and WTI trading $6/bbl below that level (Chart 43). Chart 43Oil Prices To Rebound In 2019
Oil Prices To Rebound In 2019
Oil Prices To Rebound In 2019
Ms. X: I am skeptical that oil prices will rebound as much as you expect. First, oil demand is likely to falter if your view that global growth will continue slowing into early 2019 proves correct. Second, U.S. shale production is rising briskly, with pipeline bottlenecks finally starting to ease. Third, President Trump seems to have gone from taking credit for high equity prices to taking credit for low oil prices. Trump has taken a lot flack for supporting Saudi Arabia following the killing of The Washington Post journalist in Turkey. Would the Saudis really be willing to lose Trump’s support by cutting production at this politically sensitive time? BCA: Faltering demand growth remains a concern. However, note that in our forecasts we do expect global oil consumption growth to slow down to 1.46mm b/d next year, somewhat lower than the 1.6mm b/d growth we expect this year. In terms of the U.S. shale sector, production levels over the short term can be somewhat insensitive to changes in spot and forward prices, given the hedging activity of producers. Over the medium to longer term, however, lower spot and forward prices will disincentivize drilling by all but the most efficient producers with the best, lowest-cost acreage. If another price collapse were to occur – and were to persist, as the earlier price collapse did – we would expect a production loss of between 5% and 10% from the U.S. shales. Regarding KSA, the Kingdom needs close to $83/bbl to balance its budget this year and next, according to the IMF’s most recent estimates. If prices remain lower for longer, KSA’s official reserves will continue to fall, as its sovereign wealth fund continues to be tapped to fill budget gaps. President Trump’s insistence on higher production from KSA and the rest of OPEC is a non-starter – it would doom those economies to recession, and stifle further investment going forward. The U.S. would also suffer down the road, as the lack of investment significantly tightens global supply. So, net, if production cuts are not forthcoming from OPEC at its Vienna meeting we – and the market – will be downgrading our oil forecast. Ms. X: Does your optimism regarding energy extend to other commodities? The combination of a strong dollar and a China slowdown did a lot of damage to industrial commodities in 2018. Given your view that China’s economy should stabilize in 2019, are we close to a bottom in base metals? BCA: It is too soon to begin building positions in base metals because the trade war is going to get worse before it gets better. Exposure to base metals should be near benchmark at best entering 2019, although we will be looking to upgrade along with other risk assets if Chinese policy stimulus ramps up. Over the medium term, the outlook for base metals hinges on how successfully China pulls off its pivot toward consumer- and services-led growth, away from heavy industrial-led development. China accounts for roughly half of global demand for these base metals. Commodity demand from businesses providing consumer goods and services is lower than that of heavy industrial export-oriented firms. But demand for commodities used in consumer products – e.g., copper, zinc and nickel, which go into stainless-steel consumer appliances such as washers and dryers – will remain steady, and could increase if the transition away from heavy industrial-led growth is successful. Gasoline and jet fuel demand will also benefit, as EM consumers’ demand for leisure activities such as tourism increases with rising incomes. China is also going to be a large producer and consumer of electric vehicles, as it attempts to reduce its dependence on imported oil. Although timing the production ramp-up is difficult, in the long term these trends will be supportive for nickel and copper. Mr. X: You know I can’t let you get away without asking about gold. The price of bullion is down about 5% since the end of 2017, but that is no worse than the global equity market and it did provide a hedge against economic, financial or political shocks. The world seems just as risky as it did a year ago, so I am inclined to hold on to our gold positions, currently close to 10% of our portfolio. That is above your recommended level, but keeping a solid position in gold is one area where my daughter and I have close agreement regarding investment strategy. BCA: Gold did perform well during the risk asset corrections we had in 2018, and during the political crises as well. The price is not too far away from where we recommended going long gold as a portfolio hedge at the end of 2017 ($1230.3/oz). We continue to expect gold to perform well as a hedge. When other risk assets are trading lower, gold holds value relative to equities and tends to outperform bonds (Chart 44). Likewise, when other risk assets are rising, gold participates, but does not do as well as equities. It is this convexity – outperforming on the downside but participating on the upside with other risk assets – that continues to support our belief that gold has a role as a portfolio hedge. However, having 10% of your portfolio in gold is more than we would recommend – we favor an allocation of around 5%. Chart 44Hold Some Gold As A Hedge
OUTLOOK 2019: Late-Cycle Turbulence
OUTLOOK 2019: Late-Cycle Turbulence
Geopolitics Ms. X: I’m glad that the three of us agree at least on one thing – hold some gold! Let’s return to the geopolitical situation for a moment. Last year, you correctly forecast that divergent domestic policies in the U.S. and China – stimulus in the former and lack thereof in the latter – would be the most investment-relevant geopolitical issue. At the time, I found this an odd thing to highlight, given the risks of protectionism, populism, and North Korea. Do you still think that domestic policies will dominate in 2019? BCA: Yes, policy divergence between the U.S. and China will also dominate in 2019, especially if it continues to buoy the U.S. economy at the expense of the rest of the world. Of course, Beijing may decide to do more stimulus to offset its weakening economy and the impact of the trade tariffs. A headline rate cut, cuts to bank reserve requirements, and a boost to local government infrastructure spending are all in play. In the context of faltering housing and capex figures in the U.S., the narrative over the next quarter or two could be that the policy divergence is over, that Chinese policymakers have “blinked.” We are pushing back against this narrative on a structural basis. We have already broadly outlined our view that China will not be pressing hard to boost demand growth. Many of its recent policy efforts have focused on rebalancing the economy away from debt-driven investment (Chart 45). The problem for the rest of the world is that raw materials and capital goods comprise 85% of Chinese imports. As such, efforts to boost domestic consumption will have limited impact on the rest of the world, especially as emerging markets are highly leveraged to “old China.” Chart 45Rebalancing Of The Chinese Economy
Rebalancing Of The Chinese Economy
Rebalancing Of The Chinese Economy
Meanwhile, the Trump-Democrat gridlock could yield surprising results in 2019. President Trump is becoming singularly focused on winning re-election in 2020. As such, he fears the “stimulus cliff” looming over the election year. Democrats, eager to show that they are not merely the party of “the Resistance,” have already signaled that an infrastructure deal is their top priority. With fiscal conservatives in the House all but neutered by the midterm elections, a coalition between Trump and likely House Speaker Nancy Pelosi could emerge by late 2019, ushering in even more fiscal stimulus. While the net new federal spending will not be as grandiose as the headline figures, it will be something. There will also be regular spending increases in the wake of this year’s bipartisan removal of spending caps. We place solid odds that the current policy divergence narrative continues well into 2019, with bullish consequences for the U.S. dollar and bearish outcomes for EM assets, at least in the first half of the year. Mr. X: Your geopolitical team has consistently been alarmist on the U.S.-China trade war, a view that bore out throughout 2018. You already stated that you think trade tensions will persist in 2019. Where is this heading? BCA: Nowhere good. Rising geopolitical tensions in the Sino-American relationship has been our premier geopolitical risk since 2012. The Trump administration has begun tying geopolitical and strategic matters in with the trade talks. No longer is the White House merely asking for a narrowing of the trade deficit, improved intellectual property protections, and the removal of non-tariff barriers to trade. Now, everything from surface-to-air missiles in the South China Sea to Beijing’s “Belt and Road” project are on the list of U.S. demands. Trade negotiations are a “two-level game,” whereby policymakers negotiate in parallel with their foreign counterparts and domestic constituents. While Chinese economic agents may accept U.S. economic demands, it is not clear to us that its military and intelligence apparatus will accept U.S. geopolitical demands. And Xi Jinping himself is highly attuned to China’s geopolitical position, calling for national rejuvenation above all. We would therefore downplay any optimistic news from the G20 summit between Presidents Trump and Xi. President Trump could freeze tariffs at current rates and allow for a more serious negotiating round throughout 2019. But unless China is willing to kowtow to America, a fundamental deal will remain elusive in the end. For Trump, a failure to agree is still a win domestically, as the median American voter is not asking for a resolution of the trade war with China (Chart 46). Chart 46Americans Favor Being Tough On China
OUTLOOK 2019: Late-Cycle Turbulence
OUTLOOK 2019: Late-Cycle Turbulence
Ms. X: Could trade tensions spill into rising military friction? BCA: Absolutely. Minor military skirmishes will likely continue and could even escalate. We believe that there is a structural bull market in “war.” Investors should position themselves by being long global defense stocks. Mr. X: That is not encouraging. What about North Korea and Iran? Could they become geopolitical risks in 2019? BCA: Our answer to the North Korea question remains the same as 12 months ago: we have seen the peak in the U.S.’ display of a “credible military threat.” But Iran could re-emerge as a risk mid-year. We argued in last year’s discussion that President Trump was more interested in playing domestic politics than actually ratcheting up tensions with Iran. However, in early 2018 we raised our alarm level, particularly when staffing decisions in the White House involved several noted Iran hawks joining the foreign policy team. This was a mistake. Our initial call was correct, as President Trump ultimately offered six-month exemptions to eight importers of Iranian crude. That said, those exemptions will expire in the spring. The White House may, at that point, ratchet up tensions with Iran. This time, we will believe it when we see it. Intensifying tensions with Iran ahead of the U.S. summer vacation season, and at a time when crude oil markets are likely to be finely balanced, seems like folly, especially with primary elections a mere 6-to-8 months away. What does President Trump want more: to win re-election or to punish Iran? We think the answer is obvious, especially given that very few voters seem to view Iran as the country’s greatest threat (Chart 47). Chart 47Americans Don’t See Iran As A Major Threat
OUTLOOK 2019: Late-Cycle Turbulence
OUTLOOK 2019: Late-Cycle Turbulence
Ms. X: Let’s turn to Europe. You have tended to dismiss Euroskeptics as a minor threat, which has largely been correct. But don’t you think that, with Brexit upon us and Chancellor Angela Merkel in the twilight, populism in continental Europe will finally have its day? BCA: Let’s first wait to see how Brexit turns out! The next few months will be critical. Uncertainty is high, with considerable risks remaining. We do not think that Prime Minister May has the votes in the House of Commons to push through any version of soft Brexit that she has envisioned thus far. If the vote on the U.K.-EU exit deal falls through, a new election could be possible. This will require an extension of the exit process under Article 50 and a prolonged period of uncertainty. The probability of a no-deal Brexit is lower than 10%. It is simply not in the interest of anyone involved, save for a smattering of the hardest of hard Brexit adherents in the U.K. Conservative Party. Put simply, if the EU-U.K. deal falls through in the House of Commons, or even if PM May is replaced by a hard-Brexit Tory, the most likely outcome is an extension of the negotiation process. This can be easily done and we suspect that all EU member states would be in favor of such an extension given the cost to business sentiment and trade that would result from a no-deal Brexit. It is not clear that Brexit has emboldened Euroskeptics. In fact, most populist parties in the EU have chosen to tone down their Euroskepticism and emphasize their anti-immigrant agenda since the Brexit referendum. In part, this decision has to do with how messy the Brexit process has become. If the U.K. is struggling to unravel the sinews that tie it to Europe, how is any other country going to fare any better? The problem for Euroskeptic populists is that establishment parties are wise to the preferences of the European median voter. For example, we now have Friedrich Merz, a German candidate for the head of the Christian Democratic Union – essentially Merkel’s successor – who is both an ardent Europhile and a hardliner on immigration. This is not revolutionary. Merz simply read the polls correctly and realized that, with 83% of Germans supporting the euro, the rise of the anti-establishment Alternative for Germany (AfD) is more about immigration than about the EU. As such, we continue to stress that populism in Europe is overstated. In fact, we expect that Germany and France will redouble their efforts to reform European institutions in 2019. The European parliamentary elections in May will elicit much handwringing by the media due to a likely solid showing by Euroskeptics, even though the election is meaningless. Afterwards, we expect to see significant efforts to complete the banking union, reform the European Stability Mechanism, and even introduce a nascent Euro Area budget. But these reforms will not be for everyone. Euroskeptics in Central and Eastern Europe will be left on the outside looking in. Brussels may also be emboldened to take a hard line on Italy if institutional reforms convince the markets that the core Euro Area is sheltered from contagion. In other words, the fruits of integration will be reserved for those who play by the Franco-German rules. And that could, ironically, set the stage for the unraveling of the European Union as we know it. Over the long haul, a much tighter, more integrated, core could emerge centered on the Euro Area, with the rest of the EU becoming stillborn. The year 2019 will be a vital one for Europe. We are sensing an urgency in Berlin and Paris that has not existed throughout the crisis, largely due to Merkel’s own failings as a leader. We remain optimistic that the Euro Area will survive. However, there will be fireworks. Finally, a word about Japan. The coming year will see the peak of Prime Minister Shinzo Abe’s career. He is promoting the first-ever revision to Japan’s post-war constitution in order to countenance the armed forces. If he succeeds, he will have a big national security success to couple with his largely effective “Abenomics” economic agenda – after that, it will all be downhill. If he fails, he will become a lame duck. This means that political uncertainty will rise in 2019, after six years of unusual tranquility. Conclusions Mr. X: This is a good place to conclude our discussion. We have covered a lot of ground and your views have reinforced my belief that 2019 could be even more turbulent for financial markets than the past has been. I accept your opinion that a major global economic downturn is not around the corner, but with valuations still stretched, I feel that it makes good sense to focus on capital preservation. I may lose out on the proverbial “blow-off” rally, but so be it – I have been in this business long enough to know that it is much better to leave the party while the music is still playing! Ms. X: I agree with my father that the risks surrounding the outlook have risen as we have entered the late stages of this business-cycle expansion. Yet, if global growth does temporarily stabilize and corporate earnings continue to expand, I fear that being out of the market will be very painful. The era of hyper-easy money may be ending, but interest rates globally are still nowhere near restrictive territory. This tells me that the final stages of this bull market could be very rewarding. A turbulent market is not only one where prices go down – they can also go up a lot! BCA: The debate you are having is one we ourselves have had on numerous occasions. There is always a trade-off between maximizing short-term returns and taking a longer-term approach. Valuations are the ultimate guidepost for long-term returns. While most assets have cheapened over the past year, prices are still fairly elevated. Table 4 shows our baseline calculations of what a balanced portfolio will earn over the coming decade. We estimate that such a portfolio will deliver average annual returns of 4.9% over the next ten years, or 2.8% after adjusting for inflation. That is an improvement over our inflation-adjusted estimate of 1.3% from last year, but still well below the 6.6% real return that a balanced portfolio earned between 1982 and 2018. Table 410-Year Asset Return Projections
OUTLOOK 2019: Late-Cycle Turbulence
OUTLOOK 2019: Late-Cycle Turbulence
Our return calculations for equities assume that profit margins decline modestly over the period and that multiples mean revert to their historical average. These assumptions may turn out to be too pessimistic if underlying changes in the economy keep corporate profits elevated as a share of GDP. Structurally lower real interest rates may also justify higher P/E multiples, although this would be largely offset by the prospect of slower economic growth, which will translate into slower earnings growth. In terms of the outlook for the coming year, a lot hinges on our view that monetary policy in the main economies stays accommodative. This seems like a safe assumption in the Euro Area and Japan, where rates are near historic lows, as well as in China, where the government is actively loosening monetary conditions. It is not such a straightforward conclusion for the U.S., where the Fed is on track to keep raising rates. If it turns out that the neutral interest rate is not far above where rates are already, we could see a broad-based slowdown of the U.S. economy that ripples through to the rest of the world. And even if U.S. monetary policy does remain accommodative, many things could still upset the apple cart, including a full-out trade war, debt crises in Italy or China, or a debilitating spike in oil prices. As the title of our outlook implies, 2019 is likely to be a year of increased turbulence. Ms. X: As always, you have left us with much to think about. My father has looked forward to these discussions every year and now that I am able to join him, I understand why. Before we conclude, it would be helpful to have a recap of your key views. BCA: That would be our pleasure. The key points are as follows: The collision between policy and markets that we discussed last year finally came to a head in October. Rather than falling as they normally do when stocks plunge, U.S. bond yields rose as investors reassessed the willingness of the Fed to pause hiking rates even in the face of softer growth. Likewise, hopes that China would move swiftly to stimulate its economy were dashed as it became increasingly clear that the authorities were placing a high emphasis on their reform agenda of deleveraging and capacity reduction. The ongoing Brexit saga and the stalemate between the populist Italian government and the EU have increased uncertainty in Europe at a time when the region was already beginning to slow. We expect the tensions between policy and markets to be an ongoing theme in 2019. With the U.S. unemployment rate at a 48-year low, it will take a significant slowdown for the Fed to stop hiking rates. Despite the deterioration in economic data over the past month, real final domestic demand is still tracking to expand by 3% in the fourth quarter, well above estimates of the sustainable pace of economic growth. Ultimately, the Fed will deliver more hikes next year than discounted in the markets. This will push up the dollar and keep the upward trend in Treasury yields intact. The dollar should peak midway next year. China will also become more aggressive in stimulating its economy, which will boost global growth. However, until both of these things happen, emerging markets will remain under pressure. For the time being, we continue to favor developed market equities over their EM peers. We also prefer defensive equity sectors such as health care and consumer staples over cyclical sectors such as industrials and materials. Within the developed market universe, the U.S. will outperform Europe and Japan for the next few quarters, especially in dollar terms. A stabilization in global growth could ignite a blow-off rally in global equities. If the Fed is raising rates in response to falling unemployment, this is unlikely to derail the stock market. However, once supply-side constraints begin to fully bite in early 2020 and inflation rises well above the Fed’s target of 2%, stocks will begin to buckle. This means that a window exists next year where stocks will outperform bonds. We would maintain a benchmark allocation to stocks for now, but increase exposure if global bourses were to fall significantly from current levels without a corresponding deteriorating in the economic outlook. Corporate credit will underperform stocks as government bond yields rise. A major increase in spreads is unlikely as long as the economy is still expanding, but spreads could still widen modestly given their low starting point. U.S. shale companies have been the marginal producers in the global oil sector. With breakeven costs in shale close to $50/bbl, crude prices are unlikely to rise much from current levels over the long term. However, over the next 12 months, we expect production cuts in Saudi Arabia will push prices up, with Brent crude averaging around $82/bbl in 2019. A balanced portfolio is likely to generate average returns of only 2.8% a year in real terms over the next decade. This compares to average returns of around 6.6% a year between 1982 and 2018. We would like to take this opportunity to wish you and all of our clients a very peaceful, healthy and prosperous New Year. The Editors November 26, 2018