Corporate

Mr. X and his daughter, Ms. X, are long-time BCA clients who visit our office toward the end of each year to discuss the economic and financial market outlook. This report is an edited transcript of our recent conversation. Mr. X: I have been eagerly looking forward to this meeting given the recent turbulence in financial markets. Our investments have done poorly in the past year and, with hindsight, I wish I had followed my instincts to significantly cut our equity exposure at the end of 2017, although we did follow your advice to move to a neutral stance in mid-2018. I remain greatly troubled by economic and political developments in many countries. I have long believed in open and free markets and healthy political discourse, and this all seems under challenge. As always, there is much to talk about. Ms. X: Let me add that I also am pleased to have this opportunity to talk through the key issues that will influence our investment strategy over the coming year. As I am sure you remember, I was more optimistic than my father about the outlook when we met a year ago but things have not worked out as well as I had hoped. In retrospect, I should have paid more attention to your view that markets and policy were on a collision course as that turned out to be a very accurate prediction. When I joined the family firm in early 2017, I persuaded my father that we should have a relatively high equity exposure and that was the correct stance. However, this success led us to maintain too much equity exposure in 2018, and my father has done well to resist the temptation to say “I told you so.” So, we are left with a debate similar to last year: Should we move now to an underweight in risk assets or hold off on the hope that prices will reach new highs in the coming year? I am still not convinced that we have seen the peak in risk asset prices as there is no recession on the horizon and equity valuations are much improved, following recent price declines. I will be very interested to hear your views. BCA: Our central theme for 2018 that markets and policy would collide did turn out to be appropriate and, importantly, the story has yet to fully play out. The monetary policy tightening cycle is still at a relatively early stage in the U.S. and has not even begun in many other regions. Yet, although it was a tough year for most equity markets, the conditions for a major bear market are not yet in place. One important change to our view, compared to a year ago, is that we have pushed back the timing of the next U.S. recession. This leaves a window for risk assets to show renewed strength. It remains to be seen whether prices will reach new peaks, but we believe it would be premature to shift to an underweight stance on equities. For the moment, we are sticking with our neutral weighting for risk assets, but may well recommend boosting exposure if prices suffer further near-term weakness. We will need more clarity about the timing of a recession before we consider aggressively cutting exposure. Mr. X: I can see we will have a lively discussion because I do not share your optimism. My list of concerns is long and I hope we have time to get through them all. But first, let’s briefly review your predictions from last year. BCA: That is always interesting to do, although sometimes rather humbling. A year ago, our key conclusions were that: The environment of easy money, low inflation and healthy profit growth that has been so bullish for risk assets will start to change during the coming year. Financial conditions, especially in the U.S., will gradually tighten as decent growth leads to building inflationary pressures, encouraging central banks to withdraw stimulus. With U.S. equities at an overvalued extreme and investor sentiment overly optimistic, this will set the scene for an eventual collision between policy and the markets. The conditions underpinning the bull market will erode only slowly which means that risk asset prices should continue to rise for at least the next six months. However, long-run investors should start shifting to a neutral exposure. Given our economic and policy views, there is a good chance that we will move to an underweight position in risk assets during the second half of 2018. The U.S. economy is already operating above potential and thus does not need any boost from easier fiscal policy. Any major tax cuts risk overheating the economy, encouraging the Federal Reserve to hike interest rates and boosting the probability of a recession in 2019. This is at odds with the popular view that tax cuts will be good for the equity market. A U.S. move to scrap NAFTA would add to downside risks. For the second year in a row, the IMF forecasts of economic growth for the coming year are likely to prove too pessimistic. The end of fiscal austerity has allowed the Euro Area economy to gather steam and this should be sustained in 2018. However, the slow progress in negotiating a Brexit deal with the EU poses a threat to the U.K. economy. China’s economy is saddled with excessive debt and excess capacity in a number of areas. Any other economy would have collapsed by now, but the government has enough control over banking and other sectors to prevent a crisis. Growth should hold above 6% in the next year or two, although much will depend on how aggressively President Xi pursues painful reforms. The market is too optimistic in assuming that the Fed will not raise interest rates by as much as indicated in their “dots” projections. There is a good chance that the U.S. yield curve will become flat or inverted by late 2018. Bonds are not an attractive investment at current yields. Only Greece and Portugal have real 10-year government bond yields above their historical average. Corporate bonds should outperform governments, but a tightening in financial conditions will put these at risk in the second half of 2018. The Euro Area and Japanese equity markets should outperform the U.S. over the next year reflecting their better valuations and more favorable financial conditions. Developed markets should outperform the emerging market index. Historically, the U.S. equity market has led recessions by between 3 and 12 months. If, as we fear, a U.S. recession starts in the second half of 2019, then the stock market would be at risk from the middle of 2018. The improving trend in capital spending should favor industrial stocks. Our other two overweight sectors are energy and financials. The oil price will be well supported by strong demand and output restraint by OPEC and Russia. The Brent price should average $65 a barrel over the coming year, with risks to the upside. We expect base metals prices to trade broadly sideways but will remain highly dependent on developments in China. Modest positions in gold are warranted. Relative economic and policy trends will favor a firm dollar in 2018. Unlike at the start of 2017, investors are significantly short the dollar which is bullish from a contrary perspective. Sterling is quite cheap but Brexit poses downside risks. The key market-relevant geopolitical events to monitor will be fiscal policy and mid-term elections in the U.S., and reform policies in China. With the former, the Democrats have a good chance of winning back control of the House of Representatives, creating a scenario of complete policy gridlock. A balanced portfolio is likely to generate average returns of only 3.3% a year in nominal terms over the next decade. This compares to average returns of around 10% a year between 1982 and 2017. As already noted, the broad theme that policy tightening – especially in the U.S. – would become a problem for asset markets during the year was supported by events. However, the exact timing was hard to predict. The indexes for non-U.S. developed equity markets and emerging markets peaked in late-January 2018, and have since dropped by around 18% and 24%, respectively (Chart 1). On the other hand, the U.S. market, after an early 2018 sell-off, hit a new peak in September, before falling anew in the past couple of months. The MSCI All-Country World index currently is about 6% below end-2017 levels in local-currency terms. Chart 1Our 'Collision Course' Theme For 2018 Played Out
Our 'Collision Course' Theme For 2018 Played Out
Our 'Collision Course' Theme For 2018 Played Out
We started the year recommending an overweight in developed equity markets but, as you noted, shifted that to a neutral position mid-year. A year ago, we thought we might move to an underweight stance in the second half of 2018 but decided against this because U.S. fiscal stimulus boosted corporate earnings and extended the economic cycle. Our call that emerging markets would underperform was on target. Although it was U.S. financial conditions that tightened the most, Wall Street was supported by the large cut in the corporate tax rate while the combination of higher bond yields and dollar strength was a major problem for many indebted emerging markets. Overall, it was not a good year for financial markets (Table 1). Table 1Market Performance
OUTLOOK 2019: Late-Cycle Turbulence
OUTLOOK 2019: Late-Cycle Turbulence
As far as the overall macro environment was concerned, we were correct in predicting that the IMF was too pessimistic on economic growth. A year ago, the IMF forecast that the advanced economies would expand by 2% in 2018 and that has since been revised up to 2.4% (Table 2). This offset a slight downgrading to the performance of emerging economies. The U.S., Europe and Japan all grew faster than previously expected. Not surprisingly, inflation also was higher than forecast, although in the G7, it has remained close to the 2% level targeted by most central banks. Table 2IMF Economic Forecasts
OUTLOOK 2019: Late-Cycle Turbulence
OUTLOOK 2019: Late-Cycle Turbulence
Despite widespread fears to the contrary, the data have supported our view that Chinese growth would hold above a 6% pace in 2018. Nevertheless, a slowdown currently is underway and downside risks remain very much in place in terms of excessive credit and trade pressures. Another difficult year lies ahead for the Chinese authorities and we will no doubt return to this topic later. As far as our other key forecasts are concerned, we were correct in our views that oil prices and the U.S. dollar would rise and that the market would be forced to revise up its predictions of Fed rate hikes. Of course, oil has recently given back its earlier gains, but we assume that is a temporary setback. On the sector front, our macro views led us to favor industrials, financials and energy, but that did not work out well as concerns about trade took a toll on cyclical sectors. Overall, there were no major macro surprises in 2018, and it seems clear that we have yet to resolve the key questions and issues that we discussed a year ago. At that time, we were concerned about the development of late-cycle pressures that ultimately would undermine asset prices. That story has yet to fully play out. It is hard to put precise timing on when the U.S. economy will peak and, thus, when asset prices will be at maximum risk. Nevertheless, our base case is that there likely will be a renewed and probably final run-up in asset prices before the next recession. Late-Cycle Challenges Mr. X: This seems like déjà-vu all over again. Since we last met, the cycle is one year older and, as you just said, the underlying challenges facing economies and markets have not really changed. If anything, things are even worse: Global debt levels are higher, inflation pressures more evident, Fed policy is moving closer to restrictive territory and protectionist policies have ratcheted up. If it was right to be cautious six months ago, then surely we should be even more cautious now. Ms. X: Oh dear, it does seem like a repeat of last year’s discussion because, once again, I am more optimistic than my father. Obviously, there are structural problems in a number of countries and, at some point, the global economy will suffer another recession. But timing is everything, and I attach very low odds to a downturn in the coming year. Meanwhile, I see many pockets of value in the equity market. Rather than cut equity positions, I am inclined to look for buying opportunities. BCA: We sympathize with your different perspectives because the outlook is complex and we also have lively debates about the view. The global equity index currently is a little below where it was when we met last year, but there has been tremendous intra-period volatility. That pattern seems likely to be repeated in 2019. In other words, it will be important to be flexible about your investment strategy. You both make good points. It is true that there are several worrying problems regarding the economic outlook, including excessive debt, protectionism and building inflation risks. At the same time, the classic conditions for an equity bear market are not yet in place, and may not be for some time. This leaves us in the rather uncomfortable position of sitting on the fence with regard to risk asset exposure. We are very open to raising exposure should markets weaken further in the months ahead, but also are keeping careful watch for signs that the economic cycle is close to peaking. In other words, it would be a mistake to lock in a 12-month strategy right now. Mr. X: I would like to challenge the consensus view, shared by my daughter, that the next recession will not occur before 2020, and might even be much later. The main rationale seems to be that the policy environment remains accommodative and there are none of the usual imbalances that occur ahead of recessions. Of course, U.S. fiscal policy has given a big boost to growth in the past year, but I assume the effects will wear off sharply in 2019. More importantly, there is huge uncertainty about the level of interest rates that will trigger economic problems. It certainly has not taken much in the way of Fed rate hikes to rattle financial markets. Thus, monetary policy may become restrictive much sooner than generally believed. I also strongly dispute the idea that there are no major financial imbalances. If running U.S. federal deficits of $1 trillion in the midst of an economic boom is not an imbalance, then I don’t know what is! At the same time, the U.S. corporate sector has issued large amounts of low-quality debt, and high-risk products such as junk-bond collateralized debt obligations have made an unwelcome reappearance. It seems that the memories of 2007-09 have faded. It is totally normal for long periods of extremely easy money to be accompanied by growing leverage and increasingly speculative financial activities, and I don’t see why this period should be any different. And often, the objects of speculation are not discovered until financial conditions become restrictive. Finally, there are huge risks associated with rising protectionism, the Chinese economy appears to be struggling, Italy’s banks are a mess, and the Brexit fiasco poses a threat to the U.K. economy. Starting with the U.S., please go ahead and convince me why a recession is more than a year away. BCA: It is natural for you to worry that a recession is right around the corner. The current U.S. economic expansion will become the longest on record if it makes it to July 2019, at which point it will surpass the 1990s expansion. Economists have a long and sad history of failing to forecast recessions. Therefore, a great deal of humility is warranted when it comes to predicting the evolution of the business cycle. The Great Recession was one of the deepest downturns on record and the recovery has been fairly sluggish by historic standards. Thus, it has taken much longer than usual for the U.S. economy to return to full employment. Looking out, there are many possible risks that could trip up the U.S. economy but, for the moment, we see no signs of recession on the horizon (Chart 2). For example, the leading economic indicator is still in an uptrend, the yield curve has not inverted and our monetary indicators are not contracting. Our proprietary recession indicator also suggests that the risk is currently low, although recent stock market weakness implies some deterioration. Chart 2Few U.S Recession 'Red Flags'
Few U.S Recession 'Red Flags'
Few U.S Recession 'Red Flags'
The buildup in corporate debt is a cause for concern and we are not buyers of corporate bonds at current yields. However, the impact of rising yields on the economy is likely to be manageable. The interest coverage ratio for the economy as a whole – defined as the profits corporations generate for every dollar of interest paid – is still above its historic average (Chart 3). Corporate bonds are also generally held by non-leveraged investors such as pension funds, insurance companies, and ETFs. The impact of defaults on the economy tends to be more severe when leveraged institutions are the ones that suffer the greatest losses. Chart 3Interest Costs Not Yet A Headwind
Interest Costs Not Yet A Headwind
Interest Costs Not Yet A Headwind
We share your worries about the long-term fiscal outlook. However, large budget deficits do not currently imperil the economy. The U.S. private sector is running a financial surplus, meaning that it earns more than it spends (Chart 4). Not only does this make the economy more resilient, it also provides the government with additional savings with which to finance its budget deficit. If anything, the highly accommodative stance of fiscal policy has pushed up the neutral rate of interest, giving the Fed greater scope to raise rates before monetary policy enters restrictive territory. The impetus of fiscal policy on the economy will be smaller in 2019 than it was in 2018, but it will still be positive (Chart 5). Chart 4The U.S. Private Sector Is Helping To Finance The Fiscal Deficit
The U.S. Private Sector Is Helping To Finance The Fiscal Deficit
The U.S. Private Sector Is Helping To Finance The Fiscal Deficit
Chart 5U.S. Fiscal Policy Still Stimulative In 2019
U.S. Fiscal Policy Still Stimulative In 2019
U.S. Fiscal Policy Still Stimulative In 2019
The risks to growth are more daunting outside the U.S. As you point out, Italy is struggling to contain borrowing costs, a dark cloud hangs over the Brexit negotiations, and China and most other emerging markets have seen growth slow meaningfully. The U.S., however, is a relatively closed economy – it is not as dependent on trade as most other countries. Its financial system is reasonably resilient thanks to the capital its banks have raised over the past decade. In addition, Dodd-Frank and other legislation have made it more difficult for financial institutions to engage in reckless risk-taking. Mr. X: I would never take a benign view of the ability and willingness of financial institutions to engage in reckless behavior, but maybe I am too cynical. Even if you are right that debt does not pose an immediate threat to the market, surely it will become a huge problem in the next downturn. If the U.S. federal deficit is $1 trillion when the economy is strong, it is bound to reach unimaginable levels in a recession. And, to make matters worse, the Federal Reserve may not have much scope to lower interest rates if they peak at a historically low level in the next year or so. What options will policymakers have to respond to the next cyclical downturn? Is there a limit to how much quantitative easing central banks can do? BCA: The Fed is aware of the challenges it faces if the next recession begins when interest rates are still quite low. Raising rates rapidly in order to have more “ammunition” for counteracting the downturn would hardly be the best course of action as this would only bring forward the onset of the recession. A better strategy is to let the economy overheat a bit so that inflation rises. This would allow the Fed to push real rates further into negative territory if the recession turns out to be severe. There is no real limit on how much quantitative easing the Fed can undertake. The FOMC will undoubtedly turn to asset purchases and forward guidance again during the next economic downturn. Now that the Fed has crossed the Rubicon into unorthodox monetary policy without generating high inflation, policymakers are likely to try even more exotic policies, such as price-level targeting. The private sector tends to try to save more during recessions. Thus, even though the fiscal deficit would widen during the next downturn, there should be plenty of buyers for government debt. However, once the next recovery begins, the Fed may feel increasing political pressure to keep rates low in order to allow the government to maintain its desired level of spending and taxes. The Fed guards its independence fiercely, but in a world of increasingly political populism, that independence may begin to erode. This will not happen quickly, but to the extent that it does occur, higher inflation is likely to be the outcome. Ms. X: I would like to explore the U.S.-China dynamic a bit more because I see that as one of the main challenges to my more optimistic view. I worry that President Trump will continue to take a hard line on China trade because it plays well with his base and has broad support in Congress. And I equally worry that President Xi will not want to be seen giving in to U.S. bullying. How do you see this playing out? BCA: Investors hoping that U.S. President Donald Trump and his Chinese counterpart Xi Jinping will reach a deal to end the trade war on the sidelines of the forthcoming G20 leaders' summit in Buenos Aires are likely to be disappointed. President Trump's fiscal policy is completely inconsistent with his trade agenda. Fiscal stimulus in a full-employment economy will suck in imports. It also forces the Fed to raise rates more aggressively than it otherwise would, leading to a stronger dollar. The result will be a larger U.S. trade deficit. Trump will not be able to blame Canada or Mexico for a deteriorating trade position because he just signed a trade agreement with them. The new USMCA agreement is remarkably similar to NAFTA, with the notable exception that it contains a clause barring Canada and Mexico from negotiating bilateral trade deals with China. This means Trump needs a patsy who will take the blame for America's burgeoning trade deficit and China will fill that role. For his part, President Xi knows full well that he will still be China’s leader when Trump is long gone. Giving in to Trump’s demands would hurt him politically. All this means that the trade war will persist. Mr. X: I see a trade war as a major threat to the economy, but it is not the only thing that could derail the economic expansion. Let’s explore that issue in more detail. The Economic Outlook Mr. X: You have shown in previous research that housing is often a very good leading indicator of the U.S. economy, largely because it is very sensitive to changes in the monetary environment. Are you not concerned about the marked deterioration in recent U.S. housing data? BCA: Recent trends in housing have indeed been disappointing, with residential investment acting as a drag on growth for three consecutive quarters. The weakness has been broad-based with sales, the rate of price appreciation of home prices, and builder confidence all declining (Chart 6). Even though the level of housing affordability is decent by historical standards, there has been a fall in the percentage of those who believe that it is a good time to buy a home. Chart 6Recent Softness In U.S. Housing
Recent Softness In U.S. Housing
Recent Softness In U.S. Housing
There are a few possible explanations for the weakness. First, the 2007-09 housing implosion likely had a profound and lasting impact on the perceived attractiveness of home ownership. The homeownership rate for people under 45 has remained extremely low by historical standards. Secondly, increased oversight and tighter regulations have curbed mortgage supply. Finally, the interest rate sensitivity of the sector may have increased with the result that even modest increases in the mortgage rate have outsized effects. That, in turn, could be partly explained by recent tax changes that capped the deduction on state and local property taxes, while lowering the limit on the tax deductibility of mortgage interest. The trend in housing is definitely a concern, but the odds of a further major contraction seem low. Unlike in 2006, the home vacancy rate stands near record levels and the same is true for the inventory of homes. The pace of housebuilding is below the level implied by demographic trends and consumer fundamentals are reasonably healthy. The key to the U.S. economy lies with business investment and consumer spending and these areas are well supported for the moment. Consumers are benefiting from continued strong growth in employment and a long overdue pickup in wages. Meanwhile, the ratio of net worth-to-income has surpased the previous peak and the ratio of debt servicing-to-income is low (Chart 7). Last year, we expressed some concern that the depressed saving rate might dampen spending, but the rate has since been revised substantially higher. Based on its historical relationship with U.S. household net worth, there is room for the saving rate to fall, fueling more spending. Real consumer spending has grown by 3% over the past year and there is a good chance of maintaining that pace during most of 2019. Chart 7U.S. Consumer Fundamentals Are Healthy
U.S. Consumer Fundamentals Are Healthy
U.S. Consumer Fundamentals Are Healthy
Turning to capital spending, the cut in corporate taxes was obviously good for cash flow, and surveys show a high level of business confidence. Moreover, many years of business caution toward spending has pushed up the average age of the nonresidential capital stock to the highest level since 1963 (Chart 8). Higher wages should also incentivize firms to invest in more machinery. Absent some new shock to confidence, business investment should stay firm during the next year. Chart 8An Aging Capital Stock
An Aging Capital Stock
An Aging Capital Stock
Overall, we expect the pace of U.S. economic growth to slow from its recent strong level, but it should hold above trend, currently estimated to be around 2%. As discussed earlier, that means capacity pressures will intensify, causing inflation to move higher. Ms. X: I share the view that the U.S. economy will continue to grow at a healthy pace, but I am less sure about the rest of the world. BCA: You are right to be concerned. We expected U.S. and global growth to diverge in 2018, but not by as much as occurred. Several factors have weighed on CEO confidence outside of the U.S., including trade wars, a strong dollar, higher oil prices, emerging market turbulence, the return of Italian debt woes, and a slowdown in the Chinese economy. The stress has shown up in the global manufacturing PMI, although the latter is still at a reasonably high level (Chart 9). Global export growth is moderating and the weakness appears to be concentrated in capex. Capital goods imports for the major economies, business investment, and the production of investment-related goods have all decelerated this year. Chart 9Global Manufacturing Slowdown
Global Manufacturing Slowdown
Global Manufacturing Slowdown
Our favorite global leading indicators are also flashing yellow (Chart 10). BCA’s global leading economic indicator has broken below the boom/bust line and its diffusion index suggests further downside. The global ZEW composite and the BCA boom/bust indicator are both holding below zero. Chart 10Global Growth Leading Indicators
Global Growth Leading Indicators
Global Growth Leading Indicators
Current trends in the leading indicators shown in Chart 11 imply that the growth divergence between the U.S. and the rest of the world will remain a key theme well into 2019. Among the advanced economies, Europe and Japan are quite vulnerable to the global soft patch in trade and capital spending. Chart 11Global Economic Divergence Will Continue
Global Economic Divergence Will Continue
Global Economic Divergence Will Continue
The loss of momentum in the Euro Area economy, while expected, has been quite pronounced. Part of this is due to the dissipation of the 2016/17 economic boost related to improved health in parts of the European banking system that sparked a temporary surge in credit growth. The tightening in Italian financial conditions following the government’s budget standoff with the EU has weighed on overall Euro Area growth. Softer Chinese demand for European exports, uncertainties related to U.S. trade policy and the torturous Brexit negotiations, have not helped the situation. Real GDP growth decelerated to close to a trend pace by the third quarter of 2018. The manufacturing PMI has fallen from a peak of 60.6 in December 2017 to 51.5, mirroring a 1% decline in the OECD’s leading economic indicator for the region. Not all the economic news has been bleak. Both consumer and industrial confidence remain at elevated levels according to the European Commission (EC) surveys, consistent with a resumption of above-trend growth. Even though exports have weakened substantially from the booming pace in 2017, the EC survey on firms’ export order books remains at robust levels (Chart 12). Importantly for the Euro Area, the bank credit impulse has moved higher.The German economy should also benefit from a rebound in vehicle production which plunged earlier this year following the introduction of new emission standards. Chart 12Europe: Slowing, But No Disaster
Europe: Slowing, But No Disaster
Europe: Slowing, But No Disaster
We interpret the 2018 Euro Area slowdown as a reversion-to-the-mean rather than the start of an extended period of sub-trend growth. Real GDP growth should fluctuate slightly above trend pace through 2019. Given that the Euro Area’s output gap is almost closed, the ECB will not deviate from its plan to end its asset purchase program by year end. Gradual rate hikes should begin late in 2019, assuming that inflation is closer to target by then. In contrast, the Bank of Japan (BoJ) is unlikely to change policy anytime soon. The good news is that wages have finally begun to grow at about a 2% pace, although it required extreme labor shortages. Yet, core inflation is barely positive and long-term inflation expectations are a long way from the 2% target. The inflation situation will have to improve significantly before the BoJ can consider adjusting or removing the Yield Curve Control policy. This is especially the case since the economy has hit a bit of an air pocket and the government intends to raise the VAT in 2019. Japan’s industrial production has stalled and we expect the export picture to get worse before it gets better. We do not anticipate any significant economic slack to develop, but even a sustained growth slowdown could partially reverse the gains that have been made on the inflation front. Ms. X: We can’t talk about the global economy without discussing China. You have noted in the past how the authorities are walking a tightrope between trying to unwind the credit bubble and restructure the economy on the one hand, and prevent a destabilizing economic and financial crisis on the other. Thus far, they have not fallen off the tightrope, but there has been limited progress in resolving the country’s imbalances. And now the authorities appear to be stimulating growth again, risking an even bigger buildup of credit. Can it all hold together for another year? BCA: That’s a very good question. Thus far, there is not much evidence that stimulus efforts are working. Credit growth is still weak and leading economic indicators have not turned around (Chart 13). There is thus a case for more aggressive reflation, but the authorities also remain keen to wean the economy off its addiction to debt. Chart 13China: No Sign Of Reacceleration
China: Credit Impulse Remains Weak
China: Credit Impulse Remains Weak
Waves of stimulus have caused total debt to soar from 140% of GDP in 2008 to about 260% of GDP at present (Chart 14). As is usually the case, rapid increases in leverage have been associated with a misallocation of capital. Since most of the new credit has been used to finance fixed-asset investment, the result has been overcapacity in a number of areas. For example, the fact that 15%-to-20% of apartments are sitting vacant is a reflection of overbuilding. Meanwhile, the rate of return on assets in the state-owned corporate sector has fallen below borrowing costs. Chart 14China: Debt Still Rising
China: Debt Still Rising
China: Debt Still Rising
Chinese exports are holding up well so far, but this might only represent front-running ahead of the implementation of higher tariffs. Judging from the steep drop in the export component of both the official and private-sector Chinese manufacturing PMI, exports are likely to come under increasing pressure over the next few quarters as the headwinds from higher tariffs fully manifest themselves (Chart 15). Chart 15Chinese Exports About To Suffer
Chinese Exports About To Suffer
Chinese Exports About To Suffer
The most likely outcome is that the authorities will adjust the policy dials just enough to stabilize growth sometime in the first half of 2019. The bottoming in China’s broad money impulse offers a ray of hope (Chart 16). Still, it is a tentative signal at best and it will take some time before this recent easing in monetary policy shows up in our credit impulse measure and, later, economic growth. A modest firming in Chinese growth in the second half of 2019 would provide a somewhat stronger demand backdrop for commodities and emerging economies that sell goods to China. Chart 16A Ray Of Hope From Broad Money
bca.bca_mp_2018_12_01_c16
bca.bca_mp_2018_12_01_c16
Ms. X: If you are correct about a stabilization in the Chinese economy next year, this presumably would be good news for emerging economies, especially if the Fed goes on hold. EM assets have been terribly beaten down and I am looking for an opportunity to buy. BCA: Fed rate hikes might have been the catalyst for the past year’s pain in EM assets, but it is not the underlying problem. As we highlighted at last year’s meeting, the troubles for emerging markets run much deeper. Our long-held caution on emerging economies and markets is rooted in concern about deteriorating fundamentals. Excessive debt is a ticking time bomb for many of these countries; EM dollar-denominated debt is now as high as it was in the late 1990s as a share of both GDP and exports (Chart 17). Moreover, the declining long-term growth potential for emerging economies as a group makes it more difficult for them to service the debt. The structural downtrend in EM labor force and productivity growth underscores that trend GDP growth has collapsed over the past three decades (Chart 17, bottom panel). Chart 17EM Debt A Problem Given Slowing Supply-Side...
EM Debt A Problem Given Slowing Supply-Side...
EM Debt A Problem Given Slowing Supply-Side...
Decelerating global growth has exposed these poor fundamentals. EM sovereign spreads have moved wider in conjunction with falling PMIs and slowing industrial production and export growth. And it certainly does not help that the Fed is tightening dollar-based liquidity conditions. EM equities usually fall when U.S. financial conditions tighten (Chart 18). Chart 18...And Tightening Financial Conditions
...And Tightening Financial Conditions
...And Tightening Financial Conditions
Chart 19 highlights the most vulnerable economies in terms of foreign currency funding requirements, and foreign debt-servicing obligations relative to total exports. Turkey stands out as the most vulnerable, along with Argentina, Brazil, Indonesia, Chile, and Colombia. In contrast, Emerging Asia appears to be in better shape relative to the crisis period of the late 1990s. Chart 19Spot The Outliers
OUTLOOK 2019: Late-Cycle Turbulence
OUTLOOK 2019: Late-Cycle Turbulence
The backdrop for EM assets is likely to get worse in the near term, given our view that the Fed will continue to tighten and China will be cautious about stimulating more aggressively. Our base case outlook sees some relief in the second half of 2019, but it is more of a “muddle-through” scenario than a V-shaped economic recovery. Mr. X: Perhaps EM assets could enjoy a bounce next year if the Chinese economy stabilizes, but the poor macro fundamentals you mentioned suggest that it would be a trade rather than a buy-and-hold proposition. I am inclined to avoid the whole asset class in 2019. Bond Market Prospects Ms. X: Let’s turn to fixed income now. I was bearish on bonds in 2018, but yields have risen quite a bit, at least in the United States. The Fed has lifted the fed funds rate by 100 basis points over the past year and I don’t see a lot of upside for inflation. So perhaps yields have peaked and will move sideways in 2019, which would be good for stocks in my view. BCA: Higher yields have indeed improved bond value recently. Nonetheless, they are not cheap enough to buy at this point (Chart 20). The real 10-year Treasury yield, at close to 1%, is still depressed by pre-Lehman standards. Long-term real yields in Germany and Japan remain in negative territory at close to the lowest levels ever recorded. Chart 20Real Yields Still Very Depressed
Real Yields Still Very Depressed
Real Yields Still Very Depressed
We called the bottom in global nominal bond yields in 2016. Our research at the time showed that the cyclical and structural factors that had depressed yields were at an inflection point, and were shifting in a less bond-bullish direction. Perhaps most important among the structural factors, population aging and a downward trend in underlying productivity growth resulted in lower equilibrium bond yields over the past couple of decades. Looking ahead, productivity growth could stage a mild rebound in line with the upturn in the growth rate of the capital stock (Chart 21). As for demographics, the age structure of the world population is transitioning from a period in which aging added to the global pool of savings to one in which aging is beginning to drain that pool as people retire and begin to consume their nest eggs (Chart 22). The household saving rates in the major advanced economies should trend lower in the coming years, placing upward pressure on equilibrium global bond yields. Chart 21Productivity Still Has Some Upside
Productivity Still Has Some Upside
Productivity Still Has Some Upside
Chart 22Demographics Past The Inflection Point
Demographics Past The Inflection Point
Demographics Past The Inflection Point
Cyclical factors are also turning against bonds. U.S. inflation has returned to target and the Fed is normalizing short-term interest rates. The market currently is priced for only one more rate hike after December 2018 in this cycle, but we see rates rising more than that. Treasury yields will follow as market expectations adjust. Long-term inflation expectations are still too low in the U.S. and most of the other major economies to be consistent with central banks’ meeting their inflation targets over the medium term. As actual inflation edges higher, long-term expectations built into bond yields will move up. The term premium portion of long-term bond yields is also too low. This is the premium that investors demand to hold longer-term bonds. Our estimates suggest that the term premium is still negative in the advanced economies outside of the U.S., which is not sustainable over the medium term (Chart 23). Chart 23Term Premia Are Too Low
Term Premia Are Too Low
Term Premia Are Too Low
We expect term premia to rise for two main reasons. First, investors have viewed government bonds as a good hedge for their equity holdings because bond prices have tended to rise when stock prices fell. Investors have been willing to pay a premium to hold long-term bonds to benefit from this hedging effect. But the correlation is now beginning to change as inflation and inflation expectations gradually adjust higher and output gaps close. As the hedging benefit wanes, the term premium should rise back into positive territory. Second, central bank bond purchases and forward guidance have depressed yields as well as interest-rate volatility. The latter helped to depress term premia in the bond market. This effect, too, is beginning to unwind. The Fed is letting its balance sheet shrink by about $50 billion per month. The Bank of England has kept its holdings of gilts and corporate bonds constant for over a year, while the ECB is about to end asset purchases. The Bank of Japan continues to buy assets, but at a much reduced pace. All this means that the private sector is being forced to absorb a net increase in government bonds for the first time since 2014 (Chart 24). Chart 25 shows that bond yields in the major countries will continue to trend higher as the rapid expansion of central bank balance sheets becomes a thing of the past. Chart 24Private Sector To Absorb More Bonds
OUTLOOK 2019: Late-Cycle Turbulence
OUTLOOK 2019: Late-Cycle Turbulence
Chart 25QE Unwind Will Weigh On Bond Prices
QE Unwind Will Weigh On Bond Prices
QE Unwind Will Weigh On Bond Prices
Ms. X: I’m not a fan of bonds at these levels, but that sounds overly bearish to me, especially given the recent plunge in oil prices. BCA: Lower oil prices will indeed help to hold down core inflation to the extent that energy prices leak into non-energy prices in the near term. Nonetheless, in the U.S., this effect will be overwhelmed by an overheated economy. From a long-term perspective, we believe that investors still have an overly benign view of the outlook for yields. The market expects that the 10-year Treasury yield in ten years will only be slightly above today’s spot yield, which itself is still very depressed by historical standards (Chart 26). And that also is the case in the other major bond markets. Chart 26Forward Yields Are Too Low
Forward Yields Are Too Low
Forward Yields Are Too Low
Of course, it will not be a straight line up for yields – there will be plenty of volatility. We expect the 10-year Treasury yield to peak sometime in 2019 or early 2020 in the 3.5%-to-4% range, before the next recession sends yields temporarily lower. Duration should be kept short at least until the middle of 2019, with an emphasis on TIPS relative to conventional Treasury bonds. We will likely downgrade TIPS versus conventionals once long-term inflation expectations move into our target range, which should occur sometime during 2019. The ECB and Japan will not be in a position to raise interest rates for some time, but the bear phase in U.S. Treasurys will drag up European and Japanese bond yields (at the very long end of the curve for the latter). Total returns are likely to be negative in all of the major bond markets in 2019. Real 10-year yields in all of the advanced economies are still well below their long-term average, except for Greece, Italy and Portugal (Chart 27). Chart 27Valuation Ranking Of Developed Bond Markets
OUTLOOK 2019: Late-Cycle Turbulence
OUTLOOK 2019: Late-Cycle Turbulence
Within global bond portfolios, we recommend being underweight bond markets where central banks are in a position to raise short-term interest rates (the U.S. and Canada), and overweight those that are not (Japan and Australia). The first ECB rate hike is unlikely before the end of 2019. However, the imminent end of the asset purchase program argues for no more than a benchmark allocation to core European bond markets within global fixed-income portfolios, especially since real 10-year yields in parts of continental Europe are the furthest below their long-term average. We are overweight gilts at the moment, but foresee shifting to underweight in 2019, depending on how Brexit plays out. Ms. X: What about corporate bonds? I know that total returns for corporates will be poor if government bond yields are rising. But you recommended overweighting corporate bonds relative to Treasurys last year. Given your view that the next U.S. recession is more than a year away, it seems reasonable to assume they will outperform government bonds. BCA: We were overweight corporates in the first half of 2018, but took profits in June and shifted to neutral at the same time that we downgraded our equity allocation. Spreads had tightened to levels that did not compensate investors for the risks. Recent spread widening has returned some value to U.S. corporates. The 12-month breakeven spreads for A-rated and Baa-rated corporate bonds are almost back up to their 50th percentile relative to history (Chart 28). Still, these levels are not attractive enough to justify buying based on valuation alone. As for high-yield, any rise in the default rate would quickly overwhelm the yield pickup in this space. Chart 28Corporate Bond Yields Still Have Upside
Corporate Bond Yields Still Have Upside
Corporate Bond Yields Still Have Upside
It is possible that some of the spread widening observed in October and November will reverse, but corporates offer a poor risk/reward tradeoff, even if the default rate stays low. Corporate profit growth is bound to decelerate in 2019. This would not be a disaster for equities, but slowing profit growth is more dangerous for corporate bond excess returns because the starting point for leverage is already elevated. As discussed above, at a macro level, the aggregate interest coverage ratio for the U.S. corporate sector is decent by historical standards. However, this includes mega-cap companies that have little debt and a lot of cash. Our bottom-up research suggests that interest coverage ratios for firms in the Bloomberg Barclays corporate bond index will likely drop close to multi-decade lows during the next recession, sparking a wave of downgrade activity and fallen angels. Seeing this coming, investors may require more yield padding to compensate for these risks as profit growth slows. Our next move will likely be to downgrade corporate bonds to underweight. We are watching the yield curve, bank lending standards, profit growth, and monetary indicators for signs to further trim exposure. You should already be moving up in quality within your corporate bond allocation. Mr. X: We have already shifted to underweight corporate bonds in our fixed income portfolio. Even considering the cheapening that has occurred over the past couple of months, spread levels still make no sense in terms of providing compensation for credit risk. Equity Market Outlook Ms. X: While we all seem to agree that corporate bonds are not very attractive, I believe that enough value has been restored to equities that we should upgrade our allocation, especially if the next recession is two years away. And I know that stocks sometimes have a powerful blow-off phase before the end of a bull market. Mr. X: This is where I vehemently disagree with my daughter. The recent sell-off resembles a bloodbath in parts of the global market. It has confirmed my worst fears, especially related to the high-flying tech stocks that I believe were in a bubble. Hopes for a blow-off phase are wishful thinking. I’m wondering if the sell-off represents the beginning of an extended bear market. BCA: Some value has indeed been restored. However, the U.S. market is far from cheap relative to corporate fundamentals. The trailing and 12-month forward price-earnings ratios (PER) of 20 and 16, respectively, are still far above their historical averages, especially if one leaves out the tech bubble period of the late 1990s. And the same is true for other metrics such as price-to-sales and price-to-book value (Chart 29). BCA’s composite valuation indicator, based on 8 different valuation measures, is only a little below the threshold of overvaluation at +1 standard deviation because low interest rates still favor equities on a relative yield basis. Chart 29U.S. Equities Are Not Cheap
U.S. Equities Are Not Cheap
U.S. Equities Are Not Cheap
It is true that equities can reward investors handsomely in the final stage of a bull market. Chart 30 presents cumulative returns to the S&P 500 in the last nine bull markets. The returns are broken down by quintile. The greatest returns, unsurprisingly, generally occur in the first part of the bull market (quintile 1). But total returns in the last 20% of the bull phase (quintile 5) have been solid and have beaten the middle quartiles. Chart 30Late-Cycle Blow-Offs Can Be Rewarding
OUTLOOK 2019: Late-Cycle Turbulence
OUTLOOK 2019: Late-Cycle Turbulence
Of course, the tricky part is determining where we are in the bull market. We have long viewed financial markets through the lens of money and credit. This includes a framework that involves the Fed policy cycle. The historical track record for risk assets is very clear; they tend to perform well when the fed funds rate is below neutral, whether rates are rising or falling. Risk assets tend to underperform cash when the fed funds rate is above neutral (Table 3). Table 3Stocks Do Well When The Fed Funds Rate Is Below Neutral
OUTLOOK 2019: Late-Cycle Turbulence
OUTLOOK 2019: Late-Cycle Turbulence
We believe the fed funds rate is still in easy territory. This suggests that it is too early to shift to underweight on risk assets. We may even want to upgrade to overweight if stocks become cheap enough, as long as Fed policy is not restrictive. That said, there is huge uncertainty about the exact level of rates that constitutes “neutral” (or R-star in the Fed’s lingo). Even the Fed is unsure. This means that we must watch for signs that the fed funds rate has crossed the line into restrictive territory as the FOMC tightens over the coming year. An inversion of the 3-month T-bill/10-year yield curve slope would be a powerful signal that policy has become tight, although the lead time of an inverted curve and declining risk asset prices has been quite variable historically. Finally, it is also important to watch U.S. profit margins. Some of our research over the past couple of years focused on the late-cycle dynamics of previous long expansions, such as the 1960s, 1980s and 1990s. We found that risk assets came under pressure once U.S. profit margins peaked. Returns were often negative from the peak in margins to the subsequent recession. Mr. X: U.S. profit margins must be close to peak levels. I’ve seen all sorts of anecdotal examples of rising cost pressures, not only in the labor market. BCA: We expected to see some margin pressure to appear by now. S&P 500 EPS growth will likely top out in the next couple of quarters, if only because the third quarter’s 26% year-over-year pace is simply not sustainable. But it is impressive that our margin proxies are not yet flagging an imminent margin squeeze, despite the pickup in wage growth (Chart 31). Chart 31U.S. Margin Indicators Still Upbeat
U.S. Margin Indicators Still Upbeat
U.S. Margin Indicators Still Upbeat
Margins according to the National Accounts (NIPA) data peaked in 2014 and have since diverged sharply with S&P 500 operating margins. It is difficult to fully explain the divergence. The NIPA margin is considered to be a better measure of underlying U.S. corporate profitability because it includes all companies (not just 500), and it is less subject to accounting trickery. That said, even the NIPA measure of margins firmed a little in 2018, along with the proxies we follow that correlate with the S&P 500 measure. The bottom line is that the macro variables that feed into our top-down U.S. EPS model point to a continuing high level of margins and fairly robust top-line growth, at least for the near term. For 2019, we assumed slower GDP growth and incorporated some decline in margins into our projection just to err on the conservative side. Nonetheless, our EPS model still projects a respectable 8% growth rate at the end of 2019 (Chart 32). The dollar will only be a minor headwind to earnings growth unless it surges by another 10% or more. Chart 32EPS Growth Forecasts
EPS Growth Forecasts
EPS Growth Forecasts
The risks to EPS growth probably are to the downside relative to our forecast, but the point is that U.S. earnings will likely remain supportive for the market unless economic growth is much weaker than we expect. None of this means that investors should be aggressively overweight stocks now. We trimmed our equity recommendation to benchmark in mid-2018 for several reasons. At the time, value was quite poor and bottom-up earnings expectations were too high, especially on a five-year horizon. Also, sentiment measures suggested that investors were overly complacent. As you know, we are always reluctant to chase markets into highly overvalued territory, especially when a lot of good news has been discounted. As we have noted, we are open to temporarily shifting back to overweight in equities and other risk assets. The extension of the economic expansion gives more time for earnings to grow. The risks facing the market have not eased much but, given our base-case macro view, we would be inclined to upgrade equities if there is another meaningful correction. Of course, our profit, monetary and economic indicators would have to remain supportive to justify an upgrade. Mr. X: But you are bearish on bonds. We saw in October that the equity market is vulnerable to higher yields. BCA: It certainly won’t be smooth sailing through 2019 as interest rates normalize. Until recently, higher bond yields reflected stronger growth without any associated fears that inflation was a growing problem. The ‘Fed Put’ was seen as a key backstop for the equity bull market. But now that the U.S. labor market is showing signs of overheating, the bond sell-off has become less benign for stocks because the Fed will be less inclined to ease up at the first sign of trouble in the equity market. How stocks react in 2019 to the upward trend in yields depends a lot on the evolution of actual inflation and long-term inflation expectations. If core PCE inflation hovers close to or just above 2% for a while, then the Fed Put should still be in place. However, it would get ugly for both bonds and stocks if inflation moves beyond 2.5%. Our base case is that this negative dynamic won’t occur until early 2020, but obviously the timing is uncertain. One key indicator to watch is long-term inflation expectations, such as the 10-year TIPS breakeven inflation rate (Chart 33). It is close to 2% at the moment. If it shifts up into the 2.3%-2.5% range, it would confirm that inflation expectations have returned to a level that is consistent with the Fed meeting its 2% inflation target on a sustained basis. This would be a signal to the Fed that it is must become more aggressive in calming growth, with obvious negative consequences for risk assets. Chart 33Watch For A Return To 2.3%-2.5% Range
Watch For A Return To 2.3%-2.5% Range
Watch For A Return To 2.3%-2.5% Range
Mr. X: I am skeptical that the U.S. corporate sector can pull off an 8% earnings gain in 2019. What about the other major markets? Won’t they get hit hard if global growth continues to slow as you suggest? BCA: Yes, that is correct. It is not surprising that EPS growth has already peaked in the Euro Area and Japan. The profit situation is going to deteriorate quickly in the coming quarters. Industrial production growth in both economies has already dropped close to zero, and we use this as a proxy for top-line growth in our EPS models. Nominal GDP growth has decelerated sharply in both economies in absolute terms and relative to the aggregate wage bill. These trends suggest that profit margins are coming under significant downward pressure. Even when we build in a modest growth pickup and slight rebound in margins in 2019, EPS growth falls close to zero by year-end according to our models. Both the Euro Area and Japanese equity markets are cheap relative to the U.S., based on our composite valuation indicators (Chart 34). However, neither is above the threshold of undervaluation (+1 standard deviation) that would justify overweight positions on valuation alone. We think the U.S. market will outperform the other two at least in the first half of 2019 in local and, especially, common-currency terms. Chart 34Valuation Of Nonfinancial Equity Markets Relative To The U.S.
OUTLOOK 2019: Late-Cycle Turbulence
OUTLOOK 2019: Late-Cycle Turbulence
Ms. X: It makes sense that U.S. profit growth will outperform the other major developed countries in 2019. I would like to circle back to emerging market assets. I understand that many emerging economies have deep structural problems. But you admitted that the Chinese authorities will eventually stimulate enough to stabilize growth, providing a bounce in EM growth and asset prices next year. These assets seem cheap enough to me to warrant buying now in anticipation of that rally. As we all know, reversals from oversold levels can happen in a blink of an eye and I don’t want to miss it. BCA: We are looking for an opportunity to buy as well, but are wary of getting in too early. First, valuation has improved but is not good enough on its own to justify buying now. EM stocks are only moderately undervalued based on our EM composite valuation indicator and the cyclically-adjusted P/E ratio (Chart 35). EM currencies are not particularly cheap either, outside of Argentina, Turkey and Mexico (Charts 36A and 36B). Valuation should only play a role in investment strategy when it is at an extreme, and this is not the case for most EM countries. Chart 35EM Stocks Are Not At Capitulation Levels...
bca.bca_mp_2018_12_01_c35
bca.bca_mp_2018_12_01_c35
Chart 36A…And Neither Are EM Currencies
...And Neither Are EM Currencies
...And Neither Are EM Currencies
Chart 36B…And Neither Are EM Currencies
...And Neither Are EM Currencies
...And Neither Are EM Currencies
Second, corporate earnings growth has plenty of downside potential in the near term. Annual growth in EM nonfinancial EBITDA, currently near 10%, is likely to turn negative next year, based on our China credit and fiscal impulse indicator (Chart 37). And, as we emphasized earlier, China is not yet pressing hard on the gas pedal. Chart 37EM Earnings Growth: Lots Of Downside
EM Earnings Growth: Lots Of Downside
EM Earnings Growth: Lots Of Downside
Third, it will take time for more aggressive Chinese policy stimulus, if it does occur, to show up in EM stocks and commodity prices. Trend changes in money growth and our credit and fiscal impulse preceded the trough in EM stocks and commodity prices in 2015, and again at the top in stocks and commodities in 2017 (Chart 38). However, even if these two indicators bottom today, it could take several months before the sell-off in EM financial markets and commodity prices abates. Chart 38Chinese Money And Credit Leads EM And Commodities
Chinese Money And Credit Leads EM And Commodities
Chinese Money And Credit Leads EM And Commodities
Finally, if Chinese stimulus comes largely via easier monetary policy rather than fiscal stimulus, then the outcome will be a weaker RMB. We expect the RMB to drift lower in any event, because rate differentials vis-à-vis the U.S. will move against the Chinese currency next year. A weaker RMB would add to the near-term headwinds facing EM assets. The bottom line is that the downside risks remain high enough that you should resist the temptation to bottom-fish until there are concrete signs that the Chinese authorities are getting serious about boosting the economy. We are also watching for signs outside of China that the global growth slowdown is ending. This includes our global leading economic indicator and data that are highly sensitive to global growth, such as German manufacturing foreign orders. Mr. X: Emerging market assets would have to become a lot cheaper for me to consider buying. Debt levels are just too high to be sustained, and stronger Chinese growth would only provide a short-term boost. I’m not sure I would even want to buy developed market risk assets based solely on some Chinese policy stimulus. BCA: Yes, we agree with your assessment that buying EM in 2019 would be a trade rather than a buy-and-hold strategy. Still, the combination of continued solid U.S. growth and a modest upturn in the Chinese economy would alleviate a lot of investors’ global growth concerns. The result could be a meaningful rally in pro-cyclical assets that you should not miss. We are defensively positioned at the moment, but we could see becoming more aggressive in 2019 on signs that China is stimulating more firmly and/or our global leading indicators begin to show some signs of life. Besides upgrading our overall equity allocation back to overweight, we would dip our toes in the EM space again. At the same time, we will likely upgrade the more cyclical DM equity markets, such as the Euro Area and Japan, while downgrading the defensive U.S. equity market to underweight. We are currently defensively positioned in terms of equity sectors, but it would make sense to shift cyclicals to overweight at the same time. Exact timing is always difficult, but we expect to become more aggressive around the middle of 2019. We also think the time is approaching to favor long-suffering value stocks over growth stocks. The relative performance of growth-over-value according to standard measures has become a sector call over the past decade: tech or financials. The sector skew complicates this issue, especially since tech stocks have already cracked. But we have found that stocks that are cheap within equity sectors tend to outperform expensive (or growth) stocks once the fed funds rate moves into restrictive territory. This is likely to occur in the latter half of 2019. Value should then have its day in the sun. Currencies: Mr. X: We don’t usually hedge our international equity exposure, so the direction of the dollar matters a lot to us. As you predicted a year ago, the U.S. dollar reigned supreme in 2018. Your economic views suggest another good year in 2019, but won’t this become a problem for the economy? President Trump’s desire to lower the U.S. trade deficit suggests that the Administration would like the dollar to drop and we could get some anti-dollar rhetoric from the White House. Also, it seems that the consensus is strongly bullish on the dollar which is always a concern. BCA: The outlook for the dollar is much trickier than it was at the end of 2017. As you highlighted, traders are already very long the dollar, implying that the hurdle for the greenback to surprise positively is much higher now. However, a key driver for the dollar is the global growth backdrop. If the latter is poor in the first half of 2019 as we expect, it will keep a bid under the greenback. Interest rates should also remain supportive for the dollar. As we argued earlier, current market expectations – only one more Fed hike after the December meeting – are too sanguine. If the Fed increases rates by more than currently discounted, the dollar’s fair value will rise, especially if global growth continues to lag that of the U.S. Since the dollar’s 2018 rally was largely a correction of its previous undervaluation, the currency has upside potential in the first half of the year (Chart 39). Chart 39U.S. Dollar Not Yet Overvalued
U.S. Dollar Not Yet Overvalued
U.S. Dollar Not Yet Overvalued
A stronger dollar will dampen foreign demand for U.S.-produced goods and will boost U.S. imports. However, do not forget that a rising dollar benefits U.S. consumers via its impact on import prices. Since the consumer sector represents 68% of GDP, and that 69% of household consumption is geared toward the (largely domestic) service sector, a strong dollar will not be as negative for aggregate demand and employment as many commentators fear, unless it were to surge by at least another 10%. In the end, the dollar will be more important for the distribution of U.S. growth than its overall level. Where the strong dollar is likely to cause tremors is in the political arena. You are correct to point out that there is a large inconsistency between the White House’s desires to shore up growth, while simultaneously curtailing the trade deficit, especially if the dollar appreciates further. As long as the Fed focuses on its dual mandate and tries to contain inflationary pressures, the executive branch of the U.S. government can do little to push the dollar down. Currency intervention cannot have a permanent effect unless it is accompanied by shifts in relative macro fundamentals. For example, foreign exchange intervention by the Japanese Ministry of Finance in the late 1990s merely had a temporary impact on the yen. The yen only weakened on a sustained basis once interest rate differentials moved against Japan. This problem underpins our view that the Sino-U.S. relationship is unlikely to improve meaningfully next year. China will remain an easy target to blame for the U.S.’s large trade deficit. What ultimately will signal a top in the dollar is better global growth, which is unlikely until the second half of 2019. At that point, expected returns outside the U.S. will improve, causing money to leave the U.S., pushing the dollar down. Mr. X: While 2017 was a stellar year for the euro, 2018 proved a much more challenging environment. Will 2019 be more like 2017 or 2018? BCA: We often think of the euro as the anti-dollar; buying EUR/USD is the simplest, most liquid vehicle for betting against the dollar, and vice versa. Our bullish dollar stance is therefore synonymous with a negative take on the euro. Also, the activity gap between the U.S. and the Euro Area continues to move in a euro-bearish fashion (Chart 40). Finally, since the Great Financial Crisis, EUR/USD has lagged the differential between European and U.S. core inflation by roughly six months. Today, this inflation spread still points toward a weaker euro. Chart 40Relative LEI's Moving Against Euro
Relative LEI's Moving Against Euro
Relative LEI's Moving Against Euro
It is important to remember that when Chinese economic activity weakens, European growth deteriorates relative to the U.S. Thus, our view that global growth will continue to sputter in the first half of 2019 implies that the monetary policy divergence between the Fed and the ECB has not yet reached a climax. Consequently, we expect EUR/USD to trade below 1.1 in the first half of 2019. By that point, the common currency will be trading at a meaningful discount to its fair value, which will allow it to find a floor (Chart 41). Chart 41Euro Heading Below Fair Value Before Bottoming
Euro Heading Below Fair Value Before Bottoming
Euro Heading Below Fair Value Before Bottoming
Mr. X: The Bank of Japan has debased the yen, with a balance sheet larger than Japan’s GDP. This cannot end well. I am very bearish on the currency. BCA: The BoJ’s monetary policy is definitely a challenge for the yen. The Japanese central bank rightfully understands that Japan’s inability to generate any meaningful inflation – despite an economy that is at full employment – is the consequence of a well-established deflationary mindset. The BoJ wants to shock inflation expectations upward by keeping real rates at very accommodative levels well after growth has picked up. This means that the BoJ will remain a laggard as global central banks move away from accommodative policies. The yen will continue to depreciate versus the dollar as U.S. yields rise on a cyclical horizon. That being said, the yen still has a place within investors’ portfolios. First, the yen is unlikely to collapse despite the BoJ’s heavy debt monetization. The JPY is one of the cheapest currencies in the world, with its real effective exchange rate hovering at a three-decade low (Chart 42). Additionally, Japan still sports a current account surplus of 3.7% of GDP, hardly the sign of an overstimulated and inflationary economy where demand is running amok. Instead, thanks to decades of current account surpluses, Japan has accumulated a positive net international investment position of 60% of GDP. This means that Japan runs a constant and large positive income balance, a feature historically associated with strong currencies. Chart 42The Yen Is Very Cheap
The Yen Is Very Cheap
The Yen Is Very Cheap
Japan’s large net international investment position also contributes to the yen’s defensive behavior as Japanese investors pull money back to safety at home when global growth deteriorates. Hence, the yen could rebound, especially against the euro, the commodity currencies, and EM currencies if there is a further global growth scare in the near term. Owning some yen can therefore stabilize portfolio returns during tough times. As we discussed earlier, we would avoid the EM asset class, including currency exposure, until global growth firms. Commodities: Ms. X: Once again, you made a good call on the energy price outlook a year ago, with prices moving higher for most of the year. But the recent weakness in oil seemed to come out of nowhere, and I must admit to being confused about where we go next. What are your latest thoughts on oil prices for the coming year? BCA: The fundamentals lined up in a very straightforward way at the end of 2017. The coalition we have dubbed OPEC 2.0 – the OPEC and non-OPEC producer group led by the Kingdom of Saudi Arabia (KSA) and Russia – outlined a clear strategy to reduce the global oil inventory overhang. The producers that had the capacity to increase supply maintained strict production discipline which, to some analysts, was still surprising even after the cohesiveness shown by the group in 2017. Outside that core group output continued to fall, especially in Venezuela, which remains a high-risk producing province. The oil market was balanced and prices were slowly moving higher as we entered the second quarter of this year, when President Trump announced the U.S. would re-impose oil export sanctions against Iran beginning early November. The oft-repeated goal of the sanctions was to reduce Iranian exports to zero. To compensate for the lost Iranian exports, President Trump pressured OPEC, led by KSA, to significantly increase production, which they did. However, as we approached the November deadline, the Trump Administration granted the eight largest importers of Iranian oil 180-day waivers on the sanctions. This restored much of the oil that would have been lost. Suddenly, the market found itself oversupplied and prices fell. As we move toward the December 6 meeting of OPEC 2.0 in Vienna, we are expecting a production cut from the coalition of as much as 1.4mm b/d to offset these waivers. The coalition wishes to keep global oil inventories from once again over-filling and dragging prices even lower in 2019. On the demand side, consumption continues to hold up both in the developed and emerging world, although we have somewhat lowered our expectations for growth next year. We are mindful of persistent concerns over the strength of demand – particularly in EM – in 2019. Thus, on the supply side and the demand side, the level of uncertainty in the oil markets is higher than it was at the start of 2018. Nonetheless, our base-case outlook is on the optimistic side for oil prices in 2019, with Brent crude oil averaging around $82/bbl, and WTI trading $6/bbl below that level (Chart 43). Chart 43Oil Prices To Rebound In 2019
Oil Prices To Rebound In 2019
Oil Prices To Rebound In 2019
Ms. X: I am skeptical that oil prices will rebound as much as you expect. First, oil demand is likely to falter if your view that global growth will continue slowing into early 2019 proves correct. Second, U.S. shale production is rising briskly, with pipeline bottlenecks finally starting to ease. Third, President Trump seems to have gone from taking credit for high equity prices to taking credit for low oil prices. Trump has taken a lot flack for supporting Saudi Arabia following the killing of The Washington Post journalist in Turkey. Would the Saudis really be willing to lose Trump’s support by cutting production at this politically sensitive time? BCA: Faltering demand growth remains a concern. However, note that in our forecasts we do expect global oil consumption growth to slow down to 1.46mm b/d next year, somewhat lower than the 1.6mm b/d growth we expect this year. In terms of the U.S. shale sector, production levels over the short term can be somewhat insensitive to changes in spot and forward prices, given the hedging activity of producers. Over the medium to longer term, however, lower spot and forward prices will disincentivize drilling by all but the most efficient producers with the best, lowest-cost acreage. If another price collapse were to occur – and were to persist, as the earlier price collapse did – we would expect a production loss of between 5% and 10% from the U.S. shales. Regarding KSA, the Kingdom needs close to $83/bbl to balance its budget this year and next, according to the IMF’s most recent estimates. If prices remain lower for longer, KSA’s official reserves will continue to fall, as its sovereign wealth fund continues to be tapped to fill budget gaps. President Trump’s insistence on higher production from KSA and the rest of OPEC is a non-starter – it would doom those economies to recession, and stifle further investment going forward. The U.S. would also suffer down the road, as the lack of investment significantly tightens global supply. So, net, if production cuts are not forthcoming from OPEC at its Vienna meeting we – and the market – will be downgrading our oil forecast. Ms. X: Does your optimism regarding energy extend to other commodities? The combination of a strong dollar and a China slowdown did a lot of damage to industrial commodities in 2018. Given your view that China’s economy should stabilize in 2019, are we close to a bottom in base metals? BCA: It is too soon to begin building positions in base metals because the trade war is going to get worse before it gets better. Exposure to base metals should be near benchmark at best entering 2019, although we will be looking to upgrade along with other risk assets if Chinese policy stimulus ramps up. Over the medium term, the outlook for base metals hinges on how successfully China pulls off its pivot toward consumer- and services-led growth, away from heavy industrial-led development. China accounts for roughly half of global demand for these base metals. Commodity demand from businesses providing consumer goods and services is lower than that of heavy industrial export-oriented firms. But demand for commodities used in consumer products – e.g., copper, zinc and nickel, which go into stainless-steel consumer appliances such as washers and dryers – will remain steady, and could increase if the transition away from heavy industrial-led growth is successful. Gasoline and jet fuel demand will also benefit, as EM consumers’ demand for leisure activities such as tourism increases with rising incomes. China is also going to be a large producer and consumer of electric vehicles, as it attempts to reduce its dependence on imported oil. Although timing the production ramp-up is difficult, in the long term these trends will be supportive for nickel and copper. Mr. X: You know I can’t let you get away without asking about gold. The price of bullion is down about 5% since the end of 2017, but that is no worse than the global equity market and it did provide a hedge against economic, financial or political shocks. The world seems just as risky as it did a year ago, so I am inclined to hold on to our gold positions, currently close to 10% of our portfolio. That is above your recommended level, but keeping a solid position in gold is one area where my daughter and I have close agreement regarding investment strategy. BCA: Gold did perform well during the risk asset corrections we had in 2018, and during the political crises as well. The price is not too far away from where we recommended going long gold as a portfolio hedge at the end of 2017 ($1230.3/oz). We continue to expect gold to perform well as a hedge. When other risk assets are trading lower, gold holds value relative to equities and tends to outperform bonds (Chart 44). Likewise, when other risk assets are rising, gold participates, but does not do as well as equities. It is this convexity – outperforming on the downside but participating on the upside with other risk assets – that continues to support our belief that gold has a role as a portfolio hedge. However, having 10% of your portfolio in gold is more than we would recommend – we favor an allocation of around 5%. Chart 44Hold Some Gold As A Hedge
OUTLOOK 2019: Late-Cycle Turbulence
OUTLOOK 2019: Late-Cycle Turbulence
Geopolitics Ms. X: I’m glad that the three of us agree at least on one thing – hold some gold! Let’s return to the geopolitical situation for a moment. Last year, you correctly forecast that divergent domestic policies in the U.S. and China – stimulus in the former and lack thereof in the latter – would be the most investment-relevant geopolitical issue. At the time, I found this an odd thing to highlight, given the risks of protectionism, populism, and North Korea. Do you still think that domestic policies will dominate in 2019? BCA: Yes, policy divergence between the U.S. and China will also dominate in 2019, especially if it continues to buoy the U.S. economy at the expense of the rest of the world. Of course, Beijing may decide to do more stimulus to offset its weakening economy and the impact of the trade tariffs. A headline rate cut, cuts to bank reserve requirements, and a boost to local government infrastructure spending are all in play. In the context of faltering housing and capex figures in the U.S., the narrative over the next quarter or two could be that the policy divergence is over, that Chinese policymakers have “blinked.” We are pushing back against this narrative on a structural basis. We have already broadly outlined our view that China will not be pressing hard to boost demand growth. Many of its recent policy efforts have focused on rebalancing the economy away from debt-driven investment (Chart 45). The problem for the rest of the world is that raw materials and capital goods comprise 85% of Chinese imports. As such, efforts to boost domestic consumption will have limited impact on the rest of the world, especially as emerging markets are highly leveraged to “old China.” Chart 45Rebalancing Of The Chinese Economy
Rebalancing Of The Chinese Economy
Rebalancing Of The Chinese Economy
Meanwhile, the Trump-Democrat gridlock could yield surprising results in 2019. President Trump is becoming singularly focused on winning re-election in 2020. As such, he fears the “stimulus cliff” looming over the election year. Democrats, eager to show that they are not merely the party of “the Resistance,” have already signaled that an infrastructure deal is their top priority. With fiscal conservatives in the House all but neutered by the midterm elections, a coalition between Trump and likely House Speaker Nancy Pelosi could emerge by late 2019, ushering in even more fiscal stimulus. While the net new federal spending will not be as grandiose as the headline figures, it will be something. There will also be regular spending increases in the wake of this year’s bipartisan removal of spending caps. We place solid odds that the current policy divergence narrative continues well into 2019, with bullish consequences for the U.S. dollar and bearish outcomes for EM assets, at least in the first half of the year. Mr. X: Your geopolitical team has consistently been alarmist on the U.S.-China trade war, a view that bore out throughout 2018. You already stated that you think trade tensions will persist in 2019. Where is this heading? BCA: Nowhere good. Rising geopolitical tensions in the Sino-American relationship has been our premier geopolitical risk since 2012. The Trump administration has begun tying geopolitical and strategic matters in with the trade talks. No longer is the White House merely asking for a narrowing of the trade deficit, improved intellectual property protections, and the removal of non-tariff barriers to trade. Now, everything from surface-to-air missiles in the South China Sea to Beijing’s “Belt and Road” project are on the list of U.S. demands. Trade negotiations are a “two-level game,” whereby policymakers negotiate in parallel with their foreign counterparts and domestic constituents. While Chinese economic agents may accept U.S. economic demands, it is not clear to us that its military and intelligence apparatus will accept U.S. geopolitical demands. And Xi Jinping himself is highly attuned to China’s geopolitical position, calling for national rejuvenation above all. We would therefore downplay any optimistic news from the G20 summit between Presidents Trump and Xi. President Trump could freeze tariffs at current rates and allow for a more serious negotiating round throughout 2019. But unless China is willing to kowtow to America, a fundamental deal will remain elusive in the end. For Trump, a failure to agree is still a win domestically, as the median American voter is not asking for a resolution of the trade war with China (Chart 46). Chart 46Americans Favor Being Tough On China
OUTLOOK 2019: Late-Cycle Turbulence
OUTLOOK 2019: Late-Cycle Turbulence
Ms. X: Could trade tensions spill into rising military friction? BCA: Absolutely. Minor military skirmishes will likely continue and could even escalate. We believe that there is a structural bull market in “war.” Investors should position themselves by being long global defense stocks. Mr. X: That is not encouraging. What about North Korea and Iran? Could they become geopolitical risks in 2019? BCA: Our answer to the North Korea question remains the same as 12 months ago: we have seen the peak in the U.S.’ display of a “credible military threat.” But Iran could re-emerge as a risk mid-year. We argued in last year’s discussion that President Trump was more interested in playing domestic politics than actually ratcheting up tensions with Iran. However, in early 2018 we raised our alarm level, particularly when staffing decisions in the White House involved several noted Iran hawks joining the foreign policy team. This was a mistake. Our initial call was correct, as President Trump ultimately offered six-month exemptions to eight importers of Iranian crude. That said, those exemptions will expire in the spring. The White House may, at that point, ratchet up tensions with Iran. This time, we will believe it when we see it. Intensifying tensions with Iran ahead of the U.S. summer vacation season, and at a time when crude oil markets are likely to be finely balanced, seems like folly, especially with primary elections a mere 6-to-8 months away. What does President Trump want more: to win re-election or to punish Iran? We think the answer is obvious, especially given that very few voters seem to view Iran as the country’s greatest threat (Chart 47). Chart 47Americans Don’t See Iran As A Major Threat
OUTLOOK 2019: Late-Cycle Turbulence
OUTLOOK 2019: Late-Cycle Turbulence
Ms. X: Let’s turn to Europe. You have tended to dismiss Euroskeptics as a minor threat, which has largely been correct. But don’t you think that, with Brexit upon us and Chancellor Angela Merkel in the twilight, populism in continental Europe will finally have its day? BCA: Let’s first wait to see how Brexit turns out! The next few months will be critical. Uncertainty is high, with considerable risks remaining. We do not think that Prime Minister May has the votes in the House of Commons to push through any version of soft Brexit that she has envisioned thus far. If the vote on the U.K.-EU exit deal falls through, a new election could be possible. This will require an extension of the exit process under Article 50 and a prolonged period of uncertainty. The probability of a no-deal Brexit is lower than 10%. It is simply not in the interest of anyone involved, save for a smattering of the hardest of hard Brexit adherents in the U.K. Conservative Party. Put simply, if the EU-U.K. deal falls through in the House of Commons, or even if PM May is replaced by a hard-Brexit Tory, the most likely outcome is an extension of the negotiation process. This can be easily done and we suspect that all EU member states would be in favor of such an extension given the cost to business sentiment and trade that would result from a no-deal Brexit. It is not clear that Brexit has emboldened Euroskeptics. In fact, most populist parties in the EU have chosen to tone down their Euroskepticism and emphasize their anti-immigrant agenda since the Brexit referendum. In part, this decision has to do with how messy the Brexit process has become. If the U.K. is struggling to unravel the sinews that tie it to Europe, how is any other country going to fare any better? The problem for Euroskeptic populists is that establishment parties are wise to the preferences of the European median voter. For example, we now have Friedrich Merz, a German candidate for the head of the Christian Democratic Union – essentially Merkel’s successor – who is both an ardent Europhile and a hardliner on immigration. This is not revolutionary. Merz simply read the polls correctly and realized that, with 83% of Germans supporting the euro, the rise of the anti-establishment Alternative for Germany (AfD) is more about immigration than about the EU. As such, we continue to stress that populism in Europe is overstated. In fact, we expect that Germany and France will redouble their efforts to reform European institutions in 2019. The European parliamentary elections in May will elicit much handwringing by the media due to a likely solid showing by Euroskeptics, even though the election is meaningless. Afterwards, we expect to see significant efforts to complete the banking union, reform the European Stability Mechanism, and even introduce a nascent Euro Area budget. But these reforms will not be for everyone. Euroskeptics in Central and Eastern Europe will be left on the outside looking in. Brussels may also be emboldened to take a hard line on Italy if institutional reforms convince the markets that the core Euro Area is sheltered from contagion. In other words, the fruits of integration will be reserved for those who play by the Franco-German rules. And that could, ironically, set the stage for the unraveling of the European Union as we know it. Over the long haul, a much tighter, more integrated, core could emerge centered on the Euro Area, with the rest of the EU becoming stillborn. The year 2019 will be a vital one for Europe. We are sensing an urgency in Berlin and Paris that has not existed throughout the crisis, largely due to Merkel’s own failings as a leader. We remain optimistic that the Euro Area will survive. However, there will be fireworks. Finally, a word about Japan. The coming year will see the peak of Prime Minister Shinzo Abe’s career. He is promoting the first-ever revision to Japan’s post-war constitution in order to countenance the armed forces. If he succeeds, he will have a big national security success to couple with his largely effective “Abenomics” economic agenda – after that, it will all be downhill. If he fails, he will become a lame duck. This means that political uncertainty will rise in 2019, after six years of unusual tranquility. Conclusions Mr. X: This is a good place to conclude our discussion. We have covered a lot of ground and your views have reinforced my belief that 2019 could be even more turbulent for financial markets than the past has been. I accept your opinion that a major global economic downturn is not around the corner, but with valuations still stretched, I feel that it makes good sense to focus on capital preservation. I may lose out on the proverbial “blow-off” rally, but so be it – I have been in this business long enough to know that it is much better to leave the party while the music is still playing! Ms. X: I agree with my father that the risks surrounding the outlook have risen as we have entered the late stages of this business-cycle expansion. Yet, if global growth does temporarily stabilize and corporate earnings continue to expand, I fear that being out of the market will be very painful. The era of hyper-easy money may be ending, but interest rates globally are still nowhere near restrictive territory. This tells me that the final stages of this bull market could be very rewarding. A turbulent market is not only one where prices go down – they can also go up a lot! BCA: The debate you are having is one we ourselves have had on numerous occasions. There is always a trade-off between maximizing short-term returns and taking a longer-term approach. Valuations are the ultimate guidepost for long-term returns. While most assets have cheapened over the past year, prices are still fairly elevated. Table 4 shows our baseline calculations of what a balanced portfolio will earn over the coming decade. We estimate that such a portfolio will deliver average annual returns of 4.9% over the next ten years, or 2.8% after adjusting for inflation. That is an improvement over our inflation-adjusted estimate of 1.3% from last year, but still well below the 6.6% real return that a balanced portfolio earned between 1982 and 2018. Table 410-Year Asset Return Projections
OUTLOOK 2019: Late-Cycle Turbulence
OUTLOOK 2019: Late-Cycle Turbulence
Our return calculations for equities assume that profit margins decline modestly over the period and that multiples mean revert to their historical average. These assumptions may turn out to be too pessimistic if underlying changes in the economy keep corporate profits elevated as a share of GDP. Structurally lower real interest rates may also justify higher P/E multiples, although this would be largely offset by the prospect of slower economic growth, which will translate into slower earnings growth. In terms of the outlook for the coming year, a lot hinges on our view that monetary policy in the main economies stays accommodative. This seems like a safe assumption in the Euro Area and Japan, where rates are near historic lows, as well as in China, where the government is actively loosening monetary conditions. It is not such a straightforward conclusion for the U.S., where the Fed is on track to keep raising rates. If it turns out that the neutral interest rate is not far above where rates are already, we could see a broad-based slowdown of the U.S. economy that ripples through to the rest of the world. And even if U.S. monetary policy does remain accommodative, many things could still upset the apple cart, including a full-out trade war, debt crises in Italy or China, or a debilitating spike in oil prices. As the title of our outlook implies, 2019 is likely to be a year of increased turbulence. Ms. X: As always, you have left us with much to think about. My father has looked forward to these discussions every year and now that I am able to join him, I understand why. Before we conclude, it would be helpful to have a recap of your key views. BCA: That would be our pleasure. The key points are as follows: The collision between policy and markets that we discussed last year finally came to a head in October. Rather than falling as they normally do when stocks plunge, U.S. bond yields rose as investors reassessed the willingness of the Fed to pause hiking rates even in the face of softer growth. Likewise, hopes that China would move swiftly to stimulate its economy were dashed as it became increasingly clear that the authorities were placing a high emphasis on their reform agenda of deleveraging and capacity reduction. The ongoing Brexit saga and the stalemate between the populist Italian government and the EU have increased uncertainty in Europe at a time when the region was already beginning to slow. We expect the tensions between policy and markets to be an ongoing theme in 2019. With the U.S. unemployment rate at a 48-year low, it will take a significant slowdown for the Fed to stop hiking rates. Despite the deterioration in economic data over the past month, real final domestic demand is still tracking to expand by 3% in the fourth quarter, well above estimates of the sustainable pace of economic growth. Ultimately, the Fed will deliver more hikes next year than discounted in the markets. This will push up the dollar and keep the upward trend in Treasury yields intact. The dollar should peak midway next year. China will also become more aggressive in stimulating its economy, which will boost global growth. However, until both of these things happen, emerging markets will remain under pressure. For the time being, we continue to favor developed market equities over their EM peers. We also prefer defensive equity sectors such as health care and consumer staples over cyclical sectors such as industrials and materials. Within the developed market universe, the U.S. will outperform Europe and Japan for the next few quarters, especially in dollar terms. A stabilization in global growth could ignite a blow-off rally in global equities. If the Fed is raising rates in response to falling unemployment, this is unlikely to derail the stock market. However, once supply-side constraints begin to fully bite in early 2020 and inflation rises well above the Fed’s target of 2%, stocks will begin to buckle. This means that a window exists next year where stocks will outperform bonds. We would maintain a benchmark allocation to stocks for now, but increase exposure if global bourses were to fall significantly from current levels without a corresponding deteriorating in the economic outlook. Corporate credit will underperform stocks as government bond yields rise. A major increase in spreads is unlikely as long as the economy is still expanding, but spreads could still widen modestly given their low starting point. U.S. shale companies have been the marginal producers in the global oil sector. With breakeven costs in shale close to $50/bbl, crude prices are unlikely to rise much from current levels over the long term. However, over the next 12 months, we expect production cuts in Saudi Arabia will push prices up, with Brent crude averaging around $82/bbl in 2019. A balanced portfolio is likely to generate average returns of only 2.8% a year in real terms over the next decade. This compares to average returns of around 6.6% a year between 1982 and 2018. We would like to take this opportunity to wish you and all of our clients a very peaceful, healthy and prosperous New Year. The Editors November 26, 2018
Highlights Structurally, EM corporate leverage is elevated and the interest coverage ratio is low. Cyclically, China/EM growth slowdown will lead to corporate spread widening. Rising U.S. dollar corporate bond yields in EM herald lower share prices. The recent underperformance in Mexican financial markets versus their EM peers is not sustainable. We reiterate our overweight position in Mexico. In Indonesia, the central bank is attempting to fight the Impossible Trinity, a battle that by definition cannot be won. Investors should keep underweighting this market. Feature This report focuses on the corporate health of emerging market (EM) companies, as well as the outlook for corporate bonds. We review the key drivers behind credit spreads and provide an up-to-date snapshot of overall corporate health. We also illustrate the travails in China's offshore corporate bond market, which are of high importance to the broad EM outlook. With respect to scope of coverage and data comparability, please refer to Box 1. BOX 1 Data Relevance And Its Application As there is no aggregate financial dataset for EM corporate bond issuers, we use corporate financial data provided by Worldscope for the EM equity universe - the constituents of the MSCI EM equity index. While from an individual country perspective this makes a difference, from an EM sector perspective the differences are not substantial. Excluding the technology sector, it is often the case that the same companies have both publicly traded stocks and bonds. This is especially true in sectors such as basic materials, energy, industrials, telecom, utilities and financials. This is why, in this report, we focus our attention on sectors rather than countries, and why we examine the EM companies' financial health excluding technology and banks. Banks' relevant financial ratios vary greatly from those of non-banks. For the technology sector, the largest tech names in the equity space have minimal bonds outstanding, so using financial data from the equity space for credit analysis is inappropriate. In short, the analysis below on corporate health is pertinent to both equity and corporate bond investors. However, its emphasis is on creditworthiness and ability to service debt, which is more attuned to credit investors. Drivers Of EM Credit Spreads Cyclical swings in EM corporate and sovereign credit spreads are driven by changes in borrowers' revenues, cash flow and profits. Hence, the business cycle is one of the important drivers of corporate creditworthiness. When global and EM growth accelerate, revenue and free cash flow improve, causing credit spreads to narrow (Chart I-1). The EM business cycle drives EM sovereign spreads too (Chart I-2). Chart I-1EM Corporates: Cash Flow From Operations And Credit Spreads
bca.ems_sr_2018_11_22_s1_c1
bca.ems_sr_2018_11_22_s1_c1
Chart I-2EM Sovereign Spreads Move In Tandem With Business Cycle
EM Sovereign Spreads Move In Tandem With Business Cycle
EM Sovereign Spreads Move In Tandem With Business Cycle
This is why we spend a lot of time gauging the global business cycle outlook and cover this topic extensively in our reports. For now, the growth outlook for China/EM and global trade remains gloomy: Chart I-3China Is A Major Risk For EM Profits
China Is A Major Risk For EM Profits
China Is A Major Risk For EM Profits
China's credit and fiscal spending impulse projects further weakness in the mainland's business cycle and EM corporate earnings (Chart I-3). China's slowdown is no longer limited to the industrial sector - household spending growth has downshifted considerably since early this year, as we discussed in last week's report.1 Weakening sales of consumer goods and autos in China are one of the primary reasons behind the ongoing slump in the global technology and semiconductor sectors. Consistently, plunging growth in Taiwanese electronics exports points to both weaker global trade and EM tech earnings in the months ahead (Chart I-4). In short, even though we have excluded technology from our analysis of corporate financial health, hardware tech companies' profits remain at risk. The latter is not relevant for EM corporate bond investors, but it is critical for the EM equity space. Chart I-4Taiwanese Shipments Foreshadow A Relapse In EM Tech Earnings
Taiwanese Shipments Foreshadow A Relapse In EM Tech Earnings
Taiwanese Shipments Foreshadow A Relapse In EM Tech Earnings
Other pertinent financial market indicators for EM credit spreads are commodities prices, EM exchange rates and EM local rates. The basis is as follows: (1) Energy and materials make up 25% of the J.P. CEMBI EM corporate bond index, and commodities prices drive their revenues and in turn credit spread fluctuations (Chart I-5, top panel); (2) Outside the resource sector, corporate bond issuers by and large do not feature exporters, and their capacity to service foreign currency debt is greatly affected by exchange rate movements (Chart I-5, bottom panel); (3) Financials make up 30% of the J.P. CEMBI EM corporate bond index, and their credit spreads are greatly influenced by domestic interest rates and banking system health (Chart I-6). We exclude financials from our corporate health analysis because their financial ratios differ vastly from those of non-financials. Chart I-5Drivers Of Credit Spreads: Commodities And Currencies
Drivers Of Credit Spreads: Commodities And Currencies
Drivers Of Credit Spreads: Commodities And Currencies
Chart I-6EM Bank Credit Spreads Will Widen If Local Bond Yields Rise
EM Bank Credit Spreads Will Widen If Local Bond Yields Rise
EM Bank Credit Spreads Will Widen If Local Bond Yields Rise
Overall, we expect global trade to weaken, commodities prices to drop further and EM currencies to depreciate. The latter will push up local interest rates. In turn, several EM banking systems remain saddled with bad assets from previous credit booms that have not been recognized, and banks have not been recapitalized. These factors point to a widening in bank credit spreads. All in all, EM corporate and sovereign spreads will widen further. A Snapshot Of EM Corporate Health The following financial ratios - which are calculated for EM companies excluding technology and financials - do not justify currently tight corporate spread. Leverage measured as net debt (total debt minus cash assets) divided either by EBITDA or cash flow from operation2 (CFO) remains elevated (Chart I-7, top panel). Among 9 sectors, only energy, basic materials and consumer discretionary have seen their leverage fall over the past two years. Chart I-7EM Corporate Health: Leverage And Interest Coverage Ratios
EM Corporate Health: Leverage And Interest Coverage Ratios
EM Corporate Health: Leverage And Interest Coverage Ratios
Interest coverage ratios computed as EBITDA- or CFO- to- interest expense are well below their 2007 and 2011 levels (Chart I-7, middle panel). These figures corroborate that neither EM corporate indebtedness nor companies' ability to service debt using cash from operations is back to levels that prevailed before the global financial crisis in 2008 when EM financial markets were in a secular uptrend. Crucially, this is inconsistent with presently still-tight EM corporate spreads (Chart I-7, bottom panel). This mispricing, in our opinion, reflects the global search for yield that was induced by the crowding out of investors from DM bond markets by global central banks' QE programs. A contraction in corporate profits and cash flows from operation - for the reasons discussed above - will cause issuers' credit matrixes to deteriorate. With respect to cross-sectional analysis, Table I-1 presents interest coverage ratios (computed as an average of EBITDA- and CFO-to-interest expense ratios) for mainstream countries and all sectors. The cells in red present pockets of distress where the interest coverage ratio is below 3. The cells in blue illustrate segments where moderate financial stress is present: these are sectors with an interest coverage ratio of above 3 but below 5.5. Table I-1Interest Coverage Ratios
EM Corporate Health And Credit Spreads
EM Corporate Health And Credit Spreads
On a positive note, the rally in commodities and cutbacks in capex have allowed energy and basic materials companies to drastically improve their leverage and interest coverage ratios in the past 2 years. However, even though their present financial health is great, their cash flow from operations is set to deteriorate again as commodities prices continue to relapse. The key motive behind our negative view on credit markets in Latin America, Russia, the Middle East and Africa - which is de facto the EM universe excluding emerging Asia - is because with the exception of Turkey, they are very exposed to commodities prices. As commodities prices drop and these nations' currencies depreciate, their sovereign and corporate credit spreads will widen. We are not implying that these issuers are facing default risks. Simply, lower revenues from commodities and higher debt servicing costs due to currency depreciation warrant a re-pricing of risk. Within credit portfolios, we recommend favoring defensive low-beta credit, excluding banks, versus riskier high-beta ones. We are underweight EM banks within the EM equity space and recommend the same strategy for the EM credit universe. Based on the matrix in Table I-1, credit portfolios should overweight consumer services, tech, energy and basic materials and underweight industrials, utilities and healthcare. China's Corporate Health And Credit Market There has been little deleveraging among Chinese companies. On the contrary, the country's massive credit and fiscal stimulus in 2016 bailed out many indebted companies, lifting corporate debt levels and augmenting the misallocation of capital. In particular: Chart I-8China's Corporate Debt Is Enormous
China's Corporate Debt Is Enormous
China's Corporate Debt Is Enormous
China's corporate debt remains enormous, at $19.5 trillion, or RMB 140 trillion. It is the highest in the history of any country (Chart I-8). Some 95% of corporate debt is in local currency terms. My colleague Jonathan LaBerge from China Investment Strategy has calculated that Chinese state-owned enterprises' adjusted return on assets, has fallen below the cost of capital (Chart I-9). This indicates that these companies have for now exhausted profitable investment opportunities and should arguably scale back on their investment expenditures. Further borrowing and investing by these enterprises will augment the amount of bad assets held by Chinese banks and reduce the country's overall productivity and hence, potential growth. Yet, denying these debtors financing will result in a major slump in capex, and probably labor market weakness. Chart I-9Chinese SOEs: Capital Misallocation
Chinese SOEs: Capital Misallocation
Chinese SOEs: Capital Misallocation
Chart I-10Leverage And Interest Coverage For Chinese Companies
Leverage And Interest Coverage For Chinese Companies
Leverage And Interest Coverage For Chinese Companies
Dissecting sectoral data, indebtedness is elevated for industrials, utilities and property developers. Consistently, the interest coverage ratio is extremely low for industrials, utilities and property developers (Chart I-10). Financial health of Chinese materials has improved tremendously due to de-capacity reforms - the shutdown of excess capacity that has boosted both steel and coal prices. Interestingly, this has occurred at the expense of utilities and some other heavy consumers of steel and coal. Notably, steel and coal prices are beginning to relapse (Chart I-11). For reasons discussed in our previous report,3 these commodities prices will drop further and will hurt producers' cash flow and profits, causing their creditworthiness to deteriorate. Chart I-11Steel And Thermal Coal Prices
Steel And Thermal Coal Prices
Steel And Thermal Coal Prices
Offshore corporate bond yields and spreads are surging, foreshadowing rising borrowing costs and reduced availability of financing (Chart I-12A). The problem is especially acute for property developers (Chart I-12B). In a nutshell, Chinese corporate U.S. dollar bond yields are at their highest levels of the past five-six years. The same is true for emerging Asian corporate bond issuers. Chart I-12AChinese Offshore Aggregate Corporate Bonds
Chinese Offshore Aggregate Corporate Bonds
Chinese Offshore Aggregate Corporate Bonds
Chart I-12BChinese Offshore Property Developers
Chinese Offshore Property Developers
Chinese Offshore Property Developers
Not only do Chinese corporate bonds now account for 32.5% of EM and 56% of emerging Asian corporate bond indexes, but investment expenditures by Chinese companies are also critical to companies elsewhere in Asia and globally. Chinese gross fixed capital formation accounts for 6% and 5.4% of global GDP in nominal and real terms, respectively. By contrast, these numbers are 4.6% and 4.3% for the U.S. We have deliberated at great length on why China's growth will likely continue to downshift, despite the policy stimulus, and we will not repeat our arguments today.4 The financial health of Chinese companies will worsen due to dwindling sales and cash generation. This, along with less credit/financing available onshore and offshore, will erode their capacity to undertake large investment expenditures. Consequently, capital expenditures in general and construction in particular will suffer substantially. This is the main rationale behind our negative view on resources, raw materials and industrials worldwide. Investment Observations And Conclusions Apart from Turkey and Argentina, there has been no liquidation and capitulation in EM assets in general and the credit space in particular. It would be unusual if this extended selloff ends without capitulation. EM credit markets appear technically vulnerable. In particular, the excess returns on EM sovereign and corporate bonds are splintering below their 200-day moving averages (Chart I-13). Odds are there will be more downside. Chart I-13A Bad Signal
A Bad Signal
A Bad Signal
Rising U.S. dollar corporate bond yields in both EM overall and in emerging Asia herald lower share prices (Chart I-14). So long as the drop in U.S. Treasury yields is offset by widening EM credit spreads, EM corporate bond yields will continue to rise and EM share prices will sell off. However, as and when EM corporate (or sovereign) yields start falling, irrespective of whether because of declining U.S. Treasury yields or narrowing EM credit spreads, EM equity prices will rally. EM sovereign and corporate bond yields are an imperative indicator to watch for equity investors. Chart I-14Rising Corporate Yields = Lower Share Prices
Rising Corporate Yields = Lower Share Prices
Rising Corporate Yields = Lower Share Prices
We continue to recommend defensive positioning in EM sovereign and corporate bonds. In terms of asset allocation, EM dollar-denominated sovereign and corporate bonds should not be compared with EM local currency bonds or equities or U.S. Treasurys.5 These are credit instruments, and they should be a part of a credit portfolio with U.S. and European corporate bonds. Credit portfolios should presently be underweight EM sovereign and corporate bonds relative to U.S. corporate bonds (Chart I-15A & Chart I-15B). Chart I-15AEM Sovereign Credit Versus U.S. Credit: Relative Excess Returns
EM Credit Versus U.S. Credit: Relative Excess Returns
EM Credit Versus U.S. Credit: Relative Excess Returns
Chart I-15BEM Corporate Credit Versus U.S. Credit: Relative Excess Returns
EM Credit Versus U.S. Credit: Relative Excess Returns
EM Credit Versus U.S. Credit: Relative Excess Returns
Arthur Budaghyan, Senior Vice President Emerging Markets Strategy arthurb@bcaresearch.com Andrija Vesic, Research Analyst andrijav@bcaresearch.com Mexico: Is The Underperformance Overdone? Despite having a sound macroeconomic backdrop,6 Mexican financial markets have lately substantially underperformed their emerging market peers due in large part to domestic politics. Odds are that Mexican risk assets will continue to sell off in absolute terms, especially given the broad turmoil in the EM universe, which we expect to continue. That said, the recent underperformance of Mexican markets versus their EM peers is overdone, and odds are that Mexican stocks, local bonds and sovereign credit will outperform their EM peers over the coming six to 12 months: First, the Mexican authorities have been pursuing orthodox macro policies, including very tight monetary and fiscal policies. The central bank hiked its policy rate again last week in the face of a currency relapse, and the fiscal stance has been tight. Currently, the real policy rate is 4% and the 10-year local currency government bond yield is 5.5%, both deflated by core consumer price inflation (Chart II-1, top and middle panel). Real rates are very high by historical standards and are now above most other EMs. Chart II-1Mexico: Tight Monetary And Fiscal Policies
Mexico: Tight Monetary And Fiscal Policies
Mexico: Tight Monetary And Fiscal Policies
The government's non-interest expenditures deflated by core consumer price inflation have been contracting (Chart II-1, bottom panel). Such a tight monetary and fiscal policy mix will not change considerably with AMLO taking the office and it should benefit the currency. We expect the peso to start outperforming its EM peers on a total-return basis. Second, the Mexican peso is very cheap - close to one standard deviation below fair value, according to the unit labor cost-based real effective exchange rate (Chart II-2). The latter is our favorite currency valuation measure. Chart II-2The Mexican Peso Is Cheap
The Mexican Peso Is Cheap
The Mexican Peso Is Cheap
Third, economic growth is improving, as the effects from monetary and fiscal tightening are diminishing (Chart II-3). This should at the margin support Mexican financial markets versus their EM peers where growth is slowing. Chart II-3Mexico: A Moderate Cyclical Recovery
Mexico: A Moderate Cyclical Recovery
Mexico: A Moderate Cyclical Recovery
Fourth, Mexico's business cycle is much more leveraged to the U.S. economy than to China's. In line with our view that U.S. growth will fare better than China's growth, the Mexican economy will likely outperform other EMs that are more leveraged to China. Finally, an important rationale behind our recommendation to maintain an overweight stance on Mexico is that Mexican risk assets are defensive plays within the broad EM universe. In other words, whenever there is broad EM turbulence and an ensuing flight to quality, Mexican risk assets tend to outperform their EM peers. This is even more likely to happen now that Mexican sovereign spreads are already elevated and local currency government bonds offer a very attractive yield relative to other EMs (Chart II-4). Chart II-4Mexican Domestic And U.S. Dollar Bonds Offer Value
Mexican Domestic And U.S. Dollar Bonds Offer Value
Mexican Domestic And U.S. Dollar Bonds Offer Value
Still, a few words are warranted on the recent domestic political developments. Our view is that the latest measures announced by the incoming administration regarding the new airport and banking fees are more indicative of a strategy to test the markets before the AMLO administration takes office, rather than declaring war against both markets and investors. It is noteworthy how fast the AMLO government came out after each of these announcements to calm investors. This suggests to us that fears of Mexico taking an irreversible sharp political turn to the left are overblown. AMLO is likely to be pragmatic and deliberate in the way he pushes forward his policies. In a nutshell, our bias is that these announcements represent an attempt by the AMLO administration to promote competition and reduce rent-seeking activities in the economy. This can be negative for shareholders of incumbent large companies, as it will hurt corporate profits of oligopolies. However, in the long term these polices will be positive for overall economic growth as they will reduce the cost of doing business, appease structural inflation and boost the nation's competitiveness. From a structural perspective, these policies are positive for the currency and local bonds. One way to play this theme is to favor small-cap over large-cap companies. Given the oligopolistic structure of some industries, Mexican large-cap companies are much more likely to be hurt by the incoming administration's open competition policies than small-cap companies. As such, small-caps will likely outperform large-caps in Mexico over at least the next six to 12 months (Chart II-5). Moreover, small-caps are currently trading at a significant discount compared to large-caps, with the former trading at multiples that are half of the latter. Chart II-5Mexico: Small-Caps Will Outperform Large-Caps
Mexico: Small-Caps Will Outperform Large-Caps
Mexico: Small-Caps Will Outperform Large-Caps
Investment Conclusion Dedicated EM investors should overweight Mexican equities, local currency bonds and sovereign credit within their respective universes. Concerning the exchange rate, we are maintaining our long MXN / short ZAR position. Stephan Gabillard, Senior Analyst stephang@bcaresearch.com Indonesia: Defying The Impossible Trinity? Indonesian stocks are attempting to rally and have lately outperformed the EM equity benchmark. The outlook for this bourse remains negative and we recommend investors to fade this rally and outperformance. Critically, Indonesian domestic interbank rates and corporate U.S. dollar bond yields are rising. Historically, this is a negative signal for share prices (Chart III-1, rates and yields are shown inverted). Chart III-1Rising Rates/Yields = Falling Stocks
Rising Rates/Yields = Falling Stocks
Rising Rates/Yields = Falling Stocks
Weakening rupiah and rising interest rates are forcing the central bank (BI) into a policy dilemma: Should it defend the currency and allow interest rates to rise further or should it cap interest rates and let the currency find a market equilibrium? It appears the BI is trying to do both - to stop the currency from depreciating, while also capping or bringing down interbank rates simultaneously. This defies the Impossible Trinity thesis which stipulates that a central bank of a country with an open capital account has to choose between controlling either the exchange rate or interest rates. On the surface, it would seem that the BI has been focused on targeting a stable rupiah. The monetary authorities have sold foreign exchange reserves (Chart III-2, top panel), and raised the key policy rate. Chart III-2Aggressive Monetary Policy Tightening...
Aggressive Monetary Policy Tightening...
Aggressive Monetary Policy Tightening...
Selling of foreign exchange reserves is a form of tightening as it drains the banking system's excess reserves at the central bank. Shrinking interbank liquidity, however, pushes up interbank rates and borrowing costs (Chart III-2, bottom panel). Higher borrowings costs not only make the currency more appealing to investors, but they also curb domestic demand and, thereby, improve the current account balance. This is an ultimate mechanism of how policy tightening leads to exchange rate stability. Yet the full picture of BI's policies is a lot murkier. While on the one hand, the central bank has sold its foreign exchange reserves and hiked policy rates to defend the rupiah, it has also offset some of the tightening by injecting local currency reserves into the banking system. Chart III-3 shows that the BI purchased/redeemed back central bank certificates from commercial banks, which has led to a sharp increase in commercial banks' excess reserves. Chart III-3... And Liquidity Injections By Central Bank
... And Liquidity Injections By Central Bank
... And Liquidity Injections By Central Bank
Central bank liquidity injections are akin to monetary easing aimed at capping or even bringing down interbank rates. Hence, they come as a contradiction to the central bank's restrictive policies. If the BI chooses to stabilize the rupiah, then interbank rates and borrowing costs in general will have to rise and the economy will take a hit. Corporate earnings will then contract which will be bearish for the equity market. If the central bank opts to cap interbank rates, it has to inject as much liquidity (excess reserves) into the banking system as required. In this scenario, the currency could depreciate triggering capital flight and selloffs in equity and local bond markets. The BI can continue the muddle-through policy - offsetting or sterilizing its foreign exchange interventions by turning the backdoor liquidity taps on. These injections of local currency liquidity into the banking system could encourage speculation against the rupiah and allow banks to lend more, maintaining robust imports and a large current account deficit. It is not certain, but if the market perceives that interest rates are lower than warranted, the currency could very well depreciate amid this policy mix. In this scenario, the result could be a mix of gradual currency depreciation and somewhat higher interest rates. Financial markets will still do poorly in dollar terms. Overall, odds are high that the rupiah will resume its depreciation and interest rates will move higher. Indonesia's balance of payment dynamics remain a risk to the exchange rate. The current account deficit is still large and exports are heading south (Chart III-4). Chart III-4Current Account Deficit Is Large
Current Account Deficit Is Large
Current Account Deficit Is Large
First, Chart III-5 illustrates that the sharp slowdown in the average manufacturing PMIs of Japan, Korea, Taiwan and Germany are pointing to an imminent contraction in Indonesian export volumes. Chart III-5Exports Are Heading South
Exports Are Heading South
Exports Are Heading South
Second, thermal coal prices seem to be breaking down. Chart III-6 shows that the stock price of Adaro - a large Indonesian coal producing company - has already fallen by 45% in U.S. dollar terms since January, and is heralding a dismal outlook for coal prices. Chart III-6Coal Prices Are To Break Down
Coal Prices Are To Break Down
Coal Prices Are To Break Down
Lower coal prices will shrink Indonesia's coal export revenues. The latter accounts for 12% of total Indonesian exports. In terms of the outlook for banks, which is a key equity sector, their share prices have been surprisingly resilient. Rising interest rates, however, will cause their NPLs to move higher hurting banks' profits, and pulling their share prices down (Chart III-7). Chart III-7Bank Stocks Are At Risk
Bank Stocks Are At Risk
Bank Stocks Are At Risk
Finally, overall Indonesian equity valuations are still not attractive either in absolute terms or relative to the EM benchmark. Meanwhile, foreigners own 32% of the equity market and 37% of local currency bonds. As the rupiah slides, foreigners will rush to the exits, amplifying the currency depreciation. Bottom Line: The path of least resistance for the rupiah is down. Continue underweighting Indonesian equities and bonds and continue shorting the rupiah versus the U.S. dollar. Ayman Kawtharani, Associate Editor ayman@bcaresearch.com Footnotes 1 Please see Emerging Markets Strategy Weekly Report, "On Domino Effects And Portfolio Outflows," dated November 15, 2018, available at ems.bcaresearch.com. 2 Cash flow from operations represents net cash flow from operating activities & excludes net cash flow financing and investing activities. 3 Please see China Investment Strategy Special Report, "Revisiting China's De-Capacity Reforms," dated October 17, 2018, available at cis.bcaresearch.com. 4 Please see Emerging Markets Strategy Weekly Report, "China: Stimulus, Deleveraging And Growth," dated October 25, 2018, available at ems.bcaresearch.com. 5 Please see Emering Markets Strategy Weekly Report, "Strategic Asset Allocation For Emerging Markets," dated May 7 2013, available at ems.bcaresearch.com. 6 Please see Emerging Markets Strategy Special Report, "A Mexican Standoff - Markets Vs. AMLO," dated June 28 2018, available at ems.bcaresearch.com. Equity Recommendations Fixed-Income, Credit And Currency Recommendations
Highlights Equities had a wild ride in October, ... : The S&P 500 has bounced smartly off of its October 29th lows, but the decline that preceded the bounce was unusually severe. ... that unsettled a lot of investors, and made us reconsider our constructive take on risk assets: To judge by the November 5th Barron's, and some client conversations, several technically-minded investors are unconvinced by the bounce. Nothing has changed with our equity downgrade checklist, however, ... : The fundamental picture hasn't changed at all - neither corporate revenues nor margins appear to be in any immediate difficulty; though we still expect inflation to surprise to the upside, the latest data will not push the Fed to speed up its gradual rate-hike pace; and the combination of blockbuster third-quarter earnings and October's selloff made valuations more reasonable. ... so we see no reason to downgrade equities now, though we do have the admonition of a Wall Street legend ringing in our ears: If the fundamental backdrop remained unchanged, we would be inclined to upgrade equities if the S&P 500 got back to the 2,600-2,640 range, even though we are operating with a heightened sense of vigilance befitting the lateness of the hour. Feature It has been just four weeks since we rolled out our equity downgrade checklist. We would not ordinarily devote an entire Weekly Report to reviewing all of its components, but the last four weeks have hardly been ordinary. The swiftness of the decline, and the apparent lateness of the cycle, have unsettled investors enough to make several of them reconsider just how long they want to stay at the bull-market party. At times when market action provokes emotional gut checks, it is essential for investors to have a process to fall back on. Process provides a rational, objective haven from noise and emotion, and should help foster better decision-making. Our commitment to process underpins our fondness for checklists. They will never be comprehensive - as usual, we have our minds on other important inputs - but they help to ground our thinking, and we're happy to have them when markets make wild swings. Has The Recession Timetable Speeded Up? We are not interested in recessions for their own sake - we'll let the NBER's Business Cycle Dating Committee tell us when recessions begin and end, several months after the fact - but they're poison for risk assets. Any asset allocator who can recognize them in a timely fashion has a leg up on outperforming the competition. We therefore have been repeatedly monitoring the individual components of our recession indicator (Table 1). They do not betray any more concern than they did four weeks ago. Table 1Equity Downgrade Checklist
Checking In On Our Equity Downgrade Checklist
Checking In On Our Equity Downgrade Checklist
The yield curve is clearly flattening, just as one would expect as the Fed gets further into a rate-hiking campaign, but it is still a comfortable distance from inverting (Chart 1). We think yields at the long end have a way to go before they stop rising, so we expect the fed funds rate will have to get well into the 3's before the 3-month bill rate can overtake the 10-year Treasury yield. The Conference Board's Leading Economic Indicator is still expanding at a robust clip (Chart 2). Finally, we estimate the fed funds rate is about a year away from exceeding the equilibrium rate, thus signaling that policy has turned restrictive. Chart 1The Yield Curve Is Flattening, But It's Not About To Invert ...
The Yield Curve Is Flattening, But It's Not About To Invert ...
The Yield Curve Is Flattening, But It's Not About To Invert ...
Chart 2... And Leading Economic Indicators Are Still Surging
... And Leading Economic Indicators Are Still Surging
... And Leading Economic Indicators Are Still Surging
The unemployment rate continues to fall. Reversing the trend so that the three-month moving average could back up by the third of a percentage point that has unfailingly accompanied recessions (Chart 3) would require net monthly payroll additions to crater. Assuming annual population growth of 1%, and a constant labor force participation rate, net monthly job gains would have to fall to 100,000 for the three-month moving average to back up to 4% in 2020; if the pace of gains merely held at 120,000, the unemployment recession signal wouldn't be issued until 2021 (Chart 4). We applied the same conditions to the Atlanta Fed's online unemployment calculator to see what it would take for the unemployment rate to cross into the danger zone in 2019 (Table 2). Since the seven-year trend of 200,000 monthly net payroll additions would have to reverse on a dime for unemployment to issue a near-term warning, we do not foresee checking this box anytime soon. Chart 3Investors Should Beware An Uptick In The Unemployment Rate ...
Investors Should Beware An Uptick In The Unemployment Rate ...
Investors Should Beware An Uptick In The Unemployment Rate ...
Chart 4... But None Is Forthcoming ...
... But None Is Forthcoming ...
... But None Is Forthcoming ...
Table 2... Unless Hiring Falls Off A Cliff
Checking In On Our Equity Downgrade Checklist
Checking In On Our Equity Downgrade Checklist
Are Corporate Earnings Coming Under Pressure? As we mentioned last week, we view the labor market as tight and getting tighter. We thereby expect that wages are on their way to rising enough to crimp corporate margins, albeit slowly. The composite employment cost index has been in an uptrend since 2016, but it ticked lower last month, and remains well below its cyclical highs ahead of the last two recessions (Chart 5). Chart 5Snails, Godot, Molasses And Wages
Snails, Godot, Molasses And Wages
Snails, Godot, Molasses And Wages
October's global upheaval was good for the safe-haven dollar, which surged to a new year-to-date high (Chart 6). The DXY dollar index is now within 3% of the 100 level that would lead us to check the dollar strength box. Even though we're not checking the box yet, the dollar's 10% advance since mid-February will exert a modest drag on S&P 500 earnings for the next few quarters. Triple-B corporate yields have ticked a little higher since we rolled out the checklist, extending their six-year highs (Chart 7), though we still view them as manageable. Chart 6A Gentle Headwind (For Now)
A Gentle Headwind (For Now)
A Gentle Headwind (For Now)
Chart 7Higher Yields Aren't Biting Yet
Higher Yields Aren't Biting Yet
Higher Yields Aren't Biting Yet
A rising savings rate would cancel out some of the top-line benefits from employment gains. It fell pretty sharply in the third quarter, however, amplifying the self-reinforcing effect of new hiring. It's at the bottom of the range that's prevailed since 2014 (Chart 8), but could go still lower if consumption tracks the robust consumer confidence readings, as it consistently has in the past. Chart 8Consumers Are Well-Fortified
Consumers Are Well-Fortified
Consumers Are Well-Fortified
EM economies have become considerably more indebted since the crisis, as developed-world savings sought an outlet; corporate profits are falling; and a stronger dollar makes it harder for EM borrowers to service their USD-denominated debt. A credit crisis (or multiple credit crises) could slow global activity enough to pressure multinationals' earnings, even if the U.S. economy is mostly insulated from EM wobbles. EM equities have gotten a respite since global equities put in their year-to-date lows, and Chinese stimulus could extend EM economies a lifeline, though BCA expects that Beijing will disappoint investors hoping for a meaningful boost. We remain bearish on emerging markets as a firm, but EM distress is not anywhere near acute enough to justify ticking the box. Is Inflation Starting To Make The Fed Uneasy? There are two channels by which inflation could pose a problem for equities. The first is the Fed: if it is discomfited by what it sees in realized inflation, or perceives that inflation expectations could become unanchored, it is likely to move forcefully to quash upward pressure on prices. A forceful pace is considerably faster than a gradual pace, and would bring forward a monetary policy inflection. If policy flips from accommodative to restrictive sooner than we expect, the window for risk-asset outperformance will shrink. With all of its talk about symmetric inflation targets, the FOMC has made it clear that it will not make any attempt to defend its 2% core PCE inflation target. It is comfortable with an overshoot, and has indeed openly wished for one for much of the post-crisis era. There are limits to its indulgence, however, and we suspect that the Fed would not be comfortable if core PCE inflation were to make a new 20-year high above 2.5%. With that red line far off (Chart 9), inflation is not yet likely to encourage the Fed to quicken the pace at which it removes accommodation. Chart 9Turtles, Sloths And Inflation
Turtles, Sloths And Inflation
Turtles, Sloths And Inflation
Inflation expectations aren't yet pressing the Fed to speed things up, either. Long-maturity TIPS break-evens have retreated slightly since mid-October, and have yet to enter the range consistent with the 2% inflation target (Chart 10). The media and the broad mass of investors don't bother with symmetric targets, or implied break-evens; they take their cues from consumer prices. A multiple haircut driven by popular inflation fears is the second channel by which inflation could halt the equity advance, but CPI remains well below the mid-3% levels that would provoke concern (Chart 11). Chart 10Stubbornly Well-Anchored
Stubbornly Well-Anchored
Stubbornly Well-Anchored
Chart 11No Reason To Trim Multiples Yet
No Reason To Trim Multiples Yet
No Reason To Trim Multiples Yet
So What's To Worry About? Irrational exuberance is always a concern after an extended period of gains, but there's no sign of it in broad market measures right now. Blockbuster earnings gains have pulled the S&P 500's forward P/E multiple back down to the 15s from its January peak above 18. Secondary measures like price-to-sales, price-to-book, and price-to-cash-flow are well below extreme levels in the aggregate. If the S&P 500 is going to get silly, it will have to surge first. That said, the latter stages of bull markets and expansions can be perilous, and we are on high alert. We continue to actively seek out any evidence that challenges our broadly constructive take on risk assets and the U.S. economy. Though we have yet to find anything compelling, an admonition from legendary technical analyst and strategist Bob Farrell has lodged in our mind. Rule number nine of Farrell's ten market rules to remember states, "When all the experts and forecasts agree - something else is going to happen." It's much more fun to bring novel views and analysis to our clients, but we don't get overly concerned about agreeing with investor consensus. It's inevitable that a lot of people will agree in the middle of extended cycles; we simply strive to be among the first to recognize the major macro inflection points and determine the optimal asset-allocation framework to benefit from them. We get a little antsy, though, when everyone knows that something is either certain to happen, or cannot happen by any stretch of the imagination. The near-unanimity with which the investment community believes that a recession cannot begin in 2019 is increasingly eating at us. We have been checking and re-checking the data, and checking and re-checking our colleagues' various models, in search of trouble, but to no avail. Even though recessions begin at economic peaks, and the economy nearly always appears to be in fine fettle when the downturn asserts itself, the sizable fiscal thrust on tap for 2019 seems to obviate the possibility of a contraction. When discussing potential risks in face-to-face meetings with clients this week, we most often cited trade tensions, as any material rollback of globalization would erode corporate profit margins and would strike at global trade, on which much of the rest of world's economies rely. A dramatic worsening of the trade picture is not our base case, but we do expect upside surprises in inflation, and an attendant upside surprise in the terminal fed funds rate. We have been considering that view mainly from the perspective of fixed-income positioning: underweight Treasuries and maintain below-benchmark duration. We also have been assuming that the FOMC would lift the fed funds rate to 3.5% at the end of 2019 via four quarter-point rate hikes, and possibly take it all the way to 4% in the first half of 2020. If it were to speed up its pace, and take the fed funds rate to 3.5% by the middle of next year, and 4% by the end, we believe financial conditions would tighten enough to choke off the expansion. Monetary policy impacts the economy with a lag, so a recession may still not begin until 2020 in that scenario, but we'd bet that an equity bear market would begin in 2019. Investment Implications Balanced investors should maintain at least an equal weight position in equities. Although our checklist is a downgrade checklist, we're alert to opportunities to upgrade as well as downgrade. As we first wrote one week before the October selloff ended, we would look to overweight equities if the S&P 500 were to dip back into the 2,600-2,640 range (Chart 12). If U.S. equities wobble again in line with our Global Investment Strategy team's MacroQuant model's near-term discomfort, investors may get another opportunity before the year is out. Chart 12Only One Chance To Upgrade So Far, But There May Be More
Only One Chance To Upgrade So Far, But There May Be More
Only One Chance To Upgrade So Far, But There May Be More
Doug Peta, Senior Vice President U.S. Investment Strategy dougp@bcaresearch.com
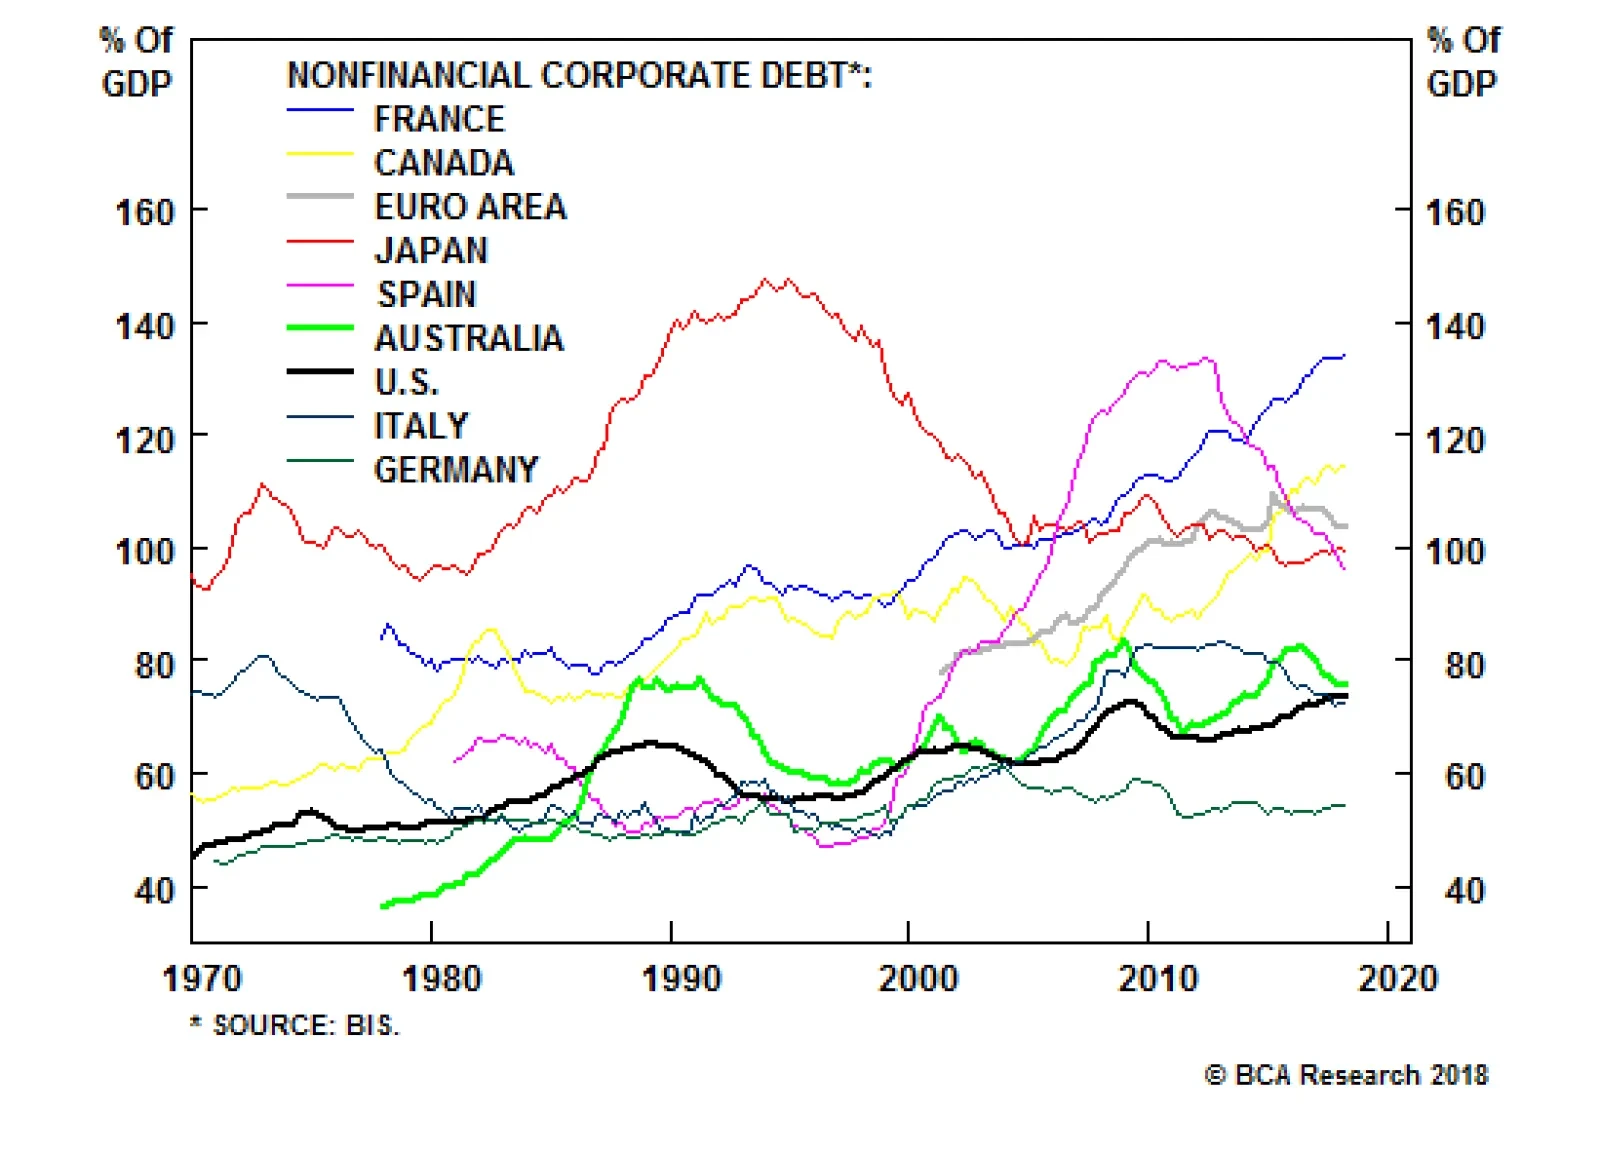
While the corporate debt market has become increasingly frothy, it does not pose an imminent danger to the economy. There are several reasons for this. First, while U.S. corporate debt is high in relation to the past, it is still quite low in comparison…
Highlights Investors are worrying too much about the things that caused the global financial crisis, and not enough about those that could cause the next downturn. Despite the recent patch of soft data, the U.S. housing market is in good shape. Go long homebuilders relative to the S&P 500. Imbalances in the corporate debt market have increased, but are not severe enough to generate systemic economic distress. U.S. rates will need to rise quite a bit more than the market anticipates before the economy slows by enough to force the Fed to back off. The combination of a stronger dollar and inadequate Chinese stimulus will continue to pressure emerging markets. Even Brazil's pro-capitalist new president may not be able to reverse the country's bleak fiscal dynamics. Our MacroQuant model, which predicted the correction, points to further near-term downside risk for global equities. The cyclical (12-to-18 month) outlook looks much better, however. Feature The Market's Maginot Line One of the most reliable ways to make money as an investor is to figure out the market's collective biases and trade against them. Behavioral economists have long noted that people tend to assign too much weight to recent experience in taking decisions. As a result, in finance, as in military strategy, there is a constant temptation to fight the last war. The last war policymakers waged was against the scourge of deflation that followed the housing bust and financial crisis. For much of the past decade, investors have held a magnifying glass over anything that could possibly resemble the conditions that led up to the Global Financial Crisis. While such behavior is understandable, it is misplaced. History suggests that both lenders and borrowers tend to act prudently for years, if not decades, following major financial crises. Mistakes are still made, but they are different mistakes. People overcompensate. They obsess about the past rather than focusing on the future. U.S. Housing Is Okay There is no denying that the U.S. housing market has softened this year (Chart 1). Housing starts, building permits, and home sales have all fallen. Residential investment has subtracted from GDP growth over three consecutive quarters. Chart 1Housing Has Been A Drag On The U.S. Economy This Year
Housing Has Been A Drag On The U.S. Economy This Year
Housing Has Been A Drag On The U.S. Economy This Year
There is little mystery as to why the housing market has been on the back foot. The Trump tax bill capped the deduction on state and local property taxes, while reducing the amount of mortgage debt on which homeowners can deduct interest payments from $1 million to $750,000. This had a negative effect on housing activity, especially in high-tax Democrat-leaning states with elevated real estate prices. More importantly, mortgage rates have risen by over 100 basis points since last August. Chart 2 shows that home sales and construction almost always decline after mortgage rates rise. In this respect, the weakness in housing activity is reminiscent of the period following the taper tantrum, when housing activity also slowed sharply. Chart 2No Mystery Why U.S. Housing Has Been Weak...
No Mystery Why U.S. Housing Has Been Weak...
No Mystery Why U.S. Housing Has Been Weak...
We do not expect mortgage rates to fall from current levels. But they are not going to rise at the same pace as they have over the past year. Thus, while the headwinds from higher financing costs will not disappear, they will abate to some extent. Fundamentally, the housing market is on solid ground (Chart 3). Mortgage rates are still well below their historic average. Home prices have risen considerably, but do not appear excessively stretched compared to rents or incomes. Unlike in 2006, the home vacancy rate is near its historic lows. Residential investment stands at only 3.9% of GDP, compared with a peak of 6.7% of GDP in the second half of 2005. The average age of the residential capital stock has risen by nearly five years since 2006, the largest increase since the Great Depression. With household formation rebounding briskly from its post-recession lows, homebuilders are still arguably not churning out enough new homes. Chart 3A...But Fundamentals Are Still In Good Shape (I)
...But Fundamentals Are Still In Good Shape (I)
...But Fundamentals Are Still In Good Shape (I)
Chart 3B...But Fundamentals Are Still In Good Shape (II)
...But Fundamentals Are Still In Good Shape (II)
...But Fundamentals Are Still In Good Shape (II)
Mortgage lenders have learned from past mistakes (Chart 4). While lending standards have eased modestly over the past 4 years, underwriting standards have remained high. The average FICO score for new borrowers is more than 40 points above pre-recession levels. The Urban Institute Housing Credit Availability index, which measures the percentage of home purchase loans that are likely to default over the next 90 days, is at reassuringly low levels. This is particularly the case for private-label mortgages, whose default risk has hovered at just over 2% during the past few years, down from a peak of 22% in 2006. Moreover, banks today hold much more high-quality capital than in the past, which gives them additional space to absorb losses (Chart 5). Chart 4Lending Standards Have Been Tight, But Are Starting To Loosen
Lending Standards Have Been Tight, But Are Starting To Loosen
Lending Standards Have Been Tight, But Are Starting To Loosen
Chart 5U.S. Banks Are Well Capitalized
U.S. Banks Are Well Capitalized
U.S. Banks Are Well Capitalized
With all this in mind, we are initiating a new strategic trade to go long U.S. homebuilders relative to the S&P 500.1 Corporate Debt: How Big Are The Risks? Unlike household debt, U.S. corporate debt has risen over the past decade and now stands at a record high level as a share of GDP. The quality of the lending has also been less than pristine, as evidenced by the proliferation of "covenant lite" loans. The interest coverage ratio for the economy as a whole - defined as the volume of profits corporations generate for every dollar of interest paid - is still above its historic average (Chart 6). However, this number is skewed by a few mega-cap tech companies that hold a lot of cash and have little debt. Chart 6Interest Coverage Looks Relatively High
Interest Coverage Looks Relatively High
Interest Coverage Looks Relatively High
My colleague Mark McClellan, who writes our monthly Bank Credit Analyst publication, has shown that the interest coverage ratio for companies comprising the Bloomberg Barclays index would drop close to the lows of the Great Recession if interest rates were to rise by a mere 100 basis points across the corporate curve. The damage would be far worse if profits also fell by 25% in this scenario.2 While the corporate debt market has become increasingly frothy, it does not pose an imminent danger to the economy. There are several reasons for this. First, while U.S. corporate debt is high in relation to the past, it is still quite low in comparison with many other economies (Chart 7). The ratio of corporate debt-to-GDP, for example, is 30 percentage points higher in the euro area. This suggests that U.S. businesses still have the "carrying capacity" to take on additional debt. Chart 7U.S. Corporate Debt Is Not That High By Global Standards
U.S. Corporate Debt Is Not That High By Global Standards
U.S. Corporate Debt Is Not That High By Global Standards
Second, the average maturity of U.S. corporate debt has risen over the past decade, with an increasing share of companies opting for fixed over floating-rate borrowings. This implies that it will take a while for the effect of higher rates to make their way through the system. Third, and perhaps most importantly, corporate bonds are generally held by non-leveraged investors such as pension funds, insurance companies, and ETFs. Bank loans account for only 18% of nonfinancial corporate-sector debt, down from 40% in 1980 (Chart 8). The share of leveraged loans held by banks has declined from about 25% a decade ago to less than 10% today. Chart 8Banks Have Reduced Their Exposure To The Corporate Sector
Banks Have Reduced Their Exposure To The Corporate Sector
Banks Have Reduced Their Exposure To The Corporate Sector
Tellingly, we already had a dress rehearsal for what a corporate debt scare might look like. Credit spreads spiked in 2015. Default rates rose, but the knock-on effects to the financial system were minimal (Chart 9). This suggests that corporate America could withstand quite a bit of monetary tightening without buckling under the pressure. Chart 9The 2015 Debt Scare Did Not Topple The Economy
The 2015 Debt Scare Did Not Topple The Economy
The 2015 Debt Scare Did Not Topple The Economy
Government Debt: No Worries... Yet If the risks posed by both the housing market and corporate debt market are contained, what about the risks posed by soaring government debt? The long-term fiscal outlook is certainly bleak, but the near-term risks are low.3 President Trump's tweets aside, the U.S. has an independent central bank which has been able to keep inflation expectations well anchored. The U.S. private sector is also running a financial surplus at the moment, meaning that it earns more than it spends (Chart 10). Not only does this make the economy more resilient, it also provides the government with additional savings with which to finance its fiscal deficit. Chart 10The U.S. Private Sector Is A Net Saver
The U.S. Private Sector Is A Net Saver
The U.S. Private Sector Is A Net Saver
The private sector's financial balance will deteriorate over the next two years as household savings decline and corporate investment rises. This will put upward pressure on Treasury yields. However, if rising yields are reflective of stronger aggregate demand, this is unlikely to derail the economy. When Things Break Recessions are usually caused when the Fed raises rates by enough to undermine spending on interest rate-sensitive purchases such as housing, or when higher rates prick an asset bubble just waiting to burst. Given the lack of clear imbalances either in the real economy or financial markets, the Fed may have to raise rates significantly more than the market is currently anticipating. In fact, far from having to press the pause button midway through next year, our baseline expectation is that the Fed will expedite the pace of rate hikes in late 2019 as inflation finally starts to accelerate. Aggressive Fed rate hikes combined with an incrementally less expansionary fiscal policy will sow the seeds of a recession in late 2020 or 2021. Before the next U.S. downturn arrives, the dollar will have strengthened further. A resurgent greenback will cast a long shadow over emerging markets and commodity producers. As we discussed last week, China is unlikely to save the day by launching a massive stimulus program of the sort that it orchestrated in both 2009 and 2015.4 True, not all emerging markets are equal. Emerging Asia is more resilient now than it was two decades ago. Thailand, for example, was patient zero for the Asian crisis in 1997. Today, it sports a current account surplus of over 10% of GDP and low levels of external debt. This resilience will not prevent Asian economies from experiencing slower growth on the back of weaker Chinese demand, but it will prevent a full-blown balance of payments crisis from spiraling out of control. In contrast to Emerging Asia, Latin America looks more vulnerable (Table 1). BCA's chief emerging market strategist, Arthur Budaghyan, wisely upgraded Brazilian assets on a tactical basis on October 9th ahead of the presidential elections. Nevertheless, Arthur still worries that Brazil's daunting fiscal challenges - the budget deficit currently stands at 7.8% of GDP and the IMF expects government debt to rise to nearly 100% of GDP over the next five years (Chart 11) - are so grave that even South America's answer to Donald Trump may not be able to save the Brazilian economy. Table 1Vulnerability Heat Map For Key EM Markets
Fighting The Last War
Fighting The Last War
Chart 11Brazil Is Fiscally Challenged
Brazil Is Fiscally Challenged
Brazil Is Fiscally Challenged
A Correction, Not A Bear Market The current market environment bears some similarities to the late 1990s. The Fed is tightening monetary policy in order to keep the domestic economy from overheating. The U.S. economy is responding to higher rates to some extent, but the main effects are being felt overseas. The Asian Crisis did not end the bull market in U.S. stocks, but it did generate a few nasty selloffs, the most notable being the 22% peak-to-trough decline in the S&P 500 between July 20 and October 8, 1998. We witnessed such a selloff this October. The bad news is that our MacroQuant model is pointing to additional equity weakness over the coming weeks (Chart 12). The model tends to downgrade stocks whenever growth is slipping, financial conditions are tightening, and sentiment is deteriorating from bullish levels. All three of these things are currently occurring. Chart 12MacroQuant* Model Suggests Caution Is Warranted
Fighting The Last War
Fighting The Last War
The good news is that none of our recession indicators are flashing red. Since recessions and bear markets typically overlap (Chart 13), the odds are high that the current stock market correction will be just that, a correction. Chart 13Recessions And Bear Markets Usually Overlap
Recessions And Bear Markets Usually Overlap
Recessions And Bear Markets Usually Overlap
Peter Berezin, Chief Global Strategist Global Investment Strategy peterb@bcaresearch.com 1 The corresponding ETFs are long ITB/short SPY. 2 Please see The Bank Credit Analyst Special Report, "The Long Shadow Of The Financial Crisis," dated October 25, 2018. 3 It is actually not even clear that a loss of confidence in America's fiscal management would cause a recession. The Fed largely determines borrowing costs at the short-to-medium end of the yield curve, which is where the government finances most of its debt. If people lose confidence in the dollar, they will either need to run down their cash balances by purchasing more goods and services or try to move their wealth abroad. The former will directly increase aggregate demand, while the latter will indirectly increase it through a weaker currency. To be clear, we are not suggesting that such an outcome would be beneficial to the economy; it would, among other things, greatly slow potential GDP growth by discouraging investment. But the near-term effect would likely be economic overheating and rising inflation rather than a recession. 4 Please see Global Investment Strategy Weekly Report, "Chinese Stimulus: Not So Stimulating," dated October 26, 2018. Strategy & Market Trends Tactical Trades Strategic Recommendations Closed Trades
Highlights So What? Go long Brent / short S&P 500. The risk of a recession in 2019 is underappreciated. Why? The likelihood is increasing of a geopolitically-induced supply-side shock that pushes crude prices above $100 per barrel in the coming 6-12 months. Oil supply disruptions in Iran, Iraq, and Venezuela represent the primary source of risk. Historically, the combination of Fed rates hike and an oil price spike has preceded 8 out of the last 9 recessions. Also... A recession in 2019, ahead of the 2020 election, would set the stage for a confrontation between Trump and the Fed, adding fuel to market volatility. Feature Geopolitical tensions are brewing from the Strait of Hormuz to the Strait of Malacca. As we go to press, news is breaking that a Chinese naval vessel almost collided with the USS Decatur as the latter conducted "freedom of navigation" operations within 12 nautical miles of Gaven and Johnson reefs in the Spratly Islands. Given the trade tensions between China and the U.S., this alleged maneuver by the Chinese vessel suggests that Beijing is not backing off from a confrontation. Our view remains that Sino-American trade tensions can get a lot worse before they get better. The latest incident, which builds on a series of negative gestures recently in the South China Sea, suggests that both sides are combining longstanding geopolitical tensions with the trade war. This will likely encourage brinkmanship and further degrade U.S.-China relations. Yet China-U.S. tensions are not the only concern for investors in 2019. Another crisis is brewing in the Middle East, with the potential to significantly increase oil prices over the next 12 months. U.S. households may have to deal with a double-whammy next year: higher costs of imported goods as the U.S.-China trade war rages on and a significant increase in gasoline prices. In this report, we discuss this dire outlook. The Folly Of Recession Forecasting In mid-2017, BCA Research published two reports, one titled "Beware The 2019 Trump Recession" and another titled "The Timing Of The Next Recession."1 Both argued that if the Federal Reserve kept raising rates in line with the FOMC dots, then monetary policy would move into restrictive territory by early 2019 and increase the likelihood of recession thereafter. We subsequently adjusted the timing of our recession forecast to 2020 or beyond, based on a more positive assessment of the U.S. economy. In this report, we explore a risk to the BCA House View on the timing of the next recession. As BCA's long-time Chief Economist Martin Barnes has said, predicting recessions is a mug's game. There have been eight recessions in the past 60 years (excluding the brief 1980-81 downturn) and the Fed failed to forecast all of them (Table 1). Table 1Fed Economic Forecasts Versus Outcomes
2019: The Geopolitical Recession?
2019: The Geopolitical Recession?
The Atlanta Fed produces a recession indicator index which is designed to highlight the odds of recession based on trends in recent GDP data. At the moment, the indicator is at a historically sanguine 2.4%. Unfortunately, low readings are not a reliable cause for optimism. The 1974-75, 1981-82, and 2007-09 recessions were all severe and the Atlanta Fed's recession indicator had a low reading of 10%, 1.6%, and 7.7%, respectively - just as the recession was about to begin (Chart 1). Chart 1The Market Is Not Expecting A Recession
The Market Is Not Expecting A Recession
The Market Is Not Expecting A Recession
The 1974-75 recession is instructive, given the numerous parallels with the current environment: Energy Geopolitics: The 1973 oil crisis caused a massive spike in crude prices. This point is especially pertinent since the 1973 oil embargo is widely viewed as an important contributor to the 1974-75 recession. Real short rates had risen and the yield curve had inverted long before oil prices spiked, so recession was almost inevitable even without the oil price move. But the oil spike made the recession much deeper than otherwise. Protectionism: President Nixon imposed a 10% across-the-board tariff on all imports into the U.S. in 1971 to try to force trade partners to devalue the U.S. dollar. Dislocation: Competition from newly industrialized countries - Japan and the East Asian tigers in particular - laid waste to the steel industry in the developed world. Polarization: President Nixon polarized the nation with both his policies and behavior, leading to his resignation in 1974. Given the exogenous and geopolitical nature of oil supply shocks, today's recession indicators are missing a critical potential headwind to the economy. A geopolitically induced oil-price shock could create more pain than the economy is able to handle. Why An Oil Price Shock? America's renewed foray into the politics of the Middle East will unravel the tenuous equilibrium that was just recently established between Iran and its regional rivals. The U.S.-Iran détente that produced the signing of the 2015 Joint Comprehensive Plan of Action (JCPA) created conditions for a precarious balance of power between Israel and Saudi Arabia on one side, and Iran and its allies on the other side. This equilibrium led to a meaningful change in Tehran's behavior, particularly on the following fronts: The Strait of Hormuz: Tehran ceased to rhetorically threaten the Strait as soon as negotiations began with the U.S. (Chart 2). Since then, Iran's capabilities to threaten the Strait have grown, while the West's anti-mine capabilities remain unchanged.2 Iraq: Iran directly participated in the anti-U.S. insurgency in Iraq. Tehran changed tack after 2013 and cooperated closely with the U.S. in the fight against the Islamic State. In 2014, Iran acquiesced to the removal of the deeply sectarian, and pro-Iranian, Prime Minister Nouri al-Maliki. Bahrain and the Saudi Eastern Province: Iran's material and rhetorical support was instrumental in the Shia uprisings in Bahrain and Saudi Arabia's Eastern Province in 2011 (Map 1). Saudi Arabia had to resort to military force to quell both. Since the détente with the U.S. in 2015, Iranian support for Shia uprisings in these critical areas of the Persian Gulf has stopped. Chart 2Geopolitical Crises And Global Peak Supply Losses
2019: The Geopolitical Recession?
2019: The Geopolitical Recession?
Map 1Saudi Arabia's Eastern Province Is A Crucial Piece Of Real Estate
2019: The Geopolitical Recession?
2019: The Geopolitical Recession?
Put simply, the 2015 nuclear deal traded American acquiescence toward Iranian nuclear development in exchange for Iran's cooperation on a number of strategically vital regional issues. By unraveling that détente, President Trump is upending the balance of power in the Middle East and increasing the probability that Iran retaliates. Since penning our latest net assessment of the U.S.-Iran tensions in May, Iran has already retaliated.3 Our checklist for "kinetic" conflict has now risen from zero to at least 15%, if not higher (Table 2). We expect the probability to rise once the U.S. starts implementing the oil embargo in November. This will dovetail our Iran-U.S. decision tree, which sets the subjective probability of kinetic action by the U.S. against Iran at a baseline of 20% (Diagram 1). Table 2Will The U.S. Attack Iran?
2019: The Geopolitical Recession?
2019: The Geopolitical Recession?
Diagram 1Iran-U.S. Tensions Decision Tree
2019: The Geopolitical Recession?
2019: The Geopolitical Recession?
Bottom Line: The premier geopolitical risk to investors in 2019 is that President Trump's maximum pressure tactic on Iran spills over into Iraq, causing a loss of supply from the world's fifth-largest crude producer.4 We expect the U.S. oil embargo against Iran to remove between 1 million and 1.5 million barrels per day from the market. In addition, the loss of Iraqi production due to sabotage could be anywhere between 500,000 and 3.5 million barrels per day. Added to this total is the potential loss of Venezuelan exports due to the deteriorating situation there. When our commodity team combines all of these factors, they generate a worst-case scenario where the price of crude rises to $110 per barrel in 2019 or higher (Chart 3). And this scenario assumes that EMs do not reinstitute energy subsidies (and therefore their consumption falls faster than if they do reinstitute them). Chart 3Worst-Case Scenario Propels Oil Price Toward 0/Barrel
Worst-Case Scenario Propels Oil Price Toward $110/Barrel
Worst-Case Scenario Propels Oil Price Toward $110/Barrel
The Ayatollah Recession We believe that the midterm election is a dud from an investment perspective, no matter the outcome. However, the election does matter as a hurdle that, once cleared, will allow President Trump to renew his "maximum pressure" tactic against China, Iran, and perhaps domestic tech corporations.5 Iran is a critical risk in this strategy. If President Trump applies maximum pressure on Iran, then a reduction in crude exports from Iran, Iranian retaliation in Iraq, and the simultaneous loss of Venezuelan supplies could combine to increase the likelihood of U.S. recession in 2019. Readers might recall that no sitting president has gotten re-elected during a recession. Why would Trump pursue a policy that risks his re-election chances in 2020? Surely he would deviate from his maximum pressure tactic if faced with the prospect of a recession. However, it is folly to assume that policymakers are perfectly rational, or fully informed. American presidents are some of the most unconstrained policymakers in the world, given both the hard power of the United States and the constitutional lack of constraints on the president when it comes to national security. Trump may believe, for instance, that the 660 million barrels of crude in America's Strategic Petroleum Reserve can offset the impact of sanctions against Iran.6 Or he may believe that he can force OPEC to supply enough oil to offset the Iranian losses. The problem for President Trump is that Iran is not led by idiots. Iranian policymakers understand that the best way to reduce American pressure is to induce an oil price spike in the summer of 2019 that hurts President Trump's re-election chances, forcing him to back off. As such, sabotaging Iraqi oil exports, which mainly transit through the port of Basra - a city highly vulnerable to Shia-on-Shia violence that is already a risk to the country's stability - would be an obvious target. An oil price spike would serve as a negotiating tool against the U.S., and the additional revenue would help replace what Iran loses due to the embargo. Tehran and Washington will therefore play a game of chicken throughout 2019, and there is a fair probability that neither side will swerve. President Trump may be making the same mistake as many predecessors have made, assuming that the Iranian regime is teetering at a precipice and that a mere nudge will force the leadership to negotiate. Oil price shocks and recessions have a historical connection. In a recent report, our commodity strategists highlighted that a spike in oil prices preceded 10 out of the past 11 recessions in the U.S. since 1945 (Table 3). Admittedly, not all spikes were followed by recession. The combination of an oil price spike and Fed rate hikes has produced a recession 8 out of 9 times.7 If oil prices rose to $100 per barrel in the coming 6-12 months, there will be several negative macro consequences. In particular, gasoline prices will rise back toward $4 per gallon (Chart 4). Retail gasoline prices have already increased by more than 50% since they bottomed in February 2016. So how much more upside can the U.S. private sector take? Table 3History Of Oil Supply Shocks
2019: The Geopolitical Recession?
2019: The Geopolitical Recession?
Chart 4A Source Of Pressure For Consumers
A Source Of Pressure For Consumers
A Source Of Pressure For Consumers
The Household Sector Consumer confidence is currently near all-time highs, which tends to signal that the path of least resistance is flat or down (Chart 5). Household gasoline consumption has already declined in response to higher oil prices since the middle of 2017. Given that gasoline demand is relatively inelastic, consumers may already be near their minimum consumption level. Chart 5Nearing All-Time Highs
Nearing All-Time Highs
Nearing All-Time Highs
Instead, households will experience a decline in their disposable income. This will come on the back of both higher gasoline prices and an increase in the prices of other goods and services, as the oil spike spills across sectors. U.S. households - and most likely those in other markets - are stretched to the limit already. A recent Fed survey found that 40% of U.S. households do not have the funds needed to meet an unexpected $400 cost in any given month.8 Such an unexpected expense would require them to either sell possessions, borrow, or cut back on other purchases. Chart 6Most Americans Cannot Cut Saving To Spend
Most Americans Cannot Cut Saving To Spend
Most Americans Cannot Cut Saving To Spend
Left with few other options, households would react to their lower disposable income by reducing demand for other goods and services. This dent in consumer spending would bring down aggregate demand, leading to slower employment growth and even less income and spending. Households could save less to maintain their current purchasing levels, given the recent rise in the savings rate (Chart 6). But this is unlikely. Although the household savings rate has increased in recent years, we have previously argued that a material part of the increase was driven by small business-owner profits. These owners have much higher levels of income than the median consumer. For Americans living paycheck-to-paycheck, it would be difficult to reduce a savings rate that is already close to, or below, zero. Higher oil prices will also hurt growth in Europe and Japan, economies that are already struggling to gain economic momentum after grappling with a weaker growth impulse from China. In addition, EM economies that took the opportunity to reform their oil subsidies amid lower oil prices post-2014 will have to grapple with a much larger shock to consumers than usual. The Corporate Sector In theory, what consumers lose from rising oil prices, producers of crude can gain in stronger revenue. This is especially important in the U.S. as domestic energy production has increased significantly over the past 10 years. Nonetheless, the oil and gas extraction sector accounts for just 1.1% of GDP and 0.1% of total employment. The marginal propensity to spend out of every dollar of income is lower for producers than consumers. Moreover, if consumer confidence fell and consumer spending weakened, non-energy capex would decline as businesses reassessed household demand and held off from making investment decisions. Small business confidence is at record highs, and as with consumer confidence, vulnerable to downward revisions (Chart 7). Chart 7Dizzying Heights
Dizzying Heights
Dizzying Heights
Chart 8Only One Way To Go (Down)
Only One Way To Go (Down)
Only One Way To Go (Down)
Profit margins remain at a highly elevated level and also have only one way to go (Chart 8). If high oil prices should combine with rising borrowing costs and upward pressure on wages (which could develop in this macro environment) the result would be a triple hit to margins (Chart 9). Of course, rising wages would give consumers some offset to higher oil prices, so the question will be the net effect of all variables. And if the dollar bull market continues, as our FX team believes it will, the combination of higher oil prices and a strong USD would hurt U.S. companies with international exposure. The debt load held by the U.S. corporate sector would turn this bad dream into a nightmare. Many American companies have spent the past 10 years increasing leverage to buy back equity (Chart 10). Companies with high debt would need to revise down their profit expectations, with potentially devastating consequences. Elevated debt levels also increase the likelihood of financial market stress if bond investors get worried and spreads begin to widen significantly. Chart 9Rising Pressures On Earnings?
Rising Cost Pressures On Earnings
Rising Cost Pressures On Earnings
Chart 10Large Corporate Debts
Large Corporate Debts
Large Corporate Debts
According to all measures, U.S. stocks are at or near their all-time valuation peaks. Investors have also priced in a significant amount of optimism for profit growth (Chart 11). These expectations would be subject to quick revision if our oil shock scenario plays out. In other words, investor expectations for profit margins are not sufficiently factoring the triple hit of higher oil prices, higher interest rates, and higher wages. Chart 11The Market Has High Hopes
The Market Has High Hopes
The Market Has High Hopes
An additional geopolitical risk on the horizon for 2019 is the creeping "stroke of pen" risk from potential regulation of technology enterprises. This is unrelated to an oil price spike (other than that it would be an effect of U.S. policy) but could nonetheless combine with rising energy prices to sour investors' mood.9 Bottom Line: An oil price spike above $100 would produce negative consequences for the U.S. household and corporate sectors. Given the supply-side nature of the price shock, it would not be accompanied by the usual decline in USD, and could therefore hurt the foreign profits of U.S. corporations as well. If investors must also deal with mounting regulatory pressures on FAANG stocks, they could face a perfect storm. Given the high probability of such an oil price shock, why isn't a 2019 recession BCA's House View, rather than merely a risk to it? Because it is difficult to say how high oil prices need to rise to cause a recession. For example, 1973 both marked a permanent move up in oil prices and saw oil prices triple. In 2019 terms, that would mean an oil price above $200, a far less probable scenario than $100-$110. Nevertheless, the combination of elevated oil prices and the price impact on consumer goods of the U.S.-China trade war could combine to create a nightmare scenario for consumers. But it is impossible to gauge the level of both required to push the U.S. into a recession. Second, there are many ways in which today's macro environment is different from that in 1974. In the 1970s the inventory cycle was a key factor in the business cycle, with excesses building up ahead of recessions, forcing output cutbacks as demand weakened. That is no longer the case in today's world of just-in-time inventory management. Also, inflation was a much bigger problem back then, requiring tougher Fed action. On the other hand, debt burdens were much lower. Investment Implications To be clear, none of the usual recession indicators that BCA Research uses are flashing red at this time. The point of this analysis is to illustrate a credible, exogenous scenario that cannot be revealed through the usual data-driven recession forecasting methods. What happens if a recession does occur ahead of the 2020 election? How would President Trump react to a recession induced by his foreign policy adventurism in the Middle East? By doing what every other president would do: finding someone else to blame. In this case, we would put high odds on the Federal Reserve becoming the target of President Trump's fury. Ahead of 2020, the Fed and its independence may very well become an election issue.10 This could spell serious trouble for the Fed, which is at a massive disadvantage when it comes to explaining to voters why central bank independence is so important. The Fed had great difficulty managing public opinion regarding its extraordinary measures to combat the Great Recession - its attempts at public outreach largely failed. Compare the number of Trump's Twitter followers to that of the Fed's (Chart 12). Chart 12The Fed's PR Abilities Are Limited
2019: The Geopolitical Recession?
2019: The Geopolitical Recession?
Though most of our clients and colleagues will probably disagree, we do not see central bank independence as a static quality. It was bestowed upon central banks by politicians following widespread inflation fears throughout the 1970s and 1980s, although in the U.S. the current tradition goes back to the 1951 Treasury Accord that restored the independence of the Fed. Our colleague Martin Barnes penned a report on the politicization of monetary policy in 2013.11 His conclusion is that political meddling in monetary affairs is less pernicious than economic performance. The Fed will incur Trump's ire, in other words, but it will be its failure to generate economic growth that causes a break in independence. We are not so sure. The next recession is likely to be a mild one for Main Street given the lack of real economic bubbles. But given the slow recovery in real wages over the past decade and the general angst of the populace towards governing elites, even a mild recession that merely reminds voters of 2008-2009 could produce deep anxiety and significant public reactions. Further, the idea of "independent," non-politically accountable institutions is going out of style. President Trump - and other policymakers in the developed world - have specifically targeted the "so-called experts" and "institutions." President Trump has attacked America's foreign policy architecture, NATO, the WTO, and a slew of supposedly outdated norms and practices for being "out of touch" with the electorate. This policy has served him well thus far. If our nightmare scenario of an oil price-induced recession plays out, the immediate implication for investors will be a sharp downturn in risk assets. As such, we are recommending that investors hedge their portfolios with a long Brent / short S&P 500 trade. Alternatively we would recommend going long U.S. energy / short technology stocks. A longer-term, and perhaps even more pernicious implication, would be the end of the era of central bank independence and a full politicization of the economy. Laissez-faire capitalist system would give way to dirigisme. In the process, the U.S. dollar and Treasuries would be doomed. Jim Mylonas, Global Strategist Daily Insights & BCA Academy jim@bcaresearch.com Marko Papic, Senior Vice President Chief Geopolitical Strategist marko@bcaresearch.com 1 Please see BCA Research Special Report, "Beware The 2019 Trump Recession," dated March 7, 2017, and Global Investment Strategy Weekly Report, "The Timing Of The Next Recession," dated June 16, 2017, available at gis.bcaresearch.com. 2 Please see BCA Research Geopolitical Strategy and Commodity & Energy Strategy Special Report, "U.S., OPEC Talk Oil Prices Down; Gulf Tensions Could Become Kinetic," dated July 19, 2018, available at gps.bcaresearch.com. 3 Please see BCA Research Geopolitical Strategy Special Report, "Why Conflict With Iran Is A Big Deal - And Why Iraq Is The Prize," dated May 30, 2018, available at gps.bcaresearch.com. 4 Please see BCA Geopolitical Strategy Weekly Report, "Fade The Midterms, Not Iraq Or Brexit," dated September 12, 2018 and "Iraq: The Fulcrum Of Middle East Geopolitics And Global Oil Supply," dated September 5, 2018, available at gps.bcaresearch.com. 5 Please see BCA Research Geopolitical Strategy Weekly Report, "A Story Told Through Charts: The U.S. Midterm Election," dated September 19, 2018, available at gps.bcaresearch.com. 6 The Strategic Petroleum Reserve currently covers 100 days of net crude imports, or 200 days of net petroleum imports, and can be tapped for reasons of political timing as well as international emergencies. 7 Please see BCA Commodity & Energy Strategy Weekly Report, "Oil-Supply Shock, Rising U.S. Rates Favor Gold As A Portfolio Hedge," dated September 13, 2018, available at bcaresearch.com. 8 Please see the U.S. Federal Reserve, "Report on the Economic Well-Being of U.S. Households in 2017," May 2018, available at federalreserve.gov. 9 Please see BCA Geopolitical Strategy and U.S. Equity Strategy Special Report, "Is The Stock Rally Long In The FAANG?" dated August 1, 2018, available at gps.bcaresearch.com. 10 Please see BCA Daily Insights, "Politics And Monetary Policy," dated August 22, 2018, and "The Battle Of The Press Conferences: Trump Versus Powell," dated September 27, 2018, available at dailyinsights.bcaresearch.com. 11 Please see BCA Special Report, "The Politicization Of Monetary Policy: Should We Care?" dated April 15, 2013, available at bca.bcaresearch.com. Geopolitical Calendar
Highlights Macro outlook: Global growth will continue to decelerate into early next year on the back of brewing EM stresses and an underwhelming policy response from China. Equities: Stay neutral for now, while underweighting EM relative to DM stocks. Within DM, overweight the U.S. in dollar terms. Bonds: Global bond yields may dip in the near term, but the longer-term path is firmly higher. Currencies: The dollar is working off overbought conditions, but will rebound into year-end. EM currencies will suffer the most. Commodities: Favor oil over industrial metals. Precious metals will also remain under pressure until the dollar peaks next year, before beginning a major bull run as inflation accelerates. Feature I. Economic Outlook The Fed Can Hike A Lot More If 2017 was the year of a synchronized global growth recovery, 2018 is turning out to be a year where desynchronization is once again the name of the game. The U.S. economy continues to fire on all cylinders, while much of the rest of the world is struggling to stay afloat. The divergence in economic outcomes has been mirrored in central bank policy. The Fed is now hiking rates once per quarter whereas most other major central banks are still sitting on their hands. How high can U.S. rates go? The answer is a lot higher than investors anticipate. Market participants currently expect the Fed funds rate to rise to 2.37% by the end of this year and 2.84% by the end of 2019. No rate hikes are priced in for 2020 and beyond. The Fed dots are somewhat higher than market expectations (Chart I-1). The median dot rises to about 3.4% in 2020-21, but then falls back to 3% over the Fed's longer-run horizon. Both investors and the Fed have apparently bought into Larry Summers' secular stagnation thesis. They seem convinced that rates will not be able to rise above 3% without triggering a recession. While we have a lot of sympathy for Summers' thesis, it must be acknowledged that it is a theory about the long-term determinants of the neutral rate of interest. Over a shorter-term cyclical horizon, many factors can influence the neutral rate. Critically, most of these factors are pushing it higher: Fiscal policy is extremely stimulative. The IMF estimates that the U.S. cyclically-adjusted budget deficit will reach 6.8% of GDP in 2019. In contrast, the euro area is projected to run a deficit of only 0.8% of GDP (Chart I-2). The relatively more expansionary nature of U.S. fiscal policy is one key reason why the Fed can raise rates while the ECB cannot. Chart I-1Markets Expect No Fed Hikes Beyond Next Year
October 2018
October 2018
Chart I-2Fiscal Policy Is More Expansionary In ##br##The U.S. Than In The Euro Area
Fiscal Policy Is More Expansionary In The U.S. Than In The Euro Area
Fiscal Policy Is More Expansionary In The U.S. Than In The Euro Area
Credit growth has picked up. After a prolonged deleveraging cycle, private-sector nonfinancial debt is increasing faster than GDP (Chart I-3). The recent easing in The Conference Board's Leading Credit Index suggests that this trend will continue (Chart I-4). Chart I-3U.S. Private-Sector Nonfinancial Debt Is ##br##Rising At Close To Its Historic Trend
U.S. Private-Sector Nonfinancial Debt Is Rising At Close To Its Historic Trend
U.S. Private-Sector Nonfinancial Debt Is Rising At Close To Its Historic Trend
Chart I-4U.S. Credit Growth Will Remain Strong
U.S. Credit Growth Will Remain Strong
U.S. Credit Growth Will Remain Strong
Wage growth is accelerating. Average hourly earnings surprised on the upside in August, with the year-over-year change rising to a cycle high of 2.9%. This followed a stronger reading in the Employment Cost Index in the second quarter. A simple correlation with the quits rate suggests that there is plenty of upside for wage growth (Chart I-5). Faster wage growth will put more money into workers' pockets who will then spend it. The savings rate has scope to fall. The personal savings rate currently stands at 6.7%, more than two percentage points higher than what one would expect based on the current level of household net worth (Chart I-6). If the savings rate were to fall by two points over the next two years, it would add 1.5% of GDP to aggregate demand. Chart I-5The Quits Rate Is Signaling Upside For Wage Growth
The Quits Rate Is Signaling Upside For Wage Growth
The Quits Rate Is Signaling Upside For Wage Growth
Chart I-6The Personal Savings Rate Has Room To Fall
October 2018
October 2018
A back-of-the-envelope calculation suggests that these cyclical factors will permit the Fed to raise rates to 5% by 2020, almost double what the market is discounting.1 An Absence Of Major Financial Imbalances Will Allow The Fed To Keep Raising Rates The past three recessions were all caused by financial market overheating rather than economic overheating. The 1991 recession was mainly the consequence of the Savings and Loan crisis, compounded by the spike in oil prices leading up to the Gulf War. The 2001 recession stemmed from the dotcom bust. The Great Recession was triggered by the housing bust. Today, it is difficult to point to any clear imbalances in the economy. True, housing activity has been weak for much of the year. However, unlike in 2006, the home vacancy rate stands near record-low levels (Chart I-7). Tight supply will limit downside risks to both construction and home prices. On the demand side, low unemployment, high consumer confidence, and a rebound in the rate of new household formation should help the sector. Despite elevated home prices in some markets, the average monthly payment that homeowners must make to service their mortgage is quite low by historic standards (Chart I-8). The quality of mortgage lending has also been very high over the past decade, which reduces the risk of a sudden credit crunch (Chart I-9). Chart I-7Low Housing Inventories Will Support ##br##Home Prices And Construction
Low Housing Inventories Will Support Home Prices And Construction
Low Housing Inventories Will Support Home Prices And Construction
Chart I-8Housing Affordabiity Is Not Yet Stretched
Housing Affordabiity Is Not Yet Stretched
Housing Affordabiity Is Not Yet Stretched
Chart I-9Mortgage Lenders Are Being Prudent
Mortgage Lenders Are Being Prudent
Mortgage Lenders Are Being Prudent
Unlike housing debt, there are more reasons to be concerned about corporate debt. The ratio of corporate debt-to-GDP has risen to record-high levels. So-called "covenant-lite" loans now make up the bulk of corporate leveraged loan issuance. While there is no doubt that the corporate debt market is the weakest link in the U.S. financial sector, some perspective is in order. U.S. corporate debt levels are quite low by global standards. Corporate debt in the euro area is more than 30 points higher as a percent of GDP than in the United States (Chart I-10). Moreover, the interest coverage ratio - EBIT divided by interest expense - for U.S. corporates is still above its historic average (Chart I-11). While this ratio will fall as interest rates rise, this will not happen very quickly. Most U.S. corporate debt is at fixed rates and average maturities have been rising. This reduces both rollover risk and the sensitivity of debt-servicing costs to higher short-term rates. Chart I-10U.S. Corporate Debt Not That High By Global Standards
U.S. Corporate Debt Not That High By Global Standards
U.S. Corporate Debt Not That High By Global Standards
Chart I-11Interest Coverage Ratio Is Above Its Historic Average
Interest Coverage Ratio Is Above Its Historic Average
Interest Coverage Ratio Is Above Its Historic Average
An increasing share of U.S. corporate debt is held by non-leveraged investors. Bank loans account for only 18% of nonfinancial corporate sector debt, down from 40% in 1980 (Chart I-12). This is important, because what makes a spike in corporate defaults so damaging is not the direct impact this has on the economy, but the second-round effects rising defaults have on financial sector stability. In any case, we already had a dress rehearsal for what a corporate debt scare might look like. Credit spreads spiked in 2015. Default rates rose, but the knock-on effects to the financial system were minimal. This suggests that corporate America could handle a fair bit of monetary tightening without buckling under the pressure. The Fed And The Dollar If the Fed is able to raise rates substantially more than the market is discounting while most central banks cannot, the short-term interest rate spread between the U.S. and its trading partners is likely to widen. History suggests that this will produce a stronger dollar (Chart I-13). Chart I-12Banks Have Been Reducing Their ##br##Exposure To The Corporate Sector
Banks Have Been Reducing Their Exposure To The Corporate Sector
Banks Have Been Reducing Their Exposure To The Corporate Sector
Chart I-13Historically, The Dollar Has Moved ##br##In Line With Interest Rate Differentials
Historically, The Dollar Has Moved In Line With Interest Rate Differentials
Historically, The Dollar Has Moved In Line With Interest Rate Differentials
Some have speculated that the Trump administration will intervene in the foreign-exchange market in order to drive down the value of the greenback. We doubt this will happen, but even if such interventions were to occur, they would not be successful. Presumably, currency interventions would take the form of purchases of foreign exchange, financed through the issuance of Treasurys. The purchase of foreign currency would release U.S. dollars into the financial system, but the sale of Treasury securities would suck those dollars back out of the system. The net result would be no change in the volume of U.S. dollars in circulation - what economists call a "sterilized" intervention. Both economic theory and years of history show that sterilized interventions do not have lasting effects on currency values. The Fed could, of course, provide funding for the Treasury's purchases of foreign exchange, leading to an increase in the monetary base. This would be tantamount to an unsterilized intervention. However, such a deliberate attempt to weaken the dollar by expanding the money supply would fly in the face of the Fed's efforts to cool growth by tightening financial conditions. We highly doubt the Fed's current leadership would go along with this. Emerging Markets In The Crosshairs The combination of rising U.S. rates and a stronger dollar is bad news for emerging markets. Eighty percent of EM foreign-currency debt is denominated in dollars. Outside of China, EM dollar debt is now back to late-1990s levels, both as a share of GDP and exports (Chart I-14). The wave of EM local-currency debt issued in recent years only complicates matters. If EM central banks raise rates to defend their currencies, this could imperil economic growth and make it difficult for local-currency borrowers to pay back their loans. Rather than hiking rates, some EM central banks may simply choose to inflate away debt. Consider the case of Brazil. The fiscal deficit stands at nearly 8% of GDP and government debt has soared from 60% of GDP in 2013 to 84% of GDP at present (Chart I-15). Ninety percent of Brazilian sovereign debt is denominated in reais. The Brazilian government won't default on its debt per se. However, if push comes to shove, Brazil's central bank can always step in to buy government bonds, effectively monetizing the fiscal deficit. This could cause the real to weaken much more than it already has. Chart I-14EM Dollar Debt Is High
EM Dollar Debt Is High
EM Dollar Debt Is High
Chart I-15Brazil's Perilous Fiscal Position
Brazil's Perilous Fiscal Position
Brazil's Perilous Fiscal Position
Chinese Stimulus To The Rescue? When emerging markets last succumbed to pressure in 2015, China saved the day by stepping in with massive stimulus. Fiscal spending and credit growth accelerated to over 15% year-over-year. The government's actions boosted demand for all sorts of industrial commodities. The stimulus measures in 2015 followed an even greater wave of stimulus in 2009. While these stimulus measures invigorated China's economy and helped put a floor under global growth, they came at a price: China's debt-to-GDP ratio has swollen from 140% in 2008 to over 250% at present, which has endangered financial stability (Chart I-16). Excess capacity has also increased. This can be seen in the dramatic rise in the capital-to-output ratio. It can also be seen in the fact that the rate of return on assets within the Chinese state-owned enterprise sector, which has been the main source of rising corporate leverage, has fallen below borrowing costs (Chart I-17). Chart I-16China: Debt And Capital ##br##Accumulation Went Hand In Hand
China: Debt And Capital Accumulation Went Hand In Hand
China: Debt And Capital Accumulation Went Hand In Hand
Chart I-17China: Rate Of Return On Assets ##br##Below Borrowing Costs For SOEs
China: Rate Of Return On Assets Below Borrowing Costs For SOEs
China: Rate Of Return On Assets Below Borrowing Costs For SOEs
Chinese banks are being told that they must lend more money to support the economy, while ensuring that their loans do not turn sour. Unfortunately, that is becoming an impossible feat. Chart I-18China Saves A Lot
China Saves A Lot
China Saves A Lot
The Chinese economy produces too much and spends too little. The result is excess savings, epitomized most clearly in a national savings rate of 46% (Chart I-18). As a matter of arithmetic, national savings must be transformed either into domestic investment or exported abroad via a current account surplus. Now that the former strategy has run into diminishing returns, the Chinese authorities will need to concentrate on the latter. This will require a larger current account surplus which, in turn, will necessitate a relatively cheap currency. Above-average productivity growth has pushed up the fair value of China's real exchange rate over time. However, the currency still looks expensive relative to its long-term trend line (Chart I-19). Pushing down the value of the yuan against the dollar will not be that difficult. Chart I-20 shows that USD/CNY has moved broadly in line with the one-year swap spread between the U.S. and China. The spread was about 3% earlier this year. Today, it stands at only 0.6%. As the Fed continues to raise rates, the spread will narrow further, taking the yuan down with it. Chart I-19The RMB Is Still Quite Strong
The RMB Is Still Quite Strong
The RMB Is Still Quite Strong
Chart I-20USD/CNY Has Tracked China-U.S. Interest Rate Differentials
USD/CNY Has Tracked China-U.S. Interest Rate Differentials
USD/CNY Has Tracked China-U.S. Interest Rate Differentials
Unlike standard Chinese fiscal/credit easing, a stimulus strategy focused on weakening the yuan would hurt other emerging markets by undermining their competitiveness in relation to China. A weaker yuan would also make it more expensive for Chinese companies to import natural resources, thus putting downward pressure on commodity prices. The Euro Area: Back In The Slow Lane After putting in a strong performance in 2017, the economy in the euro area has struggled to maintain momentum this year. Growth is still above trend, but the overall tone of the data has been lackluster at best, with the risks to growth increasingly tilted to the downside. Weaker growth in China and other emerging markets certainly has not helped. However, much of the problem lies closer to home. Bank credit remains the lifeblood of the euro area economy. The 12-month credit impulse - defined as the change in credit growth from one 12-month period to the next - tends to track GDP growth (Chart I-21).2 Euro area credit growth accelerated over the course of 2017, but has been broadly stable this year. As a result, the credit impulse has fallen, taking GDP growth down with it. It will be difficult for euro area GDP growth to increase unless credit growth starts rising again. So far, there is little sign that this is about to happen. According to the latest euro area bank lending survey, while banks continue to ease standards for business loans, they are doing so at a slower pace than in the past. A net 3% of banks eased lending standards in the second quarter, compared to 8% in the first quarter. Loan demand growth has been fairly stable. This suggests that loan growth will remain positive, but is unlikely to increase much from current levels. Worries about the health of European banks will further constrain credit growth. European banks in general, and Spanish banks in particular, have significant exposure to the most vulnerable emerging markets (Chart I-22). Chart I-21Euro Area Credit Growth Has Flatlined
Euro Area Credit Growth Has Flatlined
Euro Area Credit Growth Has Flatlined
Chart I-22Spain Most Exposed To Vulnerable EMs
October 2018
October 2018
Concerns about the ability of the Italian government to service its debt obligations will also restrain bank lending. Investors breathed a sigh of relief last month when the Italian government signaled a greater willingness to pare back next year's proposed budget deficit, in accordance with the dictates of the European Commission. Tensions remain, however, as evidenced by the fact that the ten-year spread between BTPs and German bunds is still 120 basis points higher than in April (Chart I-23). The European political establishment is terrified of the rise in populism across the region and would love nothing more than to see Italy's populist parties implode. This means that any help from the ECB and the European Commission will only arrive once a full-fledged crisis is underway. Anyway, it is far from clear that a smaller budget deficit would actually translate into a lower government debt-to-GDP ratio. Like China, Italy also has a private sector that saves too much and spends too little. A shrinking population has reduced the need for firms to invest in new capacity. The prior government's pension cuts have also incentivized people to save more for their retirement. The result is a private sector savings-investment surplus that stood at 5% of GDP in 2017 compared to close to breakeven a decade ago (Chart I-24). Chart I-23Italian/Bund Spreads Signal Lingering Fiscal Strain
Italian/Bund Spreads Signal Lingering Fiscal Strain
Italian/Bund Spreads Signal Lingering Fiscal Strain
Chart I-24Italy: Private Sector Saves Too Much And Spends Too Little
Italy: Private Sector Saves Too Much And Spends Too Little
Italy: Private Sector Saves Too Much And Spends Too Little
Unlike Germany, Italy cannot export its excess production because it does not have a hypercompetitive economy. Nor does it have the ability to devalue its currency to gain a quick competitiveness boost. This means that the Italian government has to absorb excess private-sector savings with its own dissavings - a fancy way of saying that it has to run a large budget deficit. This has effectively been Japan's strategy for over two decades. However, unlike Japan, Italy does not have a lender of last resort that can unconditionally buy government debt. This raises the risk that Italy's debt woes will resurface, either because the government abandons austerity measures, or because the lack of fiscal support causes nominal GDP to stagnate, making it all but impossible for the country to outgrow its debt burden. Receding Policy Puts The discussion above suggests that many of the "policy puts" that investors have relied on are in the process of having their strike price marked down to deeper out-of-the-money levels. Yes, the Fed will ease off on rate hikes if U.S. growth is at risk of stalling out completely. However, now that the labor market has reached full employment, the Fed will welcome modestly slower growth. Remember that there has never been a case in the post-war era where the three-month average of the unemployment rate has risen by more than a third of a percentage point without a recession taking place (Chart I-25). The further the unemployment rate falls below NAIRU, the more difficult it will be for the Fed to achieve the proverbial soft landing. Chart I-25Even A Small Uptick In The Unemployment Rate Is Bad News For The Business Cycle
Even A Small Uptick In The Unemployment Rate Is Bad News For The Business Cycle
Even A Small Uptick In The Unemployment Rate Is Bad News For The Business Cycle
Likewise, the "China stimulus put" - the presumption that most investors have that the Chinese authorities will launch a barrage of fiscal and credit easing at the first sign of slower growth - has become less reliable in light of the government's competing objectives namely reducing debt growth and excess capacity. The same goes for the "ECB put." Yes, the ECB will bail out Italy if the entire European project appears at risk. But spreads may need to blow out before the cavalry arrives. Meanwhile, just as the aforementioned policy puts are receding, new policy risks are rising to the fore, chief among them protectionism. We expect the trade war to heat up, with the Trump administration increasingly directing its ire at China. Trump's macroeconomic policies are completely at odds with his trade agenda. Fiscal stimulus will boost aggregate demand, which will suck in more imports. An overheated economy will prompt the Fed to raise rates more aggressively than it otherwise would, leading to a stronger dollar. All this will result in a wider trade deficit. What will Trump tell voters two years from now when he is campaigning in Michigan and Ohio about why the trade deficit has widened rather than narrowed under his watch? Will he blame himself or Beijing? No trophy for getting that answer right. II. Financial Markets Global Equities The combination of slower global growth, rising economic vulnerabilities outside the U.S., and a more challenging policy environment caused us to downgrade our view on global equities from overweight to neutral in June,3 while reiterating our preference for developed market equities relative to EM stocks. For now, we are comfortable with our bearish view towards emerging market stocks. While EM equities have cheapened, they are not yet at washed out levels (Chart I-26). Bottom fishers still abound, as evidenced by the fact that the number of shares outstanding in the MSCI iShares Turkish ETF has almost tripled since early April (Chart I-27). Chart I-26EM Assets: Valuations Not Yet At Washed Out Levels
EM Assets: Valuations Not Yet At Washed Out Levels
EM Assets: Valuations Not Yet At Washed Out Levels
Chart I-27EM Bottom Fishers Still Abound
EM Bottom Fishers Still Abound
EM Bottom Fishers Still Abound
At some point - probably in the first half of next year - investors will liquidate their remaining bullish EM bets. At that point, EM stocks will rebound. European and Japanese equities should also start to outperform the U.S., given their more cyclical nature. As far as the absolute direction of the S&P 500 is concerned, the next few months could be challenging. U.S. stocks have been able to decouple from those in the rest of the world, but this state of affairs may not last. Recall that the S&P 500 fell by 22% peak-to-trough between July 20 and October 8, 1998, in what otherwise was a massive bull market. We do not know if there is another Long-Term Capital Management lurking around the corner, but if there is, a temporary selloff in U.S. stocks may be hard to avoid. Such a selloff would present a buying opportunity over a horizon of 12-to-18 months. If we are correct that cyclical forces have lifted the neutral rate of interest, it will take a while for monetary policy to reach restrictive territory. This means that both fiscal and monetary policy will stay accommodative at least for the next 18 months. As such, the S&P 500 may not peak until 2020. Appendix A - Chart I presents a stylized diagram of where we think global equities are going. It incapsulates three phases: 1) a challenging period over the next six months, driven by EM weakness; 2) a blow-off rally in equities starting in the middle of next year; 3) and finally, a recession-induced bear market beginning in late-2020. Appendix B also presents our valuation charts, which highlight that long-term return prospects are better outside the United States. Fixed Income After advocating for a long duration strategy for much of the post-crisis recovery, BCA declared "The End Of The 35-Year Bond Bull Market" on July 5, 2016, the very same day that the 10-year U.S. Treasury yield hit a record closing low of 1.37%. Cyclically and structurally, we continue to expect U.S. bond yields to rise more than the market is discounting. As noted above, the Fed is underestimating how high rates will need to go before they reach restrictive territory. This means that the Fed will end up behind the curve in normalizing monetary policy, causing the economy to overheat and inflation to rise above the Fed's comfort zone. Granted, the Fed is willing to tolerate a modest inflation overshoot. However, a core PCE reading above 2.3%, which is at the top end of the range of the Fed's own forecast, would prompt the Fed to expedite the pace of rate hikes. A bear flattening of the yield curve - a situation where long-term yields rise, but short-term rates go up even more - would be highly likely in that environment. Over a shorter-term horizon spanning the next six months, the outlook for yields is more benign. The combination of a stronger dollar, slower global growth, and flight-to-quality flows into the Treasury market from vulnerable emerging markets can cap yields. Add to this the fact that sentiment towards bonds is currently extremely bearish (Chart I-28), and a temporary countertrend decline in yields becomes quite probable. Chart I-28Bond Sentiment Is Extremely Bearish
Bond Sentiment Is Extremely Bearish
Bond Sentiment Is Extremely Bearish
Developed market bond yields in general are likely to follow the direction of U.S. yields, both on the upside and the downside, but in a more muted manner. Outside the periphery, euro area yields have less scope to fall in the near term given that they are already so low. European yields also have less room to rise once global growth bottoms next year because the neutral rate of interest is much lower in the euro area than in the United States. Ironically, a more dovish ECB would help reduce Italian bond yields, as higher inflation is critical for increasing Italian nominal GDP. Since labor market slack is still elevated in Italy, continued monetary stimulus would also lift wages in core Europe more than in Italy, helping to boost Italy's competitiveness relative to the rest of the euro area. Japanese yields have plenty of scope to rise over the long haul. An aging population is pushing more people into retirement, which will cause the national savings rate to fall further. A decline in the savings pool will increase the neutral rate of interest in Japan. Instead of raising the policy rate, the Japanese authorities will let the economy overheat, generating inflation in the process. This will cause the yield curve to steepen, particularly at the very long end (e.g., beyond 10 years) which is the part of the yield curve that is the least susceptible to the BoJ's yield curve control regime. Appendix A - Chart II shows our expectations for the major government bond markets over the coming years. Turning to credit markets, high-yield credit typically underperforms in the latter innings of business-cycle expansions, a period when the Fed is raising rates. Thus, while we do not think that U.S. corporate debt levels will be a major source of systemic financial risk for the broader economy, this is hardly a reason to be overweight spread-product. A more cautious stance towards credit outside the U.S. is also warranted. Currencies And Commodities The dollar is working off overbought conditions, but will rebound into year-end, as EM tensions intensify and hopes of a massive credit/fiscal-fueled Chinese stimulus package fizzle. EM currencies will weaken the most against the dollar over the next three-to-six months, but the euro and, to a lesser extent, the yen, will also come under pressure. Granted, the dollar is no longer a cheap currency, but if long-term interest rate differentials stay anywhere close to current levels, the greenback will remain well supported. Consider the dollar's value against the euro. Thirty-year U.S. Treasurys currently yield 3.20% while 30-year German bunds yield 1.12%, a difference of 208 basis points. Even if one allows for the fact that investors expect euro area inflation to be lower than in the U.S. over the next 30 years, EUR/USD would need to trade at a measly 82 cents today in order to compensate German bund holders for the inferior yield they will receive.4 We do not expect EUR/USD to get down to that level, but a descent into the $1.10-to-$1.12 range over the next six months is probable. Sterling will remain hostage to Brexit negotiations. It is impossible to know how talks will evolve, but our bias is to take a somewhat pound-positive view. The main reason is that support for Brexit has faded (Chart I-29). Opinion polls suggest that if a referendum were held again, the "bremain" side would almost certainly prevail. Lacking public support for leaving the EU, it is unlikely that British negotiators could simply walk away from the table. This reduces the odds of a "hard Brexit" outcome. Indeed, a second referendum that leads to a "no-Brexit" verdict remains a distinct possibility. The combination of slower global growth and a resurgent dollar is likely to hurt commodity prices. Industrial metals are more vulnerable than oil. China consumes around half of all the copper, nickel, aluminum, zinc, and iron ore produced around the world (Chart I-30). In contrast, China represents less than 15% of global oil demand. Chart I-29When Bremorse Sets In
When Bremorse Sets In
When Bremorse Sets In
Chart I-30China Is A More Dominant Consumer Of Metals Than Oil
China Is A More Dominant Consumer Of Metals Than Oil
China Is A More Dominant Consumer Of Metals Than Oil
The supply backdrop for oil is also more favorable than for metals. Not only are Saudi Arabia and Russia maintaining production discipline, but U.S. sanctions against Iran threaten to weigh on global crude supply. Further reduction in Venezuela's oil output, as well as potential disruptions to Libyan or Iraqi exports, could also boost oil prices. The superior outlook for oil over metals means we prefer the Canadian dollar relative to the Aussie dollar. While AUD/CAD has weakened in recent months, the Aussie dollar is still somewhat expensive against the loonie based on our long-term valuation model (Chart I-31). We also see an increasing chance that Canada will negotiate a revamped trade deal with the U.S., as Trump focuses his attention more on China. Should this happen, it will remove the NAFTA break-up risk discount embedded in the Canadian dollar. Finally, a few words on precious metals. Precious metals typically struggle during periods when the dollar is appreciating (Chart I-32). Consequently, we would not be eager buyers of gold or other precious metals until the dollar peaks, most likely around the middle of next year. As inflation starts to accelerate in late-2019 and in 2020, gold will finally move decisively higher. Chart I-31Canadian Dollar Still Somewhat ##br##Cheap Versus The Aussie Dollar
Canadian Dollar Still Somewhat Cheap Versus The Aussie Dollar
Canadian Dollar Still Somewhat Cheap Versus The Aussie Dollar
Chart I-32Gold Won't Shine Until The Dollar Peaks
Gold Won't Shine Until The Dollar Peaks
Gold Won't Shine Until The Dollar Peaks
Appendix A - Chart III and Chart IV present an illustration of where the major currencies and commodities are heading. Peter Berezin Chief Global Strategist Global Investment Strategy September 28, 2018 Next Report: October 25, 2018 1 Depending on which specification of the Taylor rule one uses, a one percent of GDP increase in aggregate demand will increase the neutral rate of interest by half a point (John Taylor's original specification) or by a full point (Janet Yellen's preferred specification). Fiscal policy is currently about 3% of GDP too stimulative compared to a baseline where government debt-to-GDP is stable over time. Assuming a fiscal multiplier of 0.5, fiscal policy is thus boosting aggregate demand by 1.5% of GDP. Nonfinancial private credit has increased by an average of 1.5 percentage points of GDP per year since 2016. Assuming that every additional one dollar of credit increases aggregate demand by 50 cents, the revival in credit growth is raising aggregate demand by 0.75% of GDP, compared to a baseline where credit-to-GDP is flat. The labor share of income has increased by 1.25% of GDP from its lows in 2015. Assuming that every one dollar shift in income from capital to labor boosts overall spending on net by 20 cents, this would have raised aggregate demand by 0.25% of GDP. Lastly, if the personal savings rate falls by two points over the next two years, this would raise aggregate demand by 1.5% of GDP. Taken together, these factors are boosting the neutral rate by anywhere from 2% (Taylor's specification) to 4% (Yellen's specification). This is obviously a lot, and easily overwhelms other factors such as a stronger dollar that may be weighing on the neutral rate. 2 Recall that GDP is a flow variable (how much production takes place every period), whereas credit is a stock variable (how much debt there is outstanding). By definition, a flow is a change in a stock. Thus, credit growth affects GDP and the change in credit growth affects GDP growth. Euro area private-sector credit growth accelerated from -2.6% in May 2014 to 3.1% in March 2017, but has been broadly flat ever since. Hence, the credit impulse has dropped. 3 Please see Global Investment Strategy Special Report, "Three Policy Puts Go Kaput: Downgrade Global Equities To Neutral," dated June 20, 2018. 4 For this calculation, we assume that the fair value for EUR/USD is 1.32, which is close to the IMF's Purchasing Power Parity (PPP) estimate. The annual inflation differential of 0.47% is based on 30-year CPI swaps. This implies that the fair value for EUR/USD will rise to 1.52 after 30 years. If one assumes that the euro reaches that level by then, the common currency would need to trade at 1.52/(1.0208)^30=0.82 today. APPENDIX A APPENDIX A CHART IMarket Outlook: Equities
October 2018
October 2018
APPENDIX A CHART IIMarket Outlook: Bonds
October 2018
October 2018
APPENDIX A CHART IIIMarket Outlook: Currencies
October 2018
October 2018
APPENDIX A CHART IVMarket Outlook: Commodities
October 2018
October 2018
APPENDIX B Long-Term Return Prospects Are Slightly Better Outside The U.S.
October 2018
October 2018
Long-Term Return Prospects Are Slightly Better Outside The U.S.
October 2018
October 2018
Long-Term Return Prospects Are Slightly Better Outside The U.S.
October 2018
October 2018
Long-Term Return Prospects Are Slightly Better Outside The U.S.
October 2018
October 2018
II. Is It Time To Buy Value Stocks? Per the most commonly referenced growth and value indexes, growth has been outperforming value for over 11 years, the longest stretch in the history of the series. Growth's extended winning streak has split investors into two camps: those who believe that value is finished because of overexposure and shortened investor timeframes, and those who are trying to identify the point at which reversion to the mean will ensue. In this Special Report, we argue that the traditional off-the-shelf indexes are poor proxies for true value. Their methodology strays quite far from the principles enumerated by Benjamin Graham, the father of value investing, and Fama and French, the researchers who demonstrated that lower-priced stocks have outperformed over time. The headline S&P 500 indexes currently differentiate between growth and value stocks using simplistic metrics that introduce considerable sector bias, reducing the difference between growth and value to a binary choice between Tech and Financials. Using tools developed by BCA's Equity Trading Strategy service, we create sector-neutral U.S. value and growth indexes that correct for the off-the-shelf indexes' flaws, and broaden the range of metrics Fama and French employed to make style distinctions. The ETS-derived indexes appear to better distinguish between value and growth stocks. The ETS value-versus-growth portfolio beat its Fama and French counterpart by four percentage points annually over its 22-year life. We join our custom value and growth indexes to Fama and French's to study the impact of macro variables on relative style performance over time for the purpose of gaining insight into the most opportune points to shift between styles. Relative style performance has not corresponded consistently or robustly enough with the business cycle, inflation, interest rates, or broad market direction to support reliable style-decision rules. We find that monetary policy settings, as defined by our stylized fed funds rate cycle, are a consistently reliable predictor of relative style performance. Per the fed funds rate cycle, tight policy is most conducive to value outperformance. From this perspective, value's decade-long slump is not a surprise, given that the ultra-accommodative tide has been lifting all boats. There is no rush to increase value exposure while policy remains easy, but investors should look to load up on value once policy becomes tight, using the metrics in our ETS model to identify true value stocks. We expect that the policy inflection will occur sometime in the second half of 2019, or the first half of 2020. Growth stocks have been on a tear for the longest stretch in the history of the series, based on the most commonly referenced growth and value indexes, even if their gains haven't yet matched the magnitude of the 1990s (Chart II-1). It is no surprise, then, that growth stocks are as expensive as they have ever been, outside of the tech-bubble era in the late 1990s. Many investors are thus wondering if the next "big trade" is to bet on an extended reversion to the mean during which value regains the ground it has given up. Chart II-1A Lost Decade For Value Stocks
A Lost Decade For Value Stocks
A Lost Decade For Value Stocks
In this Special Report, we argue that the traditional off-the-shelf indexes are not very good at differentiating growth from value stocks. Trends in relative performance have much more to do with sector performance than intrinsic value, making the indexes a poor proxy for investors who are truly interested in selecting stocks based on their value and growth profiles. We create U.S. value and growth indexes that are unaffected by sector performance, using stock selection software provided by BCA's Equity Trading Strategy service. The results will surprise readers who are used to dealing with canned measures of value and growth. What Is Value Investing? Value investing principles have been around at least since the days when Benjamin Graham was a money manager himself. Style investing has been a part of the asset-management lexicon for four decades. Yet there is no universally agreed-upon definition of a value stock versus a growth stock. Based on our reading of Graham's Intelligent Investor, we submit that an essential element of value investing is the identification of stocks that are temporarily trading below their intrinsic value. The temporary drag may persist for a while - stock markets can remain oblivious to fundamentals for extended stretches - but it is ultimately expected to dissipate. Value investing is a play on negative overreaction or neglect, and dedicated value investors have to be contrarians, not to mention contrarians with strong stomachs. The temporary nature of undervaluation is a recurring theme in Graham's book. The stock market's ever-present proclivity toward overreaction ensures a steady supply of value opportunities: "The market is always making mountains out of molehills and exaggerating ordinary vicissitudes into major setbacks.1" "[W]hen an individual company ... begins to lose ground in the economy, Wall Street is quick to assume that its future is entirely hopeless and it should be avoided at any price.2" "[T]he outstanding characteristic of the stock market is its tendency to react excessively to favorable and unfavorable influences.3" Graham viewed security analysis as the comparison of an issue's market price to its intrinsic value. He advised buying stocks only when they trade at a discount to intrinsic value, offering an investor a "margin of safety" that should guard against significant declines. His favorite measure for assessing intrinsic value was a sober, objective estimate of average future earnings, grossed-up by an appropriate multiple. A low price-to-average-earnings ratio was the linchpin of his margin-of-safety mantra. Decades after Graham's heyday, University of Chicago professors Eugene Fama and Kenneth French bestowed the academy's seal of approval on value investing. Their landmark 1992 paper found that low price-to-book ("P/B") stocks consistently and convincingly outperformed high P/B stocks.4 Several "growth" and "value" indexes have been developed over the years, but they bear no more than a passing resemblance to Graham's, and Fama and French's, work. It is important to realize that the off-the-shelf indexes are far from an ideal proxy for the value factor that Fama & French tried to isolate. Traditional Growth And Value Indexes Are Wanting The off-the-shelf growth and value indexes shown in Chart II-1 all share similar cyclical profiles, with only small differences in long-term returns. Given the similarity of the indexes, we will focus on Standard & Poor's/Citigroup methodology for the purposes of this report.5 The headline S&P 500 indexes currently differentiate between growth and value stocks using the following metrics: 3-year growth rates in EPS, 3-year growth rates in sales-per-share, and 12-month price momentum; along with valuation yardsticks including price-to-book, price-to-earnings, and price-to-sales. Companies with higher growth rates in earnings and sales, and better price momentum, are classified as growth stocks, while those with lower valuation multiples are considered value stocks. Several stocks are cross-listed in both indexes, which is baffling and counterproductive for an investor seeking to implement a rigorous style tilt.6 Table II-1 contains a summary of the current sector breakdowns for the S&P 500 Growth and Value indexes. Table II-2 sheds light on each index's aggregate geographical and U.S. business cycle exposure, the former of which is based on our U.S. Equity Strategy service's judgment. Table II-1Current S&P 500 Style Index Exposures
October 2018
October 2018
Table II-2The Value Index Has Less Global ##br##And Late Cyclical Exposure
October 2018
October 2018
Growth is currently heavily weighted in Health Care, Technology and Consumer Discretionary sectors, while value has a high concentration of Financials, Energy and Consumer Staples (Table II-1). Table II-2 shows that the growth index has a clear current bias toward sectors with global economic exposure that typically outperform the broad equity market late in the business cycle. The value benchmark flips growth's global/domestic exposure, and has slightly more exposure to defensive sectors, while splitting its cyclical exposure evenly between early and late cyclicals. Sector Dominance Unfortunately, the reigning methodology creates a major problem - shifts in the relative performance of growth and value indexes are dominated by sector performance. Financials' higher debt loads, and banks' low-margin operations, depress their multiples relative to nonfinancial firms. Thus, Financials hold permanent residency in the off-the-shelf value indexes. Conversely, Tech stocks perennially account for an outsized proportion of most growth indexes' market cap. Value-versus-growth boils down to a binary choice between Financials and Tech.7 The growth/value price ratio has closely tracked the Technology/Financials price ratio since the late 1990s (Chart II-2, top panel). The correlation was much less evident before 1995, when Tech stocks accounted for a much smaller share of market capitalization. Chart II-3 demonstrates that the positive correlation between growth/value and Tech has steadily climbed over the decades to almost 1, while the correlation with Financials has become increasingly negative (currently at -0.75). Chart II-2The S&P 500 Style Indexes Merely Mimic Relative Sector Performance
The S&P 500 Style Indexes Merely Mimic Relative Sector Performance
The S&P 500 Style Indexes Merely Mimic Relative Sector Performance
Chart II-3Style Capture
Style Capture
Style Capture
In contrast, the Fama/French approach, which focuses exclusively on price-to-book while ensuring equal representation for large- and small-market-cap stocks, appears much less affected by sector skews; the growth/value index created from their data has not tracked the Tech/Financials ratio, even after 1995 (Chart II-2, second panel). Moreover, note that the extended downward trend in the Fama/French growth/value ratio is consistent with other academic research that shows that value stocks outperform growth over the long-term. The off-the-shelf indexes show the opposite, but that is because they are merely tracking the long-term outperformance of Tech relative to Financials. The bottom line is that the standard indexes incorporate flawed measures of growth and value that limit their usefulness for true style investing. Conventional Wisdom With respect to style investing and the economic cycle, the prevailing conventional wisdom holds that: Inflation - Growth stocks perform best during times of disinflation and persistently low inflation, whereas value stocks perform best during periods of accelerating inflation; Interest Rates - Periods of high and rising interest rates favor value stocks at the expense of growth; and Business Cycle - It is believed that growth stocks outperform value during recessions, because the latter tend to be more highly leveraged to the economic cycle than their growth counterparts. According to the conventional view, value stocks shine in the early and middle phases of a business cycle expansion. Growth stocks return to favor again in the late states of an expansion, when investors begin to worry about the pending end to the business cycle and are looking for reliable and consistent earnings growth. Do the traditional measures of growth and value corroborate this conventional wisdom? Chart II-4 shows that the S&P value/growth index and headline CPI inflation have both trended lower since the early 1980s, but there has been no tendency for value to outperform when inflation rises. Value has shown some tendency to outperform during rising-rate phases since the mid-1980s, but the relationship with the level of the fed funds rate is stronger than its direction, as we discuss below. The growth-over-value relationship with the business cycle is complicated by the tech bubble in the late 1990s, which heavily distorted relative sector performance. The Citigroup measure of growth began to outperform very late in the cycle and through the subsequent recession in some business cycles (1979-1981, 1989-1991, and 2007-2009; Chart II-5). The early and middle parts of the cycles, however, were a mixed bag. Chart II-4Spiting The Conventional Wisdom
Spiting The Conventional Wisdom
Spiting The Conventional Wisdom
Chart II-5No Consistent Relationship With The Business Cycle
No Consistent Relationship With The Business Cycle
No Consistent Relationship With The Business Cycle
The bottom line is that there appears to be some rough correspondence between the Citigroup index and the interest rate and growth cycles, but it is too variable to point to reliable rules for shifting between styles. Ultimately, determining the direction of the growth and value indexes is more about forecasting relative Tech and Financials performance than it is about identifying cheap stocks. A Better Value Approach We identify four broad shortcomings of off-the-shelf value indexes: They exclusively use trailing multiples, a rear-view mirror metric. They rely on simple price-to-book multiples, which flatter serial acquirers. They rely entirely on reported earnings, which are an imperfect proxy for cash flow. A share of stock ultimately represents a claim on its issuer's future cash flows. They make no attempt to place relative metrics into historical context. Without a mechanism to compare a particular segment's valuation relative to its history, structurally low-multiple stocks will be over-represented and structurally high-multiple stocks will be under-represented. BCA's Equity Trading Strategy (ETS) platform provides a way of differentiating value from growth stocks that avoids these problems. The web-based platform uses 24 quantitative factors to rank approximately 10,000 individual stocks in 23 countries. Users can rank and score individual equities to support a broad set of investment strategies and apply macro and sector views to single-name investments. The ETS approach has an impressive track record. Historically, the top decile of stocks ranked using the "BCA Score" methodology has outperformed stocks in the bottom decile by over 25% a year. The overall BCA Score includes all 24 factors when ranking stocks, but to develop our custom value index, we use only the five valuation measures in the ETS database: trailing P/E, forward P/E, price-to-tangible-book, price-to-sales and price-to-cash flow. Every quarter we rank the stocks within each of the 11 sectors based on an equally-weighted composite of the five valuation measures. Note that we are using the data to rank stocks only against other stocks in the same sector. We calculate the total return from owning the top 30% of stocks by value in each sector. We do the same with the bottom 30% and refer to this as our "growth" index.8 We then compute an equally-weighted average of the total returns for the growth indexes across the 11 sectors. We do the same for the value indexes. By comparing stock valuation only to other stocks in the same sector, this approach avoids the sector composition problem suffered by the off-the-shelf measures. Chart II-6 compares the ETS value/growth total return index to the Fama/French value/growth index. Data limitations preclude comparing the two measures before 1996, but the ETS index confirms the Fama/French result that value trumps growth over the long term. The ETS index follows a similar cyclical profile to the Fama/French index from 1997 to 2009, rising and falling in tandem. The two series subsequently diverge: per the criteria ETS uses to identify value and construct an index, lower-priced stocks have outperformed higher-priced ones for most of this expansion, while the Fama/French methodology suggests the reverse. Chart II-6The ETS Model Builds On Fama And French's Work
The ETS Model Builds On Fama And French's Work
The ETS Model Builds On Fama And French's Work
By avoiding sector composition problems and using a wider variety of value measures, the ETS approach appears to be a superior measure of value. An investor that consistently over-weighted value stocks according to the ETS approach would have outperformed someone who did the same using the Fama methodology by an annual average of four percentage points from 1996 to 2018. The history of our ETS index only covers two recessions, limiting our ability to gauge its performance vis-Ã -vis a variety of macro factors, so we extend the ETS index back to 1926 using the Fama/French index. While joining two indexes with different methodologies is less than ideal, we feel the drawbacks are outweighed by the benefit of observing growth and value relative performance across more business cycles. The top panel of Chart II-7 shows U.S. real GDP growth, shaded for recessions. The bottom panel presents our extended ETS value/growth index, shaded for declines of more than 10%. The shaded periods overlap in many, but not all, cycles (indicated by circles in the chart). That is, growth stocks have tended to outperform during economic downturns, although this is not a hard-and-fast rule. Chart II-7No Hard-And-Fast Relationship With The Business Cycle...
No Hard-And-Fast Relationship With The Business Cycle...
No Hard-And-Fast Relationship With The Business Cycle...
Value-over-growth relative returns exhibit some directionality with the overall equity market when looking at corrections (peak-to-trough declines of at least 10%, as shaded in the top panel of Chart II-8), though it should be noted that it is nearly impossible to flag a correction in advance. The relationship weakens when considering bear markets, i.e. peak-to-trough declines of at least 20%, which can be forecast with at least some reliability.9 The bottom panel is the same as in Chart II-7; the extended ETS index, shaded for periods of significant value stock underperformance. The correspondence between the shaded periods is hardly perfect, and there does not appear to be a practical style exposure message, even if an investor could call corrections in advance. Chart II-8...And Market Directionality Has Been An Imperfect Guide Over The Last 50 Years
...And Market Directionality Has Been An Imperfect Guide Over The Last 50 Years
...And Market Directionality Has Been An Imperfect Guide Over The Last 50 Years
Valuation Relative valuation also provides some useful information on positioning, though it is not always timely. Chart II-9 presents an aggregate valuation measure for the stocks in our value index relative to that of the stocks in our growth index. Value stocks are expensive relative to growth when the valuation indicator is above +1 standard deviation, and value is cheap when the indicator is less than -1 standard deviation. Historically, investors would have profited if they had over-weighted value stocks when the valuation indicator reached the threshold of undervaluation, although subsequent outperformance was delayed by as much as a year in two episodes. In contrast, the valuation indicator is not useful as a 'sell' signal for value stocks because they can remain overvalued for long periods. Value was overvalued relative to growth for much of the time between 2009 and 2016. Value stocks have cheapened since then, although they have yet to reach the undervaluation threshold. The Fed Funds Rate Cycle While relative style performance may generally lean in one direction or another in conjunction with the business cycle, inflation, interest rates, or broad equity-market performance, there are no hard-and-fast rules. It is difficult to formulate any sort of rotation view between styles, and history does not inspire confidence that any such rule would generate material outperformance. The monetary policy backdrop offers a path forward. We have found the fed funds rate cycle offers a consistent guide to equity and bond returns in other contexts, and our Global ETF Strategy service has found a robust link between the policy cycle and equity factor performance.10 We segment the fed funds rate cycle into four phases, based on whether or not the Fed is hiking or cutting rates, and whether policy is accommodative or restrictive (Chart II-10). Our judgment of the state of policy is derived from comparing the fed funds rate to our estimate of the equilibrium fed funds rate, the policy rate that neither encourages nor discourages economic activity. Chart II-9Sizeable Undervaluation Flags Turning ##br##Points, But You May Have To Wait A While
Sizeable Undervaluation Flags Turning Points, But You May Have To Wait A While
Sizeable Undervaluation Flags Turning Points, But You May Have To Wait A While
Chart II-10The Fed Funds Rate Cycle
October 2018
October 2018
As defined by Fama and French, value stocks outperform growth stocks by a considerable margin when monetary policy is restrictive (Table II-3 and Chart II-11, top panel). Considering value and growth stocks separately, both perform extremely well when policy is easy (Chart II-11, second panel), but growth stocks barely advance when policy is tight, falling far behind their value counterparts. A strategy for generalist investors may be to seek out value exposure when policy is tight, while investing without regard to styles when it is easy. Table II-3The State Of Monetary Policy Is The ##br##Best Guide To Style Performance
October 2018
October 2018
Chart II-11The State Of Monetary Policy Drives Style Performance
The State Of Monetary Policy Drives Style Performance
The State Of Monetary Policy Drives Style Performance
Investment Conclusions: U.S. equity sectors that have traditionally been considered "growth" have outperformed value sectors for an extended period. The long slump has led some investors to argue that value investing is finished, killed by a combination of overexposure and short-term performance imperatives. Other investors see value's long drought as an anomaly, and are looking for the opportune time to bet on a reversal. We are in the latter camp. The difficulty lies in finding an indicator that reliably leads value stocks' outperformance. Most macro measures are unhelpful, though broad market direction offers some insight, as stocks with low price-to-book multiples have outperformed their high-priced peers by a wide margin during bear markets. Bear markets aren't the most useful timing guide, however, because one only knows in retrospect when they begin and end. The monetary policy backdrop holds the most promise as a practical guide. Although our determination of easy or tight policy turns on the modeled estimate of a concept and should not be looked to for absolute precision, it has provided a timely, reliable guide to value outperformance. We expect the relationship will persist because of the cushion provided by less demanding multiples. Earnings and multiples surge when policy is easy, lifting all boats. It is only when policy is tight, and the tide is going out, that the margin of safety offered by lower-priced stocks yields the greatest benefit. Per our estimate of the equilibrium fed funds rate, we are still firmly ensconced within Phase I of the policy rate cycle, and expect that we will remain there until sometime in the second half of 2019. We therefore expect that value, in Fama and French terms, will continue to underperform growth for another year. The clock is ticking for growth, though, as the expansion is in its latter stages and building inflation pressures will likely force the Fed to take a fairly hard line in this rate-hiking cycle. Once monetary policy turns restrictive, investors should hunt for value candidates using a range of valuation metrics, and combine them in a sector-neutral way, as we have via our Equity Trading Strategy service's model. Mark McClellan Senior Vice President The Bank Credit Analyst Doug Peta Senior Vice President U.S. Investment Strategy 1 Graham, Benjamin, The Intelligent Investor, Harper Collins: New York, 2005, p. 97. 2 Ibid, p. 15. 3 Ibid, p. 189. 4 Fama, Eugene F. and French, Kenneth R., "The Cross-Section of Expected Stock Market Returns," The Journal of Finance, Volume 47, Issue 2 (June 1992), pp. 427-465. 5 S&P currently brands its Growth and Value Indexes as S&P 500 Dow Jones Indexes, but Citigroup has the longest history of compiling S&P 500 Growth and Value Indexes, beginning in 1975, so we join the Citigroup S&P 500 style indexes to the Standard & Poor's series to obtain the maximum style-index history. We use the terms Citigroup and S&P interchangeably. 6 The Pure Value and Pure Growth indexes include only the top quartile of value and growth stocks, respectively, with no overlap between indexes, and are therefore better gauges of true style investing. 7 The Tech-versus-Financials cast of the indexes endures because all of the other sectors, ex-regulated Telecoms and Utilities, which account for too little market cap to make a difference, regularly move between the indexes as their fundamental fortunes, and investor appetites, wax and wane. The current Early Cyclical/Late Cyclical/Defensive profiles are not etched in stone and should be expected to shift, perhaps considerably, over time. 8 We created a second growth index by taking the top 30% of stocks ranked by earnings momentum. However, it made little difference to the results, so we will use the bottom 30% of stocks by value as our measure of "growth" for the purposes of this report, consistent with Fama/French methodology. 9 Please see The Bank Credit Analyst. September 2017, available on bca.bcaresearch.com 10 Please see the May 17, 2017 Global ETF Strategy Special Report, "Equity Factors And The Fed Funds Rate Cycle," available at getf.bcaresearch.com. III. Indicators And Reference Charts Our equity indicators continue to signal that caution is warranted, but U.S. profits remain potent enough to drown out scattered negative messages. Our Monetary Indicator remains at the low end of a multi-year range, suggesting that liquidity conditions have tightened. Our Composite Technical Indicator is in no-man's land, not far above the zero line that marks a sell signal, but coming close to issuing a buy signal by crossing above its 9-month moving average. Our Composite Sentiment Indicator is in a healthy position that suggests that the current level of investor optimism is sustainable. On the other hand, not one of our Willingness-to-Pay (WTP) Indicators is moving in the right direction. The U.S. version is still weak and slowly getting weaker; the European one has flat-lined; and our Japanese WTP extended its decline, albeit from a high level. Our Revealed Preference Indicator (RPI) for stocks continues to issue a sell signal. The RPI combines the idea of market momentum with valuation and policy measures. It provides a powerful bullish signal if positive market momentum lines up with constructive signals from the policy and valuation measures. Conversely, if constructive market momentum is not supported by valuation and policy, investors should lean against the market trend. Momentum remains out of sync with valuation and policy, underlining the idea that caution is warranted. On balance, our indicators continue to suggest that the underlying supports of the U.S. equity bull market are eroding. Surging U.S. profits are papering over the cracks, and may still have some legs. Earnings surprises are at an all-time high, and the net revisions ratio remains elevated. The 10-year Treasury yield's march higher is due to run out of steam. Valuation (slightly cheap) and technicals (oversold by almost 2 standard deviations) imply that a countertrend pullback is not too far around the corner. Beyond a near-term correction, though, complacency about inflation and the Fed's ability to hike rates to at least the level of the FOMC voters' median projection points to looming capital losses. The dollar is quite expensive on a purchasing power parity basis, and its long-term outlook is not constructive, but policy and growth divergences with other major economies will likely keep the wind at its back in the near term. EQUITIES: Chart III-1U.S. Equity Indicators
U.S. Equity Indicators
U.S. Equity Indicators
Chart III-2Willingness To Pay For Risk
Willingness To Pay For Risk
Willingness To Pay For Risk
Chart III-3U.S. Equity Sentiment Indicators
U.S. Equity Sentiment Indicators
U.S. Equity Sentiment Indicators
Chart III-4Revealed Preference Indicator
Revealed Preference Indicator
Revealed Preference Indicator
Chart III-5U.S. Stock Market Valuation
U.S. Stock Market Valuation
U.S. Stock Market Valuation
Chart III-6U.S. Earnings
U.S. Earnings
U.S. Earnings
Chart III-7Global Stock Market And Earnings: ##br##Relative Performance
Global Stock Market And Earnings: Relative Performance
Global Stock Market And Earnings: Relative Performance
Chart III-8Global Stock Market And Earnings: ##br##Relative Performance
Global Stock Market And Earnings: Relative Performance
Global Stock Market And Earnings: Relative Performance
FIXED INCOME: Chart III-9U.S. Treasurys And Valuations
U.S. Treasurys And Valuations
U.S. Treasurys And Valuations
Chart III-10Yield Curve Slopes
Yield Curve Slopes
Yield Curve Slopes
Chart III-11Selected U.S. Bond Yields
Selected U.S. Bond Yields
Selected U.S. Bond Yields
Chart III-1210-Year Treasury Yield Components
10-Year Treasury Yield Components
10-Year Treasury Yield Components
Chart III-13U.S. Corporate Bonds And Health Monitor
U.S. Corporate Bonds And Health Monitor
U.S. Corporate Bonds And Health Monitor
Chart III-14Global Bonds: Developed Markets
Global Bonds: Developed Markets
Global Bonds: Developed Markets
Chart III-15Global Bonds: Emerging Markets
Global Bonds: Emerging Markets
Global Bonds: Emerging Markets
CURRENCIES: Chart III-16U.S. Dollar And PPP
U.S. Dollar And PPP
U.S. Dollar And PPP
Chart III-17U.S. Dollar And Indicator
U.S. Dollar And Indicator
U.S. Dollar And Indicator
Chart III-18U.S. Dollar Fundamentals
U.S. Dollar Fundamentals
U.S. Dollar Fundamentals
Chart III-19Japanese Yen Technicals
Japanese Yen Technicals
Japanese Yen Technicals
Chart III-20Euro Technicals
Euro Technicals
Euro Technicals
Chart III-21Euro/Yen Technicals
Euro/Yen Technicals
Euro/Yen Technicals
Chart III-22Euro/Pound Technicals
Euro/Pound Technicals
Euro/Pound Technicals
COMMODITIES: Chart III-23Broad Commodity Indicators
Broad Commodity Indicators
Broad Commodity Indicators
Chart III-24Commodity Prices
Commodity Prices
Commodity Prices
Chart III-25Commodity Prices
Commodity Prices
Commodity Prices
Chart III-26Commodity Sentiment
Commodity Sentiment
Commodity Sentiment
Chart III-27Speculative Positioning
Speculative Positioning
Speculative Positioning
ECONOMY: Chart III-28U.S. And Global Macro Backdrop
U.S. And Global Macro Backdrop
U.S. And Global Macro Backdrop
Chart III-29U.S. Macro Snapshot
U.S. Macro Snapshot
U.S. Macro Snapshot
Chart III-30U.S. Growth Outlook
U.S. Growth Outlook
U.S. Growth Outlook
Chart III-31U.S. Cyclical Spending
U.S. Cyclical Spending
U.S. Cyclical Spending
Chart III-32U.S. Labor Market
U.S. Labor Market
U.S. Labor Market
Chart III-33U.S. Consumption
U.S. Consumption
U.S. Consumption
Chart III-34U.S. Housing
U.S. Housing
U.S. Housing
Chart III-35U.S. Debt And Deleveraging
U.S. Debt And Deleveraging
U.S. Debt And Deleveraging
Chart III-36U.S. Financial Conditions
U.S. Financial Conditions
U.S. Financial Conditions
Chart III-37Global Economic Snapshot: Europe
Global Economic Snapshot: Europe
Global Economic Snapshot: Europe
Chart III-38Global Economic Snapshot: China
Global Economic Snapshot: China
Global Economic Snapshot: China
Doug Peta Senior Vice President U.S. Investment Strategy
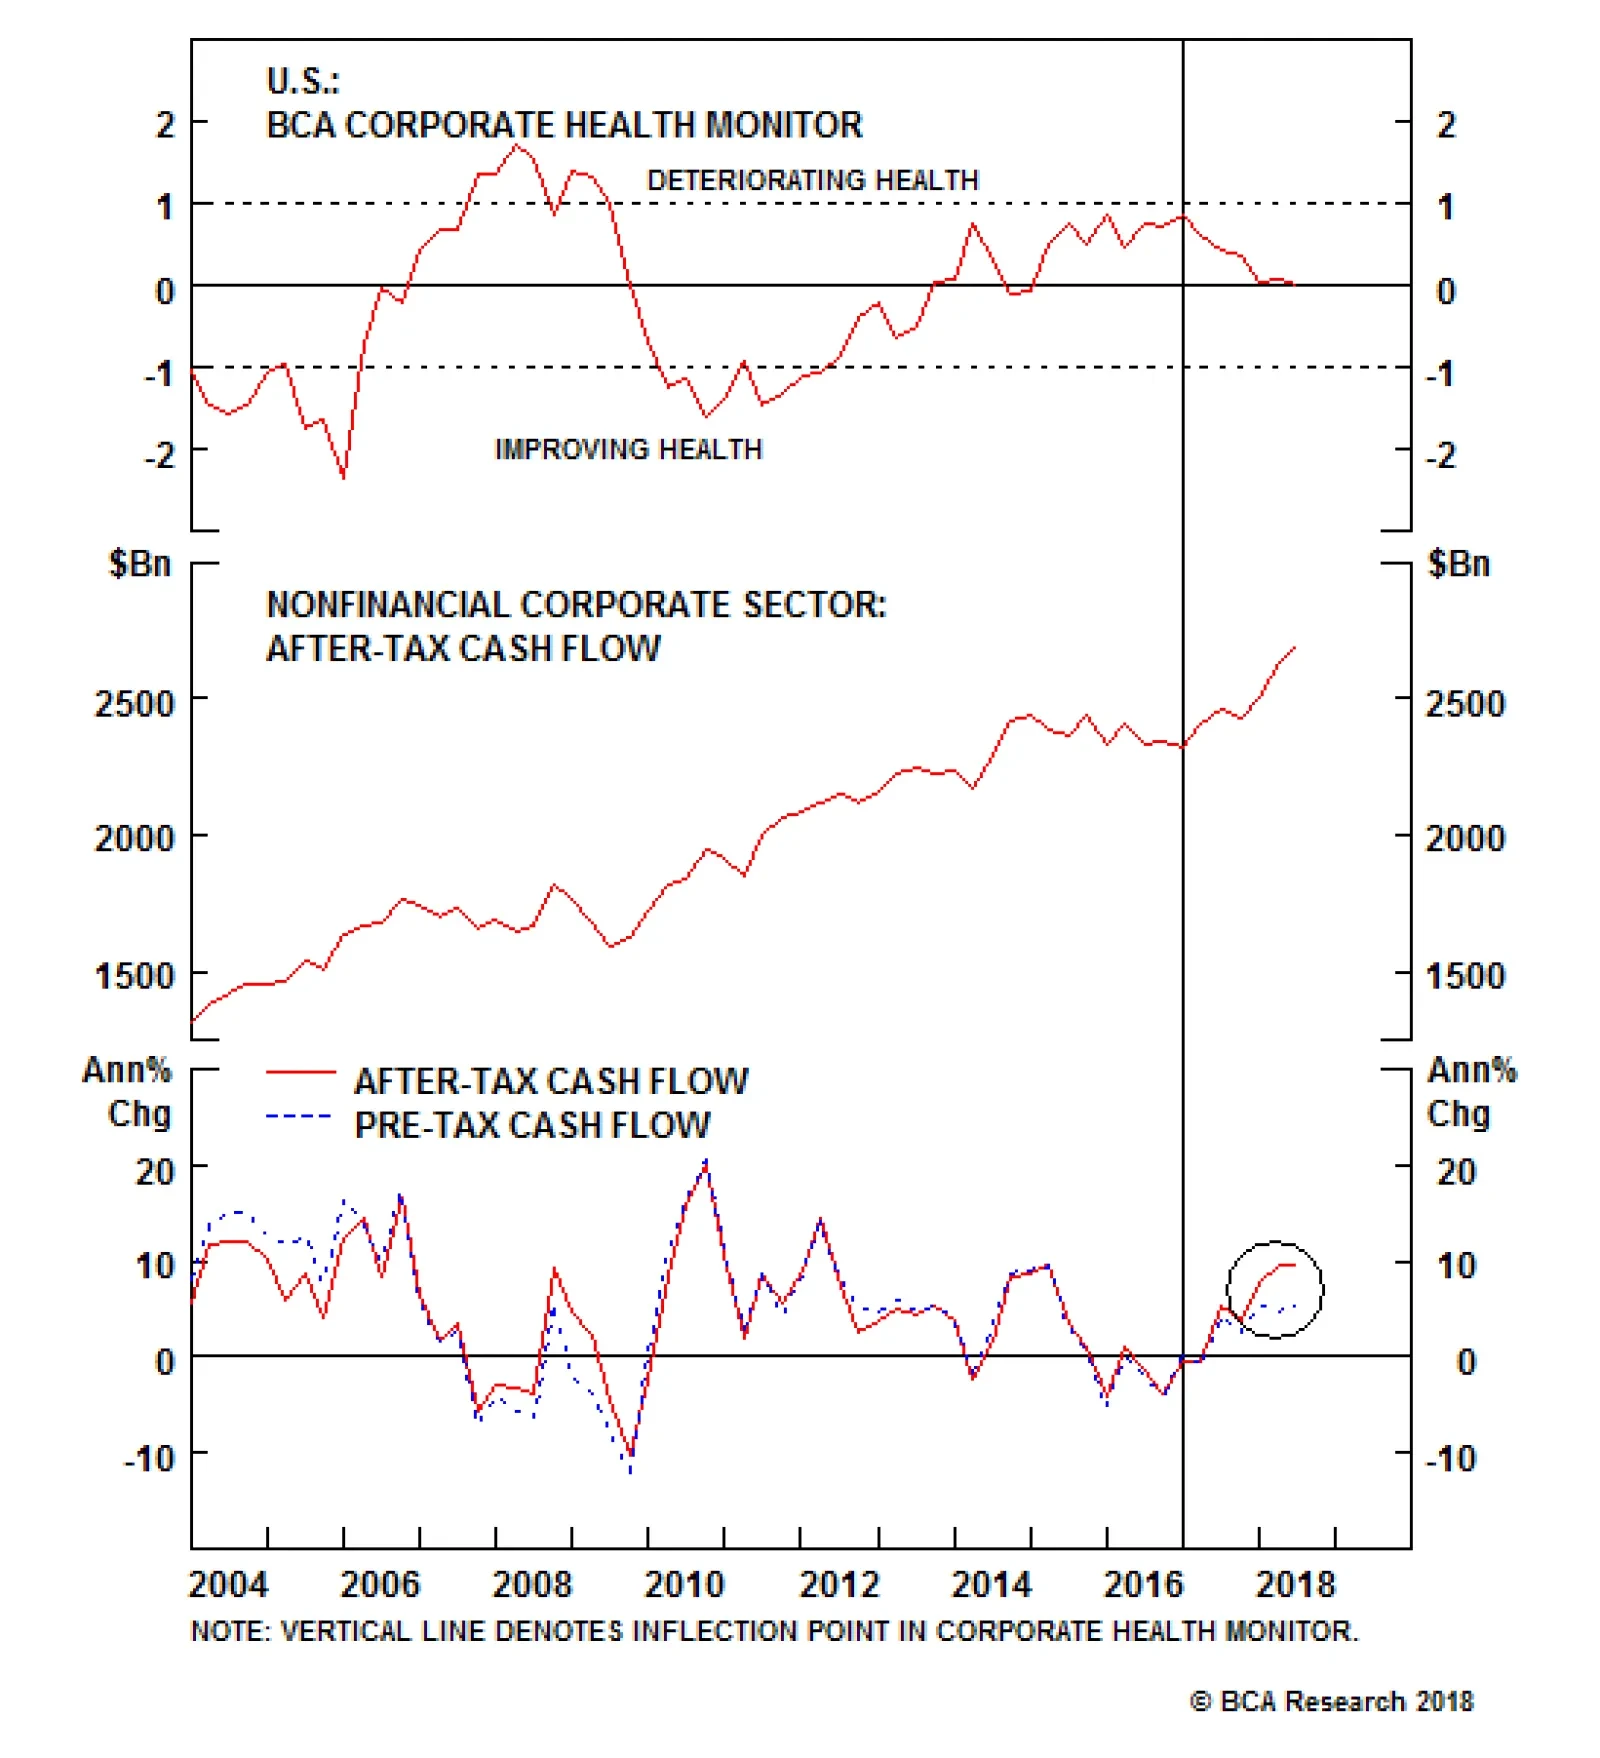
By far, the biggest driver of the CHM's improvement has been the sharp increase in after-tax cash flows. This is partly due to the recent corporate tax cuts, but also reflects a significant rebound in pre-tax cash flows. Despite the rebound in profits, we…
Highlights Duration: The housing market is the key channel through which monetary policy impacts the economy. As such, it is unlikely that Treasury yields will peak until housing shows meaningful weakness. While residential investment has decelerated in recent quarters, we expect this weakness will prove temporary and that Treasury yields have further cyclical upside. Maintain below-benchmark portfolio duration. Yield Curve: The Fed will maintain its 25 bps per quarter rate hike pace for the time being, but could be forced to pause next year if weak foreign growth migrates to the U.S. via a stronger dollar. We recommend hedging this risk via a long position in the 7-year bullet versus a short position in the 1/20 barbell. Corporate Health: Strong profit growth - both organic and as a result of corporate tax cuts - has led to a significant improvement in corporate balance sheet health during the past few quarters. This improvement will not persist for much longer. We recommend only a neutral allocation to corporate bonds, both investment grade and junk. Feature This time last week the 10-year Treasury yield was bumping up against 3% and money markets were on the cusp of discounting an extra rate hike between now and the end of 2019. Both resistance levels broke during the past seven days. The 10-year yield is now 3.07% and the January 2020 fed funds futures contract is fully priced for four rate hikes (Chart 1). Chart 1Past Resistance Levels
Past Resistance Levels
Past Resistance Levels
With the 10-year yield back above 3%, many investors are once again speculating about where it will ultimately peak for the cycle. Any answer to this question relies on an assumption about the neutral fed funds rate, the level of interest rates above which monetary policy turns restrictive and acts to slow economic growth and inflation. In past reports we have suggested several measures investors can track to help decide whether interest rates are close to breaking above neutral.1 In this week's report we focus on one particularly important indicator - the housing market. In his essential 2007 paper "Housing Is The Business Cycle", Edward Leamer notes that of the ten post-WWII U.S. recessions, eight were preceded by a significant slowdown in residential investment.2 Given that recessions are also typically preceded by tightening monetary policy, it is not a stretch to connect the two. In fact, there is good reason to believe that housing is the main channel through which monetary policy impacts the economy. Since leverage is employed in the acquisition of new homes, interest rates impact the cost of homeownership more directly than other assets. A similar claim could be made about leveraged investment from the corporate sector, but business investment is also beholden to swings in expected future demand. Households can easily postpone the acquisition of a new home if the interest rate environment makes it uneconomical, businesses need to act when the market demands it. But most importantly, Leamer's paper demonstrates that, unlike residential investment, weaker business investment does not consistently provide advance warning of recession. The State Of U.S. Housing Turning to the data, we see that Leamer's claim is validated by the top panel of Chart 2. Residential investment tends to decline in the year preceding a U.S. recession. Housing starts and new home sales display a similar pattern (Chart 2, panels 2 & 3). Chart 2The Housing Market Predicts Recessions
The Housing Market Predicts Recessions
The Housing Market Predicts Recessions
What's worrying is that residential investment has barely grown at all during the past year (Chart 2, bottom panel). If this weakness continues it would signal that interest rates are too high for the housing market, and that we are likely very close to the cyclical peak in bond yields. However, we doubt the current weakness will persist. For one, the recent decline in construction activity has been concentrated in the multi-family sector while single-family construction continues to expand at a steady rate (Chart 3). This could simply reflect a shift in demand away from multi-family toward single-family, reversing the trend witnessed between 2010 and 2012. It's possible that some households who were forced into the rental market in the aftermath of the Great Recession now find themselves able to switch back. But even if we focus on the multi-family sector exclusively, there is little reason to believe that construction will see significantly more downside. The rental vacancy rate remains very low, and the National Multi Housing Council's Survey of Apartment Market Conditions suggests that there is no strong upward or downward pressure on the vacancy rate at the moment (Chart 3, bottom 2 panels). The fact that single-family housing starts have not declined casts some doubt on the notion that higher mortgage rates are to blame for the deceleration in residential investment. This is further borne out by the fact that, while higher mortgage rates have certainly increased the cost of homeownership, mortgage payments as a percent of median income are not stretched compared to history (Chart 4). The demand back-drop for housing also remains robust, with household formation in a clear uptrend (Chart 4, panel 2) and homebuilders as optimistic as ever about future sales activity (Chart 4, bottom panel). Chart 3A Temporary Weakness In Residential Investment
A Temporary Weakness In Residential Investment
A Temporary Weakness In Residential Investment
Chart 4Higher Mortgage Rates Are Not The Culprit
Higher Mortgage Rates Are Not The Culprit
Higher Mortgage Rates Are Not The Culprit
We conclude that interest rates are still too low to meaningfully impact the housing market. Residential investment will re-accelerate in the coming quarters and Treasury yields have plenty of room to rise before reaching their cyclical peak. Bottom Line: The housing market is the key channel through which monetary policy impacts the economy. As such, it is unlikely that Treasury yields will peak until housing shows meaningful weakness. While residential investment has decelerated in recent quarters, we expect this weakness will prove temporary and that Treasury yields have further cyclical upside. Maintain below-benchmark portfolio duration. Hedging Weak Foreign Growth With Steepeners The resilience of the U.S. housing market makes it likely that interest rates will continue to rise for quite some time. However, this does not preclude weak foreign growth - and the resultant dollar strength - from forcing the Fed to slow its 25 basis point per quarter rate hike pace at some point during the next 6-12 months. In fact, we have flagged in recent reports that, since 1993, every time the Global (ex. U.S.) Leading Economic Indicator (LEI) has fallen below zero, the U.S. LEI has eventually followed (Chart 5).3 Unless foreign growth suddenly recovers, it is quite likely that dollar strength will drag the U.S. LEI lower in the first half of next year. At that point, the Fed may be forced to pause its rate hike cycle in order to take some shine off the dollar, allowing the recovery to continue. Chart 5Weak Global Growth Could Bring Down The U.S.
Weak Global Growth Could Bring Down The U.S.
Weak Global Growth Could Bring Down The U.S.
Drops in the U.S. LEI to below zero almost always coincide with a recommendation for easier monetary policy from our Fed Monitor (Chart 5, bottom panel). Although one notable exception did occur in 2005. An examination of the three components of our Fed Monitor reveals that a falling LEI caused the economic growth component of our monitor to decline in 2005 (Chart 6). However, this was offset by an elevated inflation component and extremely easy financial conditions (Chart 6, bottom 2 panels). Chart 6The Three Components Of Our Fed Monitor
The Three Components Of Our Fed Monitor
The Three Components Of Our Fed Monitor
As in 2005, inflation pressures are once again elevated and financial conditions remain accommodative. It follows that it could take a significant deterioration in economic growth before the Fed is forced to pause its 25 bps per quarter rate hike cycle, one that is not yet evident in the data. Nevertheless, we cannot ignore the risk that weak foreign growth will infiltrate the U.S. via a stronger dollar, forcing the Fed to pause. With only two 25 basis point rate hikes currently discounted for 2019, some pause is already in the price. This makes us reluctant to advocate shifting away from below-benchmark portfolio duration. We think a better way to hedge the risk of a Fed pause is through yield curve steepeners. Since short-dated yields are more heavily influenced by the expected near-term pace of rate hikes than long-dated yields, any Fed pause will cause the yield curve to steepen. Steepeners are also very attractively priced at the moment, meaning that they should even perform well in a mild curve flattening environment.4 Our preferred method for implementing a curve steepener is to go long a bullet maturity near the middle of the curve and short a duration-matched barbell consisting of the very short and very long ends of the curve.5 With that in mind, we can determine the best yield curve trade to implement by answering the following two questions: Which bullet over barbell combination offers the most attractive value? Which bullet over barbell combination is most likely to outperform in the "Fed pause" scenario we are trying to hedge? In response to the first question, we consider the 2-year, 3-year, 5-year and 7-year bullet maturities all relative to a duration-matched 1/20 barbell. All of those butterfly spreads offer approximately the same yield pick-up (Chart 7). They also all offer approximately the same yield pick-up relative to our fair value models, which are based on regressions of the butterfly spread versus the 1/20 slope of the curve (Chart 8).6 To answer the second question, we try to identify which of the 2-year, 3-year, 5-year or 7-year yields is likely to decline the most in response to the market pricing-in a pause in Fed rate hikes. To do this we look at the historical correlations between different yield curve slopes and our 12-month Fed Funds Discounter - the change in the fed funds rate that is priced into the market for the next 12 months. The correlations are displayed in Chart 9, and they show that monthly changes in the 7/10 slope are almost always negatively correlated with monthly changes in the 12-month discounter. In other words, when the discounter falls, the 7-year yield falls by more than the 10-year yield. Chart 7Different Bullets, Similar Yield Pick-Up I
Different Bullets, Similar Yield Pick-Up I
Different Bullets, Similar Yield Pick-Up I
Chart 8Different Bullets, Similar Yield Pick-Up II
Different Bullets, Similar Yield Pick-Up II
Different Bullets, Similar Yield Pick-Up II
Chart 9Hedging The "Fed Pause" Scenario
Hedging The "Fed Pause" Scenario
Hedging The "Fed Pause" Scenario
Monthly changes in the 5/7 slope are also usually negatively correlated with changes in the discounter, though the correlation has been closer to zero in recent years. This makes it difficult to say with certainty whether the 5-year or 7-year yield would fall by more in response to a decline in the discounter. Chart 9 also shows that changes in both the 2/3 and 3/5 slopes are positively correlated with changes in the 12-month discounter. This means that when the discounter falls, the 3-year yield falls by more than the 2-year yield and the 5-year yield falls by more than the 3-year yield. In general, we can safely conclude that the 5-year and 7-year bullets are better hedges against a Fed pause than the 2-year or 3-year bullets. The 7-year in particular appears to be a safe bet. Given that the differences in valuation between the different options are miniscule, we are inclined to maintain our current yield curve position: long the 7-year bullet and short the 1/20 barbell. This week we also close our recommendation to favor the 5/30 barbell over the 10-year bullet for a small loss of 2 bps. This trade was designed to hedge the risk of Fed overtightening leading to an inverted yield curve. This trade would underperform in the event of a Fed pause, which we now view as the greater risk. Bottom Line: The Fed will maintain its 25 bps per quarter rate hike pace for the time being, but could be forced to pause next year if weak foreign growth migrates to the U.S. via a stronger dollar. We recommend hedging this risk via a long position in the 7-year bullet versus a short position in the 1/20 barbell. Corporate Balance Sheet Reprieve Last week's release of the second quarter U.S. Financial Accounts (formerly Flow of Funds) allows us to update our indicators of nonfinancial corporate balance sheet health. Overall, there has been a significant improvement in our Corporate Health Monitor (CHM) since the end of 2016. It has fallen from deep in "deteriorating health" territory to close to the "improving health" zone (Chart 10). By far, the biggest driver of the CHM's improvement has been the sharp increase in after-tax cash flows (Chart 10, panel 2). This is partly due to the recent corporate tax cuts, but also reflects a significant rebound in pre-tax cash flows (Chart 10, bottom panel). Despite the rebound in profits, we remain cautious on the outlook for corporate balance sheets going forward. First, our bottom-up samples of firms included in the investment grade and high-yield Bloomberg Barclays bond indexes both show that the median firm's net debt-to-EBITDA has improved in recent quarters, but remains elevated compared to history (Chart 11). Chart 10After-Tax Cash Flows Drive CHM Improvement
After-Tax Cash Flows Drive CHM Improvement
After-Tax Cash Flows Drive CHM Improvement
Chart 11Debt Levels Still High
Debt Levels Still High
Debt Levels Still High
Second, we see increasing headwinds to profit growth going forward. The positive impact from tax cuts is set to wane, while the stronger dollar and faster wage growth will both weigh on pre-tax profits during the next year.7 It is important to note that it will not take much deceleration in pre-tax profits for corporate balance sheets to worsen. Our measure of gross leverage - total debt over pre-tax profits - has only managed to flatten-off during the past few quarters, even as profit growth has surged. This means that the rapid gains in profits have only managed to keep pace with the rate of debt growth. Even a small deceleration in profits will cause leverage to rise, and rising leverage tends to occur alongside an increasing default rate (Chart 12). Chart 12Gross Leverage And Corporate Defaults
Gross Leverage And Corporate Defaults
Gross Leverage And Corporate Defaults
Bottom Line: Strong profit growth - both organic and as a result of corporate tax cuts - has led to a significant improvement in corporate balance sheet health during the past few quarters. This improvement will not persist for much longer. We recommend only a neutral allocation to corporate bonds, both investment grade and junk. Ryan Swift, Vice President U.S. Bond Strategy rswift@bcaresearch.com 1 Please see U.S. Bond Strategy Weekly Report, "Tracking The Two-Stage Treasury Bear", dated August 14, 2018, available at usbs.bcaresearch.com 2http://www.nber.org/papers/w13428 3 Please see U.S. Bond Strategy Weekly Report, "An Oasis Of Prosperity?", dated August 21, 2018, available at usbs.bcaresearch.com 4 Please see U.S. Bond Strategy Portfolio Allocation Summary, "Playing Catch-Up", dated September 11, 2018, available at usbs.bcaresesarch.com 5 For further details on why we prefer this trade construction, please see U.S. Bond Strategy Special Report, "Bullets, Barbells And Butterflies", dated July 25, 2017, available at usbs.bcaresearch.com 6 We calculate the butterfly spread as: the bullet yield minus the yield of the duration-matched barbell. 7 Please see U.S. Bond Strategy Special Report, "Go To Neutral On Spread Product", dated June 26, 2018, available at usbs.bcaresearch.com Fixed Income Sector Performance Recommended Portfolio Specification
Highlights Portfolio Strategy Stick with a neutral weighting in the tech sector as rising interest rates, higher inflation and a firming greenback offset improving industry operating metrics on the back of the virtuous capex upcycle. Chip and chip equipment stocks will remain under pressure as global semi sales are under attack and leading indicators of semi demand suggest that more pain lies ahead at a time when chip selling prices are steeply decelerating. Recent Changes There are no changes to our portfolio this week. Table 1
Party Like It's 2004!
Party Like It's 2004!
Feature Equities regained their footing last week and remain perched near all-time highs. Investors are largely ignoring the trade-related uncertainty and are instead focusing on the upbeat economic backdrop. Both soft and hard data continue to send an unambiguously healthy signal for the U.S. economy, a potent tonic for corporate profitability. Chart 1EPS Will Do All The Heavy Lifting
EPS Will Do All The Heavy Lifting
EPS Will Do All The Heavy Lifting
While a lot of parallels have been drawn between today and the late-1990s, our sense is that the current financial market and economic outlooks resemble more the mid-2000s. Chart 1 shows that, between 2004 and the stock market peak in late-October 2007, forward profit growth estimates peaked at over 20%/annum and the forward multiple drifted steadily lower. Nevertheless, stocks remained well bid and rose alongside forward EPS (top and third panels, Chart 1). In other words, despite decelerating forward profit growth estimates and a contracting forward multiple, expanding forward EPS did the heavy lifting, explaining all of the advance in the SPX. The similarities to today are eerie: while profit growth peaked in Q1/2018, 10% EPS growth is elevated for the tenth year of an expansion, and the forward multiple is coming in (Chart 1). On the policy front, the Bush tax cuts hit in the mid-2000s with the elimination of the double taxation of dividends and a drop in personal income tax rates, along with a one-time cash repatriation of corporate profits stashed abroad. With regard to the economic backdrop, capex was roaring and nominal GDP was firing on all cylinders as a housing bubble was getting inflated. The GDP deflator also hit a high mark. The ISM manufacturing survey eclipsed 61 in 2004 and non-farm payrolls were expanding smartly (Chart 2). But despite all that apparent overheating especially in the housing market, the real fed funds rate was near zero in 2004 (top panel, Chart 3). Finally, a number of financial market metrics were also similar to today. Oil prices were on their way to triple digits, high yield spreads were below 400bps and the VIX probed, at the time, all-time lows (Chart 3). However, one key difference between the mid-2000s and today is the strengthening U.S. dollar. The firming greenback remains a key risk to our positive equity market view (bottom panel, Chart 3), as it will eventually infiltrate EPS. Netting it all out, if history at least rhymes, an earnings-led advance in the SPX is the most likely outcome. Our sanguine cyclical (9-12 month) equity market view remains predicated on a 10%/annum increase in EPS and a sideways-to-lower move in the forward multiple. Meanwhile, wage inflation is slowly starting to rear its ugly head. In fact, we are surprised by the fits and starts in average hourly earnings growth. At this stage of the cycle, wage growth should start galloping higher as executives aggressively bid up the price of labor in order to fill job openings and bring expansion plans to fruition. A simple wage growth indicator comprising resource utilization and the unemployment gap suggests that wage inflation will really kick into higher gear in the coming 12 months (shown as a Z-score, Chart 4). Chart 2Eerie...
Eerie…
Eerie…
Chart 3...Parallels With 2004
...Parallels With 2004
...Parallels With 2004
Chart 4Mind The Return Of Inflation
Mind The Return Of Inflation
Mind The Return Of Inflation
Two weeks ago we highlighted that the S&P 500's profit margins are benefiting from lower corporate taxes and muted wage growth, a goldilocks backdrop. Despite evidence of a pending inflationary impulse, as long as businesses are successful in passing rising input costs down the supply chain and onto the consumer, then margins and EPS will continue to expand. Nevertheless, deconstructing the SPX's all-time high profit margins is in order. Chart 5 & Chart 6 show the 11 GICS1 sector profit margin time series using Standard & Poor's data, and Chart 7 is a snapshot of Q2/2018 profit margins for the 11 sectors and the broad market. Chart 5Sectorial Profit ...
Sectorial Profit …
Sectorial Profit …
Chart 6...Margin Breakdown
...Margin Breakdown
...Margin Breakdown
Chart 7Tech Is A Clear Outlier
Party Like It's 2004!
Party Like It's 2004!
Five sectors (tech, industrials, materials, consumer discretionary and utilities) are enjoying record-high profit margins, and four (financials, consumer staples, telecom services and real estate) are on the verge of joining that club. This leaves two sectors with declining margin profiles: health care and energy. While most sectors are +/- five percentage points away from the S&P 500, the tech sector sports profit margins at twice the level of the SPX or eleven percentage points higher and is the clear outlier (Chart 7). The implication is that the broad market's EPS fortunes are closely tied to the high-flying tech sector that commands a 26% market cap weight. Thus, this week we are compelled to highlight the deep cyclical tech sector, and two of its hyper-sensitive and foreign exposed subcomponents. Tech On Steroids In late-August we published a chart on tech margins (which we are reprinting today) showing the upward force they have exerted on the broad equity market for the better part of the past decade (top panel, Chart 8). Naturally, stratospheric profits must underpin these parabolic margins. The middle panel of Chart 8 highlights that since 2006 tech EPS have almost quadrupled, pulling SPX profits higher. As a reminder, the S&P tech sector commands a 24% profit weight in the S&P 500, the highest since the history of this data series and almost double the weight during the previous cycle's peak (bottom panel, Chart 8). The implication is that in order for the broad market to suffer a severe blow, tech has to take a hit, and vice versa. Chart 8Secular Tech EPS Growth Has Boosted Margins
Secular Tech EPS Growth Has Boosted Margins
Secular Tech EPS Growth Has Boosted Margins
Chart 9EPS Growth Model Flashing Green
EPS Growth Model Flashing Green
EPS Growth Model Flashing Green
On the EPS front, our profit growth model has recently ticked higher from an already extended level, signaling that the profit outlook remains bright (Chart 9). The virtuous capex upcycle - BCA's key theme for the year - remains the key driver behind our EPS model. Chart 10 shows that the tech sector continues to make inroads in the overall capex pie, according to financial statement-reported data, and has now doubled its share since the GFC trough to roughly 12%. National accounts corroborate this data and underscore that pent up demand is getting unleashed, following a near 15-year hibernation period (bottom panel, Chart 10). The news on the operating front is equally encouraging. The San Francisco Fed's tech pulse index - an index of coincident indicators of technology sector activity1 - is reaccelerating. Tech new orders-to-inventories are also picking up steam and suggest that sell side analysts have set the relative EPS bar too low (Chart 11). Finally, the latest PCE report revealed that consumer outlays on tech goods are also gaining momentum, even relative to overall consumer spending. While this upbeat backdrop would point to an above benchmark tech allocation, three risks keep us at bay. First, the tech sector garners 60% of its revenues from abroad and thus the appreciating U.S. dollar is a significant profit headwind, especially for 2019 when the delayed negative FX translation effects will most likely emerge (third panel, Chart 12). Chart 10Capex On The Upswing...
Capex On The Upswing…
Capex On The Upswing…
Chart 11...Underpinning Tech Operating Metrics...
...Underpinning Tech Operating Metrics…
...Underpinning Tech Operating Metrics…
Chart 12...But Three Risks Keep Us At Bay
...But Three Risks Keep Us At Bay
...But Three Risks Keep Us At Bay
Second, a rising U.S. inflation backdrop along with the related looming selloff in the bond market should knock the wind out of the tech sector's sails. Tech business models are built to withstand deflation and thrive in a disinflationary environment. Thus, when inflation re-emerges, tech stocks suffer (CPI and 10-year UST yield shown inverted, top two panels, Chart 12). Third, leading indicators of emerging Asian demand are souring rapidly and were the trade war to re-escalate, EM in general and tech-laden Korean and Taiwanese economic data in particular would retrench further (bottom panel, Chart 12). Bottom Line: We prefer to remain on the sidelines in the S&P information technology sector and sustain a barbell portfolio within the sector. As a reminder we continue to express our bullishness via two high-conviction overweight defensive tech sub-sectors, S&P software and S&P tech hardware, storage & peripherals (THSP), and our bearishness via avoiding their early cyclical peers, S&P semis and S&P semi equipment. Avoid Chip Stocks At All Costs While we are neutral the broad tech sector and prefer secular growth defensive tech sub-sectors, we continue to recommend shying away from chip and chip equipment stocks. Chart 13 shows the extreme sensitivity to changes in final demand of chip related stocks versus their defensive tech peers. In more detail, software and THSP indexes are in a secular advance with regard to EPS outperformance, whereas semis and semi equipment profits are hyper-cyclical with mean-reverting relative profit profiles. Granted, the commoditization of semiconductors explains this close correlation with the business cycle. But, as we highlighted last November when we put the semi equipment index on the high-conviction underweight list, extrapolating EPS growth euphoria far into the future was fraught with danger.2 In fact, late-November 2017 marked the peak in semi equipment performance versus the overall IT sector, confirming the early cyclical nature of chip stocks (Chart 14). Chart 13Bifurcated EPS
Bifurcated EPS
Bifurcated EPS
Chart 14Good Times...
Good Times…
Good Times…
Three factors have weighed heavily on this industry's growth prospects and there is no light at the end of the tunnel yet. Bitcoin's (and other cryptocurrencies) collapse is dealing a blow, at the margin, to demand for semi equipment (top panel, Chart 15). Taiwan's financials statement-reported data on IT capex and national data on overall Taiwanese capital outlays corroborates this downbeat demand backdrop (Chart 16). Finally, the drubbing in EM currencies is sapping purchasing power from the consumer and also warns that things will get worse for U.S. semi equipment stocks before they get better (bottom panel, Chart 15). Chart 15...Do Not Last Forever
...Do Not Last Forever
...Do Not Last Forever
Chart 16Semi-Heavy Taiwan Emits A Grim Signal
Semi-Heavy Taiwan Emits A Grim Signal
Semi-Heavy Taiwan Emits A Grim Signal
The outlook for their brethren, semi producers, is equally downtrodden. Global semi sales have crested and leading indicators of future semi revenue growth are sending a warning signal. Chinese imports of electronics have come to an abrupt halt, and the U.S. dollar's appreciation is also waving a red flag (second & bottom panels, Chart 17). BCA's calculated global leading economic indicator excluding the U.S. and BCA's calculated global ZEW Indicator of Economic Sentiment excluding the U.S. both herald a steep deceleration in global semi sales (Chart 17). On the pricing power front, using Asian DRAM prices as an industry pricing power gauge, DRAM momentum is on a trajectory to contract some time in Q1/2019. The implication is that semi earnings will surprise to the downside. Still expanding global chip inventories are not providing an offset and also confirm that semi EPS optimism is unwarranted (middle & bottom panels, Chart 18). Finally, another source of demand for chip stocks has reversed, as industry M&A activity has plummeted toward decade lows. Not only is this negative for pricing power, but inflated premia are also now working in reverse especially given this year's QCOM/NXPI and AVGO/QCOM flops (top panel, Chart 18). Our Chip Stock Timing Model (CSTM) does an excellent job encapsulating all these moving parts and is currently in the sell zone (bottom panel, Chart 19). Chart 17Global Semi Sales Trouble...
Global Semi Sales Trouble…
Global Semi Sales Trouble…
Chart 18...Abound
...Abound
...Abound
Chart 19Chip Stock Timing Model Says Sell
Chip Stock Timing Model Says Sell
Chip Stock Timing Model Says Sell
Bottom Line: Continue to avoid the S&P semis and S&P semi equipment indexes. The ticker symbols for the stocks in these indexes are: BLBG: S5SECO - INTC, NVDA, QCOM, TXN, AVGO, MU, ADI, AMD, MCHP, XLNX, SWKS, QRVO, and BLBG: S5SEEQ - AMAT, LRCX, KLAC, respectively. Anastasios Avgeriou, Vice President U.S. Equity Strategy anastasios@bcaresearch.com 1 https://www.frbsf.org/economic-research/indicators-data/tech-pulse/ 2 Please see BCA U.S. Equity Strategy Weekly Report, "2018 High-Conviction Calls," dated November 27, 2017, available at uses.bcaresearch.com. Current Recommendations Current Trades Size And Style Views Favor value over growth Favor large over small caps