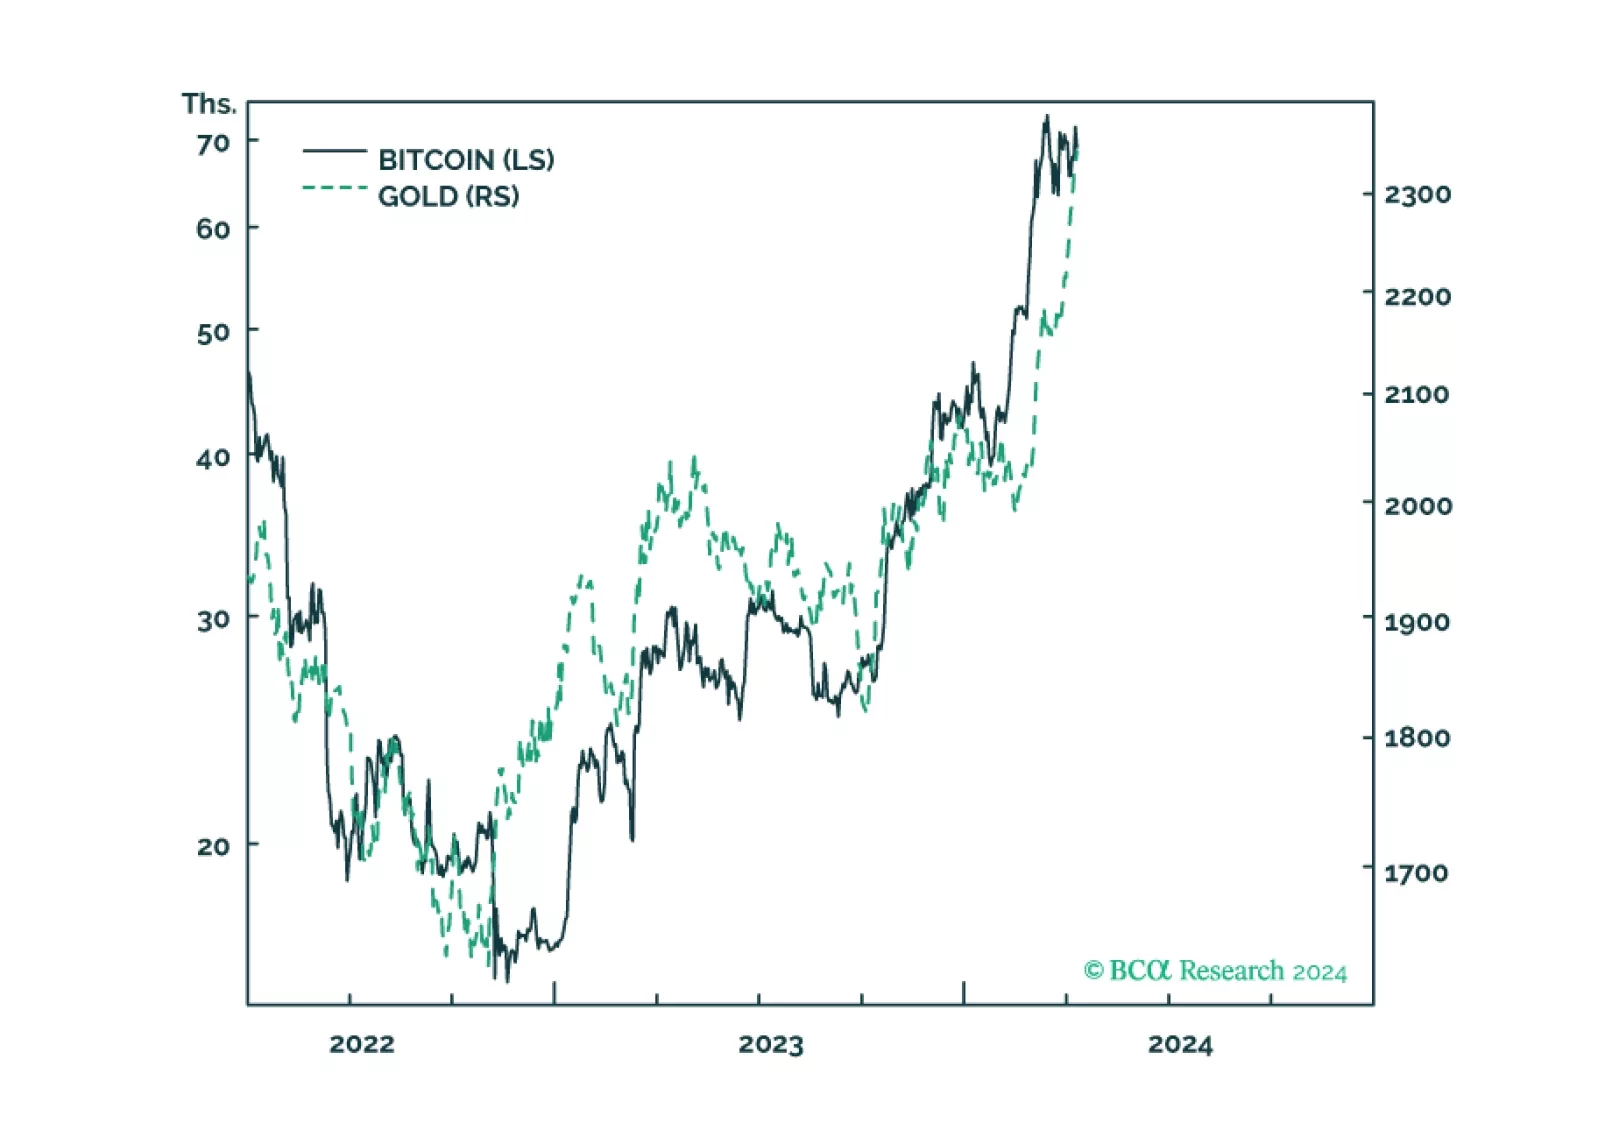
Sorry, you need to enable JavaScript to visit this website.
Skip to main content

Cryptocurrencies

We recommend a small structural exposure to cryptocurrencies and blockchain tokens, given their incipient real-world uses as well as their proven hedging qualities against the debasement of fiat money and in banking crises. In this Special Report, we rank the major blockchains on five factors – developer activity, adoption, decentralization, scalability, and security – from which we arrive at our top five blockchains.

According to BCA Research’s Counterpoint service, on a timeframe of two years, investors should shock-proof their portfolios by holding some combination of cheap insurance assets. All shocks end up with both deflationary and inflationary components: either…

There is a 50:50 chance of experiencing a major deflationary shock in the next two years, and an even greater likelihood on a longer timeframe. The good news is that several assets provide a good insurance against this risk, and that this insurance is now cheap. Plus we highlight a compelling commodity pair-trade.

In this volume of BCA Crypto we compare gold against bitcoin. We begin by dispelling some common misconceptions that investors have about gold, and why, at its core, gold is driven more by belief than by intrinsic value. We then proceed to explain why gold still serves an important role in our economy and how it differs from fiat money. Later, we explain how bitcoin is different from other cryptocurrencies, and why it could rival gold as a reserve asset in the future. Finally, we discuss the outlook for bitcoin, as well as which macro factors investor should watch.

The Web 2.0 bubble is bursting, with far-reaching consequences for US stock market behaviour, sector allocation, and global asset allocation.

Web 3.0 plays will boom in the coming decade. Play this through a diversified exposure to today’s main blockchain tokens. But the Web 2.0 oligopolies, like Amazon and Meta, are in big trouble.

Crypto broker FTX’s bankruptcy does not pose a systemic threat to markets. It did reveal something deeply unflattering about excess liquidity, however, and suggests that other private investments may come a cropper.

The kinked supply framework helps explain why US inflation rose so suddenly shortly after the pandemic began and why the economy is likely to experience a benign disinflation over the next six months.

Listen to a short summary of this report.       Executive Summary Global Equities Are More Attractively Valued After The Recent Sell-Off Global Equities Are More Attractively Valued After The Recent Sell-Off Global Equities Are More Attractively Valued After The Recent Sell-Off We tactically downgraded global equities in late February but see the current level of stock prices as offering enough upside to warrant an overweight. Global equities are now trading at 15.6-times forward earnings, and only 12.6-times outside the US. More importantly, the forces that pushed down stock prices are starting to abate: The war in Ukraine no longer seems likely to devolve into a broader conflict; the number of new Covid cases in China has fallen by half; and global inflation has peaked. The next 18 months of falling inflation and receding recession fears could see stocks recover much of their losses. The “Last Hurrah” for equities is coming. We continue to think that over a 5-year horizon, bond yields will rise from current levels, value stocks will outperform growth stocks, and crypto prices will fall. However, countertrend rallies are likely. To express this view, we recommend taking partial profits on our short 10-year Treasury trade recommendation (up 9.3% from an initial entry yield of 1.45% on June 30, 2021). We are also halving our long global value/growth position (up 20.1% since inception on December 10, 2020) and our short Bitcoin position (up 98% based on our exponential shorting technique). Bottom Line: Global equities are heading towards a “last Hurrah” starting in the second half of this year. Tactically upgrade stocks to overweight.   Feature Dear Client, We published a Special Alert early this afternoon tactically upgrading global equities to overweight. As promised, the enclosed report elaborates on our view change. Best regards, Peter Berezin Restore Tactical Overweight On Global Equities Chart 1Global Equities Are More Attractively Valued After The Recent Sell-Off Global Equities Are More Attractively Valued After The Recent Sell-Off Global Equities Are More Attractively Valued After The Recent Sell-Off We tactically downgraded global equities from overweight to neutral on February 28th. The war in Ukraine, the Covid outbreak in China, and most importantly, the rise in bond yields have kept us on the sidelines ever since. At this point, however, the outlook for stocks has brightened, and thus we are restoring our tactical (3-month) overweight to stocks so that it is consistent with our bullish 12-month cyclical view. First, valuations have discounted much of the bad news. After the recent sell-off, global equities are trading at 15.6-times forward earnings (Chart 1). Outside the US, they trade at only 12.6-times forward earnings. Second, the forces that pushed down stock prices are starting to abate. The war in Ukraine is approaching a stalemate, with Russian troops unable to take much of the country, let alone seriously threaten regional neighbours. A European embargo on Russian oil is likely but will be watered down significantly before it is implemented. European officials have shied away from banning Russian natural gas, an action that would have much more severe economic implications. While still very high in absolute terms, December-2022 European natural gas futures are down 36% from their peak on March 7 (Chart 2). The 7-day average of new Covid cases in China has fallen by more than half since late April (Chart 3). Considering that a significant fraction of China’s elderly population is unvaccinated, the authorities will continue to play whack-a-mole with the virus for the next few months (Chart 4). Fortunately, Chinese domestic production of Pfizer’s Paxlovid anti-Covid drug is starting to ramp up, which should allow for some easing in lockdown measures later this year. Chart 2European Natural Gas Futures Have Come Off The Boil European Natural Gas Futures Have Come Off The Boil European Natural Gas Futures Have Come Off The Boil Chart 3Covid Cases Are Falling In China… It’s Time To Buy: Tactically Upgrading Global Equities To Overweight It’s Time To Buy: Tactically Upgrading Global Equities To Overweight The 20th Chinese National Party Congress is slated for this fall. In the lead-up to the Congress, it is likely that the government will move to diffuse social tensions over its handling of the pandemic by showering the economy with stimulus funds. Of note, the credit impulse has already turned higher, which bodes well for both Chinese growth and growth abroad (Chart 5). Chart 4… But Low Vaccination Rates Among The Elderly Remain A Risk It’s Time To Buy: Tactically Upgrading Global Equities To Overweight It’s Time To Buy: Tactically Upgrading Global Equities To Overweight Chart 5A Rebound In China's Credit Impulse Bodes Well For China And The Rest Of The World A Rebound In China's Credit Impulse Bodes Well For China And The Rest Of The World A Rebound In China's Credit Impulse Bodes Well For China And The Rest Of The World   Inflation Is Peaking On the inflation front, the data flow has gone from unambiguously bad to neutral (and perhaps even slightly positive). In the US, core goods inflation fell by 0.4% month-over-month in April, the first outright decline in core goods prices since February 2021. The Manheim Used Vehicle Value Index has crested and is now 6.4% below its January peak (Chart 6). Global shipping rates have moved up a bit recently on the back of Chinese port shutdowns but remain well below their highs earlier this year (Chart 7). Chart 6Used Car Prices Appear To Have Peaked Used Car Prices Appear To Have Peaked Used Car Prices Appear To Have Peaked Chart 7Global Shipping Rates Are Well Off Their Highs Global Shipping Rates Are Well Off Their Highs Global Shipping Rates Are Well Off Their Highs It Is The Composition Of Spending That Is Distorted Despite the often-heard claim that US consumer spending is well above trend, the reality is that spending is more or less in line with its pre-pandemic trend (Chart 8). It is the composition of spending that is out of line: Goods spending is well above trend while services spending is well below. One might think that only the overall level of spending should matter for inflation, and that the composition of spending is irrelevant. However, this ignores the reality that services prices are generally stickier than goods prices. Companies that sold fitness equipment during the pandemic had no qualms about raising prices. In contrast, gyms barely cut prices, figuring that lower membership fees would do little to drive new business through the door (Chart 9). Chart 8Total US Consumer Spending Is Almost Exactly At Its Pre-Pandemic Trend, But The Composition Of Spending Remains Skewed Total US Consumer Spending Is Almost Exactly At Its Pre-Pandemic Trend, But The Composition Of Spending Remains Skewed Total US Consumer Spending Is Almost Exactly At Its Pre-Pandemic Trend, But The Composition Of Spending Remains Skewed Chart 9Asymmetries Matter: Firms Manufacturing Sports Equipment Jacked Up Prices, But Gyms Barely Cut Prices Asymmetries Matter: Firms Manufacturing Sports Equipment Jacked Up Prices, But Gyms Barely Cut Prices Asymmetries Matter: Firms Manufacturing Sports Equipment Jacked Up Prices, But Gyms Barely Cut Prices This asymmetry matters, and it suggests that goods inflation should continue to fall over the coming months as the composition of spending shifts back to services. A Lull In Wage Growth Wages are the most important determinant of services inflation. While it is too early to be certain, the latest data suggest that wage growth has peaked. The 3-month annualized growth rate in average hourly earnings for production and nonsupervisory workers slowed from 7.2% in the second half of 2021 to 3.8% in April (Chart 10). Assuming productivity growth of around 1.5%, this is consistent with inflation of only slightly more than 2%. Nominal wage growth is a function of both labor market slack and expected inflation. Slack should increase modestly during the rest of the year as labor participation recovers. Chart 11 shows that the labor force participation rate is still about 0.9 percentage points below where one would expect it to be, even adjusting for an aging population and increased early retirements. Chart 10Wage Growth Seems To Be Topping Out Wage Growth Seems To Be Topping Out Wage Growth Seems To Be Topping Out Chart 11Labor Participation Has Further Scope To Recover Labor Participation Has Further Scope To Recover Labor Participation Has Further Scope To Recover Employment has been particularly depressed among lower-wage workers (Chart 12). This should change as more low-wage workers exhaust their savings and are forced to seek employment. According to the Fed, the lowest-paid 20% of workers are the only group to have seen their bank deposits dwindle since mid-2021 (Chart 13). Chart 12More Low-Wage Employees Will Return To Work More Low-Wage Employees Will Return To Work More Low-Wage Employees Will Return To Work Chart 13The Savings Of Low-Wage Workers Are Dwindling The Savings Of Low-Wage Workers Are Dwindling The Savings Of Low-Wage Workers Are Dwindling Inflation expectations should come down as goods inflation recedes and oil prices come off their highs (Chart 14). Bob Ryan, BCA’s Chief Commodity Strategist, sees the price of Brent averaging $86/bbl in the second half of this year, down 16% from current levels.  Central Banks Will Dial Back The Hawkishness With inflation set to fall over the remainder of the year, and financial markets showing increasing signs of stress, the Fed and other central banks will adopt a softer tone. It is worth noting that the median terminal dot for the Fed funds rate actually declined from 2.5% to 2.4% in the March Summary of Economic Projections (Chart 15). Given that markets expect US interest rates to rise to 3.25% in 2023, the Fed may not want investors to further rachet up rate expectations. Chart 14US Inflation Expectations Should Recede If Oil Prices Drop US Inflation Expectations Should Recede If Oil Prices Drop US Inflation Expectations Should Recede If Oil Prices Drop Chart 15Rate Expectations Have Moved Well Above The Fed's Estimate of Neutral Rate Expectations Have Moved Well Above The Fed's Estimate of Neutral Rate Expectations Have Moved Well Above The Fed's Estimate of Neutral   The Bank of England has already veered in a more dovish direction. Its latest forecast, released on May 5, showed real GDP contracting slightly in 2023. Based on market interest rate expectations, the BoE sees headline inflation falling to 1.5% by end-2024, below its target of 2%. Even assuming that interest rates remain at 1%, the BoE believes that inflation will only be slightly above 2% at the end of 2024, implying little need for incremental policy tightening. Not surprisingly, the pound has sold off. We have been tactically short GBP/USD but are using this opportunity to turn tactically neutral. Given favorable valuations, we like the pound over the long run. Chart 16Spending In The Euro Area Is Well Below Its Pre-Pandemic Trend Spending In The Euro Area Is Well Below Its Pre-Pandemic Trend Spending In The Euro Area Is Well Below Its Pre-Pandemic Trend The euro area provides a good example of the dangers of focusing too much on short-term inflation dynamics. Supply-side disruptions stemming from the pandemic and the war in Ukraine have weighed on European growth this year. Yet, those very same factors have also pushed up inflation. Harmonized inflation across the euro area reached 7.5% in April, the highest since the launch of the common currency. The ECB is eager to put some distance between policy rates and the zero bound. However, there is little need for significant tightening. Unlike in the US, spending in the euro area is well below its pre-pandemic trend (Chart 16). If anything, more inflation would be welcome since that would give the ECB scope to bring real rates further into negative territory if economic conditions warrant it. To its credit, the Bank of Japan has stuck with its yield curve control system, even as bond yields have risen elsewhere in the world. Japan’s currency has weakened but given that inflation expectations are too low, and virtually all of its debt is denominated in yen, that is hardly a bad thing. Too Late? Has the surge in bond yields already done enough damage to the global economy to make a recession inevitable? We do not think so. As noted above, much of the recent harm has been caused by various dislocations, namely the war in Ukraine and the ongoing effects of the pandemic. As these dislocations dissipate, inflation will fall and global growth will recover. Despite the hoopla over how the US economy contracted in the first quarter, real private final sales to domestic purchasers (a measure of GDP growth that strips out the effects of changes in government spending, inventories, and net exports) rose by 3.7% at an annualized rate. As Table 1 shows, this measure of economic activity has the highest predictive power for GDP growth one-quarter ahead. Table 1A Good Sign: Real Final Sales To Private Domestic Purchasers Rose By 3.7% In Q1 It’s Time To Buy: Tactically Upgrading Global Equities To Overweight It’s Time To Buy: Tactically Upgrading Global Equities To Overweight Meanwhile, and completely overlooked at this point, S&P 500 earnings have come in 7.3% above expectations so far in Q1, with nearly 80% of S&P 500 companies surprising on the upside. Earnings are up 10.4% year-over-year in Q1. Sales are up 13.6%. Looking out to Q4 of 2022, S&P companies are expected to earn $60.93 in EPS, up 4.3% from what analysts expected at the start of the year. It is also worth noting that homebuilder stocks have basically been flat over the past 30 days, even as the S&P 500 has dropped by nearly 10% over this period. Housing is the most interest rate-sensitive sector of the economy. With the homeowner vacancy rate at record low levels, even today’s mortgage rates may not be enough to push the economy into recession (Chart 17). Economic vulnerabilities are greater outside the US. Nevertheless, there is enough pent-up demand on both the consumer and capital spending side to sustain growth. The Last Hurrah How long will the “Goldilocks” period of falling inflation and supply-side driven growth last? Our guess is about 18 months, starting this summer and lasting until the end of 2023. Unfortunately, as is often the case, the benign environment that will emerge in the second half of this year will sow the seeds of its own demise. Real wages are currently falling across the major economies (Chart 18). That has dampened consumer confidence and spending. However, as inflation comes down, real wage growth will turn positive. This will stoke demand, leading to a reacceleration in inflation, most likely in late 2023 or early 2024. Chart 17Tight Supply Makes Housing More Resilient Tight Supply Makes Housing More Resilient Tight Supply Makes Housing More Resilient Chart 18Real Wages Are Falling In Most Countries Real Wages Are Falling In Most Countries Real Wages Are Falling In Most Countries   In the end, central banks will discover that the neutral rate of interest is higher than they thought. That is good news for stocks in the short-to-medium run because it means that forthcoming rate hikes will not induce a recession. Down the road, however, a higher neutral rate means that investors will eventually need to value stocks using a higher discount rate. It also means that the disinflation we envision over the next 18 months will not last. All this puts us in the rather lonely “transitory transitory” camp: We think much of today’s high inflation will prove to be transitory, but the transitory nature of that inflation will itself be transitory. Be that as it may, the next 18 months of falling inflation and receding recession fears could see stocks recover much of their losses. For most investors, that is too long a period to sit on the sidelines. The “Last Hurrah” for equities is coming. Taking Partial Profits On Our Short Treasury, Long Value/Growth, And Short Bitcoin Trades We continue to think that over a 5-year horizon, bond yields will rise from current levels, value stocks will outperform growth stocks, and crypto prices will fall. However, with the “Last Hurrah” approaching, countertrend rallies are likely. To express this view, we recommend taking half profits on our short 10-year Treasury trade recommendation (up 9.3% from an initial entry yield of 1.45% on June 30, 2021). We are also halving our long global value/growth position (up 20.1% since inception on December 10, 2020), and our short Bitcoin position (up 98% based on our exponential shorting technique). Peter Berezin Chief Global Strategist peterb@bcaresearch.com Global Investment Strategy View Matrix It’s Time To Buy: Tactically Upgrading Global Equities To Overweight It’s Time To Buy: Tactically Upgrading Global Equities To Overweight Special Trade Recommendations Current MacroQuant Model Scores It’s Time To Buy: Tactically Upgrading Global Equities To Overweight It’s Time To Buy: Tactically Upgrading Global Equities To Overweight
Highlights In the short term, the US stock market price will track the 30-year T-bond price, with every 10 bps move in the yield moving the stock market and bond price by 2.5 percent. We think that the bond market will not allow the stock market to suffer a peak-to-trough decline of more than 15-20 percent. Given that the drawdown is already 10 percent, it equates to no more than 20-40 bps of upside for the 30-year T-bond yield, to a level of 2.3-2.5 percent. Hence, we are quite close to an entry-point for both stocks and long-duration bonds. In the next few years, the structural bull market will continue, ending only at the ultimate low in the 30-year bond yield. But on a 5-year horizon, the blockchain will be the undoing of the US stock market – by undermining the vast profits that the US tech behemoths make from owning, controlling, and manipulating our data and the digital content that we create. In that sense, the blockchain will ultimately reveal – and pop – a ‘super bubble’. Fractal trading watchlist: We add Korea and CAD/SEK, and update bitcoin, biotech, and nickel versus silver. Feature Chart of the WeekIf The Market Is Not Far From Its Fundamentals, Can This Really Be A 'Super Bubble'? If The Market Is Not Far From Its Fundamentals, Can This Really Be A 'Super Bubble'? If The Market Is Not Far From Its Fundamentals, Can This Really Be A 'Super Bubble'? Why has the stock market started 2022 on such a poor footing? Chart I-2 and Chart I-3 identify the main culprit. Through the past year, the tech-heavy Nasdaq index has been tracking the 30-year T-bond price on a one-for-one basis, while the broader S&P 500 shows a connection that is almost as good. Chart I-2The Nasdaq Has Been Tracking The 30-Year T-Bond Price One-For-One... The Nasdaq Has Been Tracking The 30-Year T-Bond Price One-For-One... The Nasdaq Has Been Tracking The 30-Year T-Bond Price One-For-One... Chart I-3…The S&P 500 Has Also Been Tracking The 30-Year T-Bond Price ...The S&P 500 Has Also Been Tracking The 30-Year T-Bond Price ...The S&P 500 Has Also Been Tracking The 30-Year T-Bond Price Therefore, as the 30-year T-bond price has taken a tumble, so have growth-heavy stock markets. Put simply, the ‘bond component’ of these stock markets has been dominating recent performance, overwhelming the ‘profits component’ which tends to move more glacially. It follows that the short-term direction of the stock market has been set – and will continue to be set – by the direction of the 30-year T-bond price. Stocks And Bonds Are Nearing A ‘Pinch Point’ The next few paragraphs are necessarily technical, but worth absorbing – as they are fundamental to understanding the stock market’s recent sell-off, as well as its future evolution. The duration of any investment quantifies how far into the future its cashflows lie, by averaging those cashflows into one theoretical future ‘lump sum’. For a bond, the duration also equals the percentage change in the bond price for every 1 percent change in its yield.1 Crucially, the duration of the US stock market is the same as that of the 30-year T-bond, at around 25 years. Therefore, if all else were equal, the US stock market price should track the 30-year T-bond price, with every 10 bps move in the yield moving the stock market and bond prices by 2.5 percent. In the long run of course, all else is not equal. The 30-year T-bond generates a fixed income stream, whereas the stock market generates income that tracks profits. Allowing for this difference, the US stock market should track: (The 30-year T-bond price) multiplied by (profits expected in the year ahead) multiplied by (a constant) In which the constant expresses the theoretical lump-sum payment 25 years ahead as a multiple of the profits in the year ahead – and thereby quantifies the expected structural growth in profits. We can ignore this constant if the structural growth in profits does not change. Nevertheless, remember this constant, as we will come back to it later when we discuss a putative ‘super bubble’. The ‘bond component’ of the stock market has been dominating recent performance. This model for the stock market seems simplistic. Yet it provides an excellent explanation for the market’s evolution through the past 40 years (Chart I-4), as well as through the past year in which, to repeat, the bond component has been the dominant driver. Chart I-4The US Stock Market = The 30-Year T-Bond Price Multiplied By Profits The US Stock Market = The 30-Year T-Bond Price Multiplied By Profits The US Stock Market = The 30-Year T-Bond Price Multiplied By Profits In the short term then, given the 25 year duration of the US stock market, every 10 bps rise in the 30-year T-bond yield will drag down the stock market by 2.5 percent. We can also deduce that the sell-off will be self-limiting and self-correcting, because at some ‘pinch point’ the bond market will assess that the deflationary impulse from financial instability will snuff out the recent inflationary impulse in the economy. Where is that pinch point? Our sense is that the bond market will not allow the stock market to suffer a peak-to-trough decline of more than 15-20 percent. Given that the drawdown is already 10 percent, it equates to no more than 20-40 bps of upside for the 30-year T-bond yield, to a level of 2.3-2.5 percent. Hence, we are quite close to an entry-point for both stocks and long-duration bonds. The Case Against A ‘Super Bubble’ (And The Case For) As is typical, the recent market setback has unleashed narratives of an almighty bubble starting to pop. Stealing the headlines is value investor Jeremy Grantham of GMO, who claims that “today in the US we are in the fourth super bubble of the last hundred years.” Is there any merit to Mr. Grantham’s claim? An investment is in a bubble if its price has completely broken free from its fundamentals. For example, in the dot com boom, the stock market did become a super bubble. But as we have just shown, the US stock market today is not that far removed from its fundamental components of the 30-year T-bond price multiplied by profits. At first glance then, Mr. Grantham appears to be wrong (Chart of the Week). Still, if the underlying components – the 30-year T-bond and/or profits – were in a bubble, then the stock market would also be in a bubble. In this regard, isn’t the deeply negative real yield on long-dated bonds a sure sign of a bubble? The answer is, not necessarily. As we explained last week in Time To Get Real About Real Interest Rates, the deeply negative real yield on Treasury Inflation Protected Securities (TIPS) is premised on an expected rate of inflation that we should take with a huge dose of salt. Putting in a more realistic forward inflation rate, the real yield on long-dated bonds is positive, albeit just. What about profits – are they in a bubble? The US (and world) profit margin stands at an all-time high, around 20 percent greater than its post-GFC average (Chart I-5). But a 20 percent excess is not quite what we mean by a bubble. Chart I-5Profit Margins Are At An All-Time High Profit Margins Are At An All-Time High Profit Margins Are At An All-Time High There is one final way that Mr. Grantham could be right, and for this we must come back to the previously mentioned constant which quantifies the expected long-term growth in profits. If this expected structural growth were to collapse, then the stock market would also collapse. This is precisely what happened to the non-US stock market after the dot com bust, when the expected structural growth – and therefore the structural valuation – phase-shifted sharply lower (Chart I-6 and Chart I-7). As a result, the non-US stock market also phase-shifted sharply lower from the previous relationship with its fundamentals (Chart I-8). Could the same ultimately happen to the US stock market? Chart I-6The Structural Growth And Valuation Of Non-US Stocks Phase-Shifted Down... The Structural Growth And Valuation Of Non-US Stocks Phase-Shifted Down... The Structural Growth And Valuation Of Non-US Stocks Phase-Shifted Down... Chart I-7...Could The Same Happen To ##br##US Stocks? ...Could The Same Happen To US Stocks? ...Could The Same Happen To US Stocks? Chart I-8Non-US Stocks Phase-Shifted Lower From Their Previous Relationship With Fundamentals Non-US Stocks Phase-Shifted Lower From Their Previous Relationship With Fundamentals Non-US Stocks Phase-Shifted Lower From Their Previous Relationship With Fundamentals The answer is yes – and the main risk comes from the blockchain and its threat to the pseudo-monopoly status that the US tech behemoths have in owning, controlling, manipulating, and monetising our data and the digital content that we create. If the blockchain returned that ownership and control back to us, it would devastate the profits of Facebook, Google, and the other behemoths that dominate the US stock market. If the expected structural growth were to collapse, then the stock market would also collapse. That said, the blockchain is a long-term risk to the stock market, likely to manifest itself on a 5-year horizon. Before we get there, in the next deflationary shock, the 30-year T-bond yield has the scope to decline by at least 150 bps, equating to a 40 percent increase in the ‘bond component’ of the US stock market. To conclude, the structural bull market will end only at the ultimate low in the 30-year bond yield. And then, the blockchain will reveal – and pop – a ‘super bubble’. Fractal Trading Watchlist This week we add Korea and CAD/SEK, and update bitcoin, biotech, and nickel versus silver. Of note, the near 30 percent underperformance of Korea through the past year has reached the point of fractal fragility that has signalled previous major reversals in 2015, 2017 and 2019 (Chart I-9). Accordingly, this week’s recommended trade is to go long Korea versus the world (MSCI indexes), setting the profit target and symmetrical stop-loss at 8 percent.  Chart I-9Korea Is Approaching A Turning Point Versus The World Korea Is Approaching A Turning Point Versus The World Korea Is Approaching A Turning Point Versus The World Korea Approaching A Turning Point Versus EM Korea Approaching A Turning Point Versus EM Korea Approaching A Turning Point Versus EM CAD/SEK Could Reverse CAD/SEK Could Reverse CAD/SEK Could Reverse Bitcoin Near A First Support Level Biotech Approaching A Major Buy Biotech Approaching A Major Buy Biotech Approaching A Major Buy Biotech Approaching A Major Buy Biotech Approaching A Major Buy Nickel Approaching A Sell Versus Silver Nickel Approaching A Sell Versus Silver Nickel Approaching A Sell Versus Silver Dhaval Joshi Chief Strategist dhaval@bcaresearch.com Footnotes 1 Defined fully, the duration of an investment is the weighted average of the times of its cashflows, in which the weights are the present values of the cashflows. Fractal Trading System Fractal Trades The Case Against A ‘Super Bubble’ (And The Case For) The Case Against A ‘Super Bubble’ (And The Case For) The Case Against A ‘Super Bubble’ (And The Case For) The Case Against A ‘Super Bubble’ (And The Case For) 6-Month Recommendations Structural Recommendations Closed Fractal Trades Indicators To Watch - Bond Yields Chart II-1Indicators To Watch - Bond Yields - ##br##Euro Area Indicators To Watch - Bond Yields - Euro Area Indicators To Watch - Bond Yields - Euro Area Chart II-2Indicators To Watch - Bond Yields - ##br##Europe Ex Euro Area Indicators To Watch - Bond Yields - Europe Ex Euro Area Indicators To Watch - Bond Yields - Europe Ex Euro Area Chart II-3Indicators To Watch - Bond Yields - ##br##Asia Indicators To Watch - Bond Yields - Asia Indicators To Watch - Bond Yields - Asia Chart II-4Indicators To Watch - Bond Yields - ##br##Other Developed Indicators To Watch - Bond Yields - Other Developed Indicators To Watch - Bond Yields - Other Developed   Indicators To Watch - Interest Rate Expectations Chart II-5Indicators To Watch - Interest Rate Expectations Indicators To Watch - Interest Rate Expectations Indicators To Watch - Interest Rate Expectations Chart II-6Indicators To Watch - Interest Rate Expectations Indicators To Watch - Interest Rate Expectations Indicators To Watch - Interest Rate Expectations Chart II-7Indicators To Watch - Interest Rate Expectations Indicators To Watch - Interest Rate Expectations Indicators To Watch - Interest Rate Expectations Chart II-8Indicators To Watch - Interest Rate Expectations Indicators To Watch - Interest Rate Expectations Indicators To Watch - Interest Rate Expectations