Developed Countries
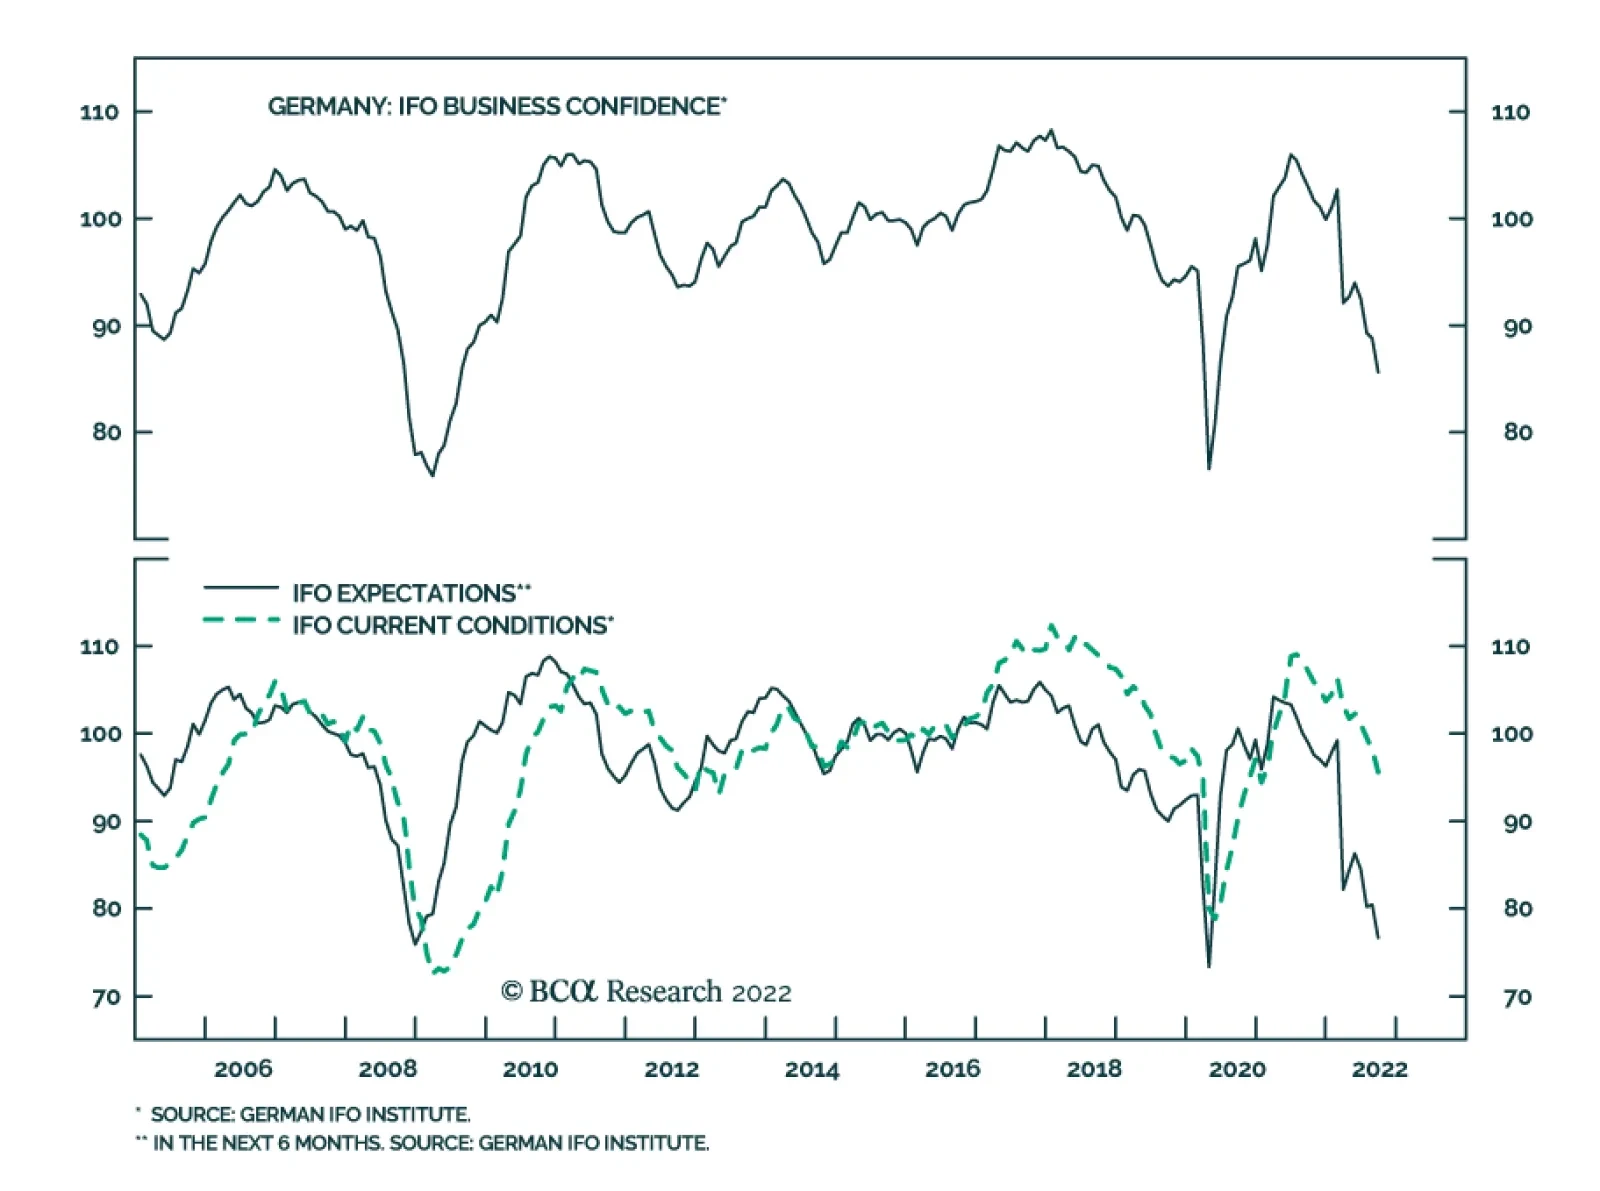
The German Ifo Business Climate Index weakened further in September, sliding from 88.6 to 84.3, below expectations of a milder deterioration to 87.0. The current situation and expectations sub-components ticked down 3.0 points and 5.3 points, respectively,…
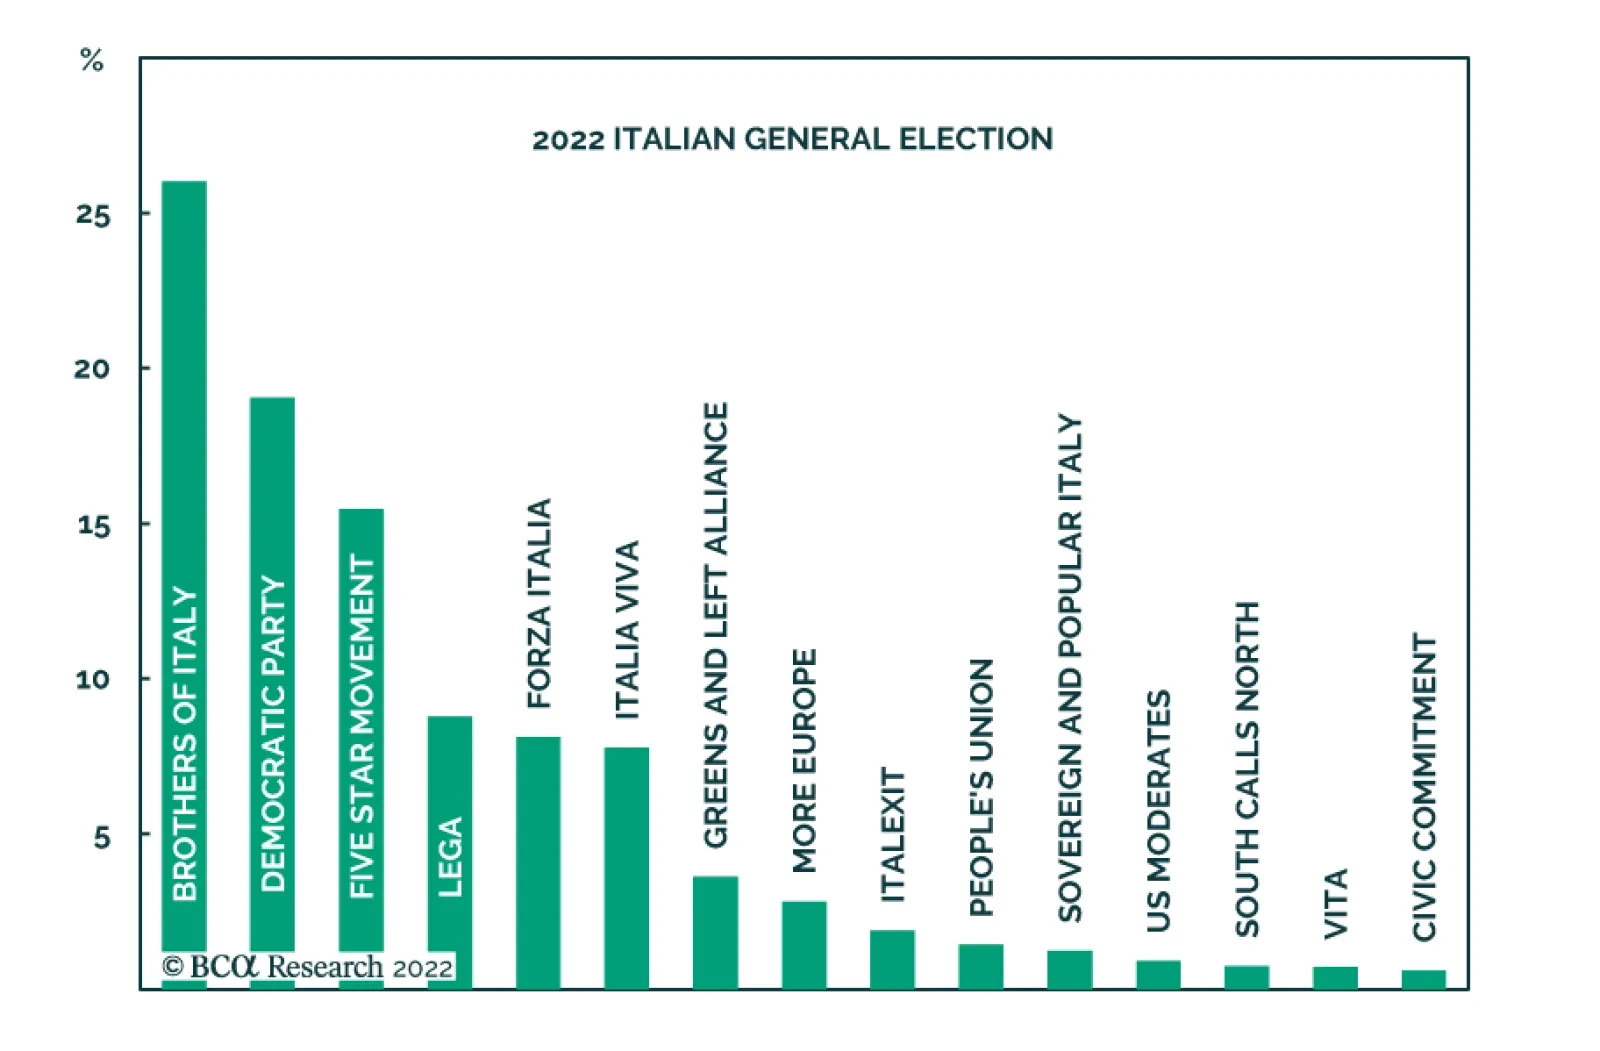
Italy’s right-wing coalition led by Giorgia Meloni of the far-right Brothers of Italy party –which also includes the League and Forza Italia – secured 44% of the vote in Sunday’s general election. Italian government bond yields rose 21bps on Monday following…

Sterling collapsed to an all-time low in intra-day trading on Monday. The weakness follows UK Chancellor Kwasi Kwarteng’s Friday mini-budget announcement and weekend comments that more tax cuts are coming. The Bank of England’s Monday pledge that “the MPC…
According to BCA Research’s European Investment Strategy service for investors concerned with the left-tail risk in European equities, European credit offers a credible alternative in the near term. This asset class is also attractive relative to European…

Executive Summary We hold to our view that households are in better shape than widely perceived, nourished by a robust labor market and a formidable supply of pandemic savings. We do not believe that the equity bear market will derail our base-case scenario that consumption will keep the economy afloat over the next several quarters. Empirically, changes in equity wealth have exerted little to no impact on consumption. Housing does have a discernible wealth effect, and consumption may be more sensitive to falling home prices than rising ones. The sharp decline in home prices feared by many investors could prompt homeowners to retrench, realizing the number-one risk to our constructive view. Although home price appreciation is in the process of decelerating, housing remains undersupplied and home prices will not fall precipitously. Housing bubble chatter is unfounded. Consumption Declines Are Few And Far Between
Consumption Declines Are Few And Far Between
Consumption Declines Are Few And Far Between
Bottom Line: Neither the equity bear market nor a softening housing market will stifle consumption. The Fed’s anti-inflation campaign will eventually induce a recession, but wealth effect concerns are overblown. Feature Flush consumers drawing down the mountain of excess savings they accumulated across 2020 and 2021 provide the foundation for our constructive near-term view on risk assets and the economy. Consumer retrenchment is one of the two principal risks to our stance1 and we would abandon it if a meaningful share of households began to cut back. We do not know that households will dip into their savings to keep consuming at something close to their trend pace – the scale of the fiscal transfers that fattened their bank accounts was unprecedented – but we view the low and declining savings rate as providing ongoing validation for our thesis. Households can sustainably dis-save relative to their post-crisis trend (Chart 1), as a 5% savings rate whittles down their remaining $2.1 trillion stash by just $150 billion per quarter. Chart 1An Extended Period Of Dis-saving Is Sustainable
An Extended Period Of Dis-saving Is Sustainable
An Extended Period Of Dis-saving Is Sustainable
The wealth effect is real – household spending fluctuates with wealth – and one may question whether consumers will continue to spend amidst an equity bear market while the 3-percentage-point surge in mortgage rates pressures home values. As counterintuitive as it may seem, however, changes in equity wealth have had a modest and inconsistent effect on consumption. Changes in housing wealth have exerted greater influence, and one study by prominent researchers suggests that the effect is stronger when home prices decline. We consider the empirical evidence regarding equity and housing wealth effects, along with the prospects for a sharp decline in home prices, in this report. What Drives Spending? For all the talk of the wealth effect, consumer spending is predominantly a function of income. Every multi-factor regression we performed (Box 1) indicated that changes in nominal income account for the lion’s share of changes in nominal consumption, with estimates ranging up to 75%. When we regressed real consumption with real income and real measures of equity and housing wealth, the estimates of income’s effect were sharply lower – typically between 10 and 25% – but the modeled results were dramatically less robust. We accordingly focus on the nominal relationships in the rest of this report, though we note that the real regressions reinforced the nominal regressions’ pointed implication that changes in equity wealth are largely irrelevant for explaining changes in consumption. Box 1: A Regression Refresher Multi-factor linear regression is a statistical method for determining which independent variables influence the movements of a dependent variable. Regression analysis reveals the statistical significance of independent variables based on their empirical relationship with the dependent variable. If the relationship is robust enough that it is unlikely to have occurred randomly, the independent variable is deemed to be significant. The regression equation describes a best-fit line that minimizes the individual observations’ aggregate deviation from the line. It includes a constant term, b, marking the point where the best-fit line intersects the y-axis, and an x term that denotes each of the independent variables, paired with a coefficient, a. Each coefficient describes the sensitivity of the dependent variable to changes in the value of each independent variable. For dependent variable y, and independent variables x1, x2, …, xn, the equation is written as: y = a1x1 + a2x2 + … + anxn + b. The robustness of the regression is indicated by its r-squared value, ranging from 0 to 1, which quantifies the share of the dependent variable's movement that is explained by movement in the independent variables. In our research, we used Personal Consumption Expenditures and Personal Income from the National Income Accounts as our measures of consumption and income, respectively. We used the measure of corporate equities held by households and nonprofit organizations from the Fed’s quarterly Financial Accounts of the United States (report Z.1) to measure equity wealth and followed the methodology of Case, Quigley and Shiller (2005 and 2013)2 to calculate housing wealth.3 We also followed Case, Quigley and Shiller’s methodology in regressing the year-over-year percentage change in the natural log of the variables’ values. Homes Trump Stocks Simple regressions, measuring the empirical impact of a single independent variable upon a dependent variable, indicate that changes in equity wealth exert considerably less influence over changes in consumption than changes in housing wealth. With a two-quarter lag, year-over-year consumption has changed by nearly three cents for every dollar move in equity wealth (Chart 2). Three cents are in line with rule-of-thumb estimates, but we note that the regression’s r-squared is less than 3%. An unlagged year-over-year regression posits a 0.6-cent consumption change for every dollar move in equity wealth with a microscopic r-squared of 0.1%. Chart 2Equities' Relationship With Consumption Is Weak And Unreliable, ...
The Wealth Of Households
The Wealth Of Households
The housing wealth regression indicates that every dollar of changes in housing wealth leads to a 38-cent change in consumption. With a 38% r-squared, the housing wealth regression generates a visibly tighter fit (Chart 3), inspiring more confidence in the posited relationship, though it is incomplete without considering any other variables’ role in influencing consumption. The housing wealth relationship is also considerably stronger on an unlagged basis (Table 1). Chart 3... Contrasting With Housing's Stronger, More Consistent Pull
The Wealth Of Households
The Wealth Of Households
Table 1Simple Regression Output
The Wealth Of Households
The Wealth Of Households
Chart 4Equities Are Owned By Low MPC Households
The Wealth Of Households
The Wealth Of Households
It may seem surprising that relatively opaque changes in housing wealth exert a much stronger influence over consumption than immediately observable changes in equity wealth. We think the result is a function of the greater breadth of home ownership; nearly two-thirds of households own their home, and it is far and away the largest asset for all but the wealthiest of families. Stock ownership, on the other hand, is highly concentrated, with the top 1% of households by wealth owning over 50% of equities, and the top 10% owning nearly 90% of them (Chart 4). Fluctuations in the stock market mostly impact households with a low marginal propensity to consume but changes in home prices effect a much fuller sweep of Americans. The simple regressions set the stage for what we discovered when we performed multi-factor regressions, confirming previous researchers’ findings. Income is the primary driver of consumption, with a one-dollar change in nominal income provoking a 65-to-72-cent change in nominal spending, and its statistical significance in the models is beyond question (Table 2). Table 2Multiple Regression Output
The Wealth Of Households
The Wealth Of Households
Equities’ wealth effect is not statistically significant in the unlagged model at a 5% significance level (it’s not even statistically significant at the more forgiving 10% significance level) and it is modest (about 1.5 cents on the dollar) in any event. The model would be better off without including equity wealth as an independent variable. In the model lagging consumption by two quarters, which produces a slightly better fit and accords more easily with our own intuition that wealth effects are not felt instantaneously, consumption moves inversely with equity wealth, falling 3 cents for every one-dollar increase in equity wealth and rising 3 cents for every one-dollar decrease. That result is statistically significant, albeit hard to wrap one’s head around. The housing wealth variable is comfortably significant even at a 1% significance level and its impact is quite large in both the unlagged (14.5 cents on the dollar) and the two-quarter-lagged (11.75 cents on the dollar) specifications. Both model specifications generate high r-squareds, explaining 58% and 60% of the variability in consumption, respectively, and the modeled values fit the actual values extremely well before the pandemic scrambled the relationship between consumption and its drivers (Chart 5). Chart 5A Tight Fit Before The Pandemic
A Tight Fit Before The Pandemic
A Tight Fit Before The Pandemic
We also ran a version of the model that substituted Disposable Income for Personal Income, but it slightly weakened its explanatory power and we judge that the broader Personal Income series is a better input. We also ran a version of the model that used household real estate holdings and mortgage balances from the Fed’s quarterly Z.1 report to calculate a factor that translates gross housing wealth to net housing wealth to reflect that all households do not own their homes free and clear.4 Substituting net housing wealth reduced the model’s explanatory power by about two percentage points but left the individual variables’ significance largely intact while cutting housing’s unlagged and two-quarter lagged wealth effect to 7 and 5 cents, respectively (Table 3). Net housing wealth is more intellectually satisfying than gross housing wealth and the smaller wealth effect estimates are more in line with the peer-reviewed literature. Table 3Multiple Regression Output With Net Housing Wealth
The Wealth Of Households
The Wealth Of Households
Whither Home Prices? Investors appear to be braced for a sizable decline in home prices even though nominal price declines are unusual in the five-decade history of the leading repeat sales price indexes. The Case-Shiller National Index has declined just 19% of the time on a sequential basis and 14% of the time on a year-over-year basis (Chart 6). Excepting the 21 consecutive quarters of year-over-year declines from 1Q07 through 1Q12, the Case-Shiller National Index has declined in just five quarters over 41 years, all during the 1990-91 recession that featured tax law changes sharply curtailing individuals’ ability to benefit from losses on real estate investments. The FHFA (née OFHEO) House Price Index has declined on a year-over-year basis just 11% of the time, with only one decline occurring outside of 2007 to 2012 (Chart 7). Chart 6Ex-The Crisis, Declines Are Rare, ...
Ex-The Crisis, Declines Are Rare, ...
Ex-The Crisis, Declines Are Rare, ...
Chart 7... In Both Major Series
... In Both Major Series
... In Both Major Series
Investors expecting a decline therefore appear to be anchoring to an extreme outlier. We cringe whenever we hear the term “housing bubble” used to liken today’s backdrop to the one that preceded the financial crisis. Make no mistake: it is not 2007 in the housing finance market in any way, shape or form. Residential mortgage originations have been made to vastly better borrowers than they were in the run-up to the crisis (Chart 8) and they’ve been made on far more solid terms, as the loan-to-value ratio for residential mortgages has shrunk by 25 percentage points in the immediate aftermath of the bust to its easily sustainable levels of the early ‘80s (Chart 9). Chart 8Mortgages Have Been Extended To Better Borrowers ...
The Wealth Of Households
The Wealth Of Households
Chart 9... On Better Terms Than Before The Crisis
... On Better Terms Than Before The Crisis
... On Better Terms Than Before The Crisis
Chart 10Housing Supply Is Tight
Housing Supply Is Tight
Housing Supply Is Tight
Housing is broadly undersupplied, as evidenced by the record-low home vacancy rate (Chart 10). Higher mortgage rates have surely put monthly payments out of the reach of some aspiring buyers, sending them to the sidelines, but supply remains constrained and home prices fall slowly. Kahneman and Tversky demonstrated that people are quick to take gains by selling appreciated assets but slow to part with assets that are under water. Even if we are underestimating the eventual magnitude of a decline in home prices, we are confident that the decline will not be sudden. Homeowners with discretion over when they sell will wait to exercise it; turnover will slow as pricing softens and the reduced supply will help to mitigate the declines. Investment Implications We were inspired to explore the housing wealth effect by a striking assertion featured in a leading market periodical two weeks ago. An independent strategist stated that the wealth effect from a one dollar decline in home prices was a whopping 40 cents, while the effect of a like decline in equity prices was 10 cents. The assertion was passed on without comment or criticism by the publication, which has long touted its skepticism and unwillingness to accept bullish statements at face value. Alas for its readers, the standard apparently does not apply to bearish claims, no matter how far off the beam they may be. (Based on our results, we suspect these wealth effect estimates are based on simple regressions.) Divergent views are what make a market, but nothing in the body of peer-reviewed research supports the idea that the $6.5 trillion decline in directly owned equities and a hypothetical 10% decline in home equity from its nearly $30 trillion June 30th level will extinguish $650 billion and $1.2 trillion of consumption, respectively. That nearly $2 trillion hit would be punishing, given consumption's current $17 trillion annualized pace. It would also be unprecedented: since the Personal Consumption Expenditures series began in 1950, nominal consumption has only ever declined by a margin that can be seen by the naked eye during the Great Recession and the COVID pandemic (Chart 11). Those historic declines amounted to 3.5% from the 3Q08 peak to the 2Q09 trough and 11.4% from the 4Q20 peak to the lockdown 2Q21 trough. Chart 11Visible Declines In Nominal Spending Are Rare
Visible Declines In Nominal Spending Are Rare
Visible Declines In Nominal Spending Are Rare
We are only too happy to take the other side of the view that another 11% decline could be in store, assuming the absence of nuclear war or another pandemic. We think the 3.5% Great Recession decline will likely remain out of reach, as well, given that the financial crisis emerged from a concatenation of events that cannot repeat now that regulators have so thoroughly clipped the banking system’s wings. Not every investor subscribes to Chicken Little warnings about the housing market, but the promiscuity with which the term bubble is thrown around strongly suggests to us that the consensus view overestimates the probability of a dire economic outcome. When subsequent events reveal that the shock probability has been overstated, the consensus economic and S&P 500 earnings views will have to be revised upward and we believe the eventual revisions will provide risk assets with a path to recover some of the ground they’ve lost this year. We continue to believe that it would be premature to implement full-on defensive asset allocation measures before they do. Doug Peta, CFA Chief US Investment Strategist dougp@bcaresearch.com Footnotes 1 A breakout in long-run inflation expectations is the other. 2 Case, Karl E., John M. Quigley, and Robert J. Shiller, “Comparing Wealth Effects: the Stock Market versus the Housing Market,” Advances in Microeconomics, 5(1),2005: 1-32. Case, Karl E., John M. Quigley, and Robert J. Shiller, “Wealth Effects Revisited: 1975-2012,” NBER Working Paper 18667, January 2013. 3 Case, Quigley and Shiller calculate housing wealth in time t, HWt, as the product of the number of US households, Nt, the homeownership rate, ORt, the average price of a single-family home in the base period (1Q75 in our study), AVGBASE, and a weighted repeat sales price index relative to its base period value, (PIt/PIBASE). We used the National Association of Realtors’ average existing home price series and the Case-Shiller National Index for variables AVG and PI, respectively, as per the following equation: HWt = Nt × ORt × AVG1Q75 × (PIt/PI1Q75) 4 HWt, described in the second footnote, is a gross measure of housing wealth. We divided outstanding mortgage debt by the value of households’ real estate holdings to calculate the aggregate residential mortgage loan-to-value ratio, LTV. We subtracted LTV from 1 to calculate the share of housing value that represented households’ aggregate home equity and multiplied it by HWt to produce an estimate of net housing wealth, NHW: NHWt = HWt × (1 – LTVt)
Executive Summary The USD has appreciated by over 25% since the beginning of 2021. This is a negative for US corporate sales and profits and is a drag on US equity performance. According to BCA FX strategists, the USD is likely to roll over as it appears overbought and overvalued. However, even if the USD has peaked, the effects of its appreciation will be imprinted in the earnings of US corporates for months. Our earnings model signals an earnings recession, with earnings expected to contract to the tune of 20% into the year-end. Technology and Materials are most exposed to the dollar, while Utilities, Financials, and Real Estate are the most domestic sectors. Growth is a more international style than Value, while midcaps offer the best protection from a stronger greenback. USES Model Breakdown
Should US Equity Investors Worry About The Dollar?
Should US Equity Investors Worry About The Dollar?
Bottom Line: While a strong dollar is certainly a headwind for US earnings growth and for the performance of US equities, its adverse effects are minor compared to the effects of tighter monetary policy, slowing growth at home and abroad, rising costs, falling productivity, and fading pricing power. An earnings recession is inevitable. Dollar depreciation will be a welcome development, yet the dollar should be the least of investors’ worries. Feature The USD has appreciated by over 25% since the beginning of 2021 (Chart 1), a concerning development for US equity investors. The S&P 500 companies derive roughly 40% of sales from abroad and the strong dollar is a headwind: Not only does an appreciating domestic currency diminish foreign earnings through a currency translation effect, but it also makes US goods and services more expensive and less competitive in a global marketplace. Related Report US Equity StrategyUS Dollar Bear Market: What To Buy & What To Sell Over the past few months, a number of US multinationals have complained about the adverse effect of the strong greenback on their sales and earnings. The list is both long and diverse and includes technology giants like Microsoft, Dell, and Netflix as well as the likes of Philip Morris, Johnson and Johnson, TJX, and Costco. Investors paid attention: Since the beginning of 2021, US companies with a high share of international sales underperformed their more domestically oriented counterparts by about 20% (Chart 2). However, partially this divergence in performance may be explained by the international index heavily overrepresenting Tech, which has headwinds of its own. Chart 1The USD Has Appreciated By Over 25%
The USD Has Appreciated By Over 25%
The USD Has Appreciated By Over 25%
Chart 2US Multinationals Have Underperformed
US Multinationals Have Underperformed
US Multinationals Have Underperformed
In this week’s report, we will analyze the effects of the stronger dollar on US corporate earnings, zooming in on its implications for the S&P 500 sectors and styles. Sneak Preview: A strong dollar is a definite negative for US corporate sales and profits and is a drag on US equity performance. However, when compared in magnitude to the effects of tighter monetary policy, slowing growth, and rising costs – the dollar should take a backseat to the other investor worries. USD: The Best House On The Worst Street The reasons for the rapid rise of the USD are manifold. The following are just a few: The Dollar smile: The USD outperforms when global growth is strong and investors are optimistic, as well as when growth slows and investors are fearful, benefiting from its status as a reserve currency. Over the past two years, both scenarios have played out. In 2021, investor flows pushed the dollar higher as the US was ahead of the rest of the world in terms of post-pandemic recovery. This year, the USD became a safe haven for jittery investors and became one of the rare assets delivering positive returns in the “sea of misery.” Chart 3Rate Differentials Favored The US
Rate Differentials Favored The US
Rate Differentials Favored The US
The US looks good compared to other regions: Despite its own economic maladies, such as high inflation and slowing growth, the US has been in an advantageous position compared to the rest of the world. The US appears well insulated from global shudders compared to Europe, which is in the midst of a recession and an energy crisis, China roiling from the zero-COVID policy and property market fallout, and EM countries on the verge of food and energy shortages. Interest rate differentials: The Fed is being viewed as the most credible central bank to curb inflation. As a result, US rates have risen more than in other markets (Chart 3). The USD has been strengthening as the US has been enjoying relative stability and better growth compared to the other regions. The Fed is also ahead of the curve. Will The USD Appreciation Continue? BCA FX Strategist Chester Ntonifor does not expect the dollar to continue to appreciate for the following reasons: While the Fed is ahead of the curve, other central banks are also becoming more hawkish. As such, interest rate differentials will not materially move further in favor of the dollar. Inflation is a global problem as opposed to US-centric. Thanks to the Fed’s aggressive policy stance compared to the other central banks, the inflation impulse is slowing in the US, relative to a basket of G10 countries (Chart 4). In addition, the dollar is expensive, overbought, and is a crowded consensus trade (Chart 5). Chart 4The US Inflation Impulse Has Turned
The US Inflation Impulse Has Turned
The US Inflation Impulse Has Turned
Chart 5The Dollar Is Overvalued On A PPP Basis
The Dollar Is Overvalued On A PPP Basis
The Dollar Is Overvalued On A PPP Basis
We concur. While we will not outright bet against the dollar, to our mind, risks are skewed to the downside. The dollar must be close to its peak, and we are neutral on a tactical basis. Effects Of USD Moves On S&P 500 Sales And Earnings Growth It Takes Time While US dollar appreciation may have come to an end, its toll will be imprinted on US earnings growth for a while. There is a lag between currency appreciation and its effects on company sales and earnings: It takes companies three to six months to change contracts, adjust prices and record revenue (Table 1). Stronger Dollar: Lower Sales And Lower Costs It is foreign sales that are most affected by the variation in the purchasing power of foreign currencies relative to the dollar (Chart 6). And while US multinationals hate the strengthening dollar, they also get a hand from it on the cost side of the equation, especially if they outsource a sizeable part of production abroad. Thus, the net effect on profits depends on the cost structure and the type of business. That explains why changes in the dollar are never one-to-one to changes in earnings growth. Table 1Sensitivity Of EPS YoY% To USD YoY% Over Time
Should US Equity Investors Worry About The Dollar?
Should US Equity Investors Worry About The Dollar?
Modeling Effects Of A Stronger Dollar In the “Is An Earnings Recession In The Cards?” report published this past June, we introduced our EPS Growth Forecast Model (Table 2). The model has five intuitive factors: Chart 6The USD Primarily Affects Sales
The USD Primarily Affects Sales
The USD Primarily Affects Sales
Table 2EPS Growth Forecast Model
Should US Equity Investors Worry About The Dollar?
Should US Equity Investors Worry About The Dollar?
ISM PMI is a gauge of US economic growth and a proxy for top-line growth. PPI stands for the change in costs. Pricing Power is a BCA proprietary indicator and captures companies’ ability to pass costs onto their customers. HY Spreads indicate costs of borrowing and also the state of the economy (spreads tend to shoot up in a slowing economy). USD represents the ability of US multinationals to sell goods abroad. These five factors explain 65% of the variation in earnings growth,1 and all factors are statistically significant. Earnings Recession Is Still In The Cards Back in June, we predicted an earnings recession later this year. After all, economic growth is slowing at home and abroad, and demand is rolling over while costs are rising, especially wages. Making things worse, productivity is falling, and Unit Labor Costs (ULC) hit nearly 10% in August. At the same time, consumers are reeling from rising prices, while companies are coming to realize that their ability to pass on costs to customers is pushing the limit. We have updated the model with three more months of data and expect earnings to start contracting in the third quarter, falling as much as 20% in the fourth quarter (Chart 7). None of this is surprising. S&P 500 margins have fallen by 2% in the second quarter, and earnings growth ex Energy came in at -2% on a nominal basis. Analysts expect six out of 11 S&P 500 sectors to deliver negative EPS Growth in Q3-2022. And while a 20% earnings drawdown sounds terrible, it is fairly mild compared to recent recessions – at the worst point in 2008, nominal earnings went to 0, printing a -100% contraction (Table 3). Chart 7The BCA Earnings Model Predicts A Earnings Recession Later This Year
The BCA Earnings Model Predicts A Earnings Recession Later This Year
The BCA Earnings Model Predicts A Earnings Recession Later This Year
Table 3The S&P 500 Earnings Drawdowns
Should US Equity Investors Worry About The Dollar?
Should US Equity Investors Worry About The Dollar?
Here, we would like to emphasize that financial econometrics is not an exact science, and earnings growth point estimates are rarely precise. However, it is abundantly clear that earnings growth will trend well past the zero mark. Costs And Pricing Power Are Key Drivers Of S&P 500 Earnings In 2022 Breaking down the negative earnings growth forecast into contributions from different factors (Chart 8), we observe that the outcome is mostly driven by the interplay between PPI and Pricing Power – costs are rising and companies’ ability to pass them on further defines their profitability. And while commodity prices have fallen, these changes will take a while to flow into earnings. In addition, tighter monetary policy and slowing growth are the new speed bumps (HY Spreads and ISM PMI). Chart 8Interplay Of PPI And Pricing Power Drives The Direction Of Earnings
Should US Equity Investors Worry About The Dollar?
Should US Equity Investors Worry About The Dollar?
Chart 9The USD Contribution Is Negative…
The USD Contribution Is Negative…
The USD Contribution Is Negative…
USD Is Less Important So what about the dollar? According to our model, 1% of dollar appreciation is shaving off roughly 50bps from earnings growth. However, we need to keep this number in context. While the dollar has appreciated more than 25% since the beginning of 2021, only the last three to six months matter on a rolling basis. And over the past three months, USD has appreciated by about 8%, which will detract 4% from earnings in Q4-2022 (Chart 9). The importance of the USD for earnings growth is fairly minor compared to the other factors, such as pricing power, PPI, HY spreads, and ISM PMI (Chart 10). Chart 10... But Is Minor Compared To The Other Factors
Should US Equity Investors Worry About The Dollar?
Should US Equity Investors Worry About The Dollar?
Bottom Line: A strong dollar is a headwind for earnings growth. However, its effects are dwarfed by other factors. Sectors Most Affected By The Strong Currency And Weakening Global Growth Table 4The S&P 500: % Of Foreign Sales By Sector
Should US Equity Investors Worry About The Dollar?
Should US Equity Investors Worry About The Dollar?
While the overall negative effect of a strong dollar on the S&P 500 earnings is relatively minor, some sectors in the index are more exposed than others (Table 4). While the S&P 500 derives about 40% of sales from abroad, the Technology and Materials sectors have about 60% of foreign sales, and for the companies in these sectors, a strong currency is a serious concern. Utilities, Financials, and Real Estate are the most domestic in the index. It is important to note, that, at present, US multinationals are dealing not only with the effects of a stronger currency but also with global growth slowdown. Effects Of Strong Dollar On US Equity Performance While over the long term, a link between earnings growth and equities performance is irrefutable, in the short run, there may be significant variations. In this section, we will look at the relationship between equity returns and the USD. We will also isolate sectors and styles that are best positioned to withstand the current environment. And when the dollar swoons, we will also know which parts of the equity market are most likely to bounce back. USD Dollar Regimes To better understand the relationship between equity returns and the USD, we demarcate two distinct USD regimes, defined rather simplistically as “USD Rising” and “USD Falling” (Chart 11). Then we compile median monthly returns in each regime and keep track of how many months the S&P 500 was positive in each. Chart 11The USD Regimes
Should US Equity Investors Worry About The Dollar?
Should US Equity Investors Worry About The Dollar?
Chart 12The USD Is A Headwind For The Performance Of Equities
Should US Equity Investors Worry About The Dollar?
Should US Equity Investors Worry About The Dollar?
We found that when the USD is appreciating, median monthly returns are only 0.5% and are positive only 37% of the time. However, when the dollar is depreciating, median monthly returns are 1.4% and are positive 63% of the time (Chart 12). This relationship is significant at a 10% confidence level. Sector Performance Under Different USD Regimes When the USD rises, more defensive sectors, such as Utilities, Healthcare, and Consumer Staples tend to outperform. Energy has made the list thanks to the recent rally – normally Energy does not benefit from dollar strength (Chart 13). Chart 13Materials And Comm Services Will Outperform If The USD Turns
Should US Equity Investors Worry About The Dollar?
Should US Equity Investors Worry About The Dollar?
The weakening dollar supports Materials as it stimulates demand, as well as the Communications sector, as it is home to multinational media and entertainment companies like Netflix, Facebook, and Google. Style Performance Under Different USD Regimes Growth Vs Value: Growth is more exposed to the USD than Value thanks to the index composition (Chart 14). Growth is home to Tech as well as Media & Entertainment, and “growthy” Consumer Discretionary, all of which have a higher share of earnings from abroad than the index. Value is dominated by Financials, Industrials, and Utilities, which are fairly domestic. Thus, while over time, exposure to the dollar fluctuates, over the long term, Growth is clearly more sensitive than Value (Chart 15). Chart 14Growth Is Dominated By Multinationals
Should US Equity Investors Worry About The Dollar?
Should US Equity Investors Worry About The Dollar?
Chart 15Growth Is More Exposed To The USD Than Value
Growth Is More Exposed To The USD Than Value
Growth Is More Exposed To The USD Than Value
Chart 16Mid Is A More Domestic Asset Class Than Small
Mid Is A More Domestic Asset Class Than Small
Mid Is A More Domestic Asset Class Than Small
Small Vs Mid: According to a popular belief, small caps are insulated from currency moves as they don’t have reach and scale and earn very little outside of the US. However, small caps are often part of the ecosystem and supply chain of multinationals, and when the profitability of those is under pressure, they also start to feel the heat. Small caps have little leverage with their large clients and their profitability changes with the ebbs and flows of their larger brethren. Hence, they are quite sensitive to currency moves. Arguably, it is midcaps that are the most domestic asset class, as their exposure to the USD is less and more stable compared to the S&P 500 and small caps (Chart 16). Midcaps are usually not big enough to have much international reach but are big enough to have bargaining power with their multinational customers to guard their profitability. Investment Implications The S&P 500 derives roughly 40% of sales from abroad, which makes its earnings quite sensitive to dollar moves and global growth. The recent dollar bull market and slowing growth abroad have challenged US corporates and have detracted from their profit growth. However, slower growth, rising costs, and diminished pricing power by far dwarf the effects of the dollar. Overall, challenges at home and abroad are likely to trigger an earnings recession, which in all likelihood, has already started this summer, and is about to get worse. The dollar may be close to its peak, and our colleagues from the FX team expect dollar devaluation over the long term. A turn in the dollar will offer some respite for the performance of US equities despite the domestic backdrop of slowing growth and rising rates. It will also trigger a change in leadership, with sectors such as Materials and Communications rebounding from their lows. In terms of styles, a strong dollar lends support to Value, thanks to its sector composition. Once the dollar starts to depreciate, Growth will get another tailwind towards recovery. And lastly, midcap is one area in the US equity market somewhat more insulated from currency moves. Bottom Line While a strong dollar is certainly a headwind for US earnings growth and for the performance of US equities, its adverse effects are minor compared to the effects of tighter monetary policy, slowing growth at home and abroad, rising costs, falling productivity, and companies, diminished ability to pass on costs to customers—who are already strapped by rising prices. In short, dollar depreciation will be a welcome development, yet the dollar is the least of investors’ worries. Irene Tunkel Chief Strategist, US Equity Strategy irene.tunkel@bcaresearch.com Footnotes 1 The model’s adjusted R-squared is 0.65. Recommended Allocation
Executive Summary What To Do With The Euro?
What To Do With The Euro?
What To Do With The Euro?
The outlook for European assets is uniquely muddled. European energy prices will remain elevated, but the worst of the adjustment is already behind us. The global economy is teetering on the edge of a recession and weak global growth is historically very negative for European assets. However, European valuations and earnings forecasts already discount an extremely severe outcome for global growth. A hawkish Fed should support the dollar, but investors increasingly realize foreign central banks are fighting inflation equally aggressively. The dollar already anticipates a global recession. Meantime, European credit offers a large spread pickup over sovereigns and even appears as a decent alternative to equities. Within a credit portfolio, we adopt a more cautious approach towards European investment grade bonds (IG) relative to their US counterpart. Instead, we recommend favoring UK IG over Euro Area IG as well as Swedish IG relative to US IG. Recommendations INCEPTION DATE RETURN SINCE INCEPTION (%) COMMENT Set a stop buy at EUR/USD 0.9650 with a stop-loss at 0.9400 9/26/2022 Bottom Line: Investors should maintain a modest long position in equities in European portfolios, with a preference for defensive stocks over cyclicals. The conditions are falling in place to buy the euro tentatively. Following the hawkishness that transpired from the Fed press conference and revised forecasts last week, EUR/USD plunged below 0.99 and hit a 20-year low. Moreover, President Vladimir Putin’s announcement of a broader mobilization of the Russian army is stoking fears that the Ukrainian conflict will only be prolonged. The prospects of a lengthier war and greater energy market shock are raising further worries for Europe’s growth outlook, which weighs on European asset prices, notably the euro and the pound. The odds of a global financial accident are on the rise. Global central banks have joined the Fed and are relentlessly tightening global monetary and financial conditions. Moreover, the surging dollar is adding to global risks by raising the cost of capital around the world. This is a very fragile situation and the odds of a global recession have jumped significantly. Against this backdrop, investors should continue to overweight defensive equities at the expense of cyclical stocks. The euro also has more downside, but we are issuing a tentative stop-buy at EUR/USD 0.9650 with a stop at 0.9400. Credit remains a safer alternative to European stocks. The Evolving European Energy Backdrop Chart 1All About The Gas
All About The Gas
All About The Gas
The surge of natural gas and electricity prices since the fall of 2021 has been one of the main drivers of the underperformance of European assets and the fall in the euro (Chart 1). While the medium-term outlook for European energy prices remains fraught with risk, the near-term prospects have improved. Following a surge from €77.4/MWh in June to €340/MWh on August 26, one-month forward natural gas prices at the Dutch Title Transfer Facility (TTF) have declined 45% to €187/MWh. These wild gyrations reflect the evolution of both the natural gas flows from Russia, which have fallen from 3,060Mcm to 599 Mcm today, and the rapid buildup of natural gas inventories across the European Union. The good news is that the costly efforts to rebuild European gas inventories have been successful. EU-wide inventories are at 85.6% capacity, achieving its 80% storage objective well before November. Germany has gone even further, with storage use now standing at 90% of capacity. This large stockpile, along with the re-opening of coal power plants and consumption curtailment efforts, should allow Europe to survive the winter without Russian energy imports, as long as the temperatures are not abnormally cold. The absence of a summer dip in Norwegian gas exports and the surge in LNG flows to Europe have partially replaced the missing Russian inflows, thus helping Europe rapidly rebuild its natural gas inventories (Chart 2). This success was a consequence of elevated European natural gas prices, which have allowed Europe to absorb LNG flows from the rest of the world (Chart 3). Chart 2No Restocking Without LNG
No Restocking Without LNG
No Restocking Without LNG
Chart 3LNG Flowed Toward High Prices
LNG Flowed Toward High Prices
LNG Flowed Toward High Prices
So far, the European industrial sector has managed to adjust better than expected to the jump in the price of natural gas, a crucial energy input. Take Germany as an example. For the month of August, Germany’s consumption of natural gas by the industrial sector fell 22% below the 2018-2021 average (Chart 4, top panel), while PPI moved up vertically. Yet, industrial output is only down 5% year-on-year and industrial capacity utilization stands at 85%, which is still a level that beats two thirds of the readings recorded between 1990 and this the most recent quarter (Chart 4, bottom panel). The adjustment will be uneven across various industries, with those most voracious of natural gas likely to experience a declining share of Europe’s gross value added. Using the German example once again, we can see that the chemicals, basic metal manufacturing, and paper products sectors are the most at risk from higher natural gas prices and most likely therefore to suffer the most from gas rationing this winter (Chart 5). Chart 4A Surprisingly Successful Transition
A Surprisingly Successful Transition
A Surprisingly Successful Transition
Chart 5The Three Sectors Most At Risk
Is Europe About To Be Crushed?
Is Europe About To Be Crushed?
Going forward, important changes are likely to take place that will allow the European economy to continue to survive on diminished Russian gas flows: European natural gas prices will remain elevated compared to the rest of the world to attract LNG flows to the region. Importantly, Europe’s capacity to absorb these flows keeps increasing, as more re-gasification ships are docked around the continent. Moreover, North America is building more facilities to export LNG to Europe. Chart 6Nuclear Energy's Contribution Will Rebound
Nuclear Energy's Contribution Will Rebound
Nuclear Energy's Contribution Will Rebound
Nuclear electricity production will rebound. Currently, the EU’s nuclear production is around 43.2TWh, well below the normal 60TWh to 70TWh winter levels, driven mostly by the collapse in French production from 35TWh to 18TWh (Chart 6). This decline in nuclear electricity generation has accentuated the upward pressure on European natural gas and electricity prices. One of the key objectives of the nationalization of EDF by the French government is to accelerate the maintenance of France’s ageing nuclear power plants and allow a return to more normal production levels by the winter. The role of natural gas in European household’s energy mix will decline. Currently, EU households are the largest natural gas consumers and account for 41% of the bloc’s gas consumption (Chart 7). It will be easier to replace their natural gas consumption over time with other sources of energy than it will be to cut the industrial sector’s consumption extensively. As a result, even if European natural gas imports are permanently below 2021 levels, the industrial sector will not bear the brunt of the adjustment. Chart 7Households To Be Displaced
Is Europe About To Be Crushed?
Is Europe About To Be Crushed?
These developments imply that natural gas prices have limited downside. However, we believe that the worst of the spike in prices is behind us, at least over the near term. The reason is that the inelastic buying created by the inventory re-stocking exercise since May 2022 is ending. In fact, the German Federal Minister for Economic Affairs and Climate Action, Robert Habeck, declared last week that his country would no longer purchase gas at any price. Chart 8The Most Painful Part Of The Adjustment Is Over
The Most Painful Part Of The Adjustment Is Over
The Most Painful Part Of The Adjustment Is Over
If prices stabilize around €200/MWh, European industrial activity will continue to face a headwind, but the worst of the adjustment process will be in the rearview mirror as natural gas inflation recedes (Chart 8). Ultimately, capitalist systems are dynamic, and it is this rapid change in price that causes the most pain. In other words, the impoverishment of the European private sector has already happened. Steady states are easier to manage. Moreover, if natural gas prices eventually follow the future’s curve (this is a big “if”), the picture for Europe will improve considerably. One additional mitigating factor should ease the pain being experienced by the European private sector. Fiscal policy is responding very aggressively to the current energy crisis. So far, EU countries and the UK have allocated more than €500 billion to protect their private sectors against higher energy costs (Chart 9) and the UK just announced tax cuts of £45 billion. This is in addition to the disbursement of €150 billion from the NGEU funds in 2023. Moreover, the European commission is planning to modify the EU fiscal rules to abandon annual structural deficit targets and for debt sustainability to be evaluated over a ten-year period. Chart 9Massive Fiscal Support
Is Europe About To Be Crushed?
Is Europe About To Be Crushed?
Bottom Line: The worst of Europe’s adjustment to higher energy prices is now behind us. However, European energy prices will remain elevated, which will continue to put Europe at a handicap compared to the rest of the world. Bad News From The Rest Of The World The worst of Europe’s energy crisis is behind us, but the world is teetering toward a recession, which will hurt the trade- and manufacturing-sensitive European economy. Chart 10A Global Recession This Way Comes
A Global Recession This Way Comes
A Global Recession This Way Comes
The tightening in global financial conditions created by the surge in the dollar and by the jump in global yields is pushing the US Manufacturing ISM and the Euro Area PMIs toward the low-40s, which is consistent with a recession (Chart 10). The problem does not stop there. Global central banks have become solely focused on fighting inflation. For 2023, the FOMC’s dot plot forecasts both an interest rate rise to 4.6% and a 0.7% increase in the unemployment rate. This is tantamount to the Fed telling the market that it will increase interest rates as a recession emerges to repress inflation. Not to be undone, European central banks are also rapidly increasing their policy rates, even as they also forecast an imminent deterioration in domestic growth conditions. Quickly tightening policy in a slowing growth environment, especially as the dollar hits a 20-year high, is a recipe for a financial accident and a global recession. Chart 11No Help From China
No Help From China
No Help From China
Moreover, China’s economy is still unable to create a positive offset to the deterioration in global monetary and financial conditions. The marginal propensity of China’s private sector to consume remains in a downtrend, hampered by the country’s zero-COVID policy and the continuing meltdown in real estate activity (Chart 11). Furthermore, the most rapid decline in the yuan exchange rate in 5 years is imparting an additional downside risk to the global economy. European stocks are uniquely exposed to these threats. Europe overweights deep cyclicals, which are currently squeezed by the deteriorating global growth outlook. The message from the collapse in FedEx’s stocks on very poor guidance is particularly ominous: this company has a much closer correlation with the Dow Jones Euro STOXX 50 than with the S&P 500 (Chart 12). European share prices are already factoring in much of the bad news. Valuations are significantly less expensive than they once were. The Shiller P/E ratio of European equities and their equity risk premium stand at the same levels as those in the 1980s. This is in sharp contrast to the US (Chart 13). Chart 12FedEx's Gloomy Delivery
FedEx's Gloomy Delivery
FedEx's Gloomy Delivery
Chart 13Low CAPE In Europe
Low CAPE In Europe
Low CAPE In Europe
Table 1A Deep Downgrade To European Earnings
Is Europe About To Be Crushed?
Is Europe About To Be Crushed?
European forward earnings have also already done considerable work adjusting downward. Excluding energy, 2022 and 2023 forward EPS are down 10.3% and 11.9% since their peak, respectively (Table 1). But inflation flatters earnings growth and European large-cap indices are dominated by multinational firms, which implies that looking at earnings in USD terms makes more sense. In both real and USD terms, 2022 and 2023 forward EPS, excluding energy, are already down 25% and 26.4%, respectively. These adjustments are in line with previous recessions. The counterargument is that analysts still expect positive earnings growth in 2023 relative to 2022. However, at 4%, this increase in expected earnings is still well below inflation and 6% below the average expected growth in forward earnings recorded over the past 35 years (Chart 14). Additionally, a global recession could put further downward pressure on energy prices in Europe, which would create an additional cushion under European earnings in 2023 The implication here is that it still makes sense to be modestly long European equities in absolute terms, especially for investors with an investment horizon of twelve months or more. However, we cannot be complacent, as the risk of an additional selloff is still too large for comfort. As a result, for now investors should only garner a small exposure to European equities and do so while favoring defensive names over cyclical ones (Chart 15). Chart 14Weak Forward Earnings Growth
Weak Forward Earnings Growth
Weak Forward Earnings Growth
Chart 15Continue To Favor Defensive Names
Continue To Favor Defensive Names
Continue To Favor Defensive Names
Bottom Line: European stocks must still contend with the growing threat of a global recession catalyzed by tighter financial conditions and aggressive global central banks. The good news is that they already discount considerable pessimism, as illustrated by their low valuations and downgraded forward earnings. Consequently, investors can continue to nibble at European equities, but do so to a limited degree and by favoring defensive stocks over cyclical ones, at least for now. The Euro Dilemma On the back of the very hawkish Fed meeting and the announcement of Russia’s broadened military mobilization, the EUR/USD broke below the 0.99 support level and fell under 0.98, a level we judged in the past as very attractive on a six-to-nine months basis. Obviously, Fed Chair Jerome Powell’s reaffirmation of the FOMC’s war on inflation is a major boost to the dollar. The momentum property of the greenback implies that it has room to rally further in the near term. This narrative, however, overlooks the fact that the Fed is not the only central bank intent on fighting inflation, no matter the cost. The Norges Bank, the Riksbank, the ECB, and even the SNB have all showed their willingness to move aggressively against inflation. While the BoE only increased rates by 50bps last week, its communication suggested that an at least 75bps increase would be due at the November meeting, when the MPC publishes its Monetary Policy report that will incorporate the impact of the budget measures announced by new British Prime Minister, Liz Truss. Chart 16The Rest Of The World Is Catching Up To The Fed
The Rest Of The World Is Catching Up To The Fed
The Rest Of The World Is Catching Up To The Fed
As a result, market interest rate expectations are climbing in the US, but they are rising even faster in Europe, albeit from a lower base. However, the decline in the expected rate of interest in the US relative to Europe and in the number of expected hikes in the US relative to Europe are consistent with a sharp decline in the DXY in the coming months (Chart 16). Due to its 80% weight in European currencies, a weaker DXY implies a rebound in the EUR, GBP, CHF, NOK, and SEK against the USD. Chart 17Surprising European Resilience
Surprising European Resilience
Surprising European Resilience
Moreover, there could be room for expected interest rate differentials to narrow further against the dollar. The analysis we published two weeks ago shows that, even when the different nonfinancial private debt loads are accounted for, the gap in the US and Eurozone r-star stands at 1%. However, the spread between the Fed funds rate’s upper bound and the ECB Deposit Rate is 2%. The gap between the July 2023 US and Eurozone OIS is 1.7%. Since European inflation may prove more stubborn than that of the US in the near term, there is scope for the expected interest rate gap to narrow further, especially as the Euro Area final domestic demand is surprisingly more robust than that of the US (Chart 17). What about global growth? The view that the global economy is about to experience a recession is consistent with a stronger dollar, since the greenback is an extremely countercyclical currency. However, the DXY’s 25% rally since January 2021 already prices in such an outcome (Chart 18). Similarly, the euro is trading again at 2002 levels, which is also in line with a global recession with deep negative repercussions for the Eurozone. Additionally, the Euro has fallen 21% since May 2021, which compares to the 21.4% fall in 2008, the 20% decline in 2010, the 18% plunge in 2011/12 and the 24% collapse in 2014/15; yet EUR/USD is much cheaper now than in any of those instances. Moreover, the wide difference between the competitiveness of Germany and that of the rest of the Euro Area has now faded, which means that a major handicap against the euro has disappeared (Chart 19). Chart 18The Dollar Already Foresees A Recession
The Dollar Already Foresees A Recession
The Dollar Already Foresees A Recession
Chart 19Normalizing Eurozone Internal Competitiveness
Normalizing Eurozone Internal Competitiveness
Normalizing Eurozone Internal Competitiveness
This does not mean that the euro is not without risk. First, since the major euro collapse began in June 2021, EUR/USD breakdowns have been followed by average declines of 3.6%, ranging from 2.7% to 4.2%. Since the dollar is a momentum currency, it is unlikely that this time will be different. Second, if the tightening in global policy does cause a financial accident, the dollar will catch one last major bid that could push EUR/USD toward 0.9. As a result, to mitigate the danger, we recommend setting a stop-buy in the euro at EUR/USD 0.965 or 2.6% below the breakdown level of 0.9904. This position comes with a stop-loss at 0.94. For now, we would view this bet as a tactical position if it were triggered. Bottom Line: While a hawkish FOMC is very positive for the dollar, markets now expect foreign central banks to catch up to some extent with the Fed. This process is dollar bearish. Additionally, while a global recession would be supportive of the greenback, the USD already discounts this scenario. Instead, Europe is proving surprisingly resilient, which could soon create a tailwind for EUR/USD. Set a stop-buy at EUR/USD 0.965, with a stop-loss at 0.94. Market Update: European Credit After Central Bank Week For investors concerned with the left-tail risk in European equities, European credit offers a credible alternative in the near term. This asset class is also attractive relative to European government bonds. Taken together, the Fed, the ECB, the BoE, the Riksbank, the Norges Bank, the SNB, and the BoC have tightened policy by 475bps over the past month (Chart 20). Moreover, the SNB’s hike closed the chapter of negative rates in Europe. But make no mistake – there will be a second chapter. Until then, European corporate bond yields have risen enough to offer attractive spreads over duration-matched government bonds and to challenge the earnings yield provided by equities (Chart 21). Besides, the volatility observed in equity markets over the past few months makes the European corporate bond more appealing. Chart 20Central Bank Week
Is Europe About To Be Crushed?
Is Europe About To Be Crushed?
Chart 21Push Back Against TINA Argument
Push Back Against TINA Argument
Push Back Against TINA Argument
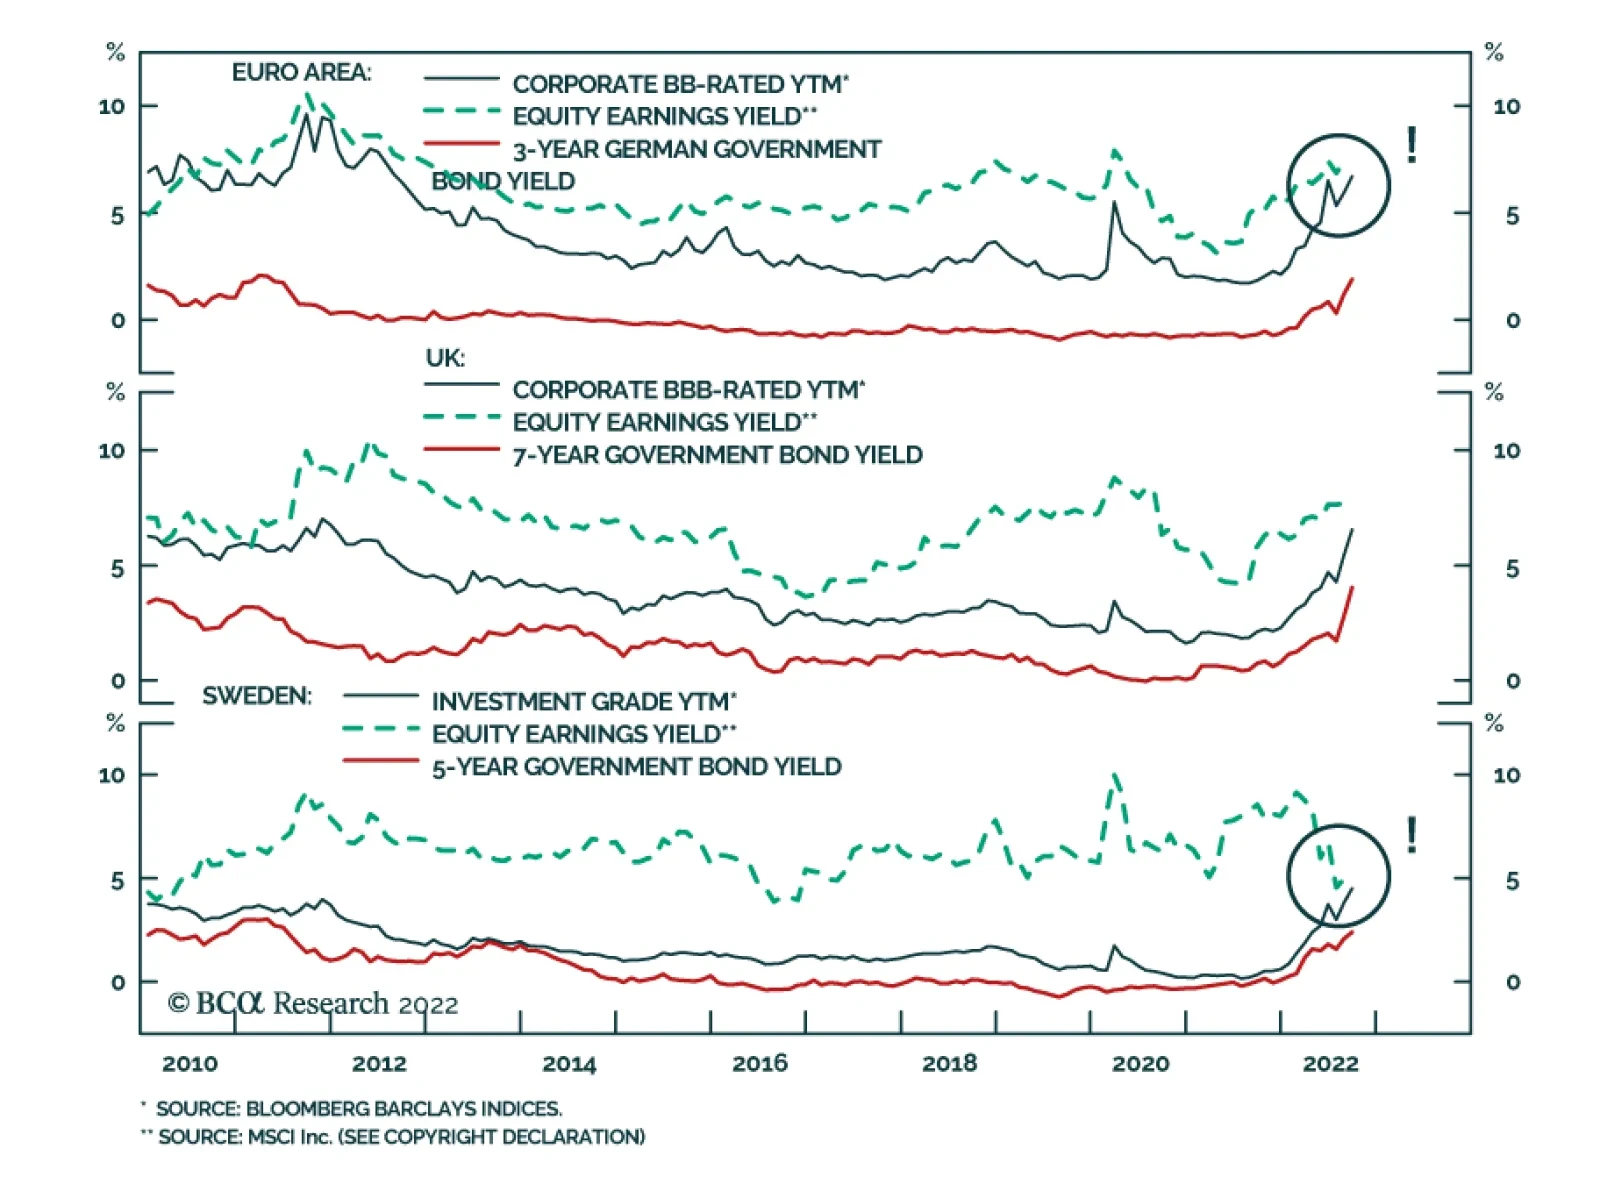
In the Euro Area, BB-rated bonds, which are the highest credit quality and largest tranche within the high-yield space, are particularly attractive. They sport a 6.6% YTM, at a spread of 480bps over 3-year German government bond yields. This compares to an equity earnings yield of 7.4% (Chart 21, top panel). In other European corporate bond markets, there is no need to go down in credit quality. Yields-to-maturity for investment grade corporate bonds in the UK, Sweden, and Switzerland provide appealing alternatives to equities, with shorter duration still. This is especially true in Sweden, where the equity earnings yield has collapsed and is now only 60bps above Swedish IG yield, with substantially greater risk. Meanwhile, the spread pickup offered by Swiss IG over Swiss government bonds of similar duration is at its widest in more than ten years (Chart 21, bottom panel). Chart 22Heed The Message From OIS Curve Differentials
Heed The Message From OIS Curve Differentials
Heed The Message From OIS Curve Differentials
This week, we turn neutral on European credit versus US credit. Back in March, we made the case that European credit would outperform its US counterpart in response to a more hawkish Fed than the ECB. Since then, European IG outperformed US IG by 1% on a total return basis. However, with the Fed funds rate at 3.25%, traders now expect more monetary policy tightening from the ECB, which often corresponds to an underperformance of Euro Area credit relative to that of the US (Chart 22, top panel). On the other hand, Swedish IG is expected to outperform US IG over the next six months (Chart 22, bottom panel). Mathieu Savary, Chief European Strategist Mathieu@bcaresearch.com Jeremie Peloso, Editor/Strategist JeremieP@bcaresearch.com Tactical Recommendations Cyclical Recommendations Structural Recommendations
Dear client, Next week’s report will be on European assets, authored by my colleague Mathieu Savary. We will send that to you Monday, September 26. In that report, Mathieu looks at the European energy market in depth, and concludes the eurozone will survive the winter, but with critical tests in the coming weeks. Mathieu suggests the euro could touch 0.965 in this process. I trust you will find the report insightful. Our regular publication will resume on October 7. Kind regards, Chester Ntonifor, Foreign Exchange Strategist Executive Summary Real Yields Still Favor The Dollar
Real Yields Still Favor The Dollar
Real Yields Still Favor The Dollar
Every central bank is stepping up its hawkish rhetoric, but the Fed is still being perceived as having the moat to deliver the most aggressive rate hikes. As long as the market believes the US economy will maintain its superstar status, the dollar has upside. That said, financial conditions are tightening meaningfully in the US. Meanwhile, US inflation has peaked relative to other G10 countries, suggesting the market could price a less aggressive path for Fed interest rates, relative to other central banks. Narrowing interest rate differentials will diffuse US dollar momentum. The big risk of leaning against dollar strength is a recession that spreads from Europe, the UK, and China and becomes global. The dollar tends to do well during recessions, even after a prolonged bout of strength. Our core trades remain at the crosses: short EUR/JPY and long EUR/GBP. We are looking to buy NOK/SEK on further weakness and our limit buy on AUD was triggered. Bottom Line: Stay neutral the dollar for now but conditions for a short position continue to accrue. Feature We last published our Month-In-Review report on August 12th, suggesting inflation was still strong globally, and central banks will zone in on their mandate of cooling prices. Since then, bankers have been very busy. The Reserve Bank of New Zealand (RBNZ) hiked rates by 50bps on August 17. At 3%, New Zealand now has one of the highest policy rates in the G10. The Norges Bank has hiked rates twice since, by 50bps. The policy rate now stands at 2.25%. The Reserve Bank of Australia (RBA) hiked policy rates by 50bps on September 6. The Bank of England (BoE) hiked by 50 bps on September 16th, albeit, below market expectations. The Riksbank hiked rates by 100 bps on September 20. In a rare occurrence, Sweden now has higher rates than the eurozone. The European Central Bank (ECB), the Fed, and the Swiss National Bank (SNB) recently hiked rates by 75 bps. Finally, as a lone wolf, the Bank of Japan (BoJ) stayed pat, but has massively intervened to stabilize the drawdown in the yen. The message is clear, global central banks are on a path to cool inflation and regain credibility. In recent weeks, the Fed has been one of the most aggressive in hiking policy rates (Chart 1). As a result, the 10-year US Treasury yield has risen from 3% to 3.7% in the last month, among the most aggressive in the G10 (Chart 2). Other central banks are also catching up as inflation accelerates outside the US. Specifically, US price gains have peaked relative to their G10 counterparts (Chart 3). Faster rising yields and slowing inflation means that relative real yields continue to bid the dollar higher (Chart 4). Chart 1The Fed Is Very Hawkish
Month In Review: Will Relative Rates Continue To Boost The Dollar?
Month In Review: Will Relative Rates Continue To Boost The Dollar?
Chart 2Interest Rates Rising Meaningfully In The US
Month In Review: Will Relative Rates Continue To Boost The Dollar?
Month In Review: Will Relative Rates Continue To Boost The Dollar?
Chart 3Other Central Banks Need To Play Catch Up
Other Central Banks Need To Play Catch Up
Other Central Banks Need To Play Catch Up
Chart 4Real Yields Still Favor The Dollar
Real Yields Still Favor The Dollar
Real Yields Still Favor The Dollar
This backdrop is highly deflationary. Tightening policy while economic growth is slowing is a toxic cocktail. It explains why the dollar continues to command a bid, as markets believe most central banks cannot engineer a soft landing. The dollar does well in hard landings. In the next few sections, we cover the important data releases over the last month in our universe of G10 countries, and the implications for currency strategy. What is clear is that most foreign central banks are committed to their tightening campaign, which argues for a neutral stance towards the DXY for now, with a view to sell after/if global central banks engineer a recession. US Dollar: Stealth Strength Chart 5US Dollar: Stealth Strength
US Dollar: Stealth Strength
US Dollar: Stealth Strength
The dollar DXY index is up 17.4% year to date. Over the last month, the DXY index is up 3.6% (panel 1). The market focus for the dollar will remain the jobs and employment report. Job gains remain robust. In August, the US added 315K jobs. While the unemployment rate rose to 3.7%, the participation rate also rose from 61.2% to 62.4% (panel 2). Wages continue to rise. Average hourly earnings came in at 5.2% year-on-year in August. The Atlanta Fed wage growth tracker continues to edge higher across all income cohorts (panel 3). Headline inflation decelerated to 8.3% in August, but the core measure did accelerate from 5.9% to 6.3% (panel 4). On September 21, the Fed increased interest rates by 75bps, as expected. Inflows into US assets remain strong. According to TIC data, the US saw $154 bn of inflows in July. Higher interest rates are taking a toll on the housing market. Building permits fell sharply in August, which makes the rebound in housing starts look fleeting. Financial conditions are tightening in the US. From a currency perspective, the dollar is overbought, and sentiment is very bullish (panel 5). That said, as a momentum currency, the dollar will continue to perform well if risk assets fall to the wayside. We remain neutral in the short term, though valuation keeps us bearish over a long-term horizon. The Euro: Undershooting Parity Chart 6The Euro: Undershooting Parity
The Euro: Undershooting Parity
The Euro: Undershooting Parity
The euro is down 14.2% year to date. Over the last month, the euro is down 2.5%. As we go to press, the euro has broken below 0.97. The main risk for the eurozone remains stagflation: The ZEW Expectations Survey was at -60.7 in September, a bearish development for the euro (panel 1). Consumer confidence deteriorated further in September, to -28.8 for the eurozone (the European Commission measure). The deterioration has been consistent among member countries (panel 2). Inflation remains sticky in the eurozone. Headline CPI accelerated to 9.1% in August. PPI in the euro area was at 37.9% in July, an acceleration from the June reading (panel 3). The trade balance continues to deteriorate, hitting - €40.3bn in July. The preliminary PMI read for September was at 48.5 from 49.6, suggesting the eurozone is already in recession (panel 4). The Sentix confidence index deteriorated in September to -31.8. This remains above the 2020 low but is rapidly catching up to the downside. Despite the above data prints, the ECB lifted interest rates by 75 bps on September 8th. The ECB continues to fight soaring inflation and will need to engineer a recession in the eurozone to achieve its mandate. This is a key risk for the euro. We continue to sell the EUR/JPY cross, while we remain constructive on EUR/GBP (panel 5). Our initial line in the sand was 0.98 for the euro, but as my colleague will argue next week, it could substantially undershoot this level. Stand aside for now. The Japanese Yen: Currency Intervention Chart 7The Japanese Yen: Currency Intervention
The Japanese Yen: Currency Intervention
The Japanese Yen: Currency Intervention
The Japanese yen is down 19.71% year-to-date. The yen hit an intra-day low of 145.8, forcing intervention by Japanese authorities. That has assuaged selling pressure. Meanwhile, economic data out of Japan has been on the mend. The Eco Watcher’s survey showed that sentiment improved in August. Current conditions rose from 43.8 to 45.5. The outlook component also rose from 42.8 to 49.4. The trade balance in Japan continues to deteriorate, due to soaring energy costs. That said, exports are holding up, rising 22% year-on-year in August (panel 2). Machine tool orders also ticked up. Labor market conditions remain robust. The job-to-applicant ratio rose to 1.29% in July. Inflation is picking up in Japan (panel 3). The nationwide CPI report for august showed an increase in the core-core measure from 1.2% to 1.6%. Headline CPI rose from 2.6% to 3%. The Bank of Japan continues to keep monetary policy on hold. However, the depreciating yen triggered intervention from Japanese authorities. We are short EUR/JPY, a trade that continues to pan out and a call option on a BoJ shift. While inflation expectations remain sticky in Japan, they could overshoot (panel 4). Our thesis is that short-term investors should stand aside on the yen, but longer-term buyers are in for a bargain. The yen is cheap, a favorite short, and the Japanese economy could surprise to the upside (panel 5). British Pound: Towards Parity? Chart 8British Pound: Towards Parity?
British Pound: Towards Parity?
British Pound: Towards Parity?
The pound is down 19.59% year to date. The depreciation in the pound has picked up pace, with cable now trading near 1.1 (panel 1). The next level of support is the 1985 low of 1.08. Economic data in the UK continues to disappoint. CPI came in at 9.9% in August. The RPI came in at 12.3%. PPI was at 24%. According to BoE forecasts, we will hit double digits in CPI prints soon (panel 2). Nationwide house price inflation remained strong in August, rising 10% year-on-year (panel 3). Retail sales excluding auto and fuel fell 5.4% year-on-year in August (panel 4). Trade data remains weak. The current account is close to a record low (panel 5). The external balance remains negative for the pound. With the new fiscal package of tax cuts, gilt yields are hitting new highs and the cable is selling off. This is because more demand will depress real rates in the UK, if not accompanied by productivity gains. We are maintaining our long EUR/GBP trade. On cable, downside remains but we will be buyers at 1.05. Australian Dollar: A Contrarian Trade Chart 9Australian Dollar: A Contrarian Trade
Australian Dollar: A Contrarian Trade
Australian Dollar: A Contrarian Trade
The AUD is down 10.14% year-to-date (panel 1). Over the last month, the AUD is down 5.68%. The RBA hiked interest rates by 50bps in August, lifting the official cash rate to 2.35%. We believe further rate increases remain likely. Inflation is accelerating in Australia, as the labor market tightens (panel 2). 59K jobs were added in August. The participation rate also ticked up from 66.4% to 66.6%. While the unemployment rate rose (panel 3), labor market conditions remain the strongest in decades (panel 4). Monetary policy continues to have the desired effect, as home loan issuance declined 7% in July. The manufacturing sector remains strong, with the August manufacturing PMI coming in at 53.8. The external environment continues to weigh on the AUD. In July, the trade balance came in lower than expected at -A$8.7bn vs a forecast of A$14.5bn (panel 5). This was largely driven by commodity prices rolling over and slowing Chinese demand. The headwinds are likely to persist in the near term. That said, our limit buy on AUD/USD was triggered at 0.665. In our view, the AUD already embeds a lot of bad news. New Zealand Dollar: Stay Short At The Crosses Chart 10New Zealand Dollar: Stay Short At The Crosses
New Zealand Dollar: Stay Short At The Crosses
New Zealand Dollar: Stay Short At The Crosses
The NZD is down 15% year-to-date (panel 1). Over the last month, the NZD is down 6.8%. The Reserve Bank of New Zealand raised its official cash rate (OCR) in August by 50 bps to 3.0%. The RBNZ cited high core inflation (panel 2) and scarce labor resources as the primary reasons and guided towards tighter monetary policy. Monetary policy continues to be having the desired effect across interest rate sensitive areas of the economy. Home sales continued to slow in August, with REINZ home sales down 18.3% year-over-year. Home price growth is also cratering nationwide (panel 3). There is some evidence of a soft landing in New Zealand. ANZ consumer confidence rose to -85.4 from -81.9. Business confidence also bounced to -47.8 (panel 4). The Business NZ PMI expanded to 54.9 in August. The external sector however continues to suffer from headwinds. Dairy prices, circa 20% of exports, remained flat in August after falling sharply at the start of the month. New Zealand’s 12-month trailing trade balance remains in deficit. As the NZD is heavily dependent on international trade, headwinds from a slowing Chinese economy will continue to weigh on the currency. We are bearish NZD at the crosses, though it will hold up if the dollar rolls over. Canadian Dollar: A Hawkish BoC Chart 11Canadian Dollar: A Hawkish BoC
Canadian Dollar: A Hawkish BoC
Canadian Dollar: A Hawkish BoC
The CAD is down 7.5% year to date. Over the last month, it is down 4%. The tightening campaign by the BoC is having the desired effect on economic data. Beginning with the labor market, the unemployment rate ticked up in August to 5.4% (panel 2), the highest level since February of this year. August also marks the third consecutive month of job losses, albeit with a higher labor force participation rate at 64.8%. While inflation in Canada appears to have peaked, it remains sticky. Headline CPI fell to 7% from 7.6%. Core inflation has also declined to 5.8% (panel 3). The housing market continues to slow. Building permits and housing starts are rolling over (panel 4). Notably, building permits declined 6.6% month-over-month against a forecast decline of 0.5%. Housing starts in August fell to 267.4K from 275.2K in July. The incoming prints are a “carte blanch” for the BoC to continue its tightening campaign. In August, it increased its policy rate to 3.25% (panel 5). More hikes are likely forthcoming. The OIS curve shows a peak in the overnight rate at 4% in February next year (panel 5). Ultimately, the CAD benefits from the terms of trade boom (panel 1) and an eventual decline in the US dollar. But as long as the USD remains strong, CAD faces downside. Swiss Franc: A Haven Chart 12Swiss Franc: A Haven
Swiss Franc: A Haven
Swiss Franc: A Haven
The Swiss Franc is down 7% year-to-date. EUR/CHF broke below 0.95, and the risk is that this level is tested again in the coming days (panel 1). We penned a report earlier this year arguing that Switzerland was an oasis of optimism: Inflation is accelerating, but still sits at 3.5% for August (panel 2). The decline in import prices is encouraging following franc strength (panel 3). Sight deposits are rolling over suggesting the SNB is not intervening to weaken the franc (panel 4). We are buyers of CHF at the crosses. Norwegian Krone: Buy On Weakness Chart 13Norwegian Krone: Buy On Weakness
Norwegian Krone: Buy On Weakness
Norwegian Krone: Buy On Weakness
The NOK is down 19.7% year-to-date and 8% over the last month (panel 1). Inflation remains high in Norway. In August, CPI grew 6.5% year-on-year (panel 2). PPI including oil rose 77.3%. The housing market will bear the brunt of rate hikes. Household indebtedness (panel 3), makes the task of policy calibration challenging. Consumer confidence fell to a new low in the third quarter. The good news is that economic activity is robust on the back of Norway’s energy advantage. The current account remains in surplus (panel 5). If global risk sentiment picks up, the krone will be a jewel in the G10. If the risk appetite remains muted, NOK will face strong headwinds. Swedish Krona: A Beta Play On The Euro Chart 14Swedish Krona: A Beta Play On The Euro
Swedish Krona: A Beta Play On The Euro
Swedish Krona: A Beta Play On The Euro
SEK is down 23.9% year-to-date. Over the last month, the krona is down 5.6% (panel 1). The Riksbank surprised markets by raising rates by 1% on September 20th (panel 5). Critically, rising inflation was the catalyst. Headline inflation accelerated from 8.5% to 9.8% in August. This is well above target (panel 3). The economic tendency survey rolled over from 101.3 to 97.5. A strong PMI has been a beacon of hope in Sweden but the headline figure dipped from 53.1 to 50.6 in August. The housing market continues to soften (panel 2). The Riksbank’s latest estimate sees a 16% decline in prices this year. Much like the NOK, the Swedish krona will gyrate along the path of the broad trade-weighted USD. Fundamentally, the krona remains more vulnerable to external shocks due to higher energy dependency and a strong dollar. But it is also incredibly cheap. We are looking for opportunities to be long SEK at the crosses. Chester Ntonifor Foreign Exchange Strategist chestern@bcaresearch.com Trades & Forecasts Strategic View Cyclical Holdings (6-18 months) Tactical Holdings (0-6 months) Limit Orders Forecast Summary
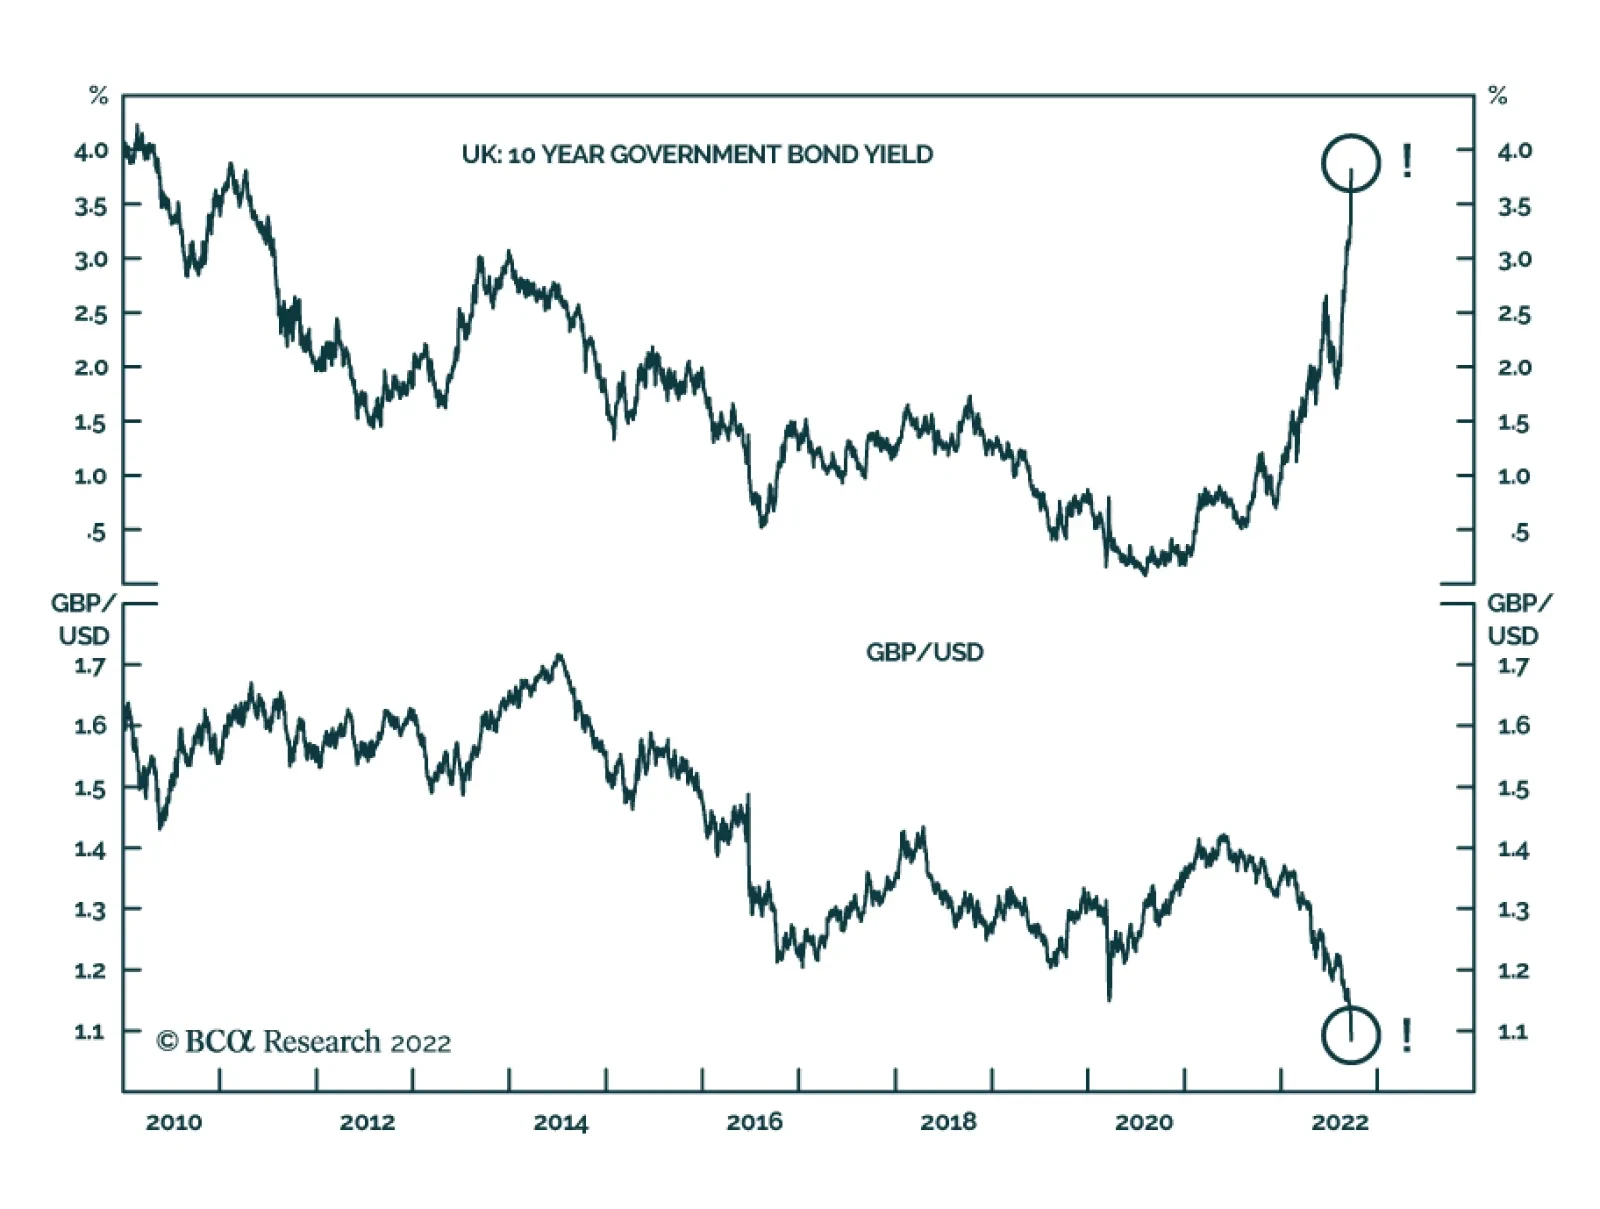
In its post-meeting statement on Thursday, the Bank of England highlighted that the MPC is prepared to “respond forcefully” to any changes to the inflationary outlook. On Friday, the new UK government unveiled a massive debt-financed package which includes…
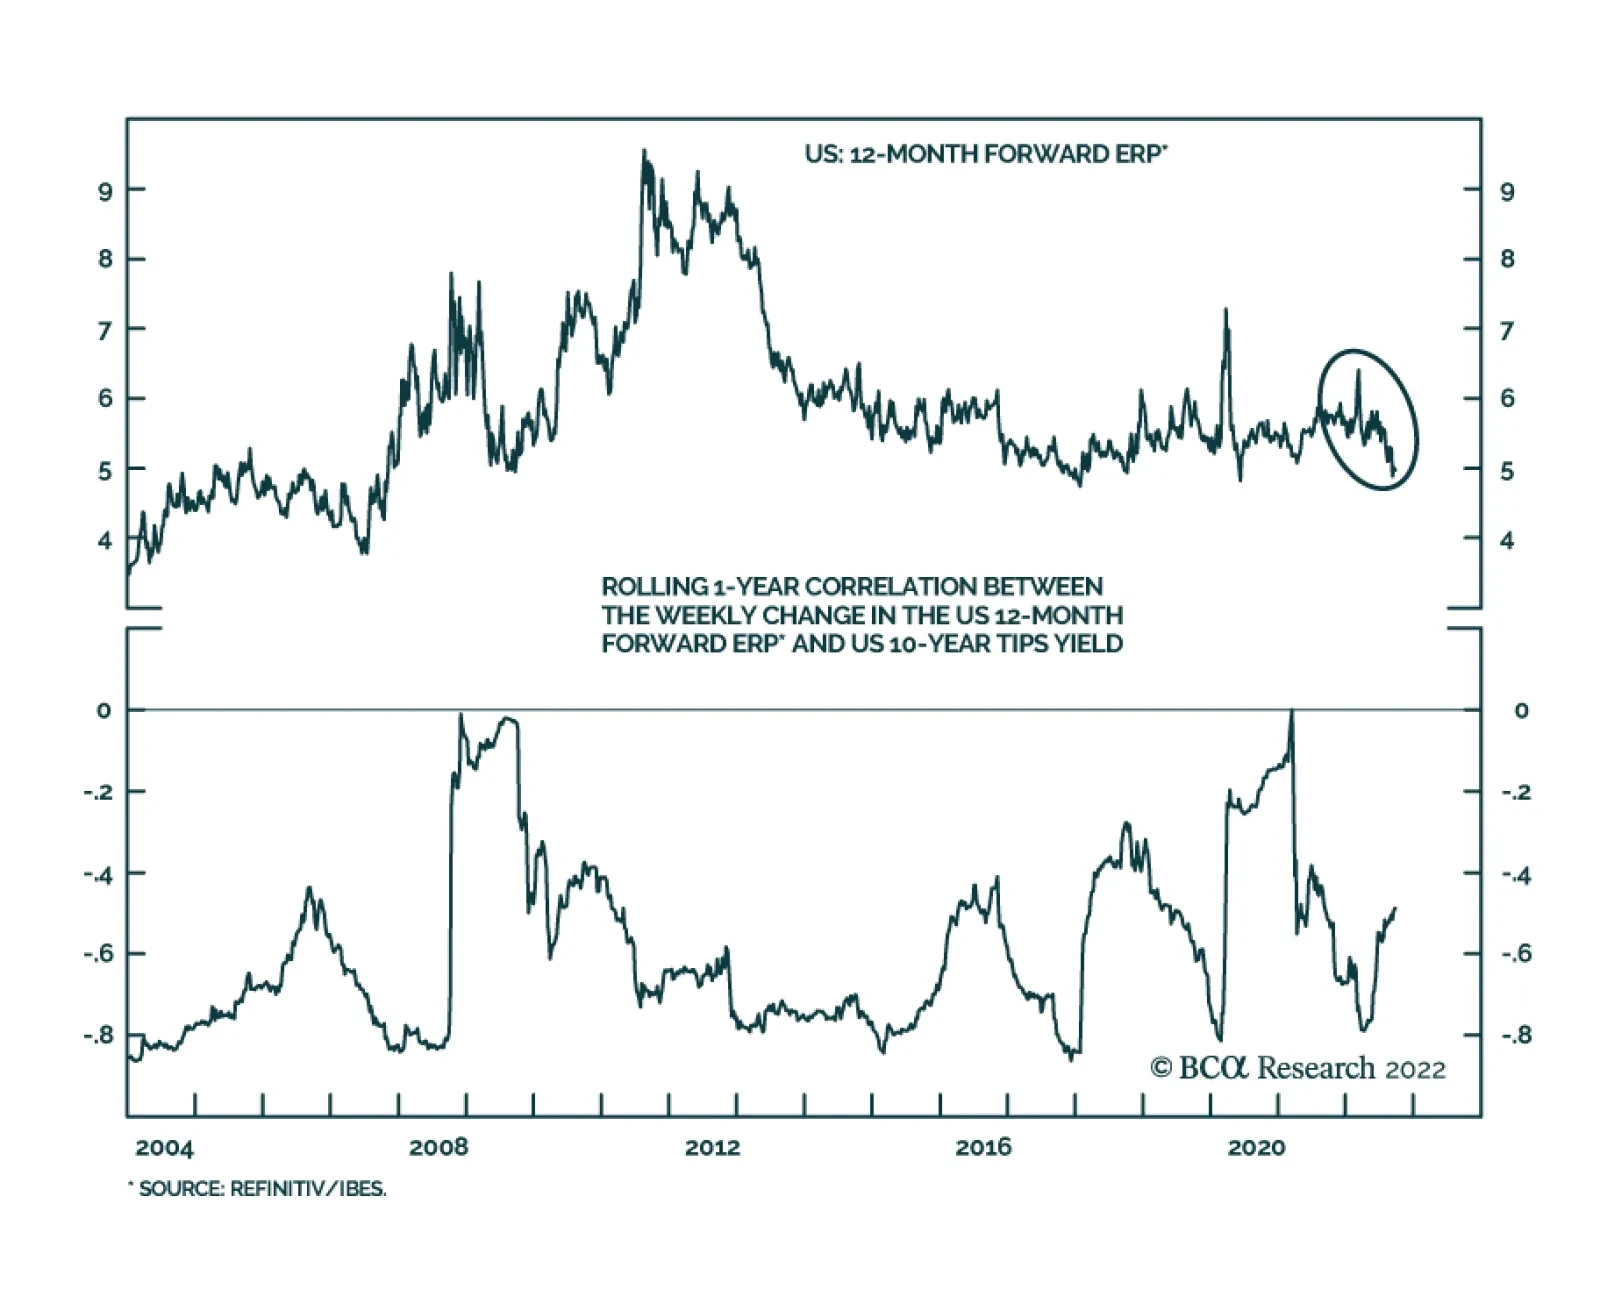
The S&P 500 forward equity risk premium – measured as the difference between the S&P 500 12-month forward earnings yield (the inverse of the forward multiple) and the 10-year TIPS yield – reached its peak in March and has since rolled over. …